Space Group Symmetry of BaFe2Se3:
ab initio-Experiment Phonon Study
Abstract
This paper presents a study of the structure dynamics in . We combined first-principle calculations, infrared measurements and a thorough symmetry analysis. Our study confirms that cannot be the space group of , even at room temperature. The phonons assignment requires to be the space group, not only in the magnetic phase, but also in the paramagnetic phase at room temperature. This is due to a strong coupling between a short range spin-order along the ladders, and the lattice degrees of freedom associated with the Fe-Fe bond length. This coupling induces a change in the bond-length pattern from an alternated trapezoidal one (as in ) to an alternated small/large rectangular one. Out of the two patterns, only the latter is fully compatible with the observed block-type magnetic structure. Finally, we propose a complete symmetry analysis of the phase diagram in the 0-600 K range.
I Introduction
Strong quantum entanglement of electron wave-functions, also called strong electronic correlation, is at the origin of many remarkable properties. This is the case, for instance, with superconductivity, colossal magneto-resistance, or magneto-electric coupling. Since electronic correlations are intrinsic quantum mechanical effects, the related properties are primarily expected at low temperatures. However, a few families of compounds exhibit exceptionally high working temperatures. An example is given by the cuprates family Supra_Muller_86 with its record superconducting transition temperature of 164 K under 45 GPa pressure Cu-164K-pression-Gao1994 , and 133 K at ambient pressure Cu-133K-Hg-Schilling1993 . Another family, in which high-temperature superconductivity was found Pnicture-decouverte-Takahashi2008 , is the iron-based pnictides family. In this family the inherent multi-orbital character adds a lot of complexity, therefore, pnictides have been the subject of numerous studies since their discovery in 2003 Pnicture-decouverte-2006 . In addition to their superconducting properties, some of the pnictides exhibit multiferroic properties FE-Zhang2016 (a state with at least two coexisting/coupled ferroic/antiferroic orders), thus increasing their interest for the community.
In the last decade, a lot of research effort has been devoted to multiferroicity, and more specifically to magneto-electric multiferroics. Due to the coupled nature of their electrical and magnetic orders, magneto-electric (ME) compounds offer the possibility to control their magnetic properties by applying a simple voltage, or control their polarization or dielectric constant by applying a magnetic field. Hence, they are highly promising for new kinds of electronic devices.
Among the ME compounds, is one of the few ME materials exhibiting both a magnetic order and a polarization at high temperatures. Indeed, below the Néel temperature () a long-range block-type antiferromagnetic ordering sets in Liu_2019 ; Krzton_Maziopa ; Popovic ; Caron2011 ; Gao . is reported in a quite large temperature range, from to , according to the different authors. Gao et al. have attributed the discrepancies to different stoichiometric ratios in grown crystals Gao . Additionally to the large , shows quasi-one-dimensional superconductivity under pressure takahashi_pressure_2015 .
X-ray experiments first proposed the non-polar space group Krzton_Maziopa for . A few years later, Dong et al. Dagotto2014 theoretically predicted that the observed block-type magnetic order should induce a polar symmetry lowering, due to exchange-striction effects. Weak intensity was later observed on the , peaks of the X-ray diffraction pattern, that are forbidden in the group Zheng . Instead of , the polar space group was proposed for ’s room temperature structure Zheng . Below , a further symmetry lowering was observed and assigned to a transition from to Zheng .
a)
 b)
b)
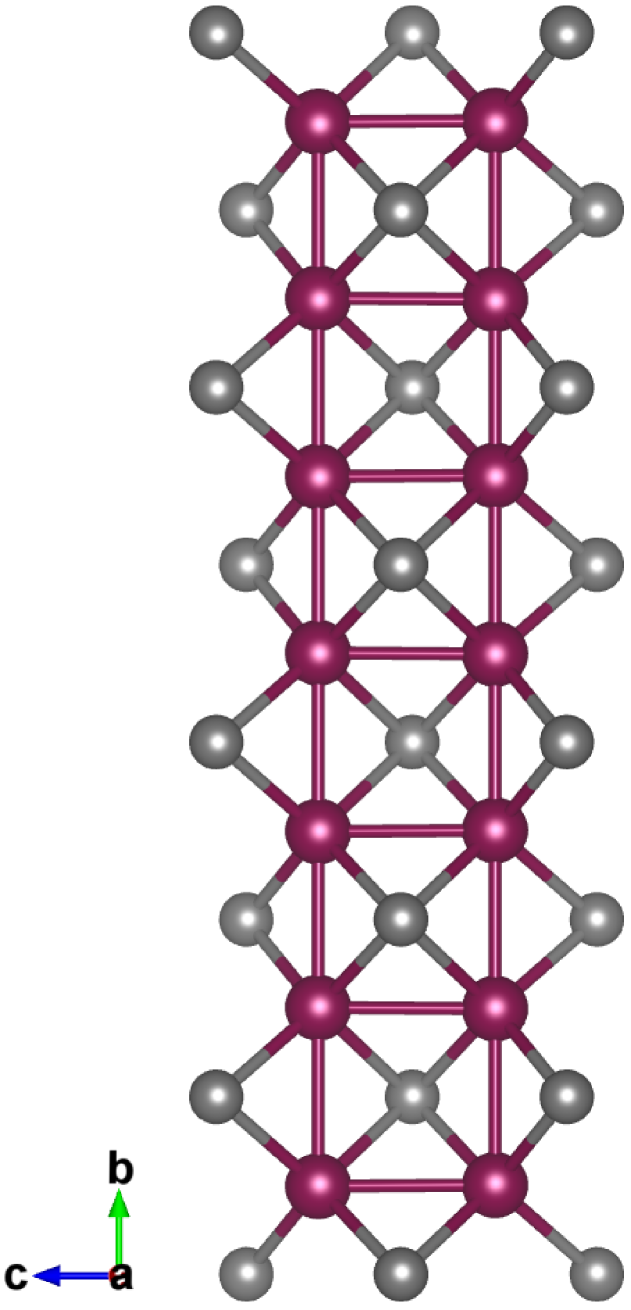
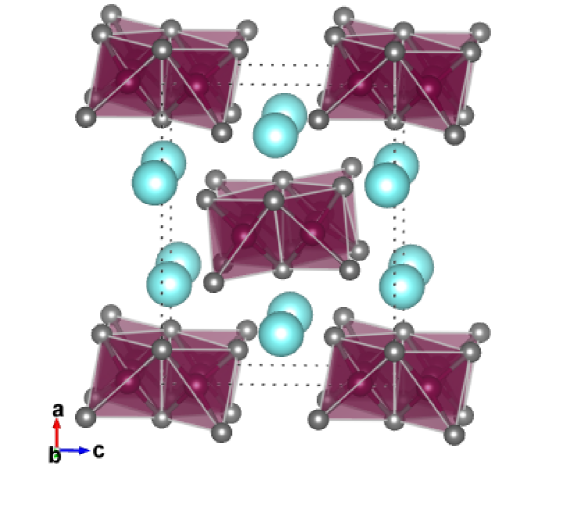
The compound presents a quasi-one-dimensional ladder geometry coherent with its superconducting properties (see Fig. 1). The iron atoms are in a tetrahedral environment. These edge-sharing tetrahedra form two-legs ladders along the direction (standard setting). Each unit cell contains two ladders (one at the center and one at the corners of the unit cell) separated by barium atoms. In each unit cell, there are two Fe atoms per chain along the ladder direction, and thus two types of Fe–Fe bonds: one within the unit cell and one between cells. While in the group there is only one independent Fe site, in , the two chains in a ladder are associated to independent Fe sites, whilst the two ladders in the unit cell remain symmetry related. This remaining symmetry is however lifted at the magnetic-ordering transition with the to symmetry lowering. Another important difference between the , and or structures, is the Fe–Fe bond alternation along the ladder direction. Whereas the space group symmetry imposes that a long bond faces a short one in the ladders, thus building alternated trapezoidal blocks along the ladder direction, in the lower symmetry groups, this constraint is lifted and the / structures Zheng posses long (short) bonds that are at the same level along the ladder direction (see Fig. 5). The latter geometry is in good agreement with the block magnetic order seen in neutron scattering measurements Krzton_Maziopa ; Nambu2012 . In this respect, is different from most multiferroics. Prominent is that is rather ferrielectric than ferroelectric, with a strong polarization in each ladder, mostly canceling out between the ladders. Its fully ferroelectric state has an energy predicted only slightly higher than the ferrielectric one and holds a giant improper polarization predicted to be , while the ferrielectric one was predicted to be Dagotto2014 and experimentally estimated around Du2020 .
In this paper we present a lattice dynamic study, combining experimental infrared (IR) spectroscopy studies with first principle density-functional theory (DFT) calculations. It is well known that phonon spectra are of crucial importance in multiferroic systems. In particular, they are often much more efficient than diffraction methods to reveal weak symmetry breaking and to distinguish between space groups. The next section will detail both experimental and numerical methods. Section III will be devoted to the infrared measurements, and section IV to DFT results and discussion.
II Methods
II.1 Experimental
The experimental phonon modes were measured on high quality single-crystals. Infrared spectroscopy measurements were carried out on the AILES beamline of the SOLEIL synchrotron, with a Bruker IFS125 Michelson interferometer Roy2006 equipped with a closed circle He-gas cryostat, a 4.2 K bolometer, and a 6 m beam splitter for a resolution of 2 cm-1. The synchrotron radiation beam was linearly polarized thanks to polyethylene polarizers. Two pieces of the crystal used in Ref. Zheng, were pre-aligned, in order to put the electric and magnetic fields (labeled ) on the incident beam, in the and crystallographic directions. For each crystal, the reflectivity was recorded for several temperatures from 10 to 300 K. The absolute reflectivity of the sample was obtained by using as reference the same gold-coated sample obtained by in situ gold coating evaporation technique. As a consequence, each reflectivity spectra is the ratio between the reflected intensity on the sample and the reflectivity from the gold deposited on the sample surface.
II.2 Theoretical
The phonon modes were calculated using DFT, after a full geometry optimization within the constraints of a given space group. We used the CRYSTAL code crystal17-1 ; crystal17-2 which fully implements the 230 space group symmetries. Therefore, it can decipher the phonons spectra issued from different space groups. This code also offers the advantage to use atomic Gaussian basis sets and hence enables the use of hybrid functionals with nearly no additional computational costs. Since our system is strongly correlated and presents metallic, semiconducting and magnetically ordered phases Liu_2019 , it is important to use a hybrid functional in order to describe at the best the system’s electronic structure. For this purpose we use the B3LYP functional Becke1 ; Stephens .
The atomic basis sets were chosen as all-electrons, valence 3+p basis set for the Fe and Se atoms heyd , a relativistic core pseudo-potential of the Stuttgart group PseudoR13 for the Ba atom, and the associated basis set adapted to solid-state calculations heyd . Since the unit cell does not change in the different groups, we used a Monkhorst-Pack -grids ( axes) for all calculations in the single unit cell, and an equivalent grid spacing for the calculations in the double unit cell.
The phonon modes were computed at the center of the Brillouin zone using the harmonic approximation. We performed two types of calculations: calculations without spin polarization within a single unit cell, and calculations with spin polarization along the chains – propagation vector in the axes – within a double unit cell. The experimental propagation vector is Krzton_Maziopa ; Nambu2012 . Hence, to completely account for the magnetic order the calculation should be done in a supercell. Unfortunately, such a unit cell is too large for performing geometry optimization and phonons calculations with our current computer resources. We thus opted for a feasible compromise that sets properly the magnetic order within the ladders, as it is associated with the largest magnetic integrals of the system.
III Infrared measurements
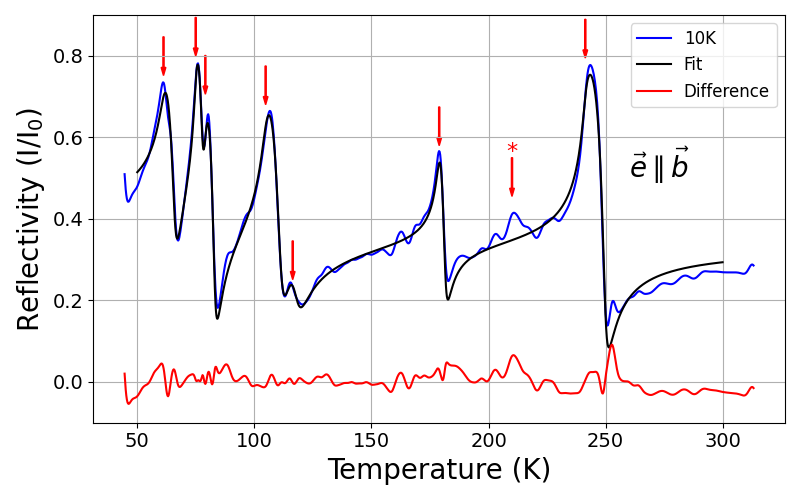
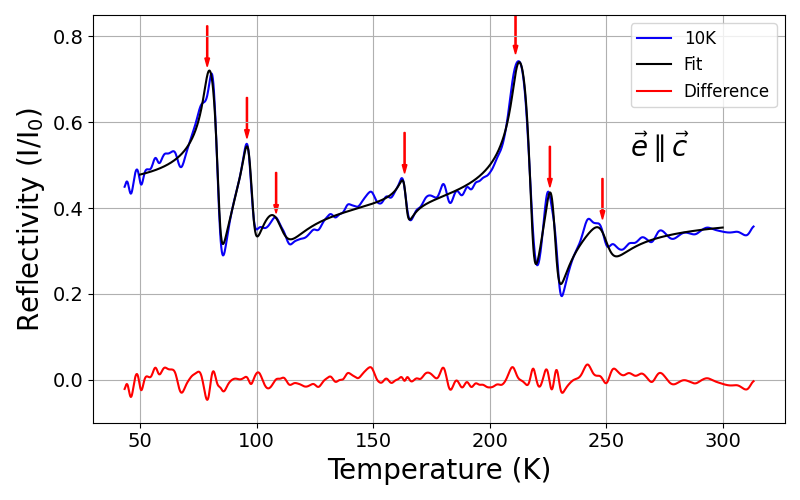
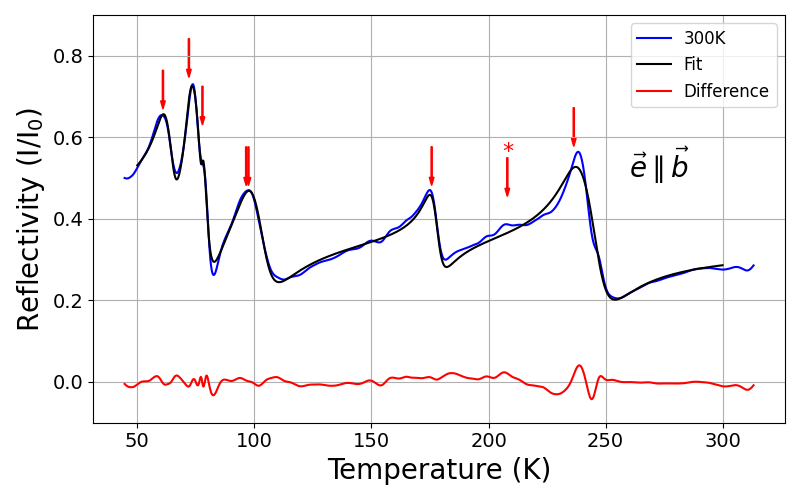
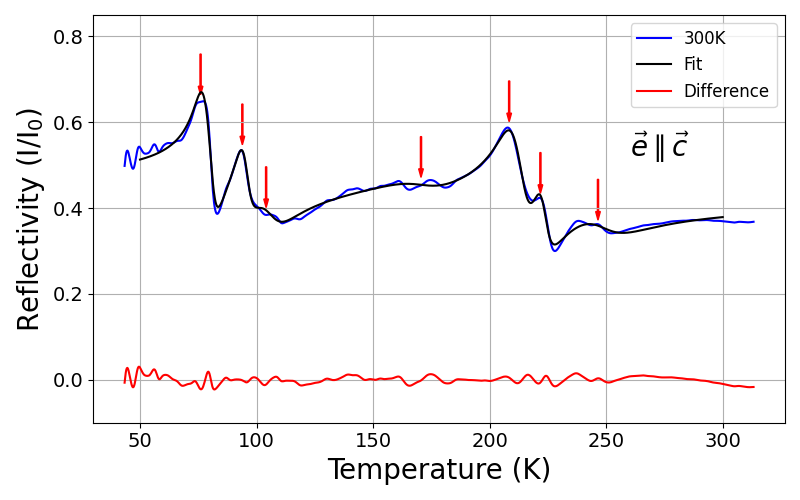
The reflectivity measurements of between 10 K and 300 K were performed at quasi-normal incidence, with the electric field along the b-axis and c-axis in the standard setting. Figure 2a and b displays the same IR measurements at 10 K for these two configurations. As we can see, eight phonons modes are visible when the field is along and seven when the field is along . The number of observed modes is unchanged between 300 K (see Fig. 3) and 10 K, despite a large broadening at high temperature, making some phonons difficult to accurately fit. Experimental phonons frequencies were obtained by fitting the data using the usual Drude-Lorentz (DL) model for the dielectric function of insulating materials. The dielectric function is thus expressed as the sum of harmonic oscillators:
| (1) |
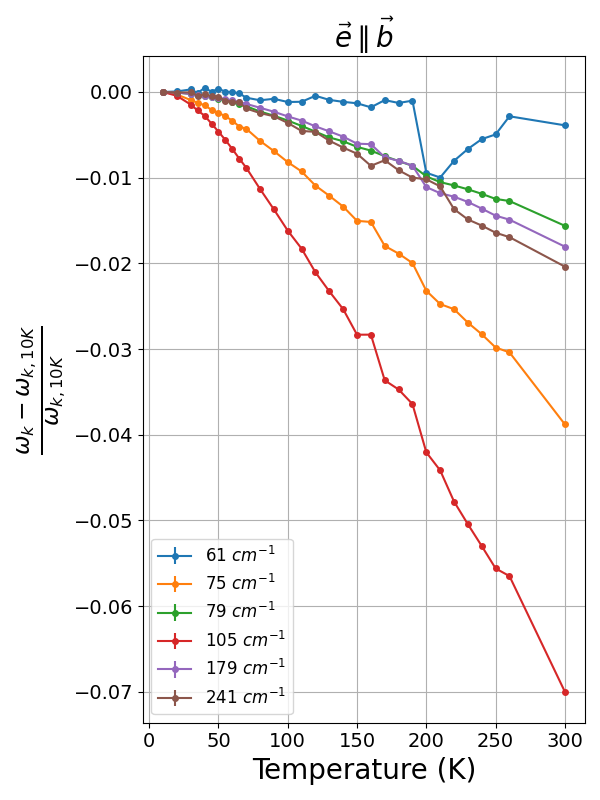
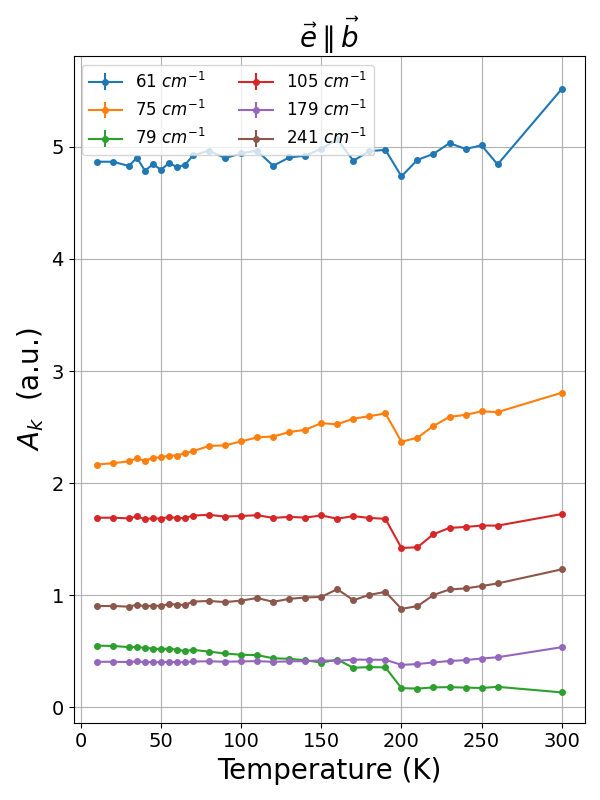
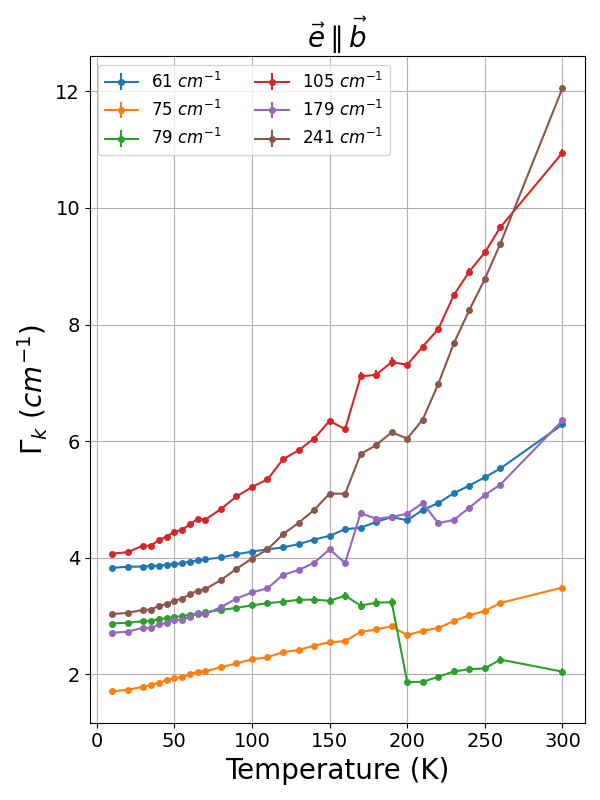
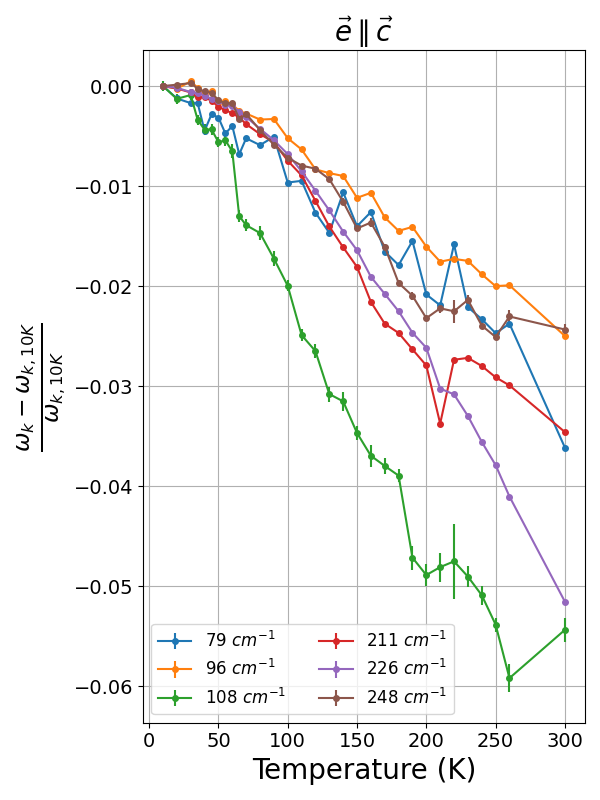
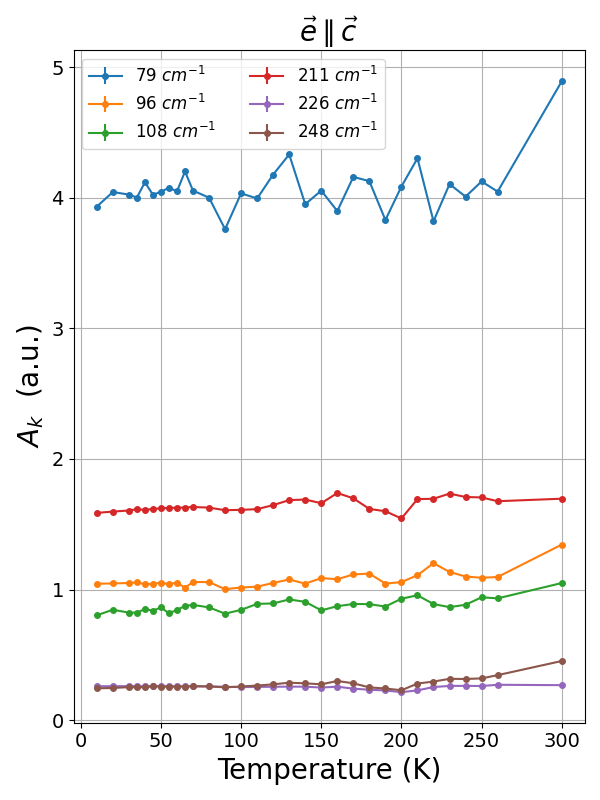
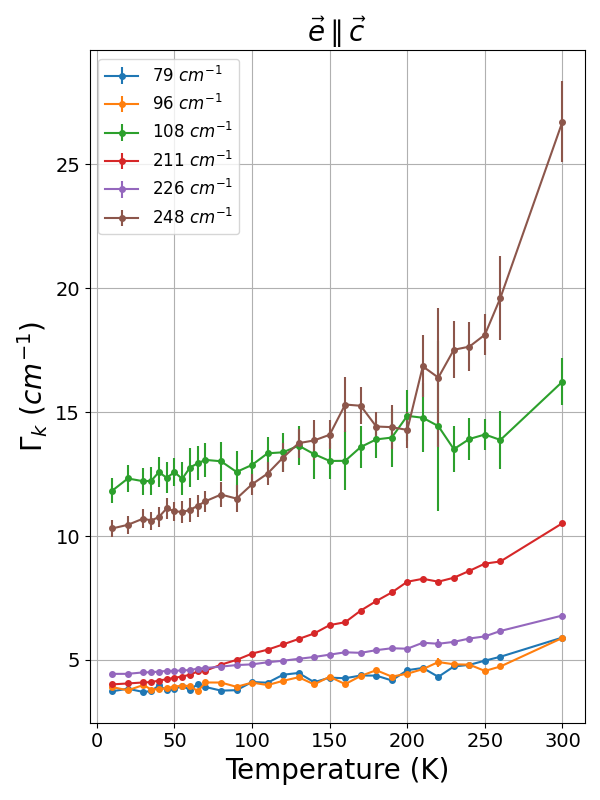
where is the dielectric constant at infinite frequency, , and the resonant frequency, the amplitude and energy-width of the harmonic oscillator. The resulting phonon frequencies are reported for both extreme temperatures (10 K and 300 K) in Table 1, in order to compare them to DFT results. The temperature dependence of the three parameters, , and are represented for both polarization configurations in Fig. 4. Some of the phonons are too dampened and/or not enough intense to follow accurately their position, width and amplitude as function of temperature. This is the case for () and (). From the evolution of their energies, we can see that all phonons undergo a hardening with decreasing temperature. More interesting, we can observe a quasi-systematic anomaly around 200 K for each of these parameters for these phonons. For example, nearly all phonons measured for display a drop in amplitude around 200 K, concomitant to a change in linewidth evolution . A shift of the energy is also observed at the same temperature for the and phonons. For , mainly two phonons display a similar anomaly at 200 K in the three parameters , and , namely the and ones. The temperature, where the mentioned phonons behavior changes, corresponds to the Néel temperature measured by neutron diffraction Zheng on a sample originating from the very same batch as our sample. This observation strongly suggest a significant spin-phonon coupling in this system.
a)
b)
a)
b)
| 10 K | 300 K | 10 K | 300 K |
|---|---|---|---|
| 61 | 60 | 79 | 76 |
| 75 | 72 | 96 | 94 |
| 79 | 78 | 108 | 104 |
| 105 | 97 | 163 | - |
| 116 | - | 211 | 208 |
| 179 | 176 | 226 | 222 |
| 210* | 207* | 248 | 246 |
| 241 | 236 | ||
IV DFT calculations and discussion
We first optimized the structure and computed the phonons spectra without spin polarization, as spins usually induce only small shifts (a few ) of the phonons frequencies. The calculations were performed in the , and groups. The optimized geometries can be found in the supplementary material. All three calculations yielded similar energies, within DFT error-bars. Thus, one can not discriminate between them on this criterium. All optimized geometries agree well with the experimental single crystal X-ray diffraction of Ref. Krzton_Maziopa, . The comparison (using the amplimode code amplimode2009 ; amplimode2010 ) of the , and calculations, with the room temperature experimental geometry of Ref. Krzton_Maziopa, , yields similar degrees of lattice distortion (0.0027) for the three structures and measures of compatibility of 0.028 ( and ) and 0.064 ().
IV.1 Symmetry Analysis
69 optical phonon modes and 3 acoustic ones are expected at the point. Symmetry analysis indicates that the infrared phonons observed with the field along the direction should belong to the irreducible representation (irrep) in the group, and to the irrep when the field is set along the direction (see character tables in the supplementary material).
The group/subgroup relationships between the different irreps of the , and groups are reported on table 2. They will be further used for the phonons assignments.
IV.2 The Space Group
Out of the 69 optical phonon modes in the group, 36 modes are Raman active, 26 modes are IR active. The irrep distribution is as follows
The tables of the computed phonons modes can be found in the supplementary material.
In this group, the number of measured modes exceeds the number of predicted ones for different irreps. Seven modes were indeed measured in the irrep at 300 K (eight at 10 K), while only six are predicted by the symmetry analysis. In addition, some of the modes cannot be assigned due to the lack of computed modes in the proper energy range. In total, there are two , three , two and one modes that cannot be assigned within the group. Hence, in agreement with our previous X-ray diffraction work Zheng , the lattice dynamics clearly excludes the group, even in the paramagnetic phase.
IV.3 The Space Group
Out of the 69 optical phonon modes expected in the group, all are Raman active and 55 IR active. Their distribution into the group’s irreps is the following
Tables LABEL:tab:Pmn21_res and 4 display the computed phonons modes and their best assignment to the measured modes. The IR modes stem from our measurements at 300 K, while the experimental Raman modes are taken from Ref. Popovic, at 300 K.
| DFT | Raman Popovic | IR 300 K | ||
|---|---|---|---|---|
| Irrep | 300 K | |||
| B1 | ||||
| A1 | ||||
| A2 | ||||
| A1 | ||||
| B1 | ||||
| B1 | ||||
| A1 | ||||
| B1 | ||||
| B2 | ||||
| A1 | ||||
| A2 | ||||
| A1 | ||||
| A1 | ||||
| A2 | ||||
| B1 | ||||
| B2 | ||||
| B1 | ||||
| A2 | ||||
| B1 | ||||
| A1 | ||||
| B2 | ||||
| A1 | ||||
| B1 | ||||
| B2 | ||||
| A2 | ||||
| A2 | ||||
| B2 | ||||
| A1 | ||||
| A1 | ||||
| B1 | ||||
| B1 | ||||
| A1 | ||||
| B2 | ||||
| A2 | ||||
| B1 | ||||
| A1 | ||||
| B1 | ||||
| A1 | ||||
| B1 | ||||
| A1 | ||||
| B1 | ||||
| B2 | ||||
| A2 | ||||
| B1 | ||||
| B2 | ||||
| A2 | ||||
| A1 | ||||
| A2 | ||||
| B2 | ||||
| A1 | ||||
| B1 | ||||
| A2 | ||||
| B2 | ||||
| A1 | ||||
| B1 | ||||
| B2 | ||||
| A2 | ||||
| B2 | ||||
| A2 | ||||
| A2 | ||||
| B2 | ||||
| A1 | ||||
| A1 | ||||
| B1 | ||||
| B1 | ||||
| B1 | ||||
| A1 | ||||
| A1 | ||||
| B1 | ||||
| Irrep | Raman Popovic | IR 300 K | |
|---|---|---|---|
| 300 K | |||
| A1 | |||
| A1 | |||
| B2 | |||
| B2 | |||
One sees immediately that all Raman modes can be assigned with a good accuracy in the group, with an average error of . For the IR modes two modes are problematic along each direction.
Along the direction, the modes at and can only be assigned to the computed modes with quite large error bars (namely and ). Such error bars are at the extreme limit of DFT acceptable error bars, and should attract our attention. In addition, the mode at has to be assigned to the same computed mode as the mode seen in Raman scattering at 222.8 cm-1, which is nearly 16 cm-1 away. Even if one accept the large differences between the computed and experimental IR frequencies, the difference between the Raman and IR measurements seems too large to be accounted by experimental error bars.
Nevertheless, the main problem occurs for infrared modes when the electric field is set along the direction. Indeed, the two most intense modes (see Fig. 3b), at 208 cm-1 and 222 cm-1 are impossible to assign as there are not any modes in the range –. Even if the mode at 208 cm-1 was assigned to the computed mode at , with an error of , this mode was already assigned to a Raman mode at . Once more, the discrepancy between the Raman and IR measured modes is too large to be accounted by experimental error bars.
Prior to fully exclude the group, we will have a look at the results in the group, since recent single crystal X-ray diffraction yielded to be the actual space group in the low temperature magnetic phase Zheng .
IV.4 The group
The 69 optical phonon modes of the Pm space group are distributed into the following irreps
All modes are active in Raman and IR.
The table displaying the computed phonons modes, as well as their best assignment to our IR measurements at 10 K, and to the measured 20 K Raman modes from Ref. Popovic, , is provided in supplementary material. Similar to the case, all Raman modes can be easily assigned. This is also the case for the IR modes when the field is along the direction. The respective average errors for the Raman and IR are respectively weaker than 5 cm-1 and 6.4 cm-1.
Most of the infrared modes with the field along can also be assigned with small errors. However, as for the group, the two most intense modes (at and ) cannot be properly assigned. Indeed, the only possibility for the mode at would be to assign it to the same computed mode as the mode seen at in Raman scattering. However a frequency difference between Raman and infrared measurements seems quite unlikely. Regarding the mode at , it seems impossible to assign it without a significant error (), as there are no computed modes of the proper symmetry in this energy range.
Looking at the displacement vectors associated with the phonons modes in the – range, we see that they are dominated by Fe atoms displacements. As reported in the literature, neutron pair-distribution functions clearly show a large magneto-elastic coupling, with Fe atoms displacements at the inset of the antiferromagnetic (AFM) order Caron2011 . In fact, while the long-range order takes place between 230 K and 255 K according to the authors, short-range magnetic correlations (with a correlation length of ) are observed from neutrons diffuse scattering Caron2011 , even at room temperature.
As a consequence one may think that, unlike in most systems where the magnetic structure only shift the phonons modes by a few , in the magnetic order could have a strong effect on the structure dynamics.
IV.5 Importance of in-ladder magnetic order
The magnetic propagation vector in the system is . Computing structure dynamics using the published Liu_2019 ; Krzton_Maziopa ; Popovic ; Caron2011 magnetic order would thus require to use a super-cell of eight unit cells. As stated before, unfortunately, such a large calculation is beyond our present possibilities. The magnetic structure is however highly anisotropic, with much larger magnetic couplings within the ladders than between them. One can thus expect that 1) it is the intra-ladder magnetic order that is responsible for the magneto-lattice coupling, and 2) that this effect may also be present in the paramagnetic phase. We therefore recomputed the phonons modes, both in the and groups, using a double super-cell (), and spin-polarized calculations with the experimental spin ordering along the ladders direction ().
The first consequence was, as expected, a large energy stabilization ( for the group and for the group) compared to the non spin-polarized calculations. The energy difference between the and groups remains, however, non significant (). Looking at the geometries, one sees that the spin-polarized optimized geometries differ from the non spin-polarized ones, as far as the Fe–Fe distances along the ladders are concerned.
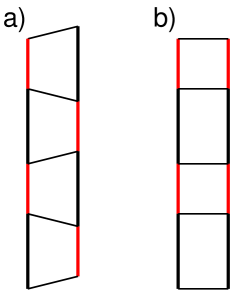
The non spin-polarized geometries are all similar to the experimental one. Indeed, in all of them we find alternated trapezoidal blocks, as a result of the Fe–Fe distances alternation along the ladders (see Fig. 5 a)). In contrast to this, the spin-polarized optimized geometries present an alternation between small and large rectangular blocks (see Fig. 5 b)), as in the experimental and structures Zheng .
This feature originates from the spin-ordering along the ladders. This can be checked by re-optimizing the geometry within a non spin-polarized calculation, starting from the spin-polarized one. In such calculations the resulting bond lengths exhibit again trapezoidal blocks (Fig. 5 a).
Table LABEL:tab:Pmn21_spins and 6 report the spin-polarized phonons calculations at the point, in the group. As we worked in a double unit cell, CRYSTAL provides both the point and zone-border M-point phonons. We thus wrote a small code to identify the former, as well as their irrep. For this purpose, we used the usual group-symmetry projection operator on an irrep
where is the order of the group , any symmetry operation belonging to and the characters. In the following tables we will only present the point phonons, as they are the only ones seen in Raman or infrared measurements.
| DFT | Raman Popovic | IR 300 K | ||
|---|---|---|---|---|
| Irrep | 300 K | |||
| A2 | ||||
| B1 | ||||
| A1 | ||||
| A1 | ||||
| B1 | ||||
| A1 | ||||
| B2 | ||||
| A2 | ||||
| B1 | ||||
| A2 | ||||
| B1 | ||||
| B2 | ||||
| A1 | ||||
| A2 | ||||
| B2 | ||||
| A1 | ||||
| B1 | ||||
| A1 | ||||
| B1 | ||||
| A1 | ||||
| B1 | ||||
| B1 | ||||
| A1 | ||||
| B2 | ||||
| A2 | ||||
| A2 | ||||
| B2 | ||||
| A1 | ||||
| A2 | ||||
| B2 | ||||
| A1 | ||||
| B1 | ||||
| B1 | ||||
| A1 | ||||
| B1 | ||||
| A1 | ||||
| B1 | ||||
| A1 | ||||
| B2 | ||||
| B1 | ||||
| A2 | ||||
| B1 | ||||
| A1 | ||||
| A2 | ||||
| B2 | ||||
| B2 | ||||
| A2 | ||||
| B1 | ||||
| A2 | ||||
| B2 | ||||
| A1 | ||||
| B2 | ||||
| A2 | ||||
| B2 | ||||
| A2 | ||||
| A1 | ||||
| B2 | ||||
| B1 | ||||
| A2 | ||||
| A1 | ||||
| B1 | ||||
| B1 | ||||
| A1 | ||||
| B1 | ||||
| A1 | ||||
| A1 | ||||
| B1 | ||||
| A1 | ||||
| B1 | ||||
| Irrep | Raman Popovic | IR 300 K | |
|---|---|---|---|
| 300 K | |||
| B2 | |||
| A1 | |||
| A1 | |||
As can be seen, there still are three infrared phonons modes that cannot be assigned with the computed frequencies. The mode at 78 cm-1 and the A1 modes at 94 cm-1 and 208 cm-1. In fact, the two A1 modes could be assigned to computed ones with reasonable errors. However, as previously, there are Raman modes already associated with these frequencies (namely at 88 cm-1 and 196 cm-1) and the differences between the experimental modes are too large to be accounted for experimental error bars. The space group is thus unlikely to be space group, even at 300 K.
Let us now check the group. Table LABEL:tab:Pm_spins reports the spin-polarized phonons calculations at the point, in the group.
| DFT | Raman Popovic | IR 300 K | IR 10 K | ||||
|---|---|---|---|---|---|---|---|
| Irrep | 300 K | 20 K | |||||
| B | |||||||
| A | |||||||
| A | |||||||
| A | |||||||
| A | |||||||
| A | |||||||
| B | |||||||
| B | |||||||
| A | |||||||
| B | |||||||
| A | |||||||
| B | |||||||
| A | |||||||
| B | |||||||
| A | |||||||
| B | |||||||
| A | |||||||
| A | |||||||
| A | |||||||
| A | |||||||
| A | |||||||
| A | |||||||
| A | |||||||
| B | |||||||
| B | |||||||
| B | |||||||
| B | |||||||
| B | |||||||
| A | |||||||
| B | |||||||
| A | |||||||
| A | |||||||
| A | |||||||
| A | |||||||
| A | |||||||
| A | |||||||
| A | |||||||
| A | |||||||
| B | |||||||
| A | |||||||
| B | |||||||
| A | |||||||
| A | |||||||
| B | |||||||
| B | |||||||
| B | |||||||
| B | |||||||
| B | |||||||
| B | |||||||
| A | |||||||
| A | |||||||
| B | |||||||
| B | |||||||
| B | |||||||
| B | |||||||
| A | |||||||
| B | |||||||
| A | |||||||
| B | |||||||
| A | |||||||
| A | |||||||
| A | |||||||
| A | |||||||
| A | |||||||
| A | |||||||
| A | |||||||
| A | |||||||
| A | |||||||
| A | |||||||
As can be seen in table LABEL:tab:Pm_spins, all experimental Raman and infrared modes can now be easily assigned to the theoretical ones. The average error on the Raman modes at 20 K and 300 K is smaller than 4 cm-1, while it is smaller than 6 cm-1 for the infrared modes measured at 300 K and 5 cm-1 for the infrared modes measured at 10 K. From these results one can thus confirm that the space group of is in the magnetic phase, and infer it should also be and not or at 300 K, in the paramagnetic phase.
V Conclusion
In the present paper we propose an experimental and theoretical study of the structure dynamics of . The comparison of our infrared measurements and computed phonons frequencies in the , and space groups shows that is the only possible space group, not only in the low temperature magnetic phase, but also on the high temperature paramagnetic phase.
Our calculations reveals that the magnetic order within the ladders plays a crucial role, even in the paramagnetic phase. This is in agreement with neutrons diffuse scattering experiments, that support the existence of a short range magnetic order in the paramagnetic phase, with an approximate correlation length of 35Å Caron2011 . In fact, both the optimized structure and the phonons modes strongly differ in some key-points, when the magnetic order along the ladders is taken into account in the calculations. The first difference resides in the Fe-Fe distances along the ladder legs. Indeed, in a non spin-polarized calculation, the Fe-Fe bond lengths along the ladders exhibit a short/long long/short trapezoidal pattern (see figure 5a)); whereas in a spin-polarized calculation, the spin-ordering along the ladders induces a complete change of the Fe-Fe bond lengths pattern, with an alternation of large and small rectangular blocks (see figure 5b)). The latter blocks pattern is in good agreement with our X-ray diffraction measurements of Ref. Zheng, , while the trapezoidal pattern is in good agreement with the X-ray structure from Ref Caron2011, . It is also of crucial importance to note that the rectangular blocks pattern is fully compatible with the block antiferromagnetic structure, while the trapezoidal pattern is not. Indeed, if the short/long Fe-Fe bonds are associated to AFM/FM exchange integrals, the experimental magnetic ordering seen along the ladders becomes obvious. The determination of the magnetic integrals associated with the Pm structure should thus be our next piece of work. This resolves the puzzle of the crystal structure incompatibility with the magnetic structure, often discussed in the literature.
At 660 K undergoes a to phase transition Svitlyk2013 , followed by another transition at 425 K. This transition was shown, by scanning transmission electron microscopy, to be associated with an in-ladder tetramerisation, a differentiation between the two ladders of the unit cell and a room temperature polarization Du2020 . Putting these experimental results into perspective with our structure dynamic study, one can built a coherent picture for the phase diagram. After the 660 K phase transition from the group to , the 425 K phase transition can be associated to a to symmetry lowering, induced by the inset of the short-range magnetic correlations within the ladders. Such a transition would be in agreement with the inset of the tetramerisation, the polarization and the release of the symmetry relationship between the two ladders. It would also account for the observed strong coupling between the lattice and the short-range magnetic order.
VI Acknowledgment
The theoreticians among the authors thank the IDRIS (project n∘91842) and CRIANN (project n∘2007013) computer centers on which the calculations presented in this paper have been done. The experimental work was financially supported by the ANR COCOM 20-CE30-0029 and by the CSC scholarship (No. 201806830111). We also thank SOLEIL for synchrotron beam time (Proposal 20211300).
References
- (1) Bednorz J G and Müller K A 1986 Z. Phys. 64 189
- (2) Gao L, Xue Y Y, Chen F, Xiong Q, Meng R L, Ramirez D, Chu C W, Eggert J H and Mao H K 1994 Phys. Rev. B 50(6) 4260–4263
- (3) Schilling A, Cantoni M, Guo J D and Ott H R 1993 Nature 363 56–58 ISSN 1476-4687
- (4) Takahashi H, Igawa K, Arii K, Kamihara Y, Hirano M and Hosono H 2008 Nature 453 376–378 ISSN 1476-4687
- (5) Kamihara Y, Hiramatsu H, Hirano M, Kawamura R, Yanagi H, Kamiya T and Hosono H 2006 Journal of the American Chemical Society 128 10012–10013 ISSN 0002-7863 doi: 10.1021/ja063355c
- (6) Zhang Y, Zhang H, Weng Y, Lin L, Yao X and Dong S 2016 Physica Status Solidi 10 757
- (7) Liu X, Ma C, Hou C, Chen Q, Sinclair R, Zhou H, Yin Y and Li X 2019 EPL (Europhysics Letters) 126 27005
- (8) Krzton-Maziopa A, Pomjakushina E, Pomjakushin V, Sheptyakov D, Chernyshov D, Svitlyk V and Conder K 2012 Journal of Physics: Condensed Matter 24 059502
- (9) Popović Z V, Šćepanović M, Lazarević N, Opačić M, Radonjić M M, Tanasković D, Lei H and Petrovic C 2015 Phys. Rev. B 91(6) 064303
- (10) Caron J M, Neilson J R, Miller D C, Llobet A and McQueen T M 11/16/ 2011 Physical Review B 84 180409 ISSN 1098-0121 1550-235X
- (11) Gao J, Teng Y, Liu W, Chen S, Tong W, Li M, Zhao X and Liu X 2017 RSC Adv. 7(48) 30433–30438
- (12) Takahashi H, Sugimoto A, Nambu Y, Yamauchi T, Hirata Y, Kawakami T, Avdeev M, Matsubayashi K, Du F, Kawashima C, Soeda H, Nakano S, Uwatoko Y, Ueda Y, Sato T J and Ohgushi K 2015 Nature Materials 1008
- (13) Dong S, Liu J M and Dagotto E 2014 Phys Rev Lett 113 187204 ISSN 1079-7114 (Electronic) 0031-9007 (Linking)
- (14) Zheng W, Balédent V, Lepetit M B, Retailleau P, Elslande E V, Pasquier C R, Auban-Senzier P, Forget A, Colson D and Foury-Leylekian P 2020 Phys. Rev. B 101(2) 020101
- (15) Nambu Y, Ohgushi K, Suzuki S, Du F, Avdeev M, Uwatoko Y, Munakata K, Fukazawa H, Chi S, Ueda Y and Sato T J 02/22/ 2012 Physical Review B 85 064413
- (16) Du K, Guo L, Peng J, Chen X, Zhou Z N, Zhang Y, Zheng T, Liang Y P, Lu J P, Ni Z H, Wang S S, Van Tendeloo G, Zhang Z, Dong S and Tian H 2020 npj Quantum Materials 5 49 ISSN 2397-4648
- (17) Roy P, Rouzières M, Qi Z and Chubar O 2006 Infrared Physics & Technology 49 139–146 ISSN 1350-4495 international Workshop on Infrared Microscopy and Spectroscopy with Accelerator-Based Sources
- (18) Dovesi R, Erba A, Orlando R, Zicovich-Wilson C M, Civalleri B, Maschio L, Rérat M, Casassa S, Baima J, Salustro S and Kirtman B 2018 WIREs Computational Molecular Science 8 e1360
- (19) Dovesi R, Saunders V R, Roetti C, Orlando R, Zicovich-Wilson C M, Pascale F, Civalleri B, Doll K, Harrison N M, Bush I J, D’Arco P, Llunell M, Causà M, Noël Y, Maschio L, Erba A, Rérat M and Casassa S 2017 Crystal17 user’s manual university of Torino
- (20) Becke A D 1993 The Journal of Chemical Physics 98 5648–5652
- (21) Stephens P J, Devlin F J, Chabalowski C F and Frisch M J 1994 The Journal of Physical Chemistry 11623–11627
- (22) Heyd J, Peralta J E, Scuseria G E and Martin R L 2005 The Journal of Chemical Physics 123 174101
- (23) Kaupp M, Schleyer P v R, Stoll H and Preuss H 1991 The Journal of Chemical Physics 94 1360–1366
- (24) Orobengoa D, Capillas C, Aroyo M I and Perez-Mato J M 2009 Journal of Applied Crystallography 42 820–833
- (25) Perez-Mato J M, Orobengoa D and Aroyo M I 2010 Acta Crystallographica Section A 66 558–590
- (26) Svitlyk V, Chernyshov D, Pomjakushina E, Krzton-Maziopa A, Conder K, Pomjakushin V, Pöttgen R and Dmitriev V 2013 J. Phys.: Condens. Matter 25 315403