Spin-orbit driven terahertz optical response in ferromagnetic Fe-Co-Al alloys
Abstract
We study the magneto-optical properties of Fe-Co-Al ordered alloys in the terahertz range of frequencies. We find that magnetism can modify the reflection of light from these magnets and that this modification strongly depends on the frequency of incoming light in the terahertz range. For example, we find that below 10 THz Co3Al has nearly constant and that above 10 THz it is reduced by about 50 times. Furthermore, we find a strong dependence of on chemical composition. For example, we find that the addition of Al to Fe changes the sign of , while the addition of Co to Fe leads to non-monotonic dependence of on Co-concentration.
I Introduction
A magnet with a cubic crystal structure and magnetization pointing along the z-axis, has a non-zero off-diagonal component of the optical conductivity, . This contribution to the conductivity occurs because magnetic order in such a system breaks time reversal symmetry. The breaking of the time-reversal symmetry is propagated to the electronic degrees of freedom by the spin-orbit interaction. Therefore, the magnitude of is dictated by the spin-orbit interaction strength.Nagaosa et al. (2010) Presence of off-diagonal conductivity , and thus in-directly the presence of magnetic order, can be detected optically by comparing the polarization of light incident to, and reflected from, the surface of a magnet. This is the so-called magneto-optical Kerr effect, MOKE.LL.D. (1877) Opposite is also true. If one changes the magnetization direction along the z-axis,
this will result in,
Therefore, one can use direction of magnetization to control the way in which light reflects from a surface of a magnet. This effect has been used in memory storage devicesKryder (1985); Meiklejohn (1986) and creation of tunable photonic materials.Atmatzakis et al. (2014); Wang et al. (2020)
At zero frequency, the static conductivity is also referred to as the anomalous Hall effect (AHE). In materials with very few impurities, so that the diagonal conductivity is above , the dominant contribution to AHE originates from scattering off of impurities. On the other hand, somewhat paradoxically, in materials with moderate amount of impurities, with diagonal conductivity around – , the dominant contribution to AHE is intrinsic, independent of the number of impurities.Nagaosa et al. (2010) The part of the intrinsic contribution to AHE is given by the sum of the Berry curvature of the Bloch wave function over the occupied states.Haldane (2004) However, in the dynamic case, the can no longer be written as a sum over the Berry curvature. Nevertheless, we expect that for small enough , in the THz range, the intrinsic contribution still dominates , which is consistent with findings in Ref. Matsuda et al., 2020.
There are many calculations of static intrinsic AHC in the literature. For example, YaoYao et al. (2004) calculated the AHC of ferromagnetic bcc Fe, and the calculated at zero frequency is 751 . WangWang et al. (2007) found that at zero frequency, AHC in bcc Fe, fcc Ni and hcp Co, and is 753, 2203 and 477 , respectively. BiancoBianco et al. (2014) calculated the AHC in Fe3Co, and the value at zero frequency is 452 . HuangHuang et al. (2015) calculated the AHC of Heusler compound such as Co2FeAl and found it to be 39 .
While originates from the magnetism, the coefficient of proportionality between and magnetic moment is difficult to predict without performing an explicit first-principles calculation. As discussed in Refs. Yao et al., 2004; Bianco et al., 2014; Wang et al., 2006, 2007, different parts of the reciprocal space can have either positive or negative contribution to , as sign will in general depend on position of the Fermi level relative to the subtle spin-orbit induced band gaps in the band-structure. Therefore, we might expect that generally will be a very sensitive function of the electronic band structure. As a consequence, we expect a rich dependence of dynamic in the low-frequency range. In particular, we expect that there will be a strong frequency dependence of when is close to the energy of the spin-orbit split bands in the band structure. The energy of the spin-orbit split bands is on the order of tens of meV in ferromagnetic metals such as Fe, Co, or Ni. These energies lie in the range of frequencies 10 THz, which is within the so-called terahertz-gap: the range of frequencies in the electromagnetic spectrum that are currently unexplored compared to larger frequencies.
Moreover, we expect that will be very sensitive on alloying, as even subtle changes in the electronic band structure will change the position of spin-orbit split bands relative to the Fermi level. Therefore, in this study we use first-principles techniques to calculate the of Fe-Co-Al alloys in the THz regime. Our calculations show that alloying is a feasible way to change the THz optical response of ferromagnetic metals such as Fe or Co. As expected, we find unusually strong dependence of the in these alloys on both frequency and alloy composition.
Most other studies of frequency dependent are done in the optical regime, at much higher energies. For example, Ref. Kim et al., 2002 computed for Fe3Co and FeCo3 in the 0.5–5.2 eV energy range. Next, Ref. Kumar et al., 2010 computed the optical response of Fe4-xCox (with –) up to the 13 eV range, while Ref. Rhee, 2004; Adebambo et al., 2010 reported for FeAl in the 0.5–6 eV range. Recently, some studies have focused on the off-diagonal optical response in the terahertz (THz) regime. SeifertSeifert et al. (2021) studied the off-diagonal optical response in DyCo5, Co0.32Fe0.68 and Gd0.27Fe0.73, and they measured somewhat stronger dependence of on in the range of frequencies below 10 THz, than above 10 THz. MatsudaMatsuda et al. (2020) studied the off-diagonal optical response in Weyl antiferromagnet Mn3Sn at very low energy (10 meV) and they find weak dependence of on the frequency. On the other hand, calculated and measured in the THz regime is very frequency dependent in SrRuO3, as shown in Refs. Kim et al., 2010; Fang et al., 2003; Shimano et al., 2011.
II Methods
We use Quantum Espresso packageGiannozzi et al. (2009) to calculate of ordered alloys of Fe, Co, and Al. We use the Generalized Gradient Approximation (GGA) of Perdew, Burke and Ernzerhof (PBE)Perdew et al. (1996) along with the optimized norm-conserving Vanderbilt (ONCV) pseudopotentials which include spin-orbit interaction.Schlipf and Gygi (2015); Corso and Conte (2005) We choose 120 Ha kinetic-energy cutoff for the plane-wave expansion of the valence wave functions. A 161616 Monkhorst-Pack grid and a smearingMarzari et al. (1999) of 0.01 Ry are used to sample the electron’s Brillouin zone. We computed using the standard Kubo formula,Kubo (1957)
| (1) | ||||
Here, and denote Cartesian directions. is the cell volume, is the number of k-points, and is the Fermi-Dirac distribution function. is the optical frequency. We use Wannier interpolationMarzari et al. (2012); Mostofi et al. (2008) in evaluating Eq. 1, as these calculations require a very dense sampling of the Brillouin zone. We tested the convergence of to the choice of k mesh. We use adaptive k-mesh refinement to accelerate the convergenceYao et al. (2004) by adding a 555 fine mesh around regions with large contribution to . For pure metals (Fe and Co), a 250250250 primary k-mesh is enough to achieve the convergence of . For calculations with two atoms per unit cell and four atoms per unit cell, a 200200200 and 150150150 k-mesh, respectively, was enough to achieve convergence.
To validate the reliability of our calculation approach, we compare our calculation results with previous calculations. Our calculated of Fe and Co at zero frequency are 758 and 471 , respectively, which agrees very well with the previous calculation result of 753 in Fe and 477 in Co.Wang et al. (2007) Furthermore, the calculated of FeCo and Fe3Co at zero frequency is 226 and 416 , respectively. The measured of Fe0.68Co0.32 at zero frequency is about 350 Seifert et al. (2021), which lies between the theoretical values of FeCo and Fe3Co. In addition, we calculated the Kerr angle of Fe in the range of 0–1.2 eV by using our calculated values and experimental values from Ref. Krinchik, 1964; Ordal et al., 1983. Our calculated Kerr angle matches very well with the results in Ref. Krinchik and Artem’ev, 1968.
In all of our calculations we assumed that the magnetization points along the direction. We did not explore what happens to the off-diagonal conductivity when magnetization points in any other crystallographic direction, such as or . We decided to restrict our calculations to those with the magnetization axis pointing along direction as our goal here is to compare only as a function of chemical composition of the alloy and frequency. Furthermore, for consistency, in each calculation we chose the same sign of magnetization along the direction.
III Results and discussion
Now we present our results for ordered Fe-Co-Al alloys. We start by discussing the computed lattice constants and crystal structure of these alloys. Our results are shown in Table 1. Most of the ordered alloys we studied order in the bcc-derived structures B2 and D03.Popova (2012); Ikeda et al. (2002); Okamoto (2016) The B2 structure is a bcc-derived structure with two atoms in the primitive unit cell. This structure is therefore present in alloys with 1–1 ratio of two elements. On the other hand, D03 structure contains four atoms in the primitive unit cell, so it is present in ordered binary alloys with 1–3 ratio of constituent elements, or 1–1–2 ratio in the case of ternary alloys. Among the ordered alloys we studied, the only ones that are not in the bcc-derived structure are: Al, FeAl3, CoAl3, Co, and Co3Al. However three of these (Al, FeAl3, and CoAl3) are non-magnetic, regardless of their crystal structure, so their is identically zero. Therefore, we don’t discuss these cases in more detail. Next, in the case of Co, we explicitly showed that is very similar in bcc and hcp structures. Therefore, for more consistent comparison with other members of the Fe-Co-Al family of compounds, we will show results for pure Co in its bcc structure. Finally, we expect that the remaining exception, Co-rich Co3Al, will also have that doesn’t strongly depend on the structure, so that we are justified in studying Co3Al in the bcc-derived structure (and not in the lowest energy structure, the fcc-derived L12).
We find that the computed lattice constants are close to the experimentally measured values. Small deviations, on the order of 1% are due to approximate exchange-correlation functional in GGA, as well as due to thermal expansion, as the experimental data in Table 1 are taken at room temperature.
Calculated magnetic moments per atom are also given in Tab. 1. Most of these ordered alloys are magnetic in our calculations, with the exception of Al-rich compounds, such as FeAl3, CoAl3 and CoAl. These findings are in agreement with previous studies.Gonzales-Ormeño et al. (2002); Parsons et al. (1958)
| () | (Å) | (Å) | ||
| Fe | bcc | 2.84 | 2.84 | |
| Fe3Co | D03 | 5.71 | 5.66 | |
| FeCo | B2 | 2.85 | 2.85 | |
| FeCo3 | D03 | 5.66 | 5.66 | |
| Co | bcc | 2.82 | 2.82 | |
| Co | hcp | |||
| Fe3Al | D03 | 5.76 | 5.79 | |
| FeAl | B2 | 2.88 | 2.91 | |
| FeAl3 | D03 | . | 5.98 | |
| Co3Al | D03 | 5.69 | ||
| CoAl | B2 | . | 2.86 | 2.86 |
| CoAl3 | D03 | . | 6.01 | |
| Fe2CoAl | D03 | 5.76 | ||
| FeCo2Al | D03 | 5.71 |
III.1 Fe and Co
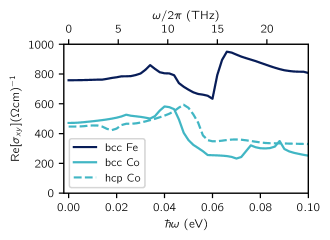
Figure 1 shows calculated of pure Fe and Co metal in the range of energies from – eV. This corresponds to the range of frequencies – THz. As expected, we find a strong variation of as a function of frequency, in both Fe and Co. These variations are the strongest around – THz. We attribute these modifications to the fact that the characteristic spin-orbit gaps in these metals occur in the same range of energies. For Fe, we find that the minimal value of , in the studied frequency range, is 634 at THz, while the maximal value is 1.5 times larger, 950 at a nearby frequency of THz. In the case of Co, the minimal value is 233 at THz, and maximal value is 2.5 times larger, 582 at THz. We compared in bcc and hcp structure of Co and we found qualitatively similar responses, as shown in Fig. 1. Therefore, at least in the case of Co, the crystalline structure doesn’t have a strong effect on .
III.2 Fe-Co alloys
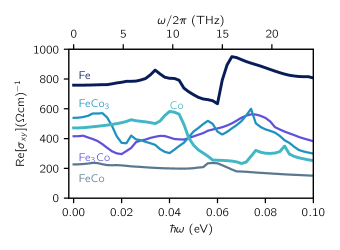
After analyzing in pure Fe and Co, we now turn to the ordered Fe-Co alloys. We considered three ordered alloys of Fe and Co, these are Fe3Co, FeCo, and FeCo3. The crystalline ordered structures of these alloys are D03, B2 and D03, respectively. In what follows we show the data for pure Co in its bcc phase because all three ordered alloys are derivatives of the bcc structure. However, as we just discussed, bcc and hcp Co have a very similar value of . Our results for Fe-Co alloys are shown in Fig. 2. Starting from pure Fe, we find that adding Co at first significantly reduces the value of . In particular, in Fe3Co is on average about 2 times lower than that of pure Fe. Furthermore, spectral features of alloy Fe3Co are distinct from that of pure Fe. While both Fe and Co have nearly constant up to 10 THz, we find that Fe3Co shows a strong dependence on frequency starting already around 3 THz. This finding of a large sensitivity of on chemical composition is in agreement with our expectation that is very sensitive on details of the band structure, as spin-orbit split bands give either positive or negative contribution to , depending on the location of the Fermi level. Adding even more Co, as in FeCo, we find that the value of is reduced even further. In particular, is about 4 times smaller in FeCo than in pure Fe. Moreover, the spectral features of FeCo are surprisingly constant in the entire range of frequencies we studied. Further addition of Co increases the value of . For example, in the case of FeCo3, is similar in magnitude to that of pure Co. Spectral features of FeCo3 are strongest among the Fe-Co alloys we studied.
The non-monotonic dependence of on Co concentration is reminiscent of a non-monotonic dependence of magnetic damping observed in Fe-Co alloys.Schoen et al. (2016) While magnetic damping is not directly related to , we expect that both can be related to the changes in the nature of the electronic band structure near the Fermi level in Fe-Co alloys.
We note that variation in on Co concentration can’t be rationalized with variation of the magnetic moment, as we find that all members of the Fe-Co family of alloys have nearly constant magnetic moment per atom, on the order of (see Table 1). Therefore, even though can be used as a signature of magnetic order, one is not necessarily proportional to the other. As discussed earlier, the role of the magnetic order here is only to break the time-reversal symmetry, while the magnitude and spectral properties of are driven by the spin-orbit interaction of electron bands close to the Fermi level.
Comparing the band structure of all Fe–Co ordered alloys we studied, we find that the overall band structure is not changed much, only the position of the Fermi level, relative to the rigid band structure is increasing with the addition of Co. Therefore, we attribute changes in the of Fe–Co alloys to the changes in the relative position of the Fermi level, and not to changes in the band structure itself.
III.3 Fe-Al alloys
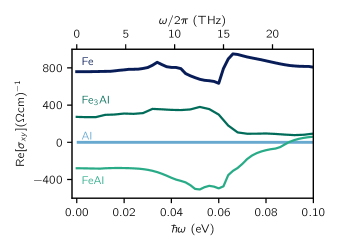
Next we discuss calculated in Fe-Al alloys. Our results are shown in Fig. 3. Since Al is non-magnetic, the response is, by symmetry, zero at all frequencies. By introducing Al, the response of Fe3Al lies between that of pure Fe and Al, as one might expect. However, unexpectedly, when the Al concentration reaches 50%, response of the FeAl changes sign in the entire frequency range from 0 to 20 THz. We ensured that in all of these cases, Fe and Fe-Al alloys have magnetization pointing in the same direction. A similar result is observed in Co/Pd multi-layers in Ref Keskin et al., 2013, where the sign of changes depending on the relative concentration of Co to Pd.
III.4 Co-Al alloys
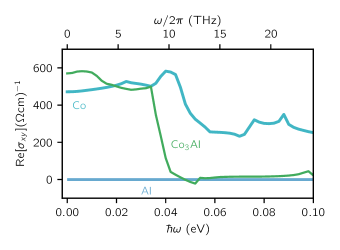
The next binary alloys we discuss are Co-Al alloys. Results for these alloys are shown in Fig. 4. While CoAl and CoAl3 are not magnetic, the Co-rich compound Co3Al is magnetic in our calculations. At low frequencies, below 10 THz, we find that for Co3Al is quite large, and somewhat constant, with the value of . However, above 10 THz, is reduced to only . Therefore, in the case of Co3Al, we find that is nearly constant above and below THz, but that magnitude above THz is reduced 50-fold relative to the magnitude below THz.
III.5 Fe-Co-Al ternary alloys
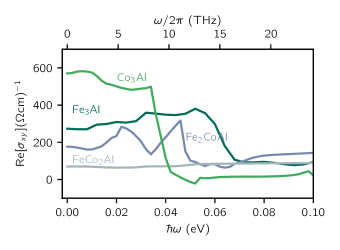
So far, we discussed the response of binary alloys. In what follows, we consider several Fe-Co-Al ternary alloys. We kept the Al concentration at 25%, and we varied the relative concentration of Fe and Co. The results for these alloys are shown in Fig. 5. The behavior of Fe2CoAl is qualitatively similar to that of Fe3Al, so the replacement of Fe with Co did not change qualitatively . Quantitatively, we find that is reduced about times lower in Fe2CoAl relative to Fe3Al. However, with even larger concentration of Co, as in FeCo2Al, we find that is both qualitatively and quantitatively different from other members of the Fe-Co-Al family of compounds. In particular, we find an unusually small in FeCo2Al, around 80 , that is almost insensitive on the frequency in the entire range between 0 and 25 THz.
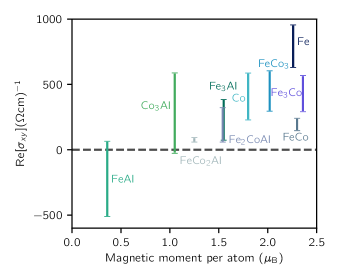
III.6 Optical conductivity and magnetic moment
As we discussed earlier, is often taken as an optical signature of magnetic order. Therefore, it is natural to ask whether a material with large magnetization will also have a large . Figure 6 shows the relationship between and the magnetic moment per atom, for all of the compounds we studied. For each compound we show on the vertical scale of Fig. 6 the range of maximal and minimal values of the calculated in the range of frequencies from 0 to 25 THz. As can be seen from the figure, we find that in the case of Fe–Co alloys, the magnetic moments per atom are nearly the same, on the order of , but the ranges from 150, all the way to 950 . Same is true for the other compounds we studied. The most drastic example is FeAl in which even changes sign relative to that in Fe. Therefore we can conclude that materials with larger magnetic moment do not necessarily have larger . This is not too surprising, as the large magnetization arises from the large difference in population of dominantly spin-up and spin-down bands. However, large in the low-frequency regime relies on detailed information about spin-orbit split bands near the Fermi level.
III.7 Remaining components of the tensor
So far we focused on the real part of , as this is the most studied part of the optical conductivity tensor that is dependent on the magnetic order. However, by symmetry, there are two other components of the conductivity tensor that can be controlled by the magnetic order. These are the imaginary part of the off-diagonal component , as well as the difference between the diagonal components of the conductivity tensor along and perpendicular to the direction of the magnetic moment.
We first analyze the imaginary part of . While the real part of is related to the change in the polarization direction in the polar-MOKE geometry, the imaginary part is related to the change in the ellipticity of the reflected light. The imaginary part of is shown in the supplement for all compounds we studied. As would be expected from the Kramers-Kronig relationship, imaginary part of is also strongly dependent on both chemical composition and frequency. For example, we find that the step-like spectral feature we found for the real part of in Co3Al is accompanied with a single sharp feature in the imaginary part of , at nearly the same frequency ( THz), as one might expect. Similarly sharp features in the imaginary part of we find in the case of Co and Fe3Al. The spectral features of the imaginary part of are much more complex for the other compounds we studied. This is particularly true for alloys containing Fe magnetic atoms.
Now we analyze the other component of the conductivity tensor that depends on the presence of the magnetic order. By symmetry, the magnetization along the -axis introduces a spin-orbit driven difference between the (along the magnetization axis) and (perpendicular to the magnetization axis). While is zero without magnetic order, the diagonal components , , and are not. Therefore, here we don’t focus on these diagonal components individually, but instead we focus on their difference, . The calculated values of for all compounds we studied can be found in the supplement. We again find strong variations of both as a function of frequency and as a function of chemical composition. In the case of Fe-Co family of compounds, we find that in Fe and FeCo have a sharp peak around 15 THz, and are nearly zero below 14 THz. Co shows two sharp features, with opposite signs, one at around 9 and another around 20 THz. Addition of 25% of Al to Fe strongly changes the value of . While Fe has a sharp feature around 15 THz, Fe3Al has a sharp feature around 3 THz. Addition of even more Al, as in FeAl, introduces two sharp features, at around 10 and 15 THz. Addition of Al to Co also introduces significant qualitative and quantitative changes to .
IV Conclusion
We find a strong dependence of in the terahertz frequency range for Fe-Co-Al ordered alloys. For example, in the case of Co3Al we find nearly 50-fold reduction in above 10 THz as compared to below 10 THz. On the other hand, in the case of FeCo2Al we find nearly constant in the entire range from 0 to 25 THz. Furthermore, we also find a strong dependence of on the chemical composition. For example, the addition of Al to Fe can change the sign of , so that is positive in Fe and Fe3Al but negative in the case of FeAl. Similarly, addition of Co to Fe produces a non-monotonic dependence of on Co concentration. As an example, in FeCo is about 4 times smaller than that in Fe, and 3 times smaller than that in Co. We attribute both of these strong variations, with frequency and composition, to the subtle changes in the electronic structure induced by the presence of the spin-orbit interaction. However, unlike in the case of AHE, the analysis of the origin of is additionally complicated by the fact that Kubo expression for involves transition between empty and occupied states, while in the case of AHE can be written as integral of the Berry curvature over occupied set of bands. Therefore, we leave a more detailed analysis of the origin of these strong variations of to future studies.
Our calculations are performed in the limit of infinite electron lifetime. While this is justified for materials with moderate amount of disorder, with diagonal conductivity around – , we leave for future work discussion of role of disorder on in the terahertz range for materials that are not within the moderate range of disorder. We expect that at low enough frequencies the phenomenology of will be the same as that of , so that with a moderate amount of disorder the dominant contribution to is intrinsic, but with less disorder scattering from impurities start to dominate.Nagaosa et al. (2010) We show in supplement calculated in which we approximately incorporate the effect of finite carrier lifetime. While finite carrier lifetime approximation washes out some of the spectral features in , we still find that lot of qualitative features remain, such as change in sign of near THz, or sharp decline in in Co3Al around 10 THz, or non-monotonic dependence of of Co-concentration in Fe-Co alloys.
Our findings indicate that alloys such as Fe-Co-Al would be of interest in creation of magnetic optical metamaterials in which direction of magnetic moment and chemical composition are used to control its interaction with light. While our study focused mostly on real part of , we note that there are additional components of the conductivity tensor which can be controlled with the magnetic field, such as imaginary part of , as well as difference between the diagonal components . We also note that change in the polarization of light is dependent not only on , but also on diagonal components of tensor. Therefore, any additional spectral features present in the diagonal components of will additionally modify the MOKE signal in these alloys.
Acknowledgements.
This work was supported by grant NSF DMR-1848074. Computations were performed using the HPCC computer cluster at UCR. We acknowledge discussion with Igor Barsukov and Richard B. Wilson.References
- Nagaosa et al. (2010) N. Nagaosa, J. Sinova, S. Onoda, A. H. MacDonald, and N. P. Ong, Rev. Mod. Phys. 82, 1539 (2010).
- LL.D. (1877) J. K. LL.D., The London, Edinburgh, and Dublin Philosophical Magazine and Journal of Science 3, 321 (1877).
- Kryder (1985) M. H. Kryder, Journal of Applied Physics 57, 3913 (1985).
- Meiklejohn (1986) W. Meiklejohn, Proceedings of the IEEE 74, 1570 (1986).
- Atmatzakis et al. (2014) E. Atmatzakis, N. Papasimakis, V. Fedotov, and N. I. Zheludev, in CLEO: 2014 (Optical Society of America, 2014) p. STu1H.6.
- Wang et al. (2020) X. Wang, H. Wang, J. Jian, B. X. Rutherford, X. Gao, X. Xu, X. Zhang, and H. Wang, Nano Letters 20, 6614 (2020), pMID: 32787175.
- Haldane (2004) F. D. M. Haldane, Phys. Rev. Lett. 93, 206602 (2004).
- Matsuda et al. (2020) T. Matsuda, N. Kanda, T. Higo, N. P. Armitage, S. Nakatsuji, and R. Matsunaga, Nature Communications 11, 909 (2020).
- Yao et al. (2004) Y. Yao, L. Kleinman, A. H. MacDonald, J. Sinova, T. Jungwirth, D.-s. Wang, E. Wang, and Q. Niu, Phys. Rev. Lett. 92, 037204 (2004).
- Wang et al. (2007) X. Wang, D. Vanderbilt, J. R. Yates, and I. Souza, Phys. Rev. B 76, 195109 (2007).
- Bianco et al. (2014) R. Bianco, R. Resta, and I. Souza, Phys. Rev. B 90, 125153 (2014).
- Huang et al. (2015) H.-L. Huang, J.-C. Tung, and G.-Y. Guo, Phys. Rev. B 91, 134409 (2015).
- Wang et al. (2006) X. Wang, J. R. Yates, I. Souza, and D. Vanderbilt, Phys. Rev. B 74, 195118 (2006).
- Kim et al. (2002) K. J. Kim, S. Lee, and J. Park, Journal of Magnetism and Magnetic Materials 241, 6 (2002).
- Kumar et al. (2010) M. Kumar, T. Nautiyal, and S. Auluck, The European Physical Journal B 73, 423 (2010).
- Rhee (2004) J. Y. Rhee, Journal of Applied Physics 96, 7018 (2004).
- Adebambo et al. (2010) P. Adebambo, K. Bamgbose, J. Olowofela, J. Oguntuase, and G. Adebayo, Physica B: Condensed Matter 405, 4578 (2010).
- Seifert et al. (2021) T. S. Seifert, U. Martens, F. Radu, M. Ribow, M. Berritta, L. Nádvorník, R. Starke, T. Jungwirth, M. Wolf, I. Radu, M. Münzenberg, P. M. Oppeneer, G. Woltersdorf, and T. Kampfrath, Advanced Materials 33, 2007398 (2021).
- Kim et al. (2010) M.-H. Kim, G. Acbas, M.-H. Yang, M. Eginligil, P. Khalifah, I. Ohkubo, H. Christen, D. Mandrus, Z. Fang, and J. Cerne, Phys. Rev. B 81, 235218 (2010).
- Fang et al. (2003) Z. Fang, N. Nagaosa, K. S. Takahashi, A. Asamitsu, R. Mathieu, T. Ogasawara, H. Yamada, M. Kawasaki, Y. Tokura, and K. Terakura, Science 302, 92 (2003).
- Shimano et al. (2011) R. Shimano, Y. Ikebe, K. S. Takahashi, M. Kawasaki, N. Nagaosa, and Y. Tokura, EPL (Europhysics Letters) 95, 17002 (2011).
- Giannozzi et al. (2009) P. Giannozzi, S. Baroni, N. Bonini, M. Calandra, R. Car, C. Cavazzoni, D. Ceresoli, G. L. Chiarotti, M. Cococcioni, I. Dabo, A. D. Corso, S. de Gironcoli, S. Fabris, G. Fratesi, R. Gebauer, U. Gerstmann, C. Gougoussis, A. Kokalj, M. Lazzeri, L. Martin-Samos, N. Marzari, F. Mauri, R. Mazzarello, S. Paolini, A. Pasquarello, L. Paulatto, C. Sbraccia, S. Scandolo, G. Sclauzero, A. P. Seitsonen, A. Smogunov, P. Umari, and R. M. Wentzcovitch, Journal of Physics: Condensed Matter 21, 395502 (2009).
- Perdew et al. (1996) J. P. Perdew, K. Burke, and M. Ernzerhof, Phys. Rev. Lett. 77, 3865 (1996).
- Schlipf and Gygi (2015) M. Schlipf and F. Gygi, Computer Physics Communications 196, 36 (2015).
- Corso and Conte (2005) A. D. Corso and A. M. Conte, Phys. Rev. B 71, 115106 (2005).
- Marzari et al. (1999) N. Marzari, D. Vanderbilt, A. De Vita, and M. C. Payne, Phys. Rev. Lett. 82, 3296 (1999).
- Kubo (1957) R. Kubo, Journal of the Physical Society of Japan 12, 570 (1957).
- Marzari et al. (2012) N. Marzari, A. A. Mostofi, J. R. Yates, I. Souza, and D. Vanderbilt, Rev. Mod. Phys. 84, 1419 (2012).
- Mostofi et al. (2008) A. A. Mostofi, J. R. Yates, Y.-S. Lee, I. Souza, D. Vanderbilt, and N. Marzari, Computer Physics Communications 178, 685 (2008).
- Krinchik (1964) G. Krinchik, Izv. Akad. Nauk SSSR, Ser. Fiz 28, 481 (1964).
- Ordal et al. (1983) M. A. Ordal, L. L. Long, R. J. Bell, S. E. Bell, R. R. Bell, R. W. Alexander, and C. A. Ward, Appl. Opt. 22, 1099 (1983).
- Krinchik and Artem’ev (1968) G. Krinchik and V. Artem’ev, Sov. Phys. JETP 26, 1080 (1968).
- Popova (2012) A. N. Popova, Journal of Physics: Conference Series 345, 012030 (2012).
- Ikeda et al. (2002) O. Ikeda, R. Kainuma, I. Ohnuma, K. Fukamichi, and K. Ishida, Journal of Alloys and Compounds 347, 198 (2002).
- Okamoto (2016) H. Okamoto, Journal of Phase Equilibria and Diffusion 37, 726 (2016).
- Gonzales-Ormeño et al. (2002) P. G. Gonzales-Ormeño, H. M. Petrilli, and C. G. Schön, Calphad 26, 573 (2002).
- Parsons et al. (1958) D. Parsons, W. Sucksmith, and J. E. Thompson, The Philosophical Magazine: A Journal of Theoretical Experimental and Applied Physics 3, 1174 (1958).
- Schoen et al. (2016) M. A. Schoen, D. Thonig, M. L. Schneider, T. Silva, H. T. Nembach, O. Eriksson, O. Karis, and J. M. Shaw, Nature Physics 12, 839 (2016).
- Keskin et al. (2013) V. Keskin, B. Aktaş, J. Schmalhorst, G. Reiss, H. Zhang, J. Weischenberg, and Y. Mokrousov, Applied Physics Letters 102, 022416 (2013).