– Under Review
\jmlryear2022
\jmlrworkshopFull Paper – MIDL 2022
\midlauthor\NameIkboljon Sobirov \Emailikboljon.sobirov@mbzuai.ac.ae
\NameOtabek Nazarov \Emailotabek.nazarov@mbzuai.ac.ae
\NameHussain Alasmawi \Emailhussain.alasmawi@mbzuai.ac.ae
\NameMohammad Yaqub \Emailmohammad.yaqub@mbzuai.ac.ae
\addrMohamed bin Zayed University of Artificial Intelligence, Abu Dhabi, UAE
Automatic Segmentation of Head and Neck Tumor:
How Powerful Transformers Are?
Abstract
Cancer is one of the leading causes of death worldwide, and head and neck (H&N) cancer is amongst the most prevalent types. Positron emission tomography and computed tomography are used to detect, segment and quantify the tumor region. Clinically, tumor segmentation is extensively time-consuming and prone to error. Machine learning, and deep learning in particular, can assist to automate this process, yielding results as accurate as the results of a clinician. In this paper, we investigate a vision transformer-based method to automatically delineate H&N tumor, and compare its results to leading convolutional neural network (CNN)-based models. We use multi-modal data from CT and PET scans to perform the segmentation task. We show that a solution with a transformer-based model has the potential to achieve comparable results to CNN-based ones. With cross validation, the model achieves a mean dice similarity coefficient (DSC) of 0.736, mean precision of 0.766 and mean recall of 0.766. This is only 0.021 less than the 2020 competition winning model (cross validated in-house) in terms of the DSC score. On the testing set, the model performs similarly, with DSC of 0.736, precision of 0.773, and recall of 0.760, which is only 0.023 lower in DSC than the 2020 competition winning model. This work shows that cancer segmentation via transformer-based models is a promising research area to further explore.
keywords:
cancer segmentation, head and neck tumor, CT, PET, multi-modal data, transformer-based segmentation, HECKTOR1 Introduction
Head and neck (H&N) cancer is the eighth most common case of cancer mortality O’rorke et al. (2012), and 686,328 people were diagnosed with H&N cancer worldwide in 2012 Baijens et al. (2020). Clinically, positron emission tomography (PET) and computed tomography (CT) can be utilized to detect its presence. Doctors manually delineate the tumor region on 3D PET and CT scans and upon their analysis decide on a proper treatment (e.g. radiotherapy’s dosage and location). Accurate detection of the tumor is crucial, however, since the data is volumetric, the process is highly time-consuming and challenging. Thus, automatic segmentation is a solution that is highly valuable for this task.
With the advances in artificial intelligence (AI) and deep learning (DL), automation of the tumor segmentation task has been studied with great interest. The primary reason of the popularity of DL in medical research field is that it can perform as good as a radiologist in most cases, and that it can save the time doctors spend to complete this task.
Even though H&N tumors is among the most frequent ones, it has an insufficient amount of studies that accurately segment out the tumor in the H&N area using DL techniques. Hence, Head and Neck Tumor Segmentation and Outcome Prediction in PET/CT images (HECKTOR) challenge Andrearczyk et al. (2021) was proposed with automatic tumor segmentation being one of its tasks.
U-Net Ronneberger et al. (2015), DeepLab Chen et al. (2016) and their variations are generally used for segmentation task due to their accurate and fast performance. Their variations include features and techniques such as 3D convolution blocks Çiçek et al. (2016), residual blocks Zhang et al. (2017), multi-scale patches Jiayun et al. (2018), ensembles Feng et al. (2020). Most of the existing methods Iantsen et al. (2021)Yuan (2020)Ma and Yang (2020) applied for H&N tumors segmentation in the HECKTOR challenge relied on U-Net variations. However, to the best of our knowledge, none of the work was applied with transformer-based models to explore the H&N tumor segmentation. Transformer-based models can be effective in this specific task because H&N tumor occurs only at specific regions, and transformers are superior at learning the context information of segmentation area and identifying potential tumors regions. Moreover, transformer-based models are relatively new and understudied compared to CNN-based models. Thus, exploring their performance further would potentially benefit other segmentation tasks. In this work, our contributions are as follows:
-
•
Exploring a transformer-driven model in contrast to currently best performing CNN-based counterparts;
-
•
Showing that the transformer-backed model is as powerful as CNN-based models;
-
•
Showing that data augmentations are essential to the transformer-based model;
-
•
Studying transformers in a CT/PET multimodal setting;
-
•
Testing the validity of a newly proposed architecture in a different medical task.
2 Review of Related Work
The most common subject in research papers that use DL in medical imaging is the segmentation task Litjens et al. (2017). Even though various DL architectures have been proposed, CNN-based U-Net Ronneberger et al. (2015) and its variations have been consistently showing the best performance in this task in most cases. The vanilla U-Net model consists of an encoder to capture local contextual information, and a decoder to upsample back to the input image size, and skip connections between the two to restore spatial information. Interestingly, with an automatically configured architecture design and parameters, even the vanilla U-Net Isensee et al. (2018) can show promising results, winning recent competitions as BraTS 2021 challenge Menze et al. (2015).
2.1 Transformer-based Segmentation Models
Transformer-driven architectures are gaining more and more audience in the medical tasks. In the segmentation task, LeViT-UNet Xu et al. (2021), TransBTS Wang et al. (2021), CoTr Xie et al. (2021), TransUNet Chen et al. (2021), TransFuse Zhang et al. (2021), UNet TRansformer (UNETR) Hatamizadeh et al. (2021) are some of the recent transformer-powered architectures that employ transformers mainly as a feature extractor, combining it with CNN either at the encoder or decoder paths. In particular, Wang et al. Wang et al. (2021) effectively encodes local and global representations in depth as well as spatial dimensions to segment brain tumor. A 3D CNN encoder is used for spatial feature extraction, transformers following that for global feature encoding, and a 3D CNN decoder to upsample to the full resolution for segmentation. Another work by Zhu et al. Zhu et al. (2021) integrates a region awareness into transformers to do breast tumor segmentation. Their extensive experimentation on ultrasound breast scans prove the model over CNN-based counterparts. UNETR, proposed in Hatamizadeh et al. (2021), uses 12 layers of ViT transformer as an encoder that generates features at different layers and connects them to the decoder as skip connections, similar to the original U-Net. A CNN-based decoder upsamples the features to generate segmentation masks in the input size. The model is applied on brain tumor segmentation and abdominal multi-organ segmentation tasks, and achieves comparable results to other methods.
To the best of our knowledge, the study of transformers for H&N tumor segmentation is done for the first time. Furthermore, CT/PET multimodality has not yet been explored in these works. Lastly, our work is a validation study with a direct comparison of transformer-based and currently best performing CNN-based models.
2.2 Existing H&N Tumor Segmentation Models
Given the vast range of DL segmentation models, not much effort has been previously dedicated to the AI field to study automatic segmentation of H&N tumors. However, with the HECKTOR challenge, several papers attempted to design algorithms to automatically delineate tumor in H&N using PET and CT scans in a multi-modal approach.
Iantsen et al. Iantsen et al. (2021) implements Squeeze-and-Excitation normalization (SE norm) layers on top of U-Net with residual blocks, achieving the highest dice similarity coefficient (DSC) of 0.759 in the 2020 HECKTOR challenge test set. The SE norm is similar to instance normalization Ulyanov et al. (2016) but different in shift and scale values, which are treated as functions of input X during inference. The SE norm is used in the decoder part after each convolutional block, and residual layers that contain the SE norm are used in the encoder part. They combine soft dice loss and focal loss for the training, and use ensembling for the final test set to achieve such a score.
An integration of U-Net and hybrid active contour is proposed by Ma and Yang Ma and Yang (2020) saving them the second place. They implement a model that combines CNN with a traditional machine learning technique, hybrid active contours, which aims to use the complementary information among CT images, PET images, and network probabilities to improve the segmentation results of the cases with high uncertainty. Their model shows similar performance to the best model in terms of DSC and precision metrics, but it does not provide a good recall value.
Yuan Yuan (2020) designs a dynamic scale attention network on top of U-Net to perform the segmentation. They argue that this helps enhance the utilization of feature maps coming from encoder to decoder. Their scale attention network (SA-Net) integrates different scale features by using a scale attention block for each decoder layer that is connected to all extracted features (except the last encoder layer). They test their model and show that their model gets better results against the standard U-Net skip connection.
Nonetheless, all these approaches primarily focus on using CNN-based architectures to perform the H&N tumor segmentation. Transformers are understudied in the segmentation task, and in the H&N cancer task in particular.
3 Methods
3.1 Dataset
The HECKTOR 2021 challenge Andrearczyk et al. (2021) provides a dataset of CT, FDG-PET, segmentation masks, bounding box information, and electronic health records (EHR). The data is collected from six medical centers. Total cases of 325 patients are provided with a split of 224 for training and 101 for testing by the organizers. Since we do not have access to the ground truth data of the test set, we split the training data into training and validation sets in a leave-one-center-out fashion. PET and CT scans are accompanied by a CSV file containing bounding boxes for tumor, which highlight the size of for each scan for consistency between CT and PET. For this task, CT, PET, segmentation masks, and the CSV file were used.
3.2 Image Pre-processing
The initial step was to utilize the bounding box information to crop the original scans down to the size of , both in CT and PET. Given that this information was provided in the dataset, the full tumor appears within this cubic region, and the corresponding mapping of both modalities is accurate and without inconsistencies. The cropping vastly lowers the dimensions of the scans, highlights the tumor area, and removes redundant data in scans, assisting the models to learn more easily. Additionally, CT and PET image intensities were both normalized; CT images were initially clipped to (-1024, 1024), which were empirically chosen, and then normalized to (-1, 1); PET images were normalized using Z-score normalization. All scans were re-sampled to isotropic voxel spacing of 1.0.
3.3 Data Augmentations
It is established that data augmentations contribute to the improvement in results, since it help the network see a variation of the existing data. With that in mind, several sets of augmentations were experimented with. Random rotation in (-45, 45) range, mirroring, zooming, gamma correction on PET, and elastic deformation were combined in various fashions and experimented with to investigate which combination yields the highest performance. Unlike other augmentations that were applied on both CT and PET, gamma correction was applied only on PET in 0.5-2 range due to the fact that PET scans are occasionally dark, and brightening and darkening them slightly can help the model understand PET scans in more details. Zooming was applied with a factor of 1.25, cropping the current size of to . This was assumed to zoom into and highlight small tumor regions. Elastic deformation was experimented as well to make the model more robust as claimed in the original U-Net paper Ronneberger et al. (2015).
3.4 Transformer-based Method
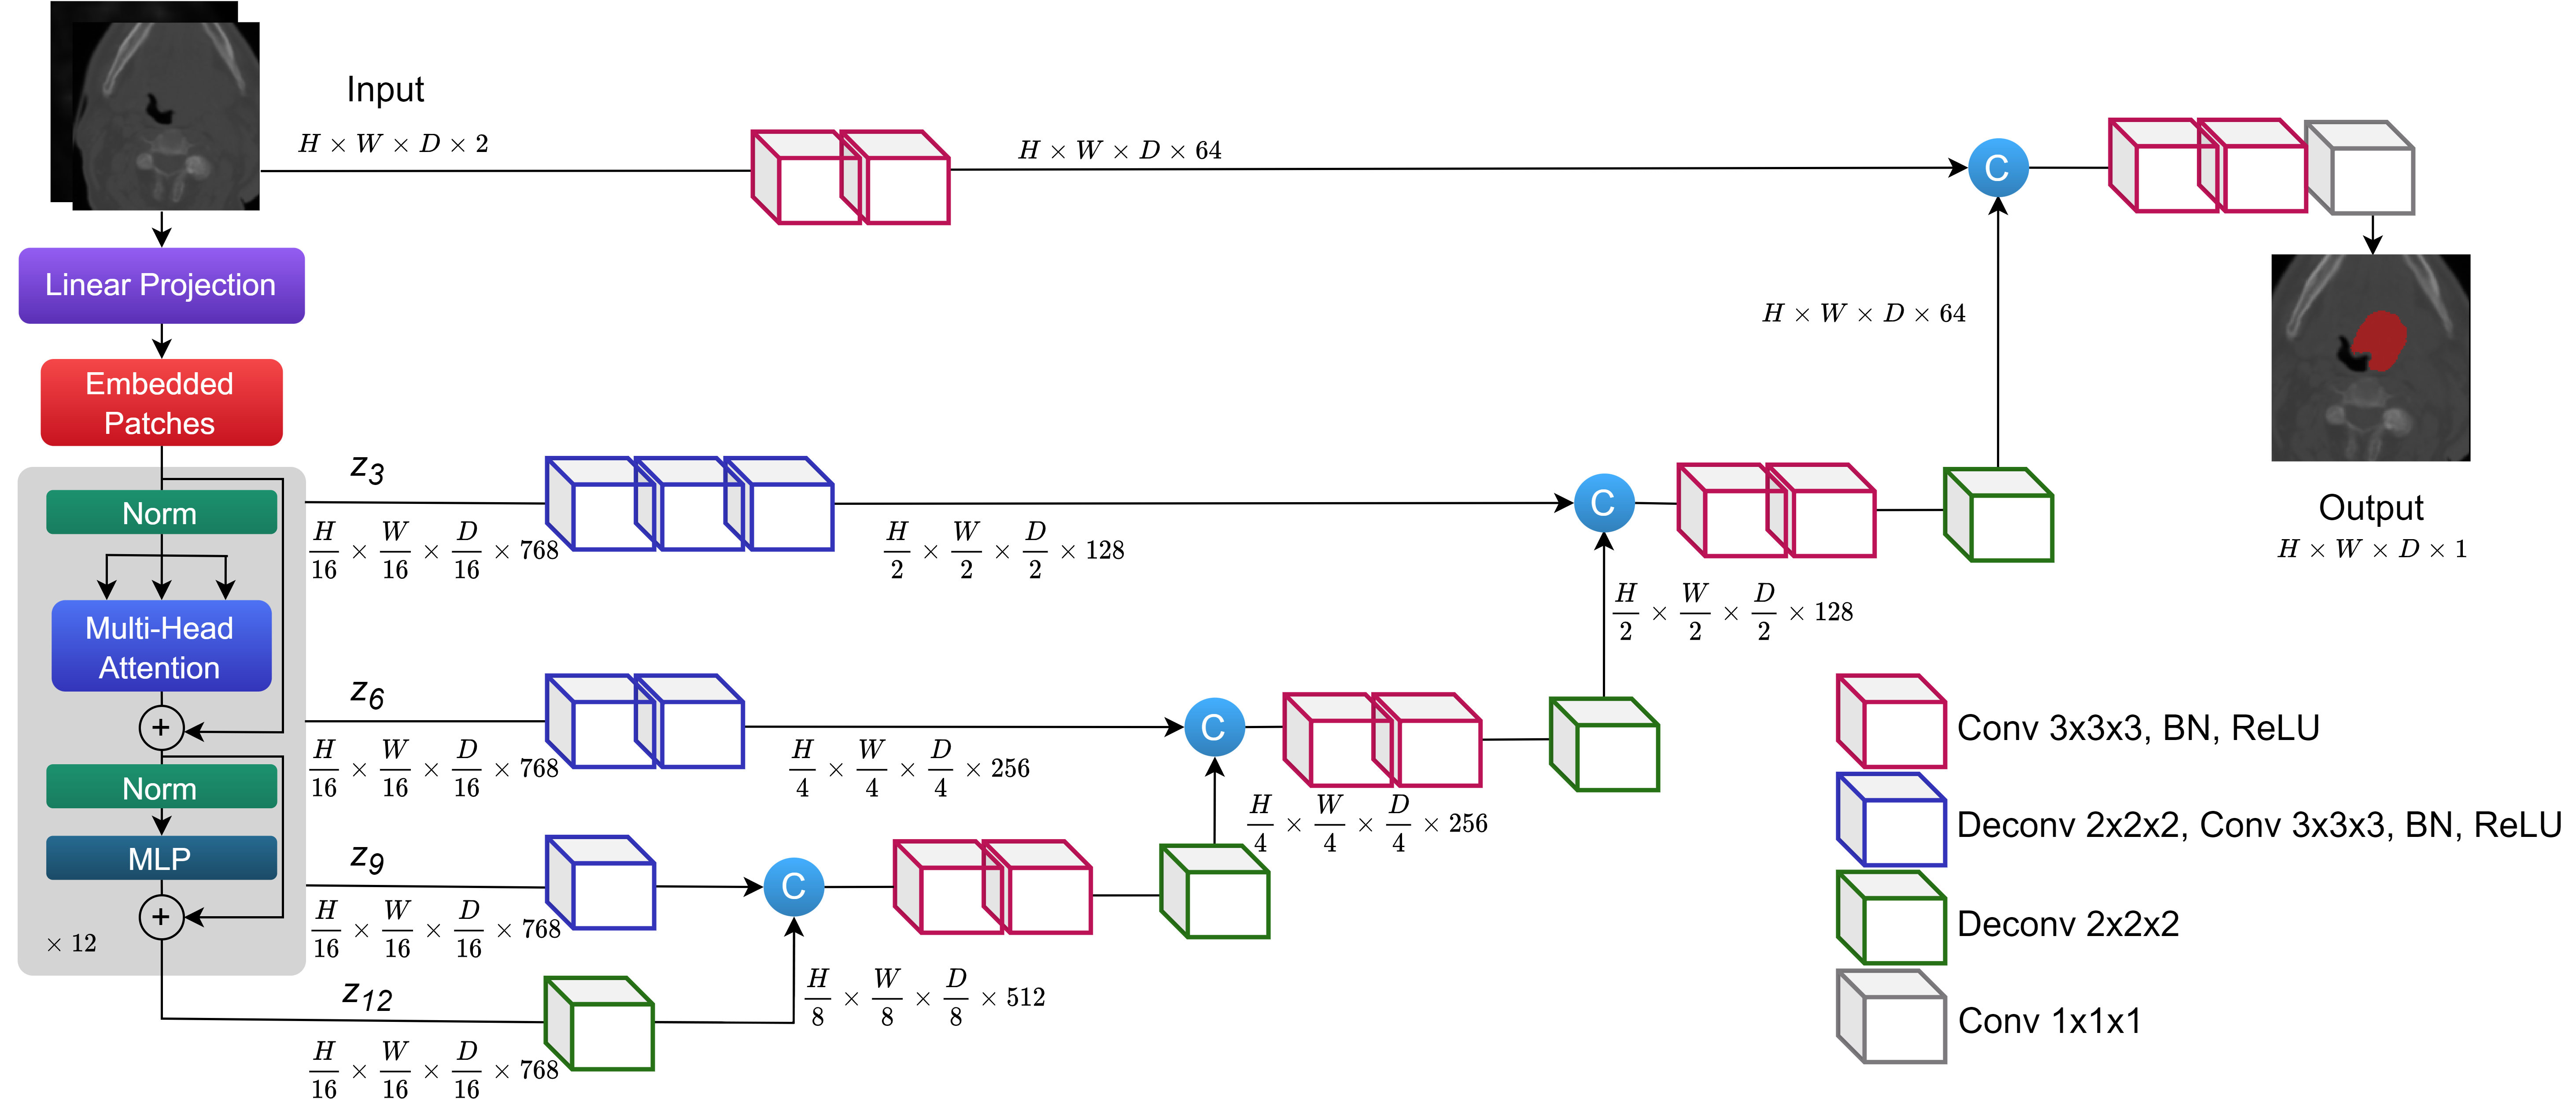
Since their success in NLP, transformers have started to gain a lot of interest in the computer vision community. Inspired by UNETR Hatamizadeh et al. (2021), we developed a transformer-based model in the task of H&N tumor segmentation to compare it to solely CNN-empowered models. UNETR is a transformer-driven encoder and CNN-based decoder model. To further explain it, a 3D input image gets split into several flattened uniform non-overlapping patches and embedded with a linear layer before going into the transformer block. The transformer layers are the same as the original ViT architecture Dosovitskiy et al. (2021), with input normalization, multi-head attention, and multi-layer perceptron sub-layers. The transformers produce outputs at different layers (0, 3, 6, 9, and 12), 0 being the original input image and 12 being the last layer output, as skip connections to the decoder path. Before getting concatenated to the decoder path, these outputs undergo 3D upsampling and 3D convolution blocks to get to the desired sizes. Lastly, the final output is passed through a convolutional block followed by a softmax activation function to reach voxel-level segmentation. The architecture is depicted in \figurerefmodel_arch.
In our experiments, UNETR has ViT-B16 model as a backbone with 12 layers, an embedding size of 768, a patch resolution of . All the UNETR models were trained with the batch size of 8, utilizing an AdamW optimizer with a learning rate of 1e-3 for 800 epochs. The reason as to why the model is trained for 800 epochs was only to explore it in depth. A combination of soft dice loss and focal loss is used for training. Input and output channels were adapted for our task, with two input channels for CT and PET and one output channel for the segmentation mask.
NA MR,RT MR,RT,ZM MR,RT,GC MR,RT,ED MR,RT,ZM,GC MR,RT,ZM,GC,ED MR,RT,GC,ED DSC 0.741 0.791 0.777 0.788 0.788 0.775 0.784 0.794 Precision 0.726 0.775 0.742 0.778 0.768 0.767 0.765 0.761 Recall 0.805 0.834 0.850 0.829 0.845 0.822 0.850 0.861
4 Results and Discussion
Metrics.
As metrics of comparison, we report the dice similarity coefficient (DSC), precision and recall. The main reason behind this is that the challenge organizers assess the quality of the model using these metrics. On top of that, they can be used to compare our work to other previous work done in a similar domain.
Augmentation Results.
The transformer-driven model was trained with several sets of data augmentations as well as with no augmentation to validate the importance of augmentations. For this group of experiments, we are using only one split of data (169 for training and 55 for validation) since our goal is to identify the right set of augmentations. \tablereftab:augmentations_resultss lists down the results of utilizing these data augmentations. With no augmentation, the model could achieve the DSC score of 0.741, precision of 0.726 and recall of 0.805. With all the augmentations, the results showed improvement in all three metrics, proving how important the augmentation process is for our model. Zooming with a factor of 1.25 did not show much improvement. It is hypothesized that zooming helps with information preservation when downsampling using CNNs, but UNETR downsamples using a ViT backbone, and zooming did not show effectiveness in case of transformers-based downsampling. The combination of mirroring, rotation, gamma correction on PET scans, and elastic deformation yielded the highest DSC and recall of 0.794 and 0.861 respectively, and precision of 0.761 for this split. Mirroring and rotation contributed the most to the score improvement because the head and neck structure of human is symmetric, and they would expose the model to a wider range of realistic samples, making the model more robust to unseen data. Lastly, gamma correction and elastic deformation, when combined, had a slight contribution to the score improvement because they made the model more exposed to varying PET intensities and shapes of tumor.
|
Testing Set UNETR 0.736 0.773 0.760 | ||||||||||||||||||||
Cross Validation Results.
The UNETR model was cross validated in a leave-one-center-out fashion. Since the training data comes from five different centers (sixth center is kept for testing, which we are not using), this approach of cross validation is preferred over, for example, k-fold cross validation. The reason of this choice lies at the fact that the model is supposed to be robust to new data, and training it on four random centers and validating on a different one tests this hypothesis. Another reason is that the total number of scans is different in each center of five. This forces the model to learn with various numbers of training and validation data, imitating a real-world scenario. UNETR is trained using the highest achieving data augmentations: a set of mirroring, rotation, gamma correction and elastic deformation. The model performed slightly different in metrics for each split, reaching a mean DSC of 0.736 (±0.043), precision of 0.766 (±0.022), and recall of 0.766 (±0.058) as reported in \tablereftab:final_results.
Comparison of Models.
The transformer-based model results are compared to CNN-driven models. In particular, two models are selected and trained as the original works: SE-based U-Net Iantsen et al. (2021) that won the 2020 competition, and nnU-Net Isensee et al. (2018) that claims that the model is automatically configured to the task and generates the highest results U-Net can ever produce. The SE-based U-Net, nnU-Net, and UNETR were all trained from scratch and cross validated in a leave-one-center-out fashion. UNETR achieves a mean DSC of 0.736 (±0.043 standard deviation) that is only 0.012 and 0.021 lower than the powerful nnU-Net and SE-based U-Net respectively, proving the capability of the transformer-based model when trained from scratch.
Testing Results.
The organizers of the HECKTOR committee have kindly checked the UNETR predictions on the testing set. Therefore, we were able to obtain the results on the testing set. The metrics are highly similar to the cross validation results, with a DSC, precision and recall of 0.736, 0.773, and 0.760 (compared to 0.736, 0.766, 0.766 in the validation set respectively).
Qualitative Results.
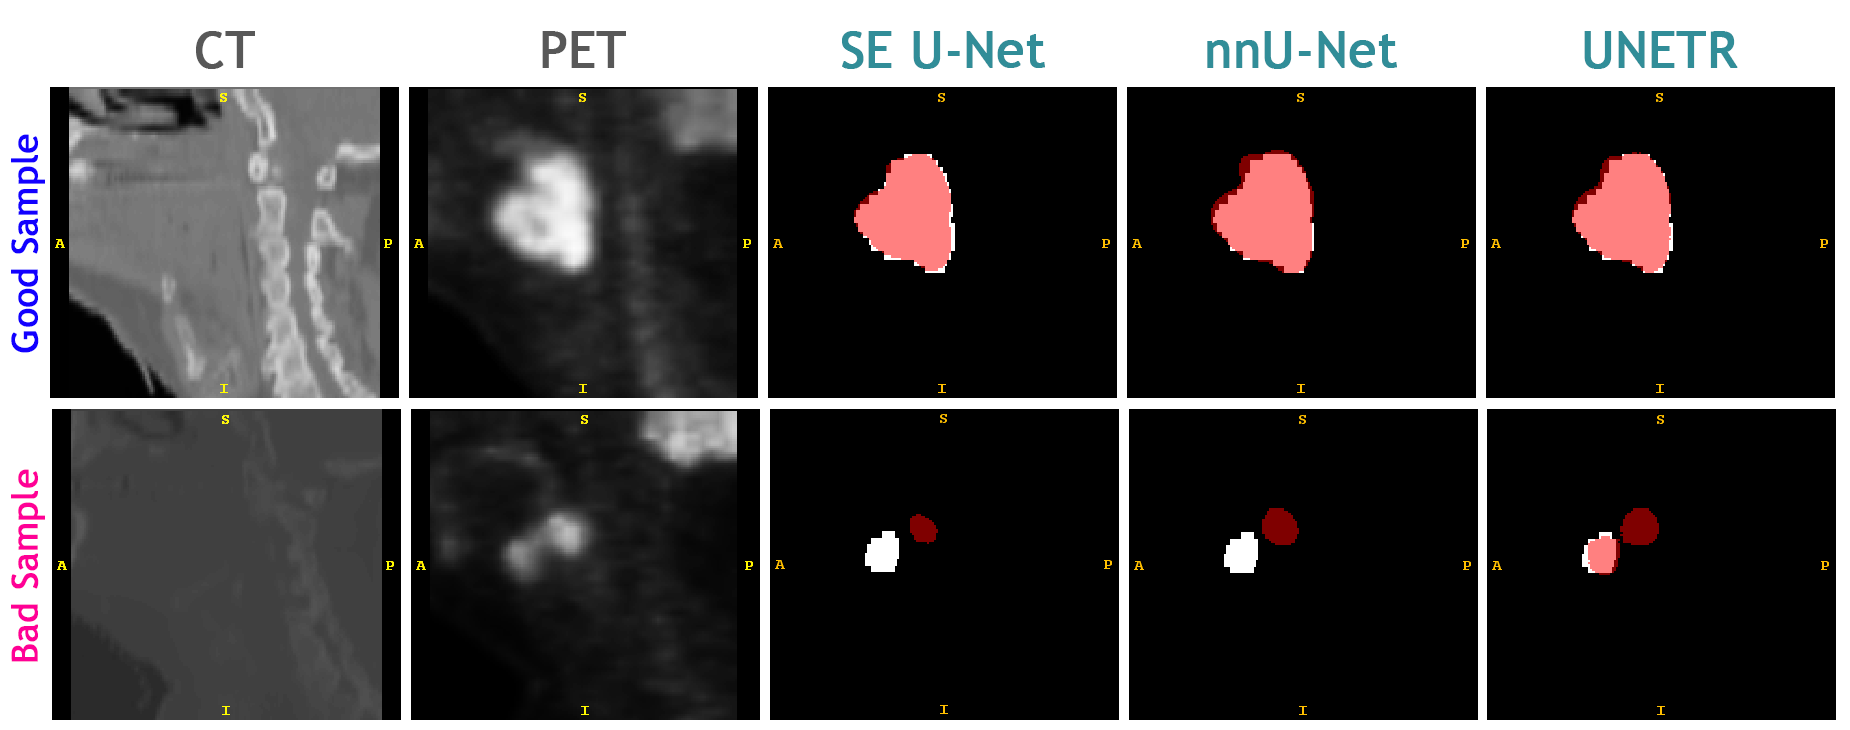
Further qualitative results were conducted to understand the models’ outputs. Prediction masks from each of the three models were compared to each other as well as to the ground truth. It is illustrated in \figurerefgood_bad_segments that all the three models produce very similar segmentation masks with very minor differences, and that is the case for most samples. First line of images show a sample where all the three models performed extremely well, whereas the lower example shows their incapabilities. It is noteworthy that all the models are heavily dependent on both CT and PET. CT provides sufficient structural information so that the models can locate the tumor region with respect to the background body structure, and PET provides clarity in intensity differentiation for the model to accurately pinpoint the tumor location as is distunguishable in \figurerefgood_bad_segments.
More Qualitative Results.
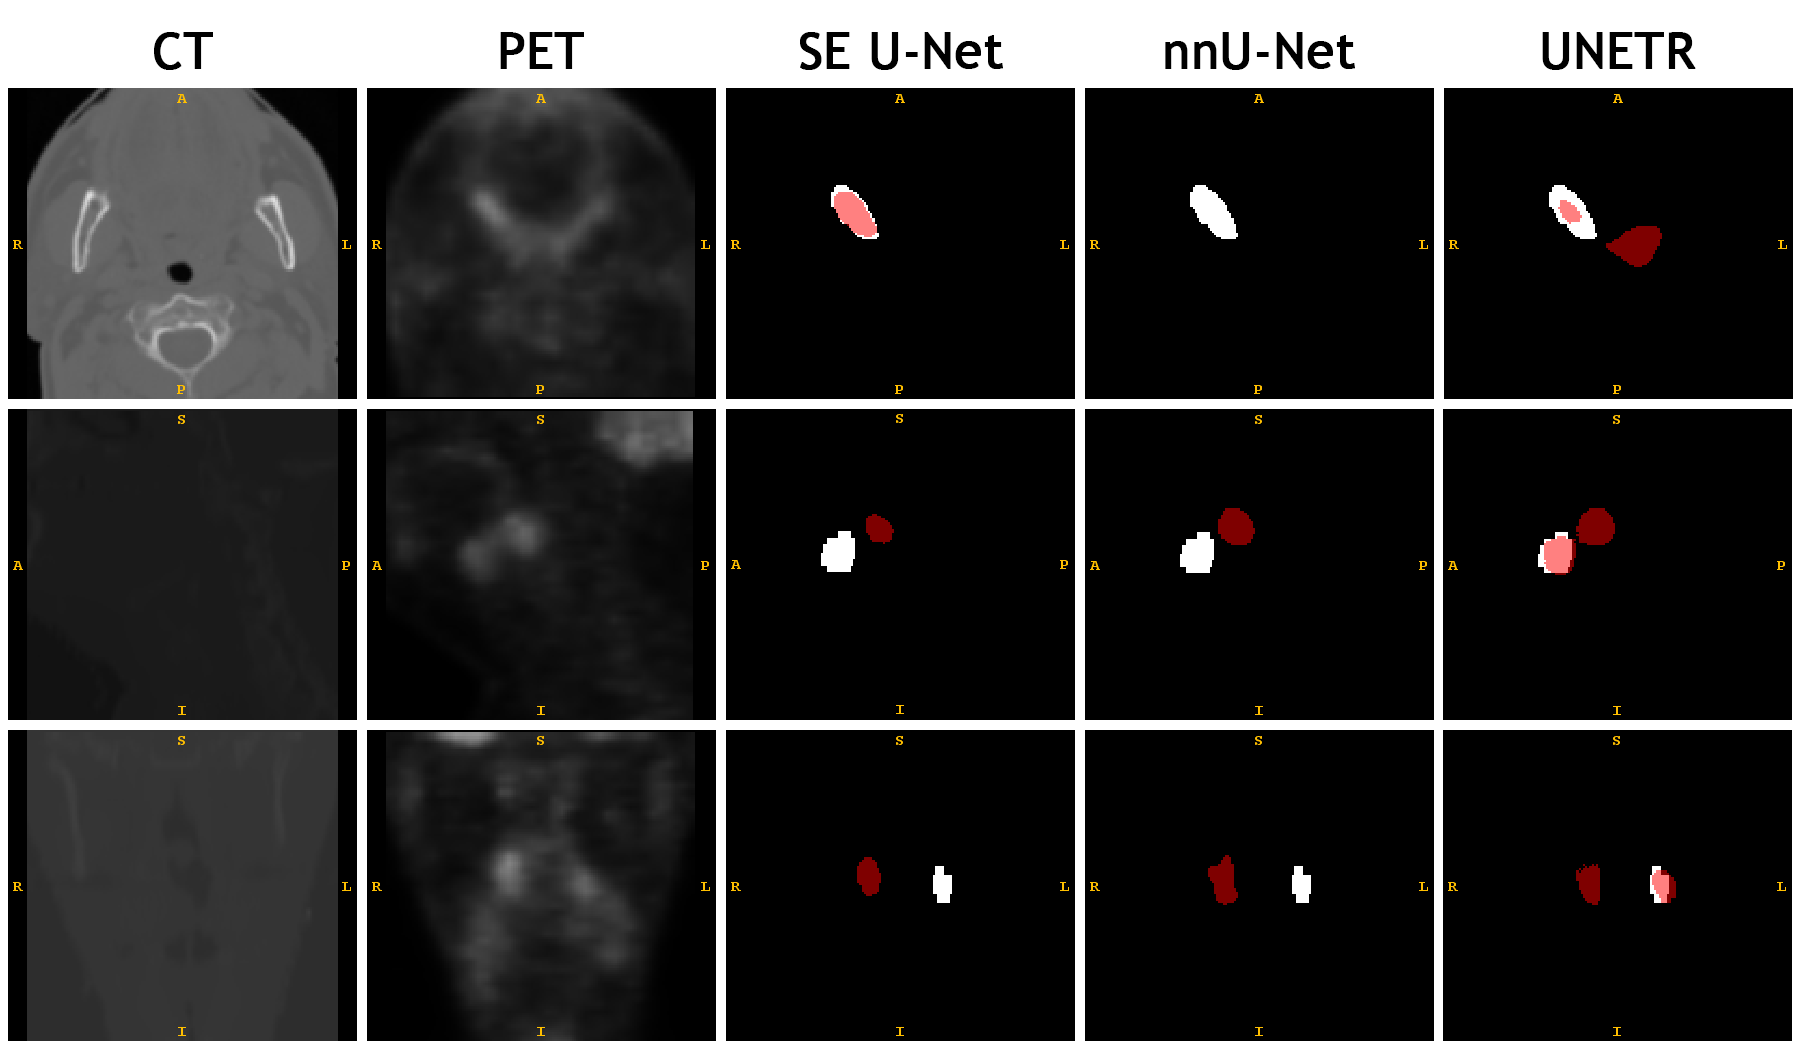
bad_segments in the Appendix shows examples with which the models struggled to segment. Such inaccuracies occur with only a certain set of scans. To further investigate as to why all the models are struggling to segment the tumor regions in these specific cases, the scans with the lowest DSC were extracted and examined. Primarily, three major commonalities are the reasons for the struggle of the models, as exemplified in \figurereffig:bad_sample in the Appendix. First, when the PET scan does not have a well-outlined intensity value at the region of the tumor, the models often produce a faulty output, segmenting another region with high PET intensity values. Second, the tumors are fairly smaller in size in these scans than other scans with high scores. When detecting tiny regions with a larger background abundant in data, the models commonly find it hard to figure out where to focus on. Finally, most of these scans suffer from artifacts, mainly streak, in CT that introduce irregularities in data, thereby causing the model to missegment. The streak artifacts are present near the tooth area, and are presumed to be caused by dental implants.
5 Conclusion
Automation of H&N tumor segmentation is a crucial task that should be studied in details. In this work, we studied a transformer-based model to tackle this problem and investigate its performance with respect to two common CNN models. We showed that transformers can come close to CNNs, reaching similar results. The transformer-driven model achieved a mean DSC of 0.736 (±0.043), precision of 0.766 (±0.022), and recall of 0.766 (±0.058) when it is trained from scratch. On the HECKTOR testing set, the model showed similar results (DSC of 0.736, precision of 0.773, and recall of 0.760). Reported results suggest that the utilized vision transformer network is slightly less accurate than well-mature CNN-based architectures. Although this can be considered a limitation, we believe that CNNs have gone through several improvements over the last few years while transformers are yet to be investigated in details. Furthermore, since self-supervised pretraining has been a key for transformers’ success in the NLP domain, we hypothesize that self-supervised based pretraining should be further explored in case of transformer-based models in image segmentation.
We thank the organizers of the HECKTOR challenge, Vincent Andrearczyk in particular, for their help with providing the results for the testing set. We also thank our colleagues Numan Saeed and Hashmat Shadab Malik for their fruitful discussions for the improvement of the paper.
References
- Andrearczyk et al. (2021) Vincent Andrearczyk, Valentin Oreiller, and Adrien Depeursinge. Head and neck tumor segmentation in pet/ct. Medical Image Analysis, 2021. URL https://www.aicrowd.com/challenges/miccai-2021-hecktor.
- Baijens et al. (2020) Laura W. J. Baijens, Margaret Walshe, Leena-Maija Aaltonen, Christoph Arens, Reinie Cordier, Patrick Cras, Lise Crevier-Buchman, Chris Curtis, Wojciech Golusinski, Roganie Govender, Jesper Grau Eriksen, Kevin Hansen, Kate Heathcote, Markus M. Hess, Sefik Hosal, Jens Peter Klussmann, C. René Leemans, Denise MacCarthy, Beatrice Manduchi, Jean-Paul Marie, Reza Nouraei, Claire Parkes, Christina Pflug, Walmari Pilz, Julie Regan, Nathalie Rommel, Antonio Schindler, Annemie M. W. J. Schols, Renee Speyer, Giovanni Succo, Irene Wessel, Anna C. H. Willemsen, Taner Yilmaz, and Pere Clavé. European white paper: oropharyngeal dysphagia in head and neck cancer. European Archives of Oto-Rhino-Laryngology, 278(2):577–616, December 2020. 10.1007/s00405-020-06507-5. URL https://doi.org/10.1007/s00405-020-06507-5.
- Chen et al. (2021) Jieneng Chen, Yongyi Lu, Qihang Yu, Xiangde Luo, Ehsan Adeli, Yan Wang, Le Lu, Alan L. Yuille, and Yuyin Zhou. Transunet: Transformers make strong encoders for medical image segmentation. CoRR, abs/2102.04306, 2021. URL https://arxiv.org/abs/2102.04306.
- Chen et al. (2016) Liang-Chieh Chen, George Papandreou, Iasonas Kokkinos, Kevin Murphy, and Alan L. Yuille. Deeplab: Semantic image segmentation with deep convolutional nets, atrous convolution, and fully connected crfs. CoRR, abs/1606.00915, 2016. URL http://arxiv.org/abs/1606.00915.
- Çiçek et al. (2016) Özgün Çiçek, Ahmed Abdulkadir, Soeren S. Lienkamp, Thomas Brox, and Olaf Ronneberger. 3d u-net: Learning dense volumetric segmentation from sparse annotation. In Sebastien Ourselin, Leo Joskowicz, Mert R. Sabuncu, Gozde Unal, and William Wells, editors, Medical Image Computing and Computer-Assisted Intervention – MICCAI 2016, pages 424–432, Cham, 2016. Springer International Publishing. ISBN 978-3-319-46723-8.
- Dosovitskiy et al. (2021) Alexey Dosovitskiy, Lucas Beyer, Alexander Kolesnikov, Dirk Weissenborn, Xiaohua Zhai, Thomas Unterthiner, Mostafa Dehghani, Matthias Minderer, Georg Heigold, Sylvain Gelly, Jakob Uszkoreit, and Neil Houlsby. An image is worth 16x16 words: Transformers for image recognition at scale, 2021.
- Feng et al. (2020) Xue Feng, Nicholas J. Tustison, Sohil H. Patel, and Craig H. Meyer. Brain tumor segmentation using an ensemble of 3d u-nets and overall survival prediction using radiomic features. Frontiers in Computational Neuroscience, 14:25, 2020. ISSN 1662-5188. 10.3389/fncom.2020.00025. URL https://www.frontiersin.org/article/10.3389/fncom.2020.00025.
- Hatamizadeh et al. (2021) Ali Hatamizadeh, Yucheng Tang, Vishwesh Nath, Dong Yang, Andriy Myronenko, Bennett Landman, Holger Roth, and Daguang Xu. Unetr: Transformers for 3d medical image segmentation, 2021.
- Iantsen et al. (2021) Andrei Iantsen, Dimitris Visvikis, and Mathieu Hatt. Squeeze-and-excitation normalization for automated delineation of head and neck primary tumors in combined pet and ct images. Lecture Notes in Computer Science, page 37–43, 2021. ISSN 1611-3349. 10.1007/978-3-030-67194-5_4. URL http://dx.doi.org/10.1007/978-3-030-67194-5_4.
- Isensee et al. (2018) Fabian Isensee, Jens Petersen, André Klein, David Zimmerer, Paul F. Jaeger, Simon Kohl, Jakob Wasserthal, Gregor Köhler, Tobias Norajitra, Sebastian J. Wirkert, and Klaus H. Maier-Hein. nnu-net: Self-adapting framework for u-net-based medical image segmentation. CoRR, abs/1809.10486, 2018. URL http://arxiv.org/abs/1809.10486.
- Jiayun et al. (2018) Li Jiayun, Sarma Karthik V., Chung Ho King, Gertych Arkadiusz, S. Knudsen Beatrice, and W. Arnold Corey. Medicala multi-scale u-net for semantic segmentation of histological images from radical prostatectomies. AMIA Annu Symp Proc, 2018.
- Litjens et al. (2017) Geert Litjens, Thijs Kooi, Babak Ehteshami Bejnordi, Arnaud Arindra Adiyoso Setio, Francesco Ciompi, Mohsen Ghafoorian, Jeroen A.W.M. van der Laak, Bram van Ginneken, and Clara I. Sánchez. A survey on deep learning in medical image analysis. Medical Image Analysis, 42:60–88, 2017. ISSN 1361-8415. https://doi.org/10.1016/j.media.2017.07.005. URL https://www.sciencedirect.com/science/article/pii/S1361841517301135.
- Ma and Yang (2020) Jun Ma and Xiaoping Yang. Combining cnn and hybrid active contours for head and neck tumor segmentation in ct and pet images, 2020.
- Menze et al. (2015) Bjoern H. Menze, Andras Jakab, Stefan Bauer, Jayashree Kalpathy-Cramer, Keyvan Farahani, Justin Kirby, Yuliya Burren, Nicole Porz, Johannes Slotboom, Roland Wiest, Levente Lanczi, Elizabeth Gerstner, Marc-André Weber, Tal Arbel, Brian B. Avants, Nicholas Ayache, Patricia Buendia, D. Louis Collins, Nicolas Cordier, Jason J. Corso, Antonio Criminisi, Tilak Das, Hervé Delingette, Çağatay Demiralp, Christopher R. Durst, Michel Dojat, Senan Doyle, Joana Festa, Florence Forbes, Ezequiel Geremia, Ben Glocker, Polina Golland, Xiaotao Guo, Andac Hamamci, Khan M. Iftekharuddin, Raj Jena, Nigel M. John, Ender Konukoglu, Danial Lashkari, José António Mariz, Raphael Meier, Sérgio Pereira, Doina Precup, Stephen J. Price, Tammy Riklin Raviv, Syed M. S. Reza, Michael Ryan, Duygu Sarikaya, Lawrence Schwartz, Hoo-Chang Shin, Jamie Shotton, Carlos A. Silva, Nuno Sousa, Nagesh K. Subbanna, Gabor Szekely, Thomas J. Taylor, Owen M. Thomas, Nicholas J. Tustison, Gozde Unal, Flor Vasseur, Max Wintermark, Dong Hye Ye, Liang Zhao, Binsheng Zhao, Darko Zikic, Marcel Prastawa, Mauricio Reyes, and Koen Van Leemput. The multimodal brain tumor image segmentation benchmark (brats). IEEE Transactions on Medical Imaging, 34(10):1993–2024, 2015. 10.1109/TMI.2014.2377694.
- O’rorke et al. (2012) M.A. O’rorke, Ellison M.V., Murray L.J., Moran M., James J., and Anderson L.A.”. Human papillomavirus related head and neck cancer survival: a systematic review and meta-analysis. Oral Oncol, 48(12):1191–1201, 2012. https://doi.org/10.1016/j.oraloncology.2012.06.019.
- Ronneberger et al. (2015) Olaf Ronneberger, Philipp Fischer, and Thomas Brox. U-net: Convolutional networks for biomedical image segmentation. In Nassir Navab, Joachim Hornegger, William M. Wells, and Alejandro F. Frangi, editors, Medical Image Computing and Computer-Assisted Intervention – MICCAI 2015, pages 234–241, Cham, 2015. Springer International Publishing. ISBN 978-3-319-24574-4.
- Ulyanov et al. (2016) Dmitry Ulyanov, Andrea Vedaldi, and Victor S. Lempitsky. Instance normalization: The missing ingredient for fast stylization. CoRR, abs/1607.08022, 2016. URL http://arxiv.org/abs/1607.08022.
- Wang et al. (2021) Wenxuan Wang, Chen Chen, Meng Ding, Jiangyun Li, Hong Yu, and Sen Zha. Transbts: Multimodal brain tumor segmentation using transformer. CoRR, abs/2103.04430, 2021. URL https://arxiv.org/abs/2103.04430.
- Xie et al. (2021) Yutong Xie, Jianpeng Zhang, Chunhua Shen, and Yong Xia. Cotr: Efficiently bridging CNN and transformer for 3d medical image segmentation. CoRR, abs/2103.03024, 2021. URL https://arxiv.org/abs/2103.03024.
- Xu et al. (2021) Guoping Xu, Xingrong Wu, Xuan Zhang, and Xinwei He. Levit-unet: Make faster encoders with transformer for medical image segmentation. CoRR, abs/2107.08623, 2021. URL https://arxiv.org/abs/2107.08623.
- Yuan (2020) Yading Yuan. Automatic head and neck tumor segmentation in pet/ct with scale attention network. medRxiv, 2020. 10.1101/2020.11.11.20230185. URL https://www.medrxiv.org/content/early/2020/11/15/2020.11.11.20230185.
- Zhang et al. (2021) Yundong Zhang, Huiye Liu, and Qiang Hu. Transfuse: Fusing transformers and cnns for medical image segmentation. CoRR, abs/2102.08005, 2021. URL https://arxiv.org/abs/2102.08005.
- Zhang et al. (2017) Zhengxin Zhang, Qingjie Liu, and Yunhong Wang. Road extraction by deep residual u-net. CoRR, abs/1711.10684, 2017. URL http://arxiv.org/abs/1711.10684.
- Zhu et al. (2021) Xiner Zhu, Haoji Hu, Hualiang Wang, Jincao Yao, Di Ou, Dong Xu, et al. Region aware transformer for automatic breast ultrasound tumor segmentation. Proceedings of Machine Learning Research, 2021.
Appendix
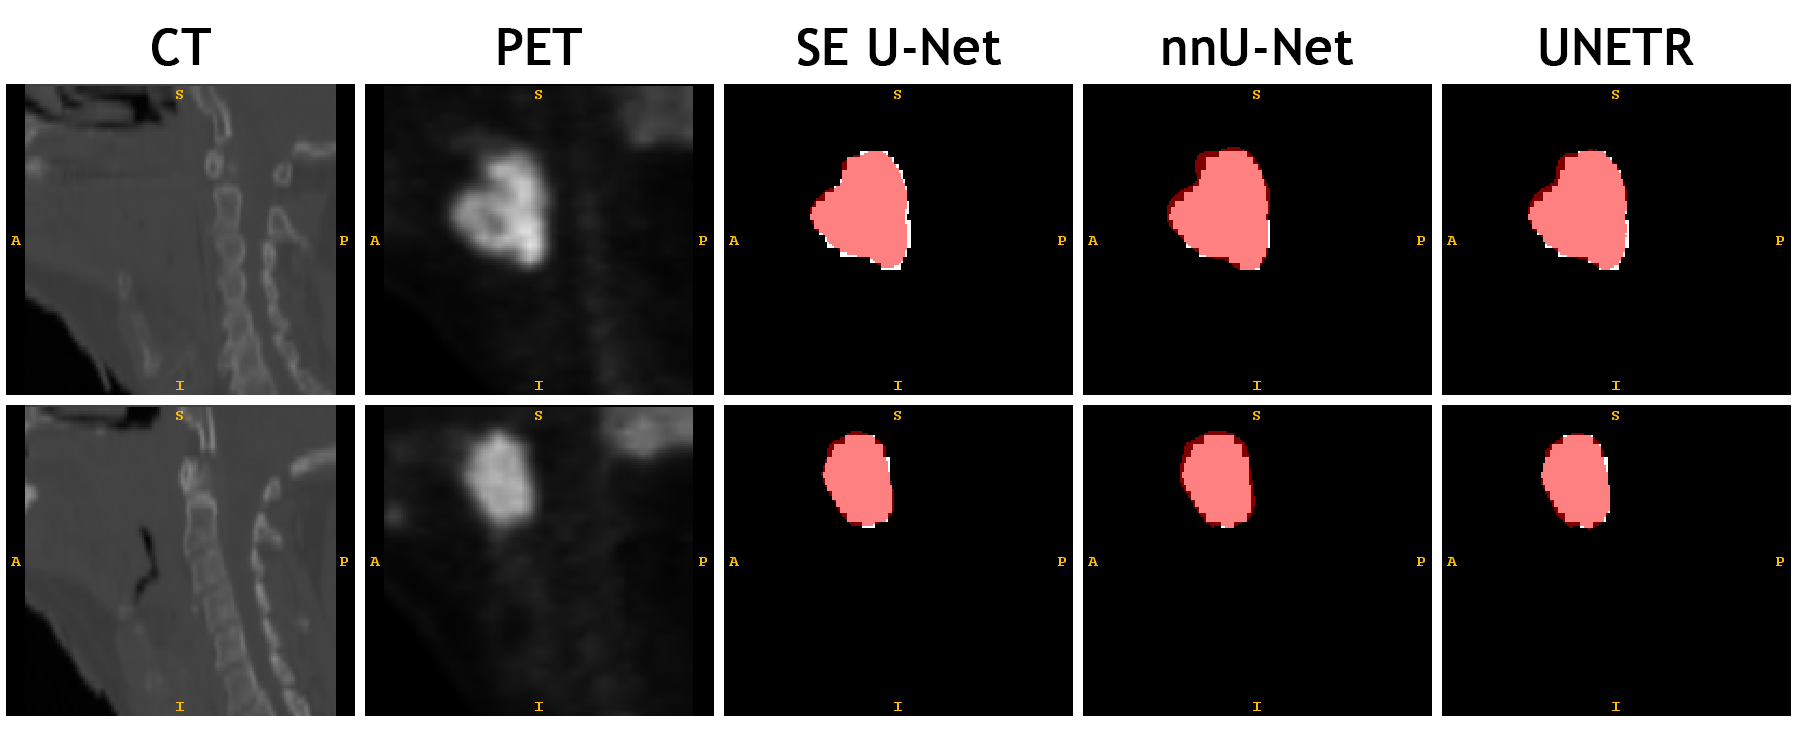
fig:bad_sample\subfigure[CT]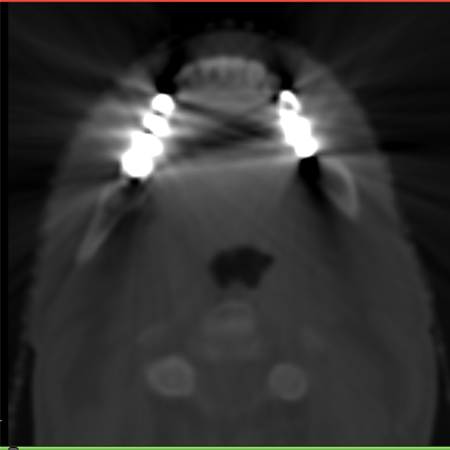 \subfigure[PET]
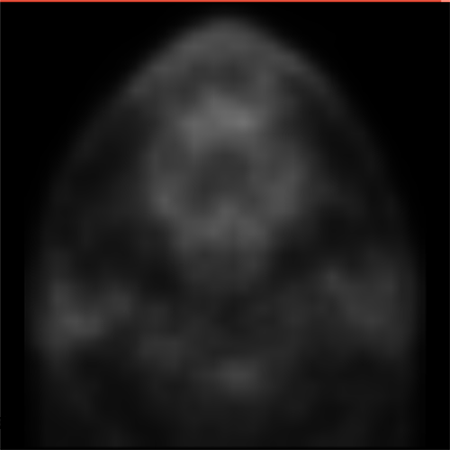 \subfigure[Mask]