Two-Photon Excitation Spectroscopy of Silicon Quantum Dots and Ramifications for Bio-Imaging
Abstract
Two-photon excitation in the near-infrared (NIR) of colloidal nanocrystalline silicon quantum dots (nc-SiQDs) with photoluminescence also in the NIR has the potential to open up new opportunities in the field of deep biological imaging. Spectra of the degenerate two-photon absorption (2PA) cross section of colloidal nc-SiQDs are measured using two-photon excitation over a spectral range eV (wavelength nm) above the two-photon band gap , and at a representative photon energy eV ( nm) below this gap. Two-photon excited photoluminescence (2PE-PL) spectra of nc-SiQDs with diameters and nm, each passivated with 1-dodecene and dispersed in toluene, are calibrated in strength against 2PE-PL from a known concentration of Rhodamine B dye in methanol. The 2PA cross section is observed to be smaller for the smaller diameter nanocrystals and the onset of 2PA is observed to be blueshifted from the two-photon indirect band gap of bulk Si, as expected for quantum confinement of excitons. The efficiencies of nc-SiQDs for bio-imaging using 2PE-PL are simulated in various biological tissues and compared to other quantum dots and molecular fluorophores and found to be superior at greater depths.
keywords:
two-photon absorption spectra, two-photon absorption cross section, silicon nanocrystals, quantum dots, two-photon excited photoluminescence, bio-imagingUniversity of Texas at Austin] Department of Physics, University of Texas at Austin, 2515 Speedway, C1600, Austin, TX USA 78712 University of Texas at Austin] McKetta Department of Chemical Engineering, University of Texas at Austin, 200 E. Dean Keeton St., C0400, Austin, TX USA 78712 University of Texas at Austin] McKetta Department of Chemical Engineering, University of Texas at Austin, 200 E. Dean Keeton St., C0400, Austin, TX USA 78712 Centro de Investigaciones en Óptica] Centro de Investigaciones en Óptica, A.C., Loma del Bosque 115, Colonia Lomas del Campestre, León, Gto., México 37150 Centro de Investigaciones en Óptica] Centro de Investigaciones en Óptica, A.C., Loma del Bosque 115, Colonia Lomas del Campestre, León, Gto., México 37150 Centro de Investigaciones en Óptica] Centro de Investigaciones en Óptica, A.C., Loma del Bosque 115, Colonia Lomas del Campestre, León, Gto., México 37150 Centro de Investigaciones en Óptica] Centro de Investigaciones en Óptica, A.C., Loma del Bosque 115, Colonia Lomas del Campestre, León, Gto., México 37150 University of Texas at Austin] McKetta Department of Chemical Engineering, University of Texas at Austin, 200 E. Dean Keeton St., C0400, Austin, TX USA 78712 \alsoaffiliation[Texas Materials Institute]Texas Materials Institute, University of Texas at Austin, 204 E. Dean Keeton St., C2201, Austin, TX USA 78712 University of Texas at Austin] Department of Physics, University of Texas at Austin, 2515 Speedway, C1600, Austin, TX USA 78712
1 Introduction
Numerous photonic applications for nanocrystalline semiconductor quantum dots have emerged in recent years, including spin qubits in photonic networks,1, 2, 3, 4 quantum dot light-emitting diodes (LEDs),5, 6, 7, 8 in vitro and in vivo biological imaging,9, 10, 11, 12, 13, 14, 15 and cancer therapy.12, 16, 17 Some of these applications use two-photon absorption (2PA) directly to excite photoluminescence (PL), taking advantage of the availability of ultrashort, high-peak-intensity laser sources and/or high sample transparency at the excitation wavelength. In other applications, 2PA is an undesired performance inhibitor that must be understood and managed. Prior measurements of 2PA in nc-SiQDs are either single wavelength measurements or do not characterize the sample sufficiently to extract a 2PA cross section, but rather only the 2PA dispersion.9, 18, 19, 20, 21, 22, 23, 24 Here we measure two-photon excited photoluminescence (2PE-PL) spectra of colloidal nanocrystalline silicon quantum dots (nc-SiQDs)9, 25, 26 of diameters and nm over an excitation photon energy (wavelength) range eV ( nm) above the two-photon band gap of the quantum dots, and at a representative photon energy (wavelength) eV ( nm) below this gap. We extract 2PA cross sections over this range from the results. Nanocrystalline SiQDs luminesce efficiently in response to excitation in this range, a feature that bio-imaging applications such as two-photon excitation microscopy exploit.9, 10, 11, 12, 27, 28, 29 In these applications, nc-SiQDs offer nontoxicity,30, 31 aqueous solution dispersibility,9, 25, 26 and size-dependent emission spectra32, 33 as advantages over photoluminescent dyes, while 2PE offers the advantage over one-photon excitation (1PE) of high tissue transparency and penetration depth at the excitation wavelength. Results presented here will aid in choosing excitation wavlength and nanocrystal size for bio-imaging applications, and will provide data for comparison with first-principles computations of 2PA in nc-SiQDs.
The electronic structure of nc-SiQDs consists of discrete energy levels as in molecules, rather than continuous bands as in bulk crystals.34 The energy levels of nc-SiQDs originate primarily from quantum-confined excitons, but surface, interface, and defect states can also contribute.35 Exciton recombination dominates red and near infrared PL, while surface, interface, and defect states are believed to contribute to green and blue PL.35 The latter, however, are not observed from the surface-passivated nc-SiQDs studied in this work. We will ascribe PL across the band gap of the quantum dots generically to a LUMO-HOMO transition, where LUMO (HOMO) refer to a lowest unoccupied (highest occupied) molecular orbital prior to excitation. For nm diameter, the HOMO-LUMO gap and PL quantum yield both increase with decreasing . This tunability of the PL spectrum is attractive for many applications, although it is limited in nc-SiQDs to eV.36
Selection rules for excitation by one-photon absorption (1PA) and 2PA can differ. In centrosymmetric molecules they are mutually exclusive, since 1PA electric dipole transitions are parity-forbidden while their 2PA counterparts are parity-allowed. In this case, 1PA and 2PA excite complementary states.37 However, at room temperature the PL spectra and PL quantum yields of nc-SiQDs are nearly the same for both modes of excitation.37 Therefore, monitoring the spectrally-integrated 2PE-PL spectra as a function of incident light intensity can indirectly be used to measure the 2PA cross section.38
2 Results and Discussion
2.1 Characterization of 1-Dodecene-Passivated Colloidal nc-SiQDs
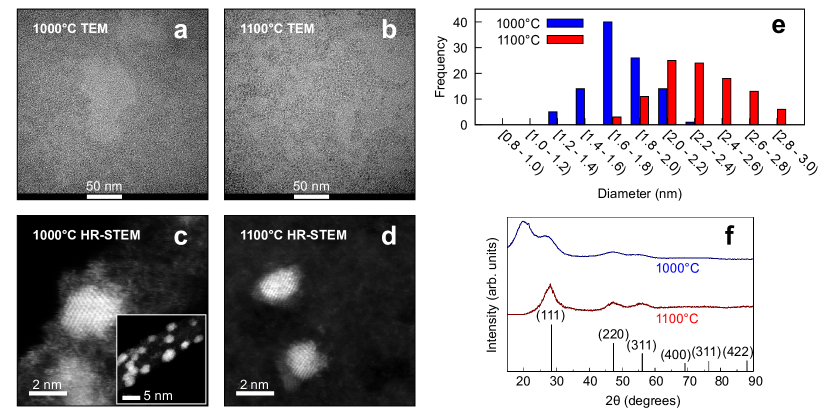
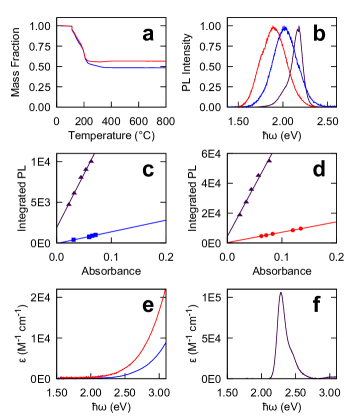
The nc-SiQDs studied in this work were synthesized by thermal decomposition of hydrogen silsesquioxane at annealing temperatures of C and C which yielded nc-SiQDs with size distributions of nm and nm, respectively, as determined by transmission electron microscopy (TEM) [see Figure 1(a)-(b), and (e)]. The nc-SiQDs were passivated with 1-dodecene and dispersed in toluene. The Si quantum dots are confirmed to be crystalline by the presence of (111), (220), and (311) diffraction peaks for each of these crystal planes in crystalline Si by X-ray diffraction (XRD) [see Figure 1(f)]. The broad peak near seen in the nc-SiQD sample annealed at C but not in the sample annealed at C is likely due to the 1-dodecene ligand. This broad peak is expected to be more visible in the C nc-SiQD sample due to the lower mass fraction of Si core to 1-dodecene. Thermal gravimetric analysis (TGA) was performed in order to determine the relative mass of the Si core to 1-dodecene. This is necessary to relate the mass concentration of a sample to a number density such that a 2PA cross section per quantum dot can be calculated. The mass fraction vs. temperature curves are shown in Figure 2(a). One-photon excited PL (1PE-PL) of nc-SiQDs and Rhodamine B (RhB), excited at eV, are shown in Figure 2(b). The quantum yields () of the nc-SiQDs were determined by comparing the integrated 1PE-PL emission spectra to that of a known reference standard, RhB in anhydrous ethanol. Integrated PL is plotted against absorbance for various concentrations of both nc-SiQDs and RhB, shown in Figure 2(c)-(d). The ratio of the gradient of the trendline of luminescence intensity vs. absorbance of nc-SiQDs to that of RhB is proportional to the quantum yield. The calculated quantum yields for the nc-SiQDs in this study are for nm and for nm. The molar absorptivities of the nc-SiQD samples were calculated and are shown in Figure 2(e) and the molar absorptivity of RhB from Du et al.39 is shown in Figure 2(f).
2.2 2PE-PL Measurements
We two-photon excited PL using laser pulses from an optical parametric amplifier (OPA). The output power of the OPA is sufficient to observe 2PE-PL except in the range eV, where operation switches from second-order frequency mixing of the signal to second harmonic generation (SHG) from the idler. The PL spectra of the samples were recorded as a function of incident pulse energy. An example of 2PE-PL spectra for the nc-SiQD samples and RhB dye excited at eV is shown in Figure 3. The 2PE-PL spectral shape did not differ from 1PE-PL (see the Supporting Information). The observed spectra includes scattered laser light in addition to the PL emitted from the sample, and since the laser lineshape sometimes overlaps with the PL spectra, this has to be removed. The PL spectra is proportional to the PL photon number within a photon energy bin of width centered at . It can be empirically modeled as a sum of two Gaussian peaks and the laser lineshape is modeled as a Lorentzian. The total detected spectra is then described by the sum of these spectral lineshapes.

The total number of detectable emitted PL photons is given by
| (1) |
where eV and eV are the detector limits for the spectrometer. The lineshape fitting parameters for the samples studied in this work are tabulated in the Supporting Information.
The number of detected PL photons from a single excitation pulse is directly related to the excited state population after the pulse has propagated through the sample, , where characterizes the collection efficiency of the detector and is the PL quantum yield. The excited state population is driven by 2PA for which the attenuation of the incident beam with propagation distance is quadratic in its incident intensity ,
| (2) |
where is the 2PA coefficient, is the 2PA cross section, and is the ground state population density. Here we neglect free-carrier and linear absorption. for the samples can be assumed to be the same as measured using one-photon excitation since the PL emission spectra of the two excitation channels do not appreciably differ.37, 38 The value of can then be determined from fitting the intensity dependence of the PL from a reference standard for which , , and are known. Thus for the samples can be determined relative to the reference standard.
We can model the excitation of nc-SiQDs by 2PA as an effective two-level molecular system as long as the populations of higher energy excited states rapidly transition to the LUMO. The time rates-of-change of the excited () and ground state population densities are described by
| (3) | ||||
| (4) |
where is the photon energy of the excitation pulse and is the recombination rate. The initial conditions are and , where is the nc-SiQD number density and corresponds to the arrival of the driving pulse peak. The recombination times of the samples in this work are on the order of ns – s, which is much longer than the timescale of a laser pulse of fs but much shorter than the laser repetition period of ms, i.e., . Thus recombination can be neglected on the timescale of a pulse and the sample can be considered to be fully relaxed before the arrival of a subsequent pulse.
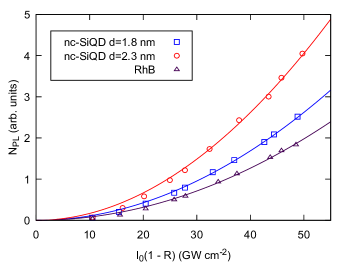
We assume a Gaussian spatiotemporal laser pulse profile with peak on-axis intensity and a sample thickness shorter than the Rayleigh range. The solution to Equation 3 for this intensity profile, neglecting depletion of the ground state and pump beam, can then be integrated over volume to find the excited state population. This can then be related to the number of detected PL photons, which are emitted as excitons radiatively recombine across the HOMO-LUMO gap. This “lowest-order” solution is quadratic with incident intensity.
We can calculate figures of merit for the validity of this model by estimating the fraction of absorbed photons on the beam axis and the fraction of excited molecules on the beam axis ,38 where is the beam radius and is the Gaussian pulse duration parameter expressed in terms of the FWHM pulse duration. In this work, we find that always, and thus neglecting depletion of the ground state is a valid assumption. However, sometimes, but not always. In cases where pump depletion is significant, we can expand the solution about to higher orders giving
| (5) |
where the higher order terms account for pump depletion. The data is fit to Equation 5 with and again with , and if the variation in the fit parameter between each fit is below a threshold of 1%, then the result for the case is reported; if the variation is larger, then the fit is repeated, comparing successively higher-order terms until the fit parameter converges. An example of this analysis is shown in Figure 4 at eV. The fit parameters are tabulated in the Supporting Information.
2.3 2PA Cross Section Spectra
The values of the 2PA cross sections of the nc-SiQD samples relative to the RhB reference standard were measured over the range eV. The resulting spectra, based on RhB 2PA cross sections from Makarov et al.,40 are shown in Figure 5(a). The values and their standard errors are tabulated in the Supporting Information. The error bars are propagated from the statistical uncertainties in the fit parameters, the reported uncertainties in the 2PA cross section of the reference RhB,40 and the statistical uncertainties in the measured number densities (refer to the Supporting Information). The 2PA cross section of nc-SiQDs increases by almost a factor of 1000 between 0.99 eV and 1.46 eV, and continues to monotonically increase by about a factor of 10 between 1.5 and 1.9 eV. The 1PA molar absorptivity spectra are also shown in Figure 5(a), plotted on the right axis against the top axis for comparison of the dispersion to the 2PA spectra. The absorption in both channels increases monotonically with excitation photon energy, but differs in quantitative details.
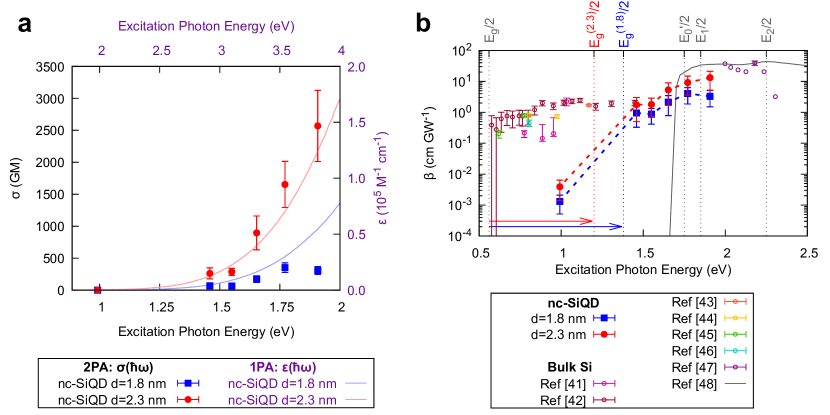
The 2PA cross section can be related to an effective 2PA coefficient for a material with volume fraction , where is the quantum dot number density and is the volume of the core of a quantum dot of diameter . This can then be used to compare how the 2PA spectra of nc-SiQDs compare to bulk Si [refer to Figure 5(b)]. Bulk Si has a two-photon indirect band gap of eV and two-photon direct band gap of eV. The 2PA cross section of nc-SiQDs increases by a factor of between 1.5 and 1.9 eV, before the two-photon direct band gap of bulk Si. The large increase in 2PA cross section of the nc-SiQDs between 0.99 eV and 1.46 eV is consistent with a blueshifting in the onset of absorption with decreasing nanocrystal size, which in the limit of bulk Si occurs at the two-photon indirect band gap. The HOMO-LUMO gap has been empirically observed to follow the trend , for in eV, in nm, and where eV is the indirect band gap of bulk Si.35 This trend holds for the onset of linear absorption in experimental measurements25, 49, 50, 51, 52 and ab initio calculations.35, 53, 54 This relation gives a rough estimation for the onset of 2PA of eV for nm nc-SiQDs and eV for nm nc-SiQDs. These estimates for the HOMO-LUMO gap fall within the range eV where 2PA increased by a factor of almost 1000 and thus is consistent with our results.
The magnitude of the 2PA cross section at a given excitation energy is smaller for the smaller nanocrystals in this study, i.e., , where the superscript indicates the diameter of the nc-SiQDs in nm [see Figure 5(a)]. This is consistent with the trend of linear molar absorptivity dependence on nc-SiQD size35, 52 as well as previous measurements of the 2PA cross section dependence on nc-SiQD size.9 Interestingly, the magnitude of the 2PA cross section may scale faster than nanocrystal volume, although the error bars for the two sizes of nanocrystals do overlap. This is evident in Figure 5(b) as the effective 2PA coefficient .
2.4 Comparing the Simulated Efficiency of 2PE-PL Biological Imaging with nc-SiQDs to Other Imaging Agents
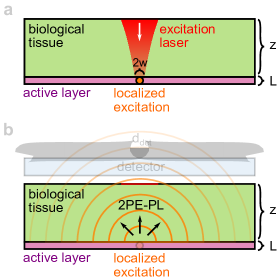
The onset of 2PA in the near-infrared (NIR) bio-transparency window, the size-tunability of the PL spectra, and the non-toxicity of nc-SiQDs make them potentially attractive for deep bio-imaging applications alongside new organic dyes55, 56, 57 and other quantum dots.58, 59, 60, 61 We can simulate the efficiency of nc-SiQDs in generating an observable signal with 2PE-PL in biological tissue and compare to the expected signal from 2PE-PL using other quantum dots and molecular fluorophores to aid in the selection of the optimal imaging agent and excitation wavelength for a given application (see Figure 6). This simulation models a parameter from which the maximum number of 2PE-PL photons which are returned to the surface of a biological sample can be calculated from the lowest-order term of Equation 5 as a function of depth of the imaging agent in the tissue, , where is the excitation photon energy, , is the detector quantum efficiency, is the detector collection solid angle, and is the thickness of the active layer where imaging agents are present. This model assumes that PL emission radiates from a point source at the focal volume and that , where is the detector diameter. The detector quantum efficiency is assumed not to vary rapidly over the PL spectra, and we model the PL spectral irradiance as Gaussian peaks with a center position at and peak width .
We can express the parameter in units of J-2 cm4 s as
| (6) |
where is the effective linear attenuation coefficient of the biological tissue (accounting for losses due to absorption and scatter) and is the angle to the normal. The prefactor is the 2PE-PL efficiency at , is the linear attenuation in the biological tissue of the square of the incident intensity, appears in the denominator in the conversion of from GM to SI units, the term in the denominator is a normalization factor for the integral immediately following, and is a small but finite infrared cutoff energy. The first integral performed over represents the fraction of PL at a given photon energy which is emitted into the upper hemisphere and which transmits to the surface of the biological tissue of depth . The next integral over is the fraction of emitted photons which are transmitted to the surface and accounts for the PL spectrum over which may vary.
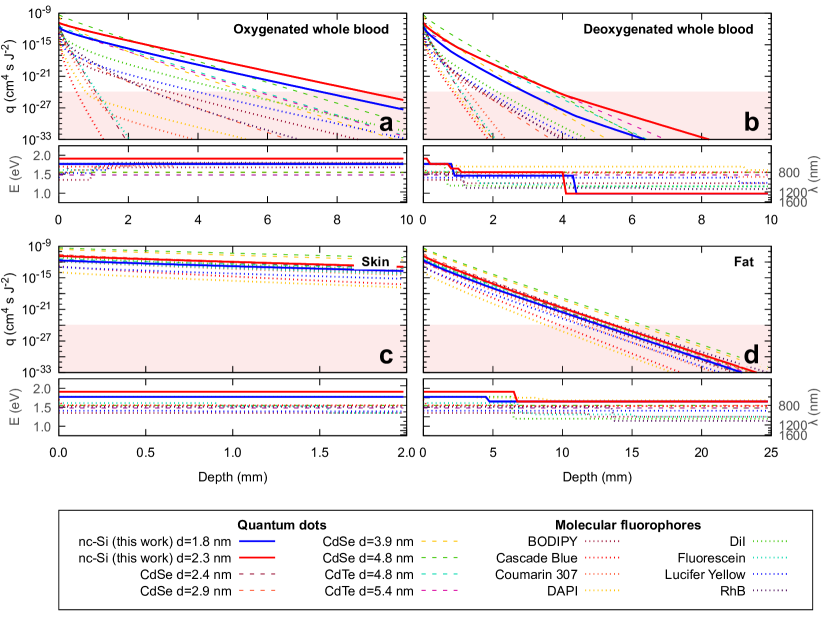
The results of these simulations for the nc-SiQDs in this work, CdSe and CdTe quantum dots, and a variety of molecular fluorophores are shown in Figure 7. The nc-SiQDs show superior efficiency, or more precisely exhibit large and the least reduction in signal with depth, , in oxygenated whole blood and deoxygenated whole blood than the other quantum dots and molecular fluorophores simulated. Compared to the molecular fluorophores simulated, nc-SiQDs can produce a detectable signal at an approximate threshold for detection deeper. Even within skin and fat, nc-SiQDs offer high performance, especially for deep bio-imaging. This is primarily due to two factors related to the deeper penetration depth of longer wavelength light in biological tissue; the PL emission peak of nc-SiQDs is in the NIR, and the 2PA cross section is larger in the NIR. The results presented here open up new opportunities, particularly in the field of deep bio-imaging.
3 Conclusions
In conclusion, we characterized the 2PA cross section spectra of two different sizes of ligand-passivated and colloidally dispersed nc-SiQDs with diameters and nm using 2PE-PL as a proxy relative to the well-known reference standard of RhB over the range eV. We observed the 2PA cross section decreases with decreasing nanocrystal diameter. The HOMO-LUMO gap in the nc-SiQDs was blueshifted from the two-photon indirect band gap of bulk Si, as expected due to quantum confinement of excitons, matching the trend observed in linear absorption experiments25, 49, 50, 51, 52 and ab initio calculations.35, 53, 54. Ab initio calculations of the rotationally-averaged imaginary part of the molecular third-order nonlinear optical susceptibility tensor of nc-SiQDs as a function of size could be compared to experimentally measured 2PA cross sections, and such calculations would be useful for understanding both the 2PA spectral structure and dependence on nanocrystal size. The efficiencies of nc-SiQDs for bio-imaging using 2PE-PL were simulated in various biological tissues and compared to other quantum dots and molecular fluorophores and found to be superior at greater depths due to their NIR PL and 2PA peaks, offering a potential advancement to the field of deep bio-imaging.
4 Methods
4.1 Sample Preparation
Hydrogen-passivated nanocrystals were synthesized by thermally decomposing hydrogen silsesquioxane, mechanically grinding the product into oxide-embedded nc-SiQDs, and then suspending the powder in an acid solution to etch away the oxide. This procedure yields hydride-terminated nc-SiQDs. Hessel et al.52 and the Supporting Information describe the procedure in detail. The hydride-terminated nc-SiQD sample is then dispersed in 8 mL of 1-dodecene. The dispersion is heated at 190∘C for 20 h. After about 30 min of heating, the turbid brown dispersion turns to an optically clear orange dispersion, indicating passivation of the nc-SiQDs. The alkene passivated nc-SiQDs are washed three times by precipitation with ethanol as an antisolvent (15 mL) and redispersed in 1 mL of toluene for use in experiments. Refer to the Supporting Information for details of the alkene passivation procedure. The reference standard for 2PE-PL measurements in this work was RhB dye in methanol for which a fresh sample was prepared each day measurements were taken.
4.2 Sample Characterization
4.2.1 Transmission Electron Microscopy
Average nanocrystal diameters and size distributions were determined by imaging individual nanocrystals with a high-resolution TEM (JEOL Ltd. Model 2010F HR-TEM) operated at 200 kV. The particle size distributions were determined by calculating the sizes of 100 particles in each sample. See Figures 1(a)-(b) and (e). Graphene-enhanced lacey carbon TEM grids were purchased from Electron Microscopy Sciences (Cat. no. GF1201). A dilute nanocrystal solution in chloroform was dropcast onto the grid and stored in a vacuum chamber overnight before imaging. Aberration-corrected scanning TEM (acSTEM) was performed using a JEOL NEOARM TEM with an 80 kV accelerating voltage and a point-to-point STEM resolution of 0.11 nm. These high resolution acSTEM images are shown in Figures 1(c)-(d).
4.2.2 X-Ray Diffraction
XRD was performed on each of the nc-SiQD samples using a Rigaku R-Axis Spider diffractometer using Cu K radiation ( nm) to ascertain the crystallinity of the quantum dots. The quantum dots were deposited on a glass slide, the solvent was evaporated, and then the powder was placed on a nylon loop. Two-dimensional diffraction data were collected for 10 min while rotating the sample stage at per minute. 2D diffraction data were radially integrated with 2DP software and are shown in Figure 1(f).
4.2.3 Thermal Gravimetric Analysis
TGA was performed using an automated ultra-micro balance (Mettler-Toledo International, Inc. Model TGA-1) in order to determine the relative mass of the Si core to 1-dodecene. Samples were heated at a rate of 20∘C/min from 40∘C to 800∘C. The sample was held at 100∘C for 30 minutes to evaporate residual solvents and at 800∘C for 30 min to ensure all ligand had evaporated. The relative mass of Si core to 1-dodecene in the passivated samples was determined from the remaining mass of Si and the total weight loss due to the removal of the ligands. The mass fraction vs. temperature curves are shown in Figure 2(a).
4.2.4 Quantum Yield Calculations
1PE-PL, shown in Figure 2(b), and PL excitation (PLE) spectra in the ultraviolet–visible (UV–Vis) wavelength range were acquired on a fluorescence spectrophotometer (Varian, Inc. Model Cary Eclipse). UV–Vis absorbance spectroscopy was performed on a UV–Vis spectrophotometer (Varian, Inc. Model Cary 50 Bio UV–Vis). The quantum yields () of the nc-SiQDs were determined by comparing the integrated 1PE-PL emission spectra to that of a known reference standard, RhB in anhydrous ethanol (with = 0.49).62 The quantum yield was calculated by integrating the emission spectra at 5 different concentrations. These are plotted against absorbance at the excitation wavelength for both the nc-SiQDs and RhB, shown in Figure 2(c)-(d). The gradient of the trendline of luminescence intensity vs. absorbance for both nc-SiQDs and RhB are used to compute the quantum yields of the nc-SiQDs by , where ( is the (sample, reference) quantum yield, is the gradient of integrated PL vs. absorbance of the (sample, reference), is the refractive index of the sample solvent (toluene), and is the refractive index of the reference solvent (ethanol).63
4.2.5 Molar Absorptivities
The molar absorptivities of the nc-SiQD samples were calculated by measuring the absorbances of nc-SiQD solutions at variable concentrations and applying the Beer-Lambert Law, , where is the optical path length (1 cm) and is the nc-SiQD concentration. The molar concentrations of the nc-SiQD samples were determined by taking the average diameter as measured from TEM imagery and calculating the ligands per nanocrystal with the mass fraction measured with TGA. The molar absorptivities of the nc-SiQD samples are shown in Figure 2(e) and that of RhB from literature39 in Figure 2(f). The molar absorptivities were used to determine the concentration of the samples in the 2PE-PL experiment by measuring the absorbance spectra of the samples with a spectrophotometer (PerkinElmer, Inc. Model Spectrum 400) and fitting to an empirical model for the molar absorptivity to the Beer-Lambert Law. The molar concentration and number density of the samples are tabulated in the Supporting Information. Refer to the Supporting Information for additional details on these calculations.
4.3 2PE-PL Measurements
4.3.1 Laser Source
We two-photon excited PL using laser pulses from an OPA (Light Conversion Co. Model TOPAS-C, tuning range nm) pumped by a 1 kHz titanium-doped sapphire regenerative amplifier (Coherent, Inc. Model Libra HE USP). Excitation pulses passed through spectral, spatial, and polarization filters tailored for each excitation wavelength to ensure well-defined pulse spectra, Gaussian transverse beam profiles, and linear polarization throughout the tuning range.
4.3.2 Spatiotemporal Profile Characterization
The pulse duration was measured by performing a SHG two-beam second-order autocorrelation using a barium borate crystal placed in the sample position.41 The average power was measured with a Si photodiode (PD) head (Coherent Model FieldMate, 650 - 1100nm) or a thermal head (Coherent Model FieldMate, 1200 - 2000 nm) and used to calibrate the reference photodiode detector. The beam radius at the sample position was measured using an automated knife-edge technique. See the Supporting Information for details on characterization of the pulse duration and characterization of the beam radius.
4.3.3 Experimental Setup
A continuously variable neutral density (ND) filter wheel controls the incident intensity. A beam splitter reflects 4% to a reference photodiode detector (Thorlabs, Inc. Model DET100A for 325 – 1100 nm, Thorlabs PDA30G for 1200 – 1400 nm) to monitor the incident laser power. The output of the photodiode detector was integrated and held for each pulse until the next trigger by a gated integrator (Stanford Research Systems Co. Model SR250).41 A plano-convex lens (with focal length mm) focuses the transmitted beam into the sample which is contained in a 1 mm path length optical glass cuvette (Hellma GmbH & Co. KG Model Z802689). A collection lens and fiber coupler injects a portion of the emitted PL into a 0.22 NA, nm, m core, double clad, multimode optical fiber patch cable (Thorlabs Model FG200UCC). The spectra is then analyzed using a compact CCD spectrometer (Thorlabs Model CCS200) and recorded by computer. See the Supporting Information for further details on the experimental setup.
4.3.4 Samples
The samples were placed in a cuvette holder and the PL spectra recorded as a function of incident pulse energy. Care was taken to ensure that the incident intensity was kept below the threshold for bubble formation in the colloidal sample, as bubbles of vaporized solvent significantly increase scattered light.
4.4 Simulations of Efficiency of 2PE-PL Bio-Imaging
The efficiency of a detectable signal from 2PE-PL in biological imaging applications is simulated using Equation 6. Effective attenuation coefficients for biological tissues were obtained from Smith et al.64, Friebel et al.65, and Bashkatov et al.66 In this simulation, we model the PL spectrum of the samples as a Gaussian peak with a center position at and peak width , unique to each sample. The simulated samples include nc-SiQDs from this work; CdSe and CdTe quantum dots from Pu et al.58; and various molecular fluorophores in literature: RhB 2PA spectrum and from Makarov et al.40 and PL spectrum from this work; BODIPY, Cascade Blue, Coumarin 307, DAPI, DiI, Fluorescein, and Lucifer Yellow 2PA spectra and from Xu et al.67 and corresponding PL spectra for Cascade Blue, DAPI, and Fluorescein from Shapiro68; PL spectrum for BODIPY from Schmitt et al.69; PL spectrum for Coumarin 307 from Mannekutla et al.70; PL spectrum for DiI from The Molecular Probes Handbook71; and the PL spectrum for Lucifer Yellow from omlc.72
This research was funded by Robert A. Welch Foundation Grants F-1038 and F-1464, and partially supported by the National Science Foundation through the Center for Dynamics and Control of Materials; an NSF MRSEC under Cooperative Agreement No. DMR-1720595. B. Mendoza acknowledges support from Consejo Nacional de Ciencia y Tecnología, México (Grant No. A1-S-9410). The majority of experimental work was performed at the Laboratorio de Óptica Ultrarrápida at Centro de Investigaciones en Óptica, A.C. in León, México. The authors thank E. Noé-Arias (Centro de Investigaciones en Óptica) for data acquisition program development, M. Olmos-López (Centro de Investigaciones en Óptica) for access to spectrophotometer, and J. Clifford (University of Texas at Austin) and the Centro de Investigaciones en Óptica Machine Shop for machining assistance and part fabrication.
The following file is available free of charge.
-
•
Supporting Information: 2PE-PL experimental setup diagram, spatiotemporal profile characterization, details of sample preparation and characterization, comparison of PL spectra by excitation channel, data archive, and the relationship of 2PA cross section to the isotropic molecular third-order nonlinear optical susceptibility tensor
References
- Kim et al. 2011 Kim, D.; Carter, S.; Greilich, A.; Bracker, A.; Gammon, D. Ultrafast Optical Control of Entanglement Between Two Quantum-Dot Spins. Nat. Phys. 2011, 7, 223–229
- Press et al. 2010 Press, D.; Greve, K.; McMahon, P.; Ladd, T.; Friess, B.; Schneider, C.; Kamp, M.; Höfling, S.; Forchel, A.; Yamamoto, Y. Ultrafast Optical Spin Echo In a Single Quantum Dot. Nat. Photonics 2010, 4, 367–370
- Yamamoto et al. 2009 Yamamoto, Y.; Ladd, T.; Press, D.; Clark, S.; Sanaka, K.; Santori, C.; Fattal, D.; Fu, K.; Höfling, S.; Reitzenstein, S.; Forchel, A. Optically Controlled Semiconductor Spin Qubits for Quantum Information Processing. Phys. Scr. 2009, T137, 014010
- Greve et al. 2012 Greve, K.; Yu, L.; McMahon, P.; Pelc, J.; Natarajan, C.; Kim, N.; Abe, E.; Maier, S.; Schneider, C.; Kamp, M.; Höfling, S.; Hadfield, R.; Forchel, A.; Fejer, M.; Yamamoto, Y. Quantum-Dot Spin-Photon Entanglement via Frequency Downconversion to Telecom Wavelength. Nature 2012, 491, 421–425
- Choi et al. 2018 Choi, M.; Yang, J.; Hyeon, T.; Kim, D. Flexible Quantum Dot Light-Emitting Diodes for Next-Generation Displays. npj Flex. Electron. 2018, 2, 1
- Yang et al. 2016 Yang, J.; Choi, M.; Kim, D.; Hyeon, T. Designed Assembly and Integration of Colloidal Nanocrystals for Device Applications. Adv. Mater. 2016, 28, 1176–1207
- Dai et al. 2017 Dai, X.; Deng, Y.; Peng, X.; Jin, Y. Quantum-Dot Light-Emitting Diodes for Large-Area Displays: Towards the Dawn of Commercialization. Adv. Mater. 2017, 29, 1607022
- Pimputkar et al. 2009 Pimputkar, S.; Speck, J.; Denbaars, S.; Nakamura, S. Prospects for LED Lighting. Nat. Photonics 2009, 3, 180–182
- Furey et al. 2018 Furey, B.; Silbaugh, D.; Yu, Y.; Guillaussier, A.; Estrada, A.; Stevens, C.; Maynard, J.; Korgel, B.; Downer, M. Measurement of Two-Photon Absorption of Silicon Nanocrystals in Colloidal Suspension for Bio-Imaging Applications. Phys. Status Solidi B 2018, 255, 1700501–1700507
- Kim et al. 2017 Kim, D.; Kang, J.; Wang, T.; Ryu, H.; Zuidema, J.; Joo, J.; Kim, M.; Huh, Y.; Jung, J.; Ahn, K.; Kim, K.; Sailor, M. Two-Photon In Vivo Imaging with Porous Silicon Nanoparticles. Adv. Mater. 2017, 29, 1703309
- Chandra et al. 2016 Chandra, S.; Ghosh, B.; Beaune, G.; Nagarajan, U.; Yasui, T.; Nakamura, J.; Tsuruoka, T.; Baba, Y.; Shirahata, N.; Winnik, F. Functional Double-Shelled Silicon Nanocrystals for Two-Photon Fluorescence Cell Imaging: Spectral Evolution and Tuning. Nanoscale 2016, 8, 9009–9019
- Kharin et al. 2019 Kharin, A.; Lysenko, V.; Rogov, A.; Ryabchikov, Y.; Geloen, A.; Tishchenko, I.; Marty, O.; Sennikov, P.; Kornev, R.; Zavestovskaya, I.; Kabashin, A.; Timoshenko, V. Bi-Modal Nonlinear Optical Contrast from Si Nanoparticles for Cancer Theranostics. Adv. Opt. Mater. 2019, 7, 1801728–1801736
- Sakiyama et al. 2018 Sakiyama, M.; Sugimoto, H.; Fujii, M. Long-Lived Luminescence of Colloidal Silicon Quantum Dots for Time-Gated Fluorescence Imaging in the Second Near Infrared Window in Biological Tissue. Nanoscale 2018, 10, 13902–13907
- McVey and Tilley 2014 McVey, B.; Tilley, R. Solution Synthesis, Optical Properties, and Bioimaging Applications of Silicon Nanocrystals. Acc. Chem. Res. 2014, 47, 3045–3051
- Liang et al. 2019 Liang, J.; Huang, C.; Gong, X. Silicon Nanocrystals and Their Composites: Syntheses, Fluorescence Mechanisms, and Biological Applications. ACS Sustainable Chem. Eng. 2019, 7, 18213–18227
- Tamarov et al. 2014 Tamarov, K.; Osminkina, L.; Zinovyev, S.; Maximova, K.; Kargina, J.; Gongalsky, M.; Ryabchikov, Y.; Al-Kattan, A.; Sviridov, P.; Sentis, M.; Ivanov, V.; Nikiforov, V.; Kabashin, A.; Timoshenko, V. Radio Frequency Radiation-Induced Hyperthermia Using Si Nanoparticle-Based Sensitizers for Mild Cancer Therapy. Sci. Rep. 2014, 4, 7034
- Lee et al. 2008 Lee, C.; Kim, H.; Hong, C.; Kim, M.; Hong, S.; Lee, D.; Lee, W. Porous Silicon As an Agent for Cancer Thermotherapy Based on Near-Infrared Light Irradiation. J. Mater. Chem. 2008, 18, 4790–4795
- He et al. 2008 He, G.; Zheng, Q.; Yong, K.; Erogbogbo, F.; Swihart, M.; Prasad, P. Two- and Three-Photon Absorption and Frequency Upconverted Emission of Silicon Quantum Dots. Nano Lett. 2008, 8, 2688–2692
- Torres-Torres et al. 2018 Torres-Torres, C.; Bornacelli, J.; Rangel-Rojo, R.; García-Merino, J.; Can-Uc, B.; Tamayo-Rivera, L.; Cheang-Wong, J.; Rodríguez-Fernández, L.; Oliver, A. Photothermally Activated Two-Photon Absorption in Ion-Implanted Silicon Quantum Dots in Silica Plates. J. Nanomater. 2018, 2018, 3470167
- Gui et al. 2017 Gui, R.; Jin, H.; Wang, Z.; Tan, L. Recent Advances in Optical Properties and Applications of Colloidal Quantum Dots Under Two-Photon Excitation. Coord. Chem. Rev. 2017, 338, 141–185
- Falconieri et al. 2009 Falconieri, M.; D’Amato, R.; Fabbri, F.; Carpanese, M.; Borsella, E. Two-Photon Excitation of Luminescence in Pyrolytic Silicon Nanocrystals. Physica E 2009, 41, 951–954
- Prakash et al. 2002 Prakash, G.; Cazzanelli, M.; Gaburro, Z.; Pavesi, L. Nonlinear Optical Properties of Silicon Nanocrystals Grown by Plasma-Enhanced Chemical Vapor Deposition. J. Appl. Phys. 2002, 91, 4607
- Spano et al. 2009 Spano, R.; Daldosso, N.; Cazzanelli, M.; Ferraioli, L.; Tartara, L.; Yu, J.; Degiorgio, V.; Jordana, E.; Fedeli, J.; Pavesi, L. Bound Electronic and Free Carrier Nonlinearities in Silicon Nanocrystals at 1550nm. Opt. Express 2009, 17, 3941–3950
- Trojánek et al. 2006 Trojánek, F.; Neudert, K.; Žídek, K.; Dohnaloá, K.; Pelant, I.; Malý, P. Femtosecond Photoluminescence Spectroscopy of Silicon Nanocrystals. Phys. Status Solidi C 2006, 3, 3873–3876
- Hessel et al. 2010 Hessel, C.; Rasch, M.; Hueso, J.; Goodfellow, B.; Akhavan, V.; Puvanakrishnan, P.; Tunel, J.; Korgel, B. Alkyl Passivation and Amphiphilic Polymer Coating of Silicon Nanocrystals for Diagnostic Imaging. Small 2010, 6, 2026–2034
- Yu et al. 2013 Yu, Y.; Hessel, C.; Bogart, T.; Panthani, M.; Rasch, M.; Korgel, B. Room Temperature Hydrosilylation of Silicon Nanocrystals with Bifunctional Terminal Alkenes. Langmuir 2013, 29, 1533–1540
- Tolstik et al. 2016 Tolstik, E.; Osminkina, L.; Akimov, D.; Gongalsky, M.; Kudryavstev, A.; Timoshenko, V.; Heintzmann, R.; Sivakov, V.; Popp, J. Linear and Non-Linear Optical Imaging of Cancer Cells with Silicon Nanoparticles. Int. J. Mol. Sci. 2016, 17, 1536–1550
- Ravotto et al. 2017 Ravotto, L.; Chen, Q.; Vinogradov, S.; Locritani, M.; Bergamini, G.; Negri, F.; Yu, Y.; Korgel, B.; Ceroni, P. Bright Long-Lived Luminescence of Silicon Nanocrystals Sensitized by Two-Photon Absorbing Antenna. Chem 2017, 2, 550–560
- Tu et al. 2010 Tu, C.; Ma, X.; Pantazis, P.; Kauzlarich, S.; Louie, A. Paramagnetic, Silicon Quantum Dots for Magnetic Resonance and Two-Photon Imaging of Macrophages. J. Am. Chem. Soc. 2010, 132, 2016–2023
- Park et al. 2009 Park, J.; L. Gu, G. M.; Ruoslahti, E.; Bhatia, S.; Sailor, M. Biodegradable Luminescent Porous Silicon Nanoparticles for In Vivo Applications. Nat. Mater. 2009, 8, 331–336
- Cao et al. 2017 Cao, Z.; Peng, F.; Hu, Z.; Chu, B.; Zhong, Y.; Su, Y.; He, S.; He, Y. In Vitro Cellular Behaviors and Toxicity Assays of Small-Sized Fluorescent Silicon Nanoparticles. Nanoscale 2017, 9, 7602–7611
- Brus 1994 Brus, L. Luminescence of Silicon Materials: Chains, Sheets, Nanocrystals, Nanowires, Microcrystals, and Porous Silicon. J. Phys. Chem. 1994, 98, 3575–3581
- Mastronardi et al. 2012 Mastronardi, M.; Henderson, E.; Puzzo, D.; Ozin, G. Small Silicon, Big Opportunities: The Development and Future of Colloidally-Stable Monodisperse Silicon Nanocrystals. Adv. Mater. 2012, 24, 5890–5898
- Ramos et al. 2007 Ramos, L.; Degoli, E.; Cantele, G.; Ossicini, S.; Ninno, D.; Furthmüller, J.; Bechstedt, F. Structural Features and Electronic Properties of Group-III-, Group-IV-, and Group-V-Doped Si Nanocrystallites. J. Phys. Consens. Matter 2007, 19, 466211
- Ramos et al. 2005 Ramos, L.; Weissker, H.; Furthmüller, J.; Bechstedt, F. Optical Properties of Si and Ge Nanocrystals: Parameter-Free Calculations. Phys. Status Solidi B 2005, 242, 3053–3063
- Wen et al. 2015 Wen, X.; Zhang, P.; Smith, T.; Anthony, R.; Kortshagen, U.; Yu, P.; Feng, Y.; Shrestha, S.; Coniber, G.; Huang, S. Tunability Limit of Photoluminescence in Colloidal Silicon Nanocrystals. Sci. Rep. 2015, 5, 12469
- Diener et al. 2001 Diener, J.; Kovalev, D.; Polisski, G.; Koch, F. Luminescence Properties of Two-Photon Excited Silicon Nanocrystals. Opt. Mater. 2001, 17, 117–120
- Rumi and Perry 2010 Rumi, M.; Perry, J. Two-Photon Absorption: An Overview of Measurements and Principles. Adv. Opt. Photonics 2010, 2, 451–518
- Du et al. 1998 Du, H.; Fuh, R.; Li, J.; Corkan, L.; Lindsey, J. PhotochemCAD: A Computer-Aided Design and Research Tool in Photochemistry. Photochem. Photobiol. 1998, 68, 141–142
- Makarov et al. 2008 Makarov, N.; Drobizhev, M.; Rebane, A. Two-Photon Absorption Standards in the 550-1600 nm Excitation Wavelength Range. Opt. Express 2008, 16, 4029–4027
- Furey et al. 2021 Furey, B.; Barba-Barba, R.; Carriles, R.; Bernal, A.; Mendoza, B.; Downer, M. Im{} Spectra of 110-Cut GaAs, GaP, and Si Near the Two-Photon Absorption Band Edge. J. Appl. Phys. 2021, 129, 183109
- Bristow et al. 2007 Bristow, A.; Rotenberg, N.; van Driel, H. Two-Photon Absorption and Kerr Coefficients of Silicon for 850-2200 nm. Appl. Phys. Lett. 2007, 90, 191104
- Reintjes and McGroddy 1973 Reintjes, J.; McGroddy, J. Indirect Two-Photon Transitions in Si at 1.06 m. Phys. Rev. Lett. 1973, 30, 901–903
- Dinu et al. 2003 Dinu, M.; Quochi, F.; Garcia, H. Third-Order Nonlinearities in Silicon at Telecom Wavelengths. Appl. Phys. Lett. 2003, 82, 2954–2956
- Euser and Vos 2005 Euser, T.; Vos, W. Spatial Homogeneity of Optically Switched Semiconductor Photonic Crystals and of Bulk Semiconductors. J. Appl. Phys. 2005, 97, 043102
- Tsang et al. 2002 Tsang, H.; Wong, C.; Liang, T.; Day, I.; Roberts, S.; Harpin, A.; Drake, J.; Asghari, M. Optical Dispersion, Two-Photon Absorption and Self-Phase Modulation in Silicon Waveguides at 1.5 m Wavelength. Appl. Phys. Lett. 2002, 80, 416–418
- Reitze et al. 1990 Reitze, D.; Zhang, T.; Wood, W.; Downer, M. Two-Photon Spectroscopy of Silicon Using Femtosecond Pulses at Above-Gap Frequencies. J. Opt. Soc. Am. B 1990, 7, 84–89
- Murayama and Nakayama 1995 Murayama, M.; Nakayama, T. Ab Initio Calculations of Two-Photon Absorption Spectra in Semiconductors. Phys. Rev. B 1995, 52, 4986–4997
- Ledoux et al. 2000 Ledoux, G.; Guillois, O.; Porterat, D.; Reynaud, C.; Huisken, F.; Kohn, B.; Paillard, V. Photoluminescence Properties of Silicon Nanocrystals As a Function of Their Size. Phys. Rev. B 2000, 62, 15942–15951
- van Buuren et al. 1998 van Buuren, T.; Dinh, L.; Chase, L.; Siekhaus, W.; Terminello, L. Changes in the Electronic Properties of Si Nanocrystals as a Function of Particle Size. Phys. Rev. Lett. 1998, 80, 3803–3806
- Furukawa and Miyasato 1988 Furukawa, S.; Miyasato, T. Quantum Size Effects on the Optical Band Gap of Microcrystalline Si:H. Phys. Rev. B 1988, 38, 5726–5729
- Hessel et al. 2012 Hessel, C.; Reid, D.; Panthani, M.; Rasch, M.; Goodfellow, B.; Wei, J.; Fujii, H.; Akhavan, V.; Korgel, B. Synthesis of Ligand-Stabilized Silicon Nanocrystals with Size-Dependent Photoluminescence Spanning Visible to Near-Infrared Wavelengths. Chem. Mater. 2012, 24, 393–401
- Ögüt et al. 1997 Ögüt, S.; Chelikowsky, J.; Louie, S. Quantum Confinement and Optical Gaps in Si Nanocrystals. Phys. Rev. Lett. 1997, 79, 1770–1773
- Reboredo et al. 2000 Reboredo, F.; Franceschetti, A.; Zunger, A. Dark Excitons Due to Direct Coulomb Interactions in Silicon Quantum Dots. Phys. Rev. B 2000, 61, 13073–13087
- Schnermann 2017 Schnermann, M. Organic Dyes for Deep Bioimaging. Nature 2017, 551, 176–177
- Strack 2021 Strack, R. Organic Dyes for Live Imaging. Nat. Methods 2021, 18, 27–30
- Hemmer et al. 2016 Hemmer, E.; Benayas, A.; Légaré, F.; Vetrone, F. Exploiting the Biological Windows: Current Perspectives on Fluorescent Bioprobes Emitting Above 1000 nm. Nanoscale Horiz. 2016, 1, 168–184
- Pu et al. 2006 Pu, S.; Yang, M.; Hsu, C.; Lai, C.; Hsieh, C.; Lin, S.; Cheng, Y.; Chou, P. The Empirical Correlation Between Size and Two-Photon Absorption Cross Section of CdSe and CdTe Quantum Dots. Small 2006, 2, 1308–1313
- Padilha et al. 2007 Padilha, L.; Fu, J.; Hagan, D.; Van Stryland, E.; Cesar, C.; Barbosa, L.; Cruz, C.; Buso, D.; Martucci, A. Frequency Degenerate and Nondegenerate Two-Photon Absorption Spectra of Semiconductor Quantum Dots. Phys. Rev. B 2007, 75, 075325
- Cai et al. 2019 Cai, Y.; Wei, Z.; Song, C.; Tang, C.; Han, W.; Dong, X. Optical Nano-Agents in the Second Near-Infrared Window for Biomedical Applications. Chem. Soc. Rev. 2019, 48, 22–37
- Borsella et al. 2013 Borsella, E.; D’Amato, R.; Falconieri, M.; Trave, E.; Panariti, A.; Rivolta, I. An Outlook on the Potential of Si Nanocrystals As Luminescent Probes for Bioimaging. J. Mater. Res. 2013, 28, 193–204
- Casey and Quitevis 1988 Casey, K.; Quitevis, E. Effect of Solvent Polarity on Nonradiative Processes in Xanthene Dyes: Rhodamine B in Normal Alcohols. J. Phys. Chem. 1988, 92, 6590–6594
- Kedenburg et al. 2012 Kedenburg, S.; Vieweg, M.; Gissibl, T.; Giessen, H. Linear Refractive Index and Absorption Measurements of Nonlinear Optical Liquids in the Visible and Near-Infrared Spectral Region. Opt. Mat. Express 2012, 2, 1588–1611
- Smith et al. 2009 Smith, A.; Mancini, M.; Nie, S. Second Window for In Vivo Imaging. Nat. Nanotechnol. 2009, 4, 710–711
- Friebel et al. 2009 Friebel, M.; Helfmann, J.; Netz, U.; Meinke, M. Influence of Oxygen Saturation on the Optical Scattering Properties of Human Red Blood Cells in the Spectral Range 250 to 2000 nm. J. Biomed. Opt. 2009, 14, 035001
- Bashkatov et al. 2005 Bashkatov, A.; Genina, E.; Kochubey, V.; Tuchin, V. Optical Properties of Human Skin, Subcutaneous and Mucous Tissues in the Wavelength Range from 400 to 2000 nm. J. Phys. D: Appl. Phys. 2005, 38, 2543
- Xu and Webb 1996 Xu, C.; Webb, W. Measurement of Two-Photon Excitation Cross Sections of Molecular Fluorophores with Data from 690 to 1050 nm. J. Opt. Soc. Am. B 1996, 13, 481–491
- Shapiro 2003 Shapiro, H. Excitation and Emission Spectra of Common Dyes. Current Protocols in Cytometry 2003, 26, 1.19.1–1.19.7
- Schmitt et al. 2009 Schmitt, A.; Hikeldey, B.; Wild, M.; Jung, G. Synthesis of the Core Compound of the BODIPY Dye Class: 4,4’-difluoro-4-bora-(3a,4a)-diaza-s-indacene. J. Fluoresc. 2009, 19, 755–758
- Mannekutla et al. 2008 Mannekutla, J.; Mulimani, B.; Inamdar, S. Solvent Effect on Absorption and Fluorescence Spectra of Coumarin Laser Dyes: Evaluation of Ground and Excited State Dipole Moments. Spectrochimica Acta Part A: Molecular and Biomolecular Spectroscopy 2008, 69, 419–426
- Johnson and Spence 2010 Johnson, I., Spence, M., Eds. Molecular Probes Handbook: A Guide to Fluorescent Probes and Labeling Technologies, 11th ed.; Life Technologies: New York, 2010; pp 57–65
- 72 Lucifer Yellow CH. https://omlc.org/spectra/PhotochemCAD/html/065.html, Accessed: 2021-07