An Empirical Study of the Effectiveness of an Ensemble of Stand-alone Sentiment Detection Tools for Software Engineering Datasets
Abstract.
Sentiment analysis in software engineering (SE) has shown promise to analyze and support diverse development activities. Recently, several tools are proposed to detect sentiments in software artifacts. While the tools improve accuracy over off-the-shelf tools, recent research shows that their performance could still be unsatisfactory. A more accurate sentiment detector for SE can help reduce noise in analysis of software scenarios where sentiment analysis is required. Recently, combinations, i.e., hybrids of stand-alone classifiers are found to offer better performance than the stand-alone classifiers for fault detection. However, we are aware of no such approach for sentiment detection for software artifacts. We report the results of an empirical study that we conducted to determine the feasibility of developing an ensemble engine by combining the polarity labels of stand-alone SE-specific sentiment detectors. Our study has two phases. In the first phase, we pick five SE-specific sentiment detection tools from two recently published papers by Lin et al. (Lin-SentimentDetectionNegativeResults-ICSE2018, ; Lin-PatternBasedOpinionMining-ICSE2019, ), who first reported negative results with stand alone sentiment detectors and then proposed an improved SE-specific sentiment detector, POME (Lin-PatternBasedOpinionMining-ICSE2019, ). We report the study results on 17,581 units (sentences/documents) coming from six currently available sentiment benchmarks for software engineering. We find that the existing tools can be complementary to each other in 85-95% of the cases, i.e., one is wrong but another is right. However, a majority voting-based ensemble of those tools fails to improve the accuracy of sentiment detection. We develop Sentisead, a supervised tool by combining the polarity labels and bag of words as features. Sentisead improves the performance (F1-score) of the individual tools by 4% (over Senti4SD (Calefato-Senti4SD-EMSE2017, )) – 100% (over POME (Lin-PatternBasedOpinionMining-ICSE2019, )). The initial development of Sentisead occurred before we observed the use of deep learning models for SE-specific sentiment detection. In particular, recent papers show the superiority of advanced language-based pre-trained transformer models (PTM) over rule-based and shallow learning models. Consequently, in a second phase, we compare and improve Sentisead infrastructure using the PTMs. We find that a Sentisead infrastructure with RoBERTa as the ensemble of the five stand-alone rule-based and shallow learning SE-specific tools from Lin et al. (Lin-SentimentDetectionNegativeResults-ICSE2018, ; Lin-PatternBasedOpinionMining-ICSE2019, ) offers the best F1-score of 0.805 across the six datasets, while a stand-alone RoBERTa shows an F1-score of 0.801.
1. Introduction
According to Bing Liu, “the textual information in the world can broadly be categorized into two main types: facts and opinions” (Liu-SentimentAnalysisOpinionMining-MorganClaypool2012, ). Such conjecture can also be applied to software-engineering (SE) artifacts, e.g., the discussions in online developer forums, and so on. “Facts” are objective expression (e.g., “I use this tool”). Opinions are subjective expressions that convey the sentiments towards entities (e.g., “I like this tool”). While the concept of opinion can be broad, the major focus of sentiment analysis is to detect polarity (Liu-SentimentAnalysisOpinionMining-MorganClaypool2012, ; Pang-SentimentClassificationMachineLearning-EMNLP2002, ), i.e., given a sentence or a post as a unit of analysis (e.g., a sentence/post - denoted as “unit” from now on), whether the unit exhibits positive, negative, or neutral sentiment (i.e., absence of positivity or negativity).
Opinions are key determinants to many of the activities in SE (Uddin-OpinerReviewAlgo-ASE2017, ; Guzman-EmotionalAwarenessSoftwareDevelopmentTeams-FSE2013, ; Mika-MiningValenceBurnout-MSR2016, ). The productivity in a team may depend on developers’ sentiments in/of their diverse development activities (Ortu-BulliesMoreProductive-MSR2015, ; Guzman-EmotionalAwarenessSoftwareDevelopmentTeams-FSE2013, ; Pletea-SecurityEmotionSE-MSR2014, ), while the analysis of sentiments towards software artifacts may lead to better selections of software artifacts (Uddin-OpinerReviewAlgo-ASE2017, ; Uddin-OpinerReviewToolDemo-ASE2017, ). Therefore, it is necessary to accurately detect sentiments in software-engineering artifacts (Novielli-ChallengesSentimentDetectionProgrammerEcosystem-SSE2015, ).
Most prior work on sentiment analysis in SE used cross-domain sentiment-detection tools. This “off-the-shelf” usage is insufficiently accurate for SE, due to the difference in the domain (see Section 7). Many cross-domain sentiment-detection tools were developed using movie reviews (e.g., Stanford (Socher-Sentiment-EMNLP2013, )). The context of sentiments expressed in movie reviews is different from that in SE. For example, the ‘API is simple’ is a positive API review (Uddin-OpinerReviewAlgo-ASE2017, ), but ‘The movie is simple’ is generally a negative movie review (Liu-SentimentAnalysisOpinionMining-MorganClaypool2012, ). Over the last few years, several tools have been developed to detect sentiments in software artifacts, e.g., SentistrengthSE (Islam-SentistrengthSE-MSR2017, ), Senti4SD (Calefato-Senti4SD-EMSE2017, ), SentiCR (Ahmed-SentiCRNIER-ASE2017, ). These tools offer better accuracy than off-the-shelf tools. However, recently Lin et al. (Lin-SentimentDetectionNegativeResults-ICSE2018, ) reported that the tools can still be inaccurate significantly.
Recent research in other domains has seen a rise in combining multiple sentiment detectors, such as hybrids of rule-based and supervised classifiers observed to be better detectors of sentiments in Twitter messages (Balage-HybridSentimentDetectorTwitter-SemEval2014, ; Goncalves-ComparingCombiningSentimentAnalysisTools-COSN2013, ). In software engineering, the choice of classification methods and the combination of diverse classifiers is effective to detect defects (Ghotra-RevisitingImpactClassificationDefectPrediction-ICSE2015, ; Nucci-DynamicSelectionOfClassifiersBugPrediction-IEEETranEmergingTopics2017, ). Intuitively, an ensemble of existing sentiment detection tools for SE can learn from the strengths and weaknesses of each tool for a given dataset, which then may offer it better insight to determine the correct sentiment polarity label of the different units in the dataset. This is because we find that different SE specific sentiment detection tools are developed using diverse rules and algorithms. We are particularly interested to study how a hybrid of existing sentiment detection tools for SE performs, because of the superiority of hybrid tools for sentiment detection other domains like Twitter. For example, Balage et al. (Balage-HybridSentimentDetectorTwitter-SemEval2014, ) found that a hybrid of rule-based (i.e., that uses sentiment lexicons as cues) and supervised tools (i.e., that uses features to learn) offered better sentiment detection performance for Twitter messages, because the tools could completement each other. The hybrid tool in Balage et al. (Balage-HybridSentimentDetectorTwitter-SemEval2014, ) was superior to the stand-alone tools, because each stand-alone tool (e.g., the rule-based tool) focused on specific estimators (e.g., sentiment lexicons). In SE, sentiment detection tools like SentistrengthSE are rule-based while other tools like Senti4SD are supervised. Therefore, the tools can also exhibit strengths and weaknesses on particular features/estimators in a dataset, which a hybrid tool can find as complementary. However, we are aware of no such hybrid sentiment detection tool developed for SE so far.
To determine the feasibility of developing a hybrid of stand-alone SE-specific sentiment tools, our empirical study in this paper started in 2019 with an aim to gain more positive outlook on the state of sentiment detection than the negative results reported by Lin et al. (Lin-SentimentDetectionNegativeResults-ICSE2018, ). Therefore, we initially intended to study all the sentiment detection tools developed for software engineering included in the study of Lin et al. (Lin-SentimentDetectionNegativeResults-ICSE2018, ) and that are currently available through GitHub or other online sources, including the latest such tool, POME, by also Lin et al. (Lin-PatternBasedOpinionMining-ICSE2019, ). These tools are either rule-based or shallow machine learning models. Looking forward in 2020, we observed new uses of deep learning models to detect sentiment in software engineering (Zhang-SEBERTSentiment-ICSME2020, ; Biswas-ReliableSentiSEBERT-ICSME2020, ; Biswas-SentiSEWordEmbedding-MSR2019, ; Chen-SentiEmoji-FSE2019, ). The most recent works are by Zhang et al. (Zhang-SEBERTSentiment-ICSME2020, ) and Biswas et al. (Biswas-ReliableSentiSEBERT-ICSME2020, ), who investigated the effectiveness of advanced pre-trained language based transformer models (PTMs) like BERT (Delvin-BERTArch-Arxiv2018, ). They found that the PTMs outperform rule-based and shallow learning models. Therefore, we also study the effectiveness of those PTMs to support/outperform our hybrid engine of SE-specific sentiment detectors. Thus, we divided our empirical study into two phases:
-
•
Phase 1. We studied the feasibility of developing a hybrid of stand-alone SE-specific sentiment tool, based on the tools studied by Lin et al. (Lin-PatternBasedOpinionMining-ICSE2019, ; Lin-SentimentDetectionNegativeResults-ICSE2018, ).
-
•
Phase 2. We studied how the hybrid tool that we developed in Phase 1 compares (and can be improved) with the recent, advanced pre-trained language-based models by Zhang et al. (Zhang-SEBERTSentiment-ICSME2020, ).
We studied a total of nine available sentiment detection tools for software engineering based on the studies of Lin et al. (Lin-SentimentDetectionNegativeResults-ICSE2018, ; Lin-PatternBasedOpinionMining-ICSE2019, ) and Zhang et al. (Zhang-SEBERTSentiment-ICSME2020, ): five from Lin et al. (Lin-SentimentDetectionNegativeResults-ICSE2018, ; Lin-PatternBasedOpinionMining-ICSE2019, ) and four from Zhang et al. (Zhang-SEBERTSentiment-ICSME2020, ). Through our empirical study, we answer total eight research questions as discussed below.
In Phase 1, our focus was the feasibility of developing an ensemble of the five tools that could potentially offer better performance than each of the stand-alone tools from Lin et al. (Lin-SentimentDetectionNegativeResults-ICSE2018, ; Lin-PatternBasedOpinionMining-ICSE2019, ). In Phase 1, we answered a total of five research questions as follows:
RQ1. How frequently do we get at least one correct classification while using multiple SE-specific tools? On a total of 17,581 units from six software specific sentiment benchmarks from the literature, we ran five stand-alone SE-specific sentiment tools: Senti4SD (Calefato-Senti4SD-EMSE2017, ), SentiCR (Ahmed-SentiCRNIER-ASE2017, ), SentistrengthSE (Islam-SentistrengthSE-MSR2017, ), Opiner (Uddin-OpinionValue-TSE2019, ), and POME (Lin-PatternBasedOpinionMining-ICSE2019, ). We find that 85% of misclassification by the tools related to non-neutral polarity (positive, negative) and 99% neutral classes can be potentially corrected by at least one other tool. This finding motivated us to investigate whether a hybrid sentiment detector can be developed by a simple majority analysis as follows.
RQ2. Can a majority voting-based classifier perform better than individual classifiers? For each of the 17,581 units, we assign a polarity label by simply taking the majority voting on the unit by the tools, i.e., if three tools say ‘positive’ and two say ‘negative’, we assign a final polarity as ‘positive’. Unfortunately, this classifier only achieves a F1-score (Macro) of 0.746, which was outperformed by both supervised stand-alone detectors, Senti4SD (0.750) and SentiCR (0.756). This finding necessitates towards a more sophisticated design of the hybrid tool. To determine that, we analyzed why one tool misclassifies when another does not.
RQ3. What are the error categories that could potentially be corrected by combining multiple SE-specific tools? We manually label 153 units where at least one tool was right and at least one another was wrong. For the labeling, we follow error categories similar to (Novielli-BenchmarkStudySentiSE-MSR2018, ), i.e., we determine the specific reason for misclassification by a tool. We find five major error categories. The most prevalent category is the failure of a tool to understand the underlying context (related to an expressed sentiment). Such contexts can be better understood by analyzing the textual contents in the unit. This motivates us to investigate the possibility of leveraging ensemble learning to capture the strength of multiple sentiment detectors. We therefore answer the following research questions.
RQ4. Can a supervised ensemble of classifiers offer better performance than individual classifiers? For each of the 17,581 units, we combine the polarity labels of the five individual sentiment tools with the bag of words of the unit as features. We train a supervised machine learning classifier based on shallow machine learning Random Forest (RF) model using the features. We name the classifier SentiseadRF. SentiseadRF outperforms each stand-alone sentiment detectors from 4% (Senti4SD) to 100% (POME). We investigate the possibility to further improve SentiseadRF with additional features through the following research question.
RQ5. Can the addition of more features improve the performance of the hybrid tool? We introduce two new types of features in SentiseadRF based on the analysis of polarity words and their positions in a given unit (e.g., first vs. last) and entropy measures using information theory. The enhanced hybrid engine, i.e., Sentisead, however, shows negligible performance increase over SentiseadRF (increase of 0.001 in F1-score Macro).
In Phase 2, our focus was to study the effectiveness of SentiseadRF against the most recently introduced advanced language-based models for SE-specific sentiment tools, which were studied in multiple papers like Zhang et al. (Zhang-SEBERTSentiment-ICSME2020, ). We answer a total of three research questions as follows:
RQ6. Can SentiseadRF outperform the BERT-based advanced pre-trained language based models? Given that pre-trained advanced language-based transformers (PTMs for short) offer better performance than shallow learning models for sentiment detection in SE, we want to know whether the PTMs can also outperform SentiseadRF, our hybrid tool of rule-based and shallow learning models based on the Random Forest model. We investigated four PTMs from Zhang et al. (Zhang-SEBERTSentiment-ICSME2020, ), ALBERT, BERT, RoBERTa, and XLNet, on our six datasets. We found that RoBERTa is the best performer among the four stand-alone PTMs with a Macro F1-score of 0.801, which is slightly better than SentiseadRF by 1.8%. Following this minor improvement, we decided to investigate the following research question.
RQ7. Can a deep learning model as ensembler for Sentisead outperform the stand-alone BERT-based PTMs? Motivated by superior performance of stand-alone PTMs over SentiseadRF that uses a shallow learning Random Forest model, we replaced the Random Forest model in SentiseadRF by the PTMs: we trained and tested four versions of Sentisead where features are the unit textual contents and the polarity labels from the five rule-based and shallow learning models from Lin et al. (Lin-SentimentDetectionNegativeResults-ICSE2018, ; Lin-PatternBasedOpinionMining-ICSE2019, ). However, the ensembler was a PTM instead of Random Forest. We found that the best performing PTM-based ensembler of the stand-alone rule-based and shallow learning sentiment detectors is based on RoBERTa, which we named SentiseadRoBERTa. Across the six datasets (and using the same 10-fold cross validation), SentiseadRoBERTa shows a Macro F1-score of 0.805: it offers 0.5% increase over a stand-alone RoBERTa model and a 2.3% increase in performance over SentiseadRF. This slight performance increase motivated us to include the stand-alone PTMs into the hybrid architecture as follows.
RQ8. Can Sentisead based on an ensemble of all the models (i.e., PTMs + non-PTMs) offer the best performance of all tools? We investigated whether the performance of the ensembler could further increase using the sentiment polarity labels of a unit from all available stand-alone models (i.e., rule-based, shallow, and deep learning models) in addition to the textual content of the unit. We trained and tested four versions of Sentisead by taking as input the above polarity labels and textual content of a unit as features. The ensemblers are the four PTMs, which yield four ensemblers: Sentisead, Sentisead, Sentisead, and Sentisead. The best performing model is Sentisead with a Macro F1-score of 0.8. However, Sentisead is not more accurate than SentiseadRoBERTa from RQ7. Therefore, the inclusion of polarity labels of individual PTMs does not contribute to any performance improvement in Sentisead.
Based on our empirical study findings, we make following major observations and suggestions:
-
(1)
Our hybrid classifier, SentiseadRoBERTa, which is based on the PTM RoBERTa, offers the best Macro F1-score of 0.805. This classifier can be easily built by taking as input the sentiment polarity of the five stand-alone sentiment detectors (Opiner, POME, Senti4SD, SentiCR, and SentistrengthSE) and the unit textual contents. However, SentiseadRoBERTa shows only 0.5% performance improvement over the stand-alone RoBERTa model. Therefore, when a mere increase of 0.5% is not warranted, a stand-alone RoBERTa model should suffice.
-
(2)
The hybrid classifier using Random Forest achieves the best Macro F1-score of 0.787 out of all shallow learning-based hybrid models. Thus, this Random Forest model shows a mere decrease of 0.018 in F1-score compared to the overall best hybrid model, i.e., the RoBERTa based PTM which shows a Macro F1-score of 0.805. Therefore, for systems where GPU-based servers are not readily available, the Random Forest-based hybrid model can suffice.
-
(3)
On the six benchmarks, SentiseadRF or SentiseadRoBERTa show more than 0.8-0.9 F1-score (for positive and negative classes) for four datasets but only 0.3-0.5 for the other two datasets. Further improvement in the latter two datasets require the analysis of contextual information surrounding a given unit (e.g., preceding & following units); an aspect that current tools cannot handle. Thus, future improvement of stand-alone SE-tools should focus on developing algorithms to analyze surrounding contexts.
Our study benefited from the availability of open source code, tools, and datasets that were shared by software engineering researchers working on sentiment detection. In fact, the code base of Sentisead uses the SentiCR (Ahmed-SentiCRNIER-ASE2017, ) code base to bootstrap. Given that our study shows promise to advance the state-of-the-art research in software engineering, we have open sourced the entire codebase of Sentisead in our online appendix (website:senisead-online-appendix-ase2020, ).
2. Studied Benchmarks and Tools
In this section, we describe the sentiment detection benchmarks and tools that we studied to develop our hybrid engine.
2.1. Studied Sentiment Benchmarks
We analyze the following six benchmarks available from software-engineering research. Each unit in a benchmark is labeled as a polarity (positive, negative, or neutral). A unit can be a sentence or a document (i.e., a list of sentences). Table 1 provides descriptive summary statistics of the benchmarks. Overall, 46% of the units in the benchmarks are labeled as positive or negative and the rest (64%) are labeled as neutral (see last column in Table 1).
| Dataset | #Units | +VE | -VE | /#Units |
|---|---|---|---|---|
| SO Calefato et al. (Calefato-Senti4SD-EMSE2017, ) | 4423 | 1527 | 1202 | 62% |
| SO Lin et al. (Lin-SentimentDetectionNegativeResults-ICSE2018, ) | 1,500 | 131 | 178 | 21% |
| SO Uddin et al. (Uddin-OpinionValue-TSE2019, ) | 4,522 | 1,048 | 839 | 42% |
| JIRA Ortu et al.. (Ortu-BulliesMoreProductive-MSR2015, ) | 5,869 | 1,128 | 786 | 33% |
| JIRA Lin et al. (Lin-SentimentDetectionNegativeResults-ICSE2018, ) | 926 | 290 | 636 | 100% |
| Mobile App Lin et al. (Lin-SentimentDetectionNegativeResults-ICSE2018, ) | 341 | 186 | 130 | 93% |
| Total | 17,581 | 4,310 | 3,771 | 46% |
2.2. Studied Sentiment Detection Tools in Phase 1
The observed shortcomings in cross-domain sentiment detection tools motivated the development of several recent sentiment detection tools for software engineering. In this paper, we have studied five sentiment detection tools developed for software engineering: SentistrengthSE (Islam-SentistrengthSE-MSR2017, ), Senti4SD (Calefato-Senti4SD-EMSE2017, ), SentiCR (Ahmed-SentiCRNIER-ASE2017, ), Opiner (Uddin-OpinionValue-TSE2019, ), and POME (Lin-PatternBasedOpinionMining-ICSE2019, ). While Senti4SD and SentiCR are supervised, the other three tools are rule-based classifiers. As we noted in Section 1, these tools were the subject of two papers by Lin et al. (Lin-PatternBasedOpinionMining-ICSE2019, ; Lin-SentimentDetectionNegativeResults-ICSE2018, ). From the two studies of Lin et al. (Lin-PatternBasedOpinionMining-ICSE2019, ; Lin-SentimentDetectionNegativeResults-ICSE2018, ), we picked the tools whose trained model/source code were available online during the time of analysis. We also picked the tools that were developed specifically for software engineering artifacts. These five tools are also the five most cited sentiment detection tools developed for software engineering as of now.
2.3. Studied Deep Learning Tools for Sentiment Detection in Phase 2
Starting from mid 2019, the SE community started using deep learning models to detect sentiment in SE artifacts. Most recently, several research results showed the superior performance of pre-trained advanced language-based transformers for sentiment detection in SE. For the sake of brevity, we refer to those models as PTMs (Pre-trained Transformer Models) in the following. Among the PTMs, four models, ALBERT, BERT, RoBERTa, and XLNet, were studied in the most recent papers by Zhang et al. (Zhang-SEBERTSentiment-ICSME2020, ) and Biswas et al. (Biswas-ReliableSentiSEBERT-ICSME2020, ), who found that these PTMs offer better performance than shallow learning models, like Senti4SD, SentiCR, etc. In the second phase of our study, we thus investigate the effectiveness of the PTMs with our ensemble sentiment detection model. We discuss briefly the PTMs below.
| Architecture | Used Model | L | H | D | P |
|---|---|---|---|---|---|
| BERT | bert-base-uncased | 12 | 768 | 12 | 110M |
| XLNet | xlnet-base-cased | 12 | 768 | 12 | 110M |
| RoBERTa | roberta-base | 12 | 768 | 12 | 125M |
| ALBERT | albert-base-v1 | 12 | 768 | 12 | 11M |
In our study, we use the implementations of the above four models from the Hugging Face transformer library, which is an open-source community around the PTM libraries. Table 2 shows the architecture of the four PTMs.
3. Study Phase 1: Ensemble of Rule-Based and Shallow Machine Learning Models
We offer insights into the feasibility of developing a hybrid sentiment detection engine for the domain of software engineering. Our study has two phases. In the first phase, we answer five research questions we introduced in Section 1.
-
(1)
How frequently can we correct the misclassification of a tool by another tool? (Section 3.1)
-
(2)
Can a majority voting-based classifier perform better than individual classifiers? (Section 3.2)
-
(3)
What are the error categories that could be potentially corrected by combining multiple SE-specific tools? (Section 3.3)
-
(4)
Can an ensemble of classifiers offer better performance than individual classifiers? (Section 3.4)
-
(5)
Can the addition of more features improve the performance of the hybrid classifier? (Section 3.5)
3.1. RQ1 How frequently can we correct the misclassification of a tool by another tool?
3.1.1. Motivation
The five SE-specific tools (SentiCR, Senti4SD, Opiner, SentistrengthSE, and POME) in our study can complement each other, if the misclassification of one tool can be potentially corrected by the correct polarity label from another tool. If all the tools are wrong for a given unit, the proper processing of the unit may require the development of a new tool. As noted in Section 1, our focus is to improve the accurate polarity classification probability of a given unit by analyzing the polarity labels of the units from the existing SE-specific tools. This concept is similar to the bagging or boosting combination of classifiers in machine learning (Misrili-IndustrialCaseStudyEnsembleSoftwareDefects-SQJ2011, ; Petric-EnsembleDefectDiversity-ESEM2016, ; Zhang-CombinedClassifierCrossDefect-FrontierComputerScience2018, ; Yang-TwoLayerEnsembleJustInTimeDefect-IST2017, ). However, for the combination to perform better than the stand-alone SE-specific classifier, we first need to confirm whether another tool can offer correct polarity classification for a given unit when a tool is wrong on that unit.
3.1.2. Approach
We have six datasets in our study. For each dataset, we collect sentiment polarity labels on each unit from the five sentiment detection tools as follows. We run each of the three unsupervised classifiers (i.e., SentistrengthSE, Opiner, and POME) on the entire benchmark dataset. The output is a polarity label for each unit. The other two tools, Senti4SD and SentiCR, are supervised sentiment detectors so, for each dataset, we trained and tested as follows.
Literature on the evaluation of SE-specific supervised sentiment detection tools has so far split a given dataset into 70% training set and 30% testing set (e.g., Novielli et al. (Novielli-BenchmarkStudySentiSE-MSR2018, ) Calefato et al. (Calefato-Senti4SD-EMSE2017, ), Zhang et al. (Zhang-SEBERTSentiment-ICSME2020, ). The split is done based on a stratified sampling, i.e., 70% of each polarity class will stay in the training set and 30% of that class will be in the testing set. The split is done once, i.e., before a classifier is trained or tested. In our paper, we improved on this approach as follows.
We split each dataset into 10-folds using a stratified sampling111We use the StratifiedKFold method from Python Scikit-learn to create the folds. The folds preserve the percentage of samples for each of the polarity classes.. Thus, each fold contains the same proportion of a polarity class as in the entire dataset. Also, a unit cannot be present in two different folds, because otherwise the classifier would see the same unit in both training and testing sets, which would lead to overfitting. Then, we train and test a classifier 10 times. For example, in the first run, we train the classifier using folds 1-9 and then test it on Fold 10. In the second run, we train the classifier using folds 2-10 and test it on Fold 1. Once all the 10 runs are completed, we have test results on each of the 10 folds (e.g., test result of Fold 10 coming from Run 1, test result of Fold 1 coming from Run 2, etc.). We can then compute the performance of the classifier on all test results.
Therefore, our approach is similar to the existing 70–30 evaluation approach used in the literature but our training vs. testing split is 90-10. In addition, unlike current approaches in SE-specific sentiment detection, because we do the testing on the entire dataset by running a tool 10 times, our test results are more robust than a 70-30 split, which is run only once and is tested only on 30% of all data.
Because we are training and testing each tool 10 times compared to only once in the current literature, our approach also better addresses any variance in the machine learning classification model due to its stochastic nature. An alternative to our approach would have been to do a repeated sampling of training and testing sample from a given dataset for N times (e.g., N = 10 or N = 100) and then report the performance of the model by taking the average of the performance across all test samples. Our approach slightly differs from this alternative in that we created the 10 folds once, before we started all the classification tasks. This means that we were able to track and compare each classification model performance on each fold, where the training and testing for each model followed the same pattern (i.e., train using folds 1-9 and testing using fold 10 in run 1, train using folds 2-10 and test using fold 1 in run 2, etc.). This process then allowed us to also check for tool complementarity, i.e., see when a tool is wrong while another can be right for a given unit. Moreover, given that we train and test a classification model 10 times instead of one time, we also reduce any variance in the classification results. Nevertheless, for each model, we pre-set the random variables by using seeds, which is useful to get similar results for a model for a given dataset, even if we run the model 10, 20, or 100 times in the dataset.
Given that we have six datasets and five SE-specific sentiment detection tools, we analyze the performance of each tool across the six datasets as follows. First, we get the test results for each dataset following the steps listed above. Second, we compute the performance metrics of each model in each dataset by analyzing the polarity labels in the 10 test folds of the dataset. Third, we compute the performance metrics of each model across the six datasets by analyzing the polarity labels across all the test folds in the six datasets, i.e., across the 60 test folds (10 each for each dataset). While we report the consolidated performance metric for a given model across the datasets to save space in the paper, we include the performance metric for each dataset in our online replication package (website:senisead-online-appendix-ase2020, ).
In summary, given as input the benchmark datasets and the five sentiment detectors, we produce the final output after all the training and testing for each dataset as a matrix , where () is each unit, () corresponds to the benchmark dataset where unit is found, and () and corresponds to the polarity label of unit by a given sentiment detector in our study.
We analyze the complementarity of the tools on the generated matrix as follows. First, for each pair (e.g., ) of tools in our dataset (e.g., Senti4SD, SentiCR), we collect all the records in where at least one of the tools is right (i.e., matches with the ground truth). For each tool in , we then compute the fraction of misclassification of each tool, for which one or more of the other tools offer correct classifications.
| Tool | Polarity | Tools Could Correct Wrong Polarity | |||||
|---|---|---|---|---|---|---|---|
| Wrong | Wrong | Senti4SD | SentiCR | SentistrengthSE | Opiner | POME | |
| Senti4SD | (2685) | 24% | 29% | 29% | 7% | 54% | |
| O (1281) | 54% | 47% | 41% | 88% | 97% | ||
| SentiCR | (2948) | 31% | 28% | 37% | 7% | 59% | |
| O (917) | 36% | 37% | 43% | 88% | 0.96 | ||
| SentistrengthSE | (2970) | 36% | 29% | 32% | 7% | 59% | |
| O (1458) | 53% | 61% | 40% | 91% | 98% | ||
| Opiner | (4087) | 54% | 55% | 51% | 4% | 70% | |
| O (2999) | 75% | 83% | 71% | 89% | 99% | ||
| POME | (7621) | 67% | 64% | 64% | 48% | 84% | |
| O (471) | 69% | 77% | 71% | 31% | 92% | ||
| (7938) | 66% | 63% | 63% | 49% | 4% | 85% | |
| O (4049) | 68% | 77% | 64% | 26% | 88% | 99% | |
3.1.3. Results
In Table 3, we show the percentage of misclassified textual units for each tool that can be potentially corrected by another tool. The second column (‘Polarity Wrong’) shows the polarity that is misclassified by the tool listed in the first column. The third to seventh column show how frequently each of the other tools can correct the misclassification of a tool listed in the first column. For example, for Senti4SD (i.e., S4SD in Table 3) the two unsupervised classifiers (SentistrengthSE and Opiner) offer the most complemenarity (31% and 34%) to correct the positive polarity as well as the negative polarity. The last column () shows how the misclassification of a tool can be corrected by the correct classification of at least one of the tools. For example, 60% of the misclassified positive polarity by Senti4SD can be corrected by at least one of the other tools. The last row () shows the overall distribution of the positive, negative, and neutral units for which at least one tool is wrong. Around 87% of such misclassified positive polarity and around 82% of such negative polarity can be corrected by at least one of the other tools. The tool POME seems to be the most effective to correct the misclassifications of neutral units, i.e., when other tools incorrectly label a unit as non-neutral. Other tools (i.e., except POME) can complement more each other to correct the misclassifications for the positive and negative polarities. The primary challenge for a hybrid engine would be then to make a final decision from the different polarity labels on a given unit.
| Predicted | ||||
|---|---|---|---|---|
| Positive (P) | Negative (N) | Neutral (O) | ||
| Actual | Positive (P) | TPP | FPN, FNP | FPO, FNP |
| Negative (N) | FPP, FNN | TPN | FPO, FNN | |
| Neutral (O) | FPP, FNO | FPN, FNO | TPO | |
3.2. RQ2 Can a majority voting-based classifier perform better than individual classifiers?
3.2.1. Motivation
The findings from RQ1 confirm that the sentiment detectors can complement each other to correct their polarity misclassifications. However, the challenge is to determine the right polarity labels when multiple tools offer different labels. Given that we analyze five SE-specific sentiment detectors, the majority of the classifiers may agree on the correct classification for a given unit.
3.2.2. Approach
We take as input the matrix that we created for RQ1, where for each unit we have polarity labels from each of the five sentiment detectors, i.e., . As we noted in Section 3.1, this matrix was created by retraining the supervised classifiers on the benchmark datasets using a 10-fold cross validation. Out of the five polarity labels in , we assign the label that was observed the most in . We report performance using three standard metrics of information retrieval: precision (), recall (), and F1-score ().
# of true positives, # of false negatives, # of true negatives, and # of false positives. In addition, we also report the weighted value for each tool by computing the agreement between the tool and the manual labels. We use the Python ml_metrics to compute the weighted values.
We do not report accuracy as a metric while reporting the performance of the tools due to the following reason. As we presented the descriptive statistics of our six datasets in Table 1 (Section 2), our datasets are imbalanced. This means that we do not have each polarity class present in equal proportion in a given dataset. For example, for the SO Lin et al. (Lin-SentimentDetectionNegativeResults-ICSE2018, ) dataset, only 21% of the units are either positive or negative polarity and the rest (i.e., 79%) are neutral. Overall, only 46% of all units across the six datasets are either positive or negative and the rest (i.e., 54%) units are neutral. Therefore, we are analyzing highly skewed (i.e., imbalanced) datasets. Metrics like accuracy can give misleading information for imbalanced datasets. For example, if we label each unit as neutral, the overall accuracy across the datasets would have been 0.46. However, given the accurate detection of negative/positive polarity is more important in SE, the accuracy would have given us a false impression of the effectiveness of the model. Indeed, in machine learning literature and discussions, it is warned to not use accuracy as a measure for imbalanced datasets222see https://machinelearningmastery.com/failure-of-accuracy-for-imbalanced-class-distributions/.
To assess performance, we use the confusion matrix in Table 4, which is consistent with the state of the art (Novielli-BenchmarkStudySentiSE-MSR2018, ; Calefato-Senti4SD-EMSE2017, ; Sebastiani-MachineLearningTextCategorization-ACMSurveys2002, ; Uddin-OpinionValue-TSE2019, ). We report overall performance using both micro and macro averages, as well as by each polarity class. Macro average is useful to emphasize the performance on polarities with few instances (e.g., positive/negative in our case). In contrast, micro average is influenced mainly by the performance of the majority polarity (e.g., neutral), because it merely takes the average of each polarity. We use the F1-score to report the best tool, following standard practices (Novielli-BenchmarkStudySentiSE-MSR2018, ; Manning-IRIntroBook-Cambridge2009, ).
| Macro | Micro | ||||||
| F1 | P | R | F1 | P | R | ||
| Majority-All | 0.56 | 0.746 | 0.806 | 0.694 | 0.768 | 0.768 | 0.768 |
| Majority-Supervised | 0.61 | 0.745 | 0.811 | 0.690 | 0.769 | 0.769 | 0.769 |
| Majority-Unsupervised | 0.42 | 0.630 | 0.715 | 0.563 | 0.671 | 0.671 | 0.671 |
| Baseline - Senti4SD | 0.63 | 0.750 | 0.768 | 0.732 | 0.774 | 0.774 | 0.774 |
| Baseline - SentiCR | 0.63 | 0.756 | 0.791 | 0.723 | 0.780 | 0.780 | 0.780 |
| Baseline - SentistrengthSE | 0.60 | 0.723 | 0.746 | 0.701 | 0.748 | 0.748 | 0.748 |
| Baseline - Opiner | 0.35 | 0.563 | 0.571 | 0.556 | 0.597 | 0.597 | 0.597 |
| Baseline - POME | 0.04 | 0.397 | 0.451 | 0.354 | 0.540 | 0.540 | 0.540 |
3.2.3. Results
In Table 5, we compare the performance of the developed majority-based voting detector against the stand-alone sentiment detectors. We show three versions of the majority-based detectors: (1) Majority-All: uses polarity outputs from all five sentiment detectors. (2) Majority-Supervised: uses polarity outputs from only the supervised sentiment detectors (i.e., Senti4SD and SentiCR), and (3) Majority-Unsupervised: uses polarity outputs from only the unsupervised sentiment detectors (i.e., POME, Opiner, and SentistrensghtSE). None the of above two majority-based detectors outperform the individual supervised detectors. The Majority-All detector shows an F1-score of 0.746 (Marco), while Senti4SD shows 0.750 and SentiCR 0.756. With regards to the Micro average, Majority-All shows 0.768, while Senti4SD shows 0.774 and SentiCR shows 0.780. The breakdown of the Majority-All into sub-components, i.e., Majority-Supervised and Majority-Unsupervised shows that the major contributors of success in the Majority-All are the supervised classifiers. For example, Majority-Supervised shows a Macro F1-score of 0.745 (Majority-All shows 0.746), while Majority-Unsupervised shows an F1-score of 0.630. The Majority-Unsupervised performs better than the two unsupervised detectors (Opiner and POME), but it is outperformed by the SentistrengthSE (Macro F1-score = 0.723). The results indicate a non-linear relationship between the correct polarity labels and the agreement among the tools when at least one of the tools can be correct.
3.3. RQ3 What are the misclassification categories in the complementary cases?
3.3.1. Motivation
The findings from RQ1 (Section 3.1) confirm the potential of developing a hybrid sentiment detector, RQ2 (Section 3.2) shows that a simple majority-based voting does not perform better than the individual detectors. To better design a hybrid sentiment detector, we thus need to understand why one tool misclassifies when another tool can offer the correct label. This can be achieved by analyzing the error categories in the complementary cases.
3.3.2. Approach
We study misclassification types in 159 units from our complementarity dataset (Section 3.1). This sample is statistically significant with a 99% confidence level (10 interval). Given that the majority of units are neutrals, a purely random sample would contain mostly neutral units. We thus randomly pick equal number (i.e., 53) of units from each polarity class. We manually label the misclassification reasons as follows. (1) We label the misclassification in the unit to one of the seven error categories from Novielli et al. (Novielli-BenchmarkStudySentiSE-MSR2018, ). The categories are: (a) Polar facts by neutral, (b) General error, (c) Politeness, (d) Implicit polarity, (e) Subjectivity in annotation, (f) Inability to deal with context information, and (g) Figurative language. (2) Novielli et al. (Novielli-BenchmarkStudySentiSE-MSR2018, ) observed seven error categories in four sentiment detectors when they are all wrong on a given unit. In contrast, we aim to study the textual units of the misclassifications where at least one tool is correct. If we cannot match the misclassification to one of the seven categories, we assign it a new error category based on the analysis of the textual contents.
| Category | Description | # |
|---|---|---|
| Context | Tool fails to understand underlying context required to determine the overall polarity | 62 |
| Polarity Diversity | The text contains multiple polarity cues with diverse interpretations | 35 |
| Domain | Polarity cues are SE-specific | 23 |
| General | Tool cannot process linguistic cues/typos. | 22 |
| Politeness | A neutral text is labeled polar due to the existence of politeness | 17 |
3.3.3. Results
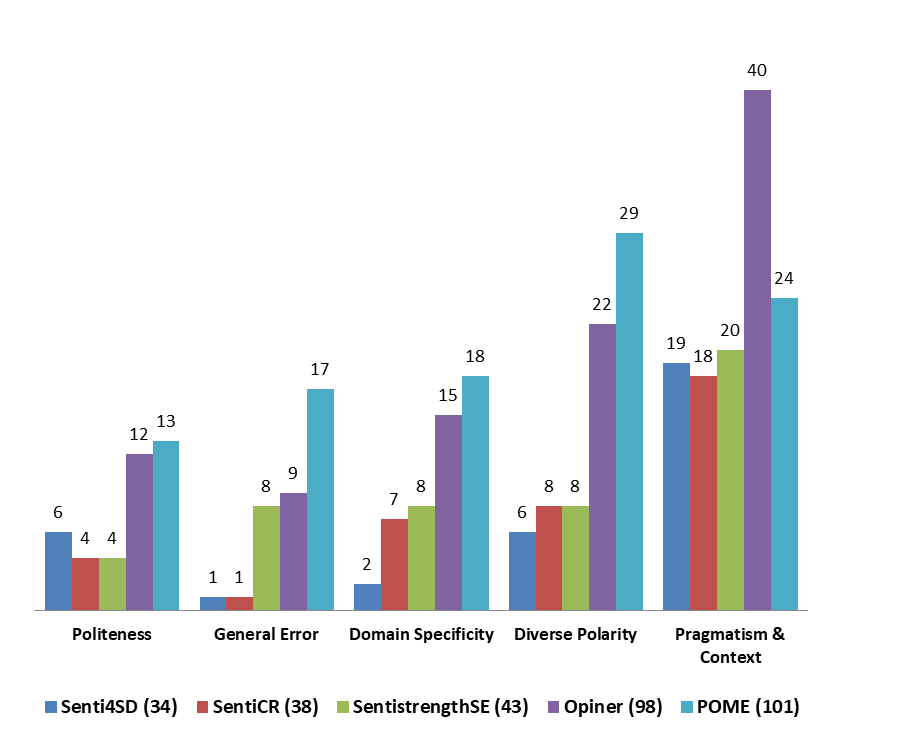
We observed five error categories: three from (Novielli-BenchmarkStudySentiSE-MSR2018, ) (Context/Pragmatics, General Error, and Politeness) and two new: Domain-specific polarity and presence of diverse polarity in the textual units. Table 6 and Figure 1 summarize the categories and their distributions in our analysis. We discuss the categories below.
In summary, the supervised detectors show lower error coverage across all the five categories. When the misclassification of a unit was due to the presence of diverse polarity, Senti4SD showed lower misclassification than SentiCR. However, when the underlying contextual information is required, SentiCR had lower misclassification rates. The underlying design of the two supervised classifiers offers some insights into this: Senti4SD computes polarity labels based on their presence in the selected parts of the unit, e.g., the first vs last sentiment word in a unit may carry different weights. In contrast, SentiCR relies specifically on a preprocessed Bag of Words (BoW) produced from a unit, e.g., negations are detected and explicitly annotated in the bag of words.
3.4. RQ4 Can a supervised ensemble of detectors perform better than individual detectors?
3.4.1. Motivation
The findings from RQ1 (Section 3.1) and RQ2 (Section 3.2) show that the SE-specific sentiment detectors can complement each other to correct the misclassfications, but an unsupervised majority voting-based detector fails to properly capture the complementarity cases. The analysis of misclassifications in RQ3 (Section 3.3) shows that the failure of a tool to properly detect the underlying contextual information caused the most misclassifications. We also see that SentiCR offered better support for such cases. Therefore, an ensemble of the individual detectors in a supervised setting similar to SentiCR may provide more contextual information to a hybrid engine.
| Features | Rationale |
|---|---|
| Polarity Labels from SE-specific detectors | The supervised classifiers can learn the underlying context and domain-specific pragmatics. The rule-based classifiers can employ domain-specific rules. |
| Bag of words | The vectorized representation of the bag words offers contextual information |
3.4.2. Approach
We developed a suite of supervised sentiment detectors using the features summarized in Table 7. These features are divided into two categories:
-
•
Polarity labels from individual detectors: for each unit, we have five polarity labels, one from each of the five SE-specific sentiment detectors.
-
•
Bag of words: for each unit, we produce a bag of words by applying preprocessing steps similar to SentiCR (Ahmed-SentiCRNIER-ASE2017, ), which are as follows:
-
–
Removal of stop words (as SentiCR, we used stopwords from NLTK and those provided by SentiCR).
-
–
Identification and annotation of negation. For example, “This isn’t good” will be preprocessed as “This is NOT_good”.
-
–
Identification and expansion of contractions. For example, “let’s” will be expanded to “let us”.
-
–
Detection of emojis. For example, ‘%-(’ will be replaced by a placeholder ‘NegativeSentiment’.
-
–
For our analysis, we used the entire dataset used in RQ1, i.e., all the 17,581 units. Also similar to RQ1, we used a 10-fold cross validation. We investigated a total of nine algorithms, both ensemble and non-ensemble. From the ensemble algorithms, we trained and tested four classifiers: (1) Random Forest (RF), (2) Gradient Boosting Classifier (GBT), (3) Adaboost, and (4) XGBoost. Ensemble algorithms, like bagging and boosting, are designed to combine the predictions of several base estimators. For example, an RF classifier creates multiple decision-trees based on random samples of training data and then makes a final decision by consulting the decisions of the individual trees. Each algorithm is widely used in machine learning. Models, like RF, are robust against overfitting and they work well with both categorical and numerical data, which is useful in our case because, as features, we consider both vectorized textual contents from an input unit and the sentiment polarity labels about the unit from stand-alone tools. We use the Python Sklearn API to experiment with the models. Following the Sklearn documentation, we obtain deterministic behavior during model fitting by setting a fixed integer to define the random state of a model. For example, we set random_state = 45 for the Random Forest model333https://scikit-learn.org/stable/modules/generated/sklearn.ensemble.RandomForestClassifier.html.
From the non-ensemble algorithms, we trained and tested five classifiers: (1) Logistic Regression (family = ‘Multinomial’), (2) SVM, (3) LASSO, (4) Naïve Bayes (Bernoulli), and (5) From neural network category, the Multi-layer Perceptron (MLP). Algorithms like SVM are used to design hybrid sentiment detection tools in other domains, like sentiment analysis in Twitter data (Balage-HybridSentimentDetectorTwitter-SemEval2014, ). Logistic Regression, LASSO, MLP, and Naïve Bayes are used in almost all kinds of regression and classification analysis. Naïve Bayes is found to offer reasonably good performance in sentiment detection in other domains (e.g., movie reviews) (Wang-BaselinesBigrams-ACL2012, ).
Following standard principles of machine learning, for each algorithm, we hyper tuned it on the six benchmark datasets under different configurations and picked the configurations that offered the best performance. We use the python scikit-learn GridSearchCV function for our hypertuning, which takes a list of configuration parameters and a range a values for each parameter to determine the best parameter values. For each algorithm, we studied all possible parameters. For example, we ran Random Forest algorithm by varying parameter values, such as number of decision trees, maximum tree depth, minimum number of leafs, etc. Similarly, for GBT we also tried changing the learning rate, and so on.
| Macro | Micro | ||||||
| F1 | P | R | F1 | P | R | ||
| SentiseadRF-B | 0.69 | 0.787 | 0.816 | 0.759 | 0.805 | 0.805 | 0.805 |
| SentiseadRF-N | 0.67 | 0.774 | 0.792 | 0.757 | 0.795 | 0.795 | 0.795 |
| Macro/Micro Performance Increase of SentiseadRF-B (i.e., Hybrid with Bag of | |||||||
| Words) Over Baseline (SentiSE = SentistrengthSE) | |||||||
| Majority | 0.61 | 5.5% | 1.2% | 9.4% | 4.8% | 4.8% | 4.8% |
| Senti4SD | 0.63 | 4.9% | 6.2% | 3.7% | 4.0% | 4.0% | 4.0% |
| SentiCR | 0.63 | 4.1% | 3.2% | 5.0% | 3.2% | 3.2% | 3.2% |
| SentiSE | 0.60 | 8.9% | 9.4% | 8.3% | 7.6% | 7.6% | 7.6% |
| Opiner | 0.35 | 39.8% | 42.9% | 36.5% | 34.8% | 34.8% | 34.8% |
| POME | 0.04 | 98.2% | 80.9% | 114.4% | 49.1% | 49.1% | 49.1% |
| Category | SentiseadB | SentiCR | Senti4SD | SentistrengthSE | Opiner | POME |
|---|---|---|---|---|---|---|
| Context (62) | 20% | 25% | 34% | 30% | 64% | 38% |
| Polarity (35) | 23% | 26% | 20% | 20% | 63% | 83% |
| Domain (23) | 9% | 35% | 4% | 30% | 65% | 78% |
| General (22) | 5% | 9% | 5% | 14% | 41% | 77% |
| Politeness (17) | 24% | 18% | 35% | 18% | 76% | 82% |
3.4.3. Results
Out of the nine supervised algorithms we trained and tested in our datasets, the Random Forest-based classifier performed the best based on both Macro and Micro F1-scores. This finding is not surprising, given Random Forest is by design an ensemble algorithm and it is found to be a good predictor in other SE-specific tasks (e.g., defect prediction (Misrili-IndustrialCaseStudyEnsembleSoftwareDefects-SQJ2011, )). We name the best performing Random Forest (RF) model in our analysis ‘SentiseadRF’. We ran Sentisead on two settings:
-
•
SentiseadRF-B: Using all the features described in Table 7.
-
•
SentiseadRF-N: Without using the bag of words in Table 7. That means, this classifier only uses five feature values for a given unit, each corresponding to a polarity label for the unit from an individual detector.
In Table 8, we compare the performance of SentiseadRF-B and SentiseadRF-N against the individual sentiment detectors as well as the Majority-All classifier from RQ2 (Section 3.2). The comparison shows the percentage increase in performance in Sentisead for a given metric over a baseline. For example, SentiseadRF-B shows a 5.5% increase in F1-score Macro over Majority-All classifier, which is computed as .
Overall, SentiseadRF-B perfoms better than SentiseadRF-N. Therefore, the incorporation of bag of words as additional features in SentiseadRF-B improves the performance of sentiment detection in the hybrid engine. The SentiseadRF-B also outperforms the stand-alone sentiment detectors, which it combines. The increase in performance varies across the tools and the metrics. For F1-score Macro, SentiseadRF-B offers 4.1-98.2% increase in performance over the individual detectors. For F1-score Micro, the hybrid engine offers 4-49% increase in performance over those detectors. The increase in performance is significant over two unsupervised detectors (Opiner, POME). Acroos the supervised and unsupervised individual detectors, SentiseadRF-B offers better increase in performance to detect positive and negative polarity instead of neutral polarities. For example, excluding POME, SentiseadRF-B offers 4.5-54.7% increase in performance to detect positive polarity (F1-score) and 7-44% increase in performance to detect negative polarity. For POME, SentiseadRF-B offers more than 500% increase in performance, due mainly to the fact that POME classifies more than 90% of units as neutral. POME is designed to rely on specific linguistic rules detect polarity aspects (e.g., performance), which when the tool found it was very accurate. However, due to its focus on such precision, it also missed correct polarity classes where those patterns were not present.
In Table 9, we show the coverage of the misclassification categories on the datasets of Table 6 from RQ3 (Section 3.3). Our hybrid engine Sentisead performs the best to reduce the mislassifications related to contextual information (20% in SentiseadRF-B vs 25% in SentiCR). Given that more than one third of the misclassifications are due to the failure of the tools to detect the contextual/pragmatics in the sentiment carrying expression, this particular focus of SentiseadRF-B is thus encouraging. SentiseadRF-B also offers performance boost over SentiCR while correcting errors related to ‘Domain specificity’ (9% vs 35%). Thus, the incorporation of bag of words as features helped SentiseadRF-B to disentagle the contextual information during polarity labeling. Overall, SentiseadRF-B shows lower coverage of the misclassifications over the unsupervised (except for ‘Diverse Polarity’ in SentistrengthSE). However, for the two misclassfication categories (‘Diverse Polarity’ and ‘Domain Specificity’) Sentisead still has slightly higher coverage than Senti4SD. For example, for units misclassified due to ‘Diverse Polarity’, Senti4SD shows 20% coverage while SentiseadRF-B shows 23% coverage. The cases related to ‘Politeness’ are due mainly to the heterogeneity in the labeling of the datasets, which we discuss in Section 5.
| Features | Rationale |
|---|---|
| Partial polarity | The polarity label may depend more on the first/last sentence of a unit. |
| Polarity entropy | The information entropy of polarity may reflect diverse polarity. |
3.5. RQ5 Can more features further improve the performance of the hybrid detector?
3.5.1. Motivation
The findings from RQ4 (Section 3.4) confirm that SentiseadRF-B, a supervised mode using Random Forest (RF) as an ensembler of stand-alone sentiment detectors can offer improved performance over the individual detectors. A closer look at the corrected misclassifications shows that the improvement occurred mainly on the understanding of underlying contextual information (see Table 9). This is not surprising, given features used in the hybrid engine were the polarity labels from individual detectors and the vectorized representation of units as bag of words. As shown in Table 9, SentiseadRF-B offers improved performance across the tools, but Senti4SD still slightly outperforms SentiseadRF-B while classifying units with diverse polarity and domain specificity. Given that the misclassifications due to the diverse polarity were second most in our manual analysis, it would be important to see if SentiseadRF-B (denoted as SentiseadRF hereon) can be further improved to handle those cases444For brevity, we will refer to SentiseadRF-B as SentiseadRF in the rest of the paper..
3.5.2. Approach
In addition to the features in Table 7 (i.e., polarity labels from SE-tools + Bag of words), we investigate two new categories of features:
-
•
Partial Polarity. We label a unit based on the polarity information we find in the first or last clause/sentence of the unit. We decided to use this feature based on the observations that sometimes the final polarity label of a given input unit depends more on the first or the last polarity expression in the unit. Similar features were also previously used to develop Senti4SD (Calefato-Senti4SD-EMSE2017, ).
-
•
Polarity Entropy. We compute entropy of a given unit following principles of information theory. We were motivated to use entropy as a feature, because entropy measures were found to be useful in various software engineering classification tasks previously, such as predict/triage software faults (Hassan-PredictingFaultsUsingCodeComplexity-ICSE2009, ; Khomh-EntropyEvaluationTriageMozillaCrash-WCRE2011, ). Intuitively, entropy can inform us of the underlying diversity of polarity/words in the input unit, which we hoped could be useful to make a better decision on the overall polarity label of the unit.
The new features are summarized in Table 10. We explain those below.
| Macro | Micro | ||||||
| F1 | P | R | F1 | P | R | ||
| SentiseadRF-B+ | 0.69 | 0.788 | 0.815 | 0.763 | 0.806 | 0.806 | 0.806 |
| SentiseadRF-BNE+ | 0.69 | 0.786 | 0.817 | 0.757 | 0.804 | 0.804 | 0.804 |
| SentiseadRF-BNP+ | 0.68 | 0.786 | 0.812 | 0.761 | 0.804 | 0.804 | 0.804 |
| SentiSeadRF-N+ | 0.65 | 0.757 | 0.77 | 0.744 | 0.779 | 0.779 | 0.779 |
| SentiseadRF-NNE+ | 0.66 | 0.768 | 0.786 | 0.751 | 0.791 | 0.791 | 0.791 |
| SentiseadRF-NNP+ | 0.65 | 0.756 | 0.769 | 0.744 | 0.779 | 0.779 | 0.779 |
| Sentisead: With bag of words. Sentisead: No bag of words. | |||||||
| NP = No partial polarity. NE = No polarity entropy | |||||||
| Category | B+ | BNE+ | BNP+ | N+ | NNE+ | NNP+ |
|---|---|---|---|---|---|---|
| Context (62) | 18% | 21% | 18% | 26% | 25% | 26% |
| Polarity (35) | 23% | 26% | 26% | 23% | 17% | 29% |
| Domain (23) | 9% | 9% | 9% | 9% | 9% | 13% |
| General (22) | 5% | 5% | 5% | 9% | 9% | 9% |
| Politeness (17) | 24% | 24% | 24% | 24% | 24% | 24% |
| B+: With bag of words. N+: No bag of words. | ||||||
| NP = No partial polarity. NE = No polarity entropy | ||||||
3.5.3. Results
SentiseadRF-B+ offers a very marginal increase in performance over SentiseadRF (0.001 increase in Macro F1-score). Therefore, the inclusion of the new features into SentiseadRF does not seem effective to further improve its performance over the stand alone detectors. To further understand the impact of the new features, in Table 11, we report the performance of SentiseadRF with the additional features in six different settings:
-
(1)
Sentisead: with features bag of words + polarity labels from SE-tools + partial polarity + polarity entropy.
-
(2)
SentiseadRF-BNP+: with features bag of words + polarity labels from SE-tools + polarity entropy.
-
(3)
SentiseadRF-BNE+: with features bag of words + polarity labels from SE-tools + partial polarity.
-
(4)
SentiseadRF-N+:with features polarity labels from SE-tools + partial polarity + polarity entropy.
-
(5)
SentiseadRF-NNP+:with features polarity labels from SE-tools + polarity entropy.
-
(6)
SentiseadRF-NNE+:with features polarity labels from SE-tools + partial polarity.
The models with bag of words perform better than those without bag of words as features. Both SentiseadRF-BNP+ (i.e., without partial polarity) and SentiseadRF-BNE+ (i.e., without polarity entropy) show a Marco F1-score 0.786, but they differ from each other based on precisions and recalls. The precision is higher for SentiseadRF-BNE+ between the settings, but the recall is higher for SentiseadRF-BNP+. Therefore, the two features while combined with bag of words features, were able to slightly improve the overall performance than SentiseadRF.
In Table 12, we show the distribution of error categories across the six settings. Overall, the inclusion of the new features has reduced the coverage of errors due to contextual information from 20% (SentiseadRF) to 18% (SentiseadRF-B+). There is no impact of the new features on the other four error categories. A closer look at the settings, however, shows that the partial polarity features were successful to reduce errors related to diverse polarity. For example, SentiseadRF-NNE+ shows a coverage of 17% for errors related diverse polarity. This setting is trained using only the polarity labels from the five SE-tools and the partial polarity labels. However, those corrections were ignored in SentiseadB+ tool, which shows a coverage of 23% of errors related to diverse polarity. Thus, SentiseadRF-B+ gave more preference over bag of words features than partial polarity features while making the final decisions on a polarity label. For example, the following unit was correctly labeled as positive by SentiseadRF-NNE+ (due to first sentence being positive), but incorrectly labeled as neutral by SentiseadRF-B+: “Looks excellent. Really sweet. …[4 more sentences] …+ Can you add a note on how you’ve changed how REST works high-level? Thats all for now.”
4. Study Phase 2: Ensemble with Deep Learning Models
In a second phase, we answer three more research questions introduced in Section 1:
-
(6)
Can Sentisead outperform the BERT-based advanced pre-trained language based models? (Section 4.1)
-
(7)
Can a deep learning model for Sentisead outperform the BERT-based models? (Section 4.2)
-
(8)
Can Sentisead based on an ensemble of all the individual models offer the best performance of all tools? (Section 4.3)
4.1. RQ6 Can SentiseadRF outperform the BERT-based advanced pre-trained language based models?
4.1.1. Motivation
As we explained in Section 1, we started our analysis of the feasibility of developing a hybrid tool of SE-specific sentiment detectors before deep learning models for sentiment detection in SE were described. Recent studies show that deep learning models, specially language-based pre-trained transformer models (PTMs) can be trained using SE-specific data to offer performance superior to the traditional shallow learning models (Zhang-SEBERTSentiment-ICSME2020, ; Biswas-ReliableSentiSEBERT-ICSME2020, ).
The most recent paper on this topic is by Zhang et al. (Zhang-SEBERTSentiment-ICSME2020, ), who reported that models like BERT and RoBERTa can outperform stand-alone rule-based and shallow learning models (e.g., Senti4SD, SentiCR). Therefore, we must analyze whether such PTMs could also outperform Sentisead, i.e., our hybrid of stand-alone rule-based and shallow learning sentiment detection tools.
4.1.2. Approach
We investigate all the four PTMs from Zhang et al. (Zhang-SEBERTSentiment-ICSME2020, ), i.e., BERT, RoBERTa, ALBERT, and XLNet. For each of the studied dataset, we train and test the performance of each model using the same 10-fold cross-validation that we used to answer RQ1 (see Section 3.1.2). Similar to Zhang et al. (Zhang-SEBERTSentiment-ICSME2020, ), we also fine-tune the hyperparameters for the PTMs. Following Delvin et al. (Delvin-BERTArch-Arxiv2018, ), we investigate with the following hyperparameters: (1) Batch size, (2) Number of epochs, and (3) Learning rate. For all the PTMs, we find the following parameters after fine-tuning: batch size of 16, 4 epochs, and a learning rate of . The values are similar to those reported by Zhang et al. (Zhang-SEBERTSentiment-ICSME2020, ).
| Macro | Micro | ||||||
|---|---|---|---|---|---|---|---|
| F1 | P | R | F1 | P | R | ||
| BERT | 0.70 | 0.793 | 0.793 | 0.792 | 0.81 | 0.81 | 0.81 |
| Macro/Micro Change Over SentiseadRF | – | 0.8% | -2.8% | 4.3% | 0.6% | 0.6% | 0.6% |
| RoBERTa | 0.71 | 0.801 | 0.799 | 0.804 | 0.815 | 0.815 | 0.815 |
| Macro/Micro Change Over SentiseadRF | – | 1.8% | -2.1% | 5.9% | 1.2% | 1.2% | 1.2% |
| ALBERT | 0.69 | 0.787 | 0.795 | 0.78 | 0.806 | 0.806 | 0.806 |
| Macro/Micro Change Over SentiseadRF | – | 0.0% | -2.6% | 2.8% | 0.1% | 0.1% | 0.1% |
| XLNet | 0.70 | 0.799 | 0.797 | 0.8 | 0.814 | 0.814 | 0.814 |
| Macro/Micro Change Over SentiseadRF | – | 1.5% | -2.3% | 5.4% | 1.1% | 1.1% | 1.1% |
| Category | BERT | RoBERTa | Albert | XLNet | SentiseadB |
|---|---|---|---|---|---|
| Context/Pragmatics (62) | 16% | 21% | 21% | 26% | 20% |
| Diverse Polarity (35) | 11% | 9% | 17% | 17% | 23% |
| Domain Specificity (23) | 9% | 9% | 13% | 13% | 9% |
| General Error (22) | 9% | 14% | 14% | 9% | 5% |
| Politeness (17) | 18% | 24% | 24% | 24% | 24% |
4.1.3. Results
In Table 13, we present the performance of the four stand-alone PTMs across the six benchmark datasets. For each model, we also show how the performance of the model improved/decreased compared to SentiseadB from RQ4 (i.e., the hybrid of the five rule-based and shallow learning models based on Random Forest).
In terms of Macro F1-score, all the PTMs offer slightly better performance than SentiseadB. The increase in Macro F1-score in the PTMs compared to SentiseadB is due to the increase in recall but not in precision. RoBERTa shows the best Macro F1-score of 0.801, which outperforms SentiseadB by 1.8%. It also shows the best recall of 0.804, which outperforms SentiseadB by 5.9%. It also has the best precision of 0.799 among the four PTMs, which is 2.1% less than the Macro precision of SentiseadB.
A closer look at the class-based performance shows that the drop in precision is 7.1% in RoBERTa compared to SentiseadB for both positive and negative polarity classes, while the increase in recall is 13.9% and 15.3% for the positive and negative classes, respectively. Thus, with PTMs like RoBERTa, we can expect to find more instances of polarity classes compared to SentiseadB, but that also contributes to a loss of precision. In terms of F1-score, RoBERTa outperforms SentiseadB for all polarity by 0.5% (neutral), 3.1% (positive), and 4.1% (negative).
Table 14 shows the distribution of error categories by the four PTMs in the dataset and categories from Table 6. Among the four PTMs, BERT has the lowest number of errors related to contexts/pragmatics (16%) and politeness (18%), while RoBERTa has the lowest number of errors for two other categories (diverse polarity and domain specificity, both 9%). Both BERT and XLNet show the lowest number of errors under the general category (9%). The last column in Table 14 shows the distribution of error categories in the same dataset by SentiseadB (taken from Table 9).
Overall, the best performing PTM (in terms of Macro F1-score), RoBERTa improves on SentiseadB in this dataset in only one of the five error categories, diverse polarity (23% in SentiseadB vs. 9% in RoBERTa). For example, RoBERTa corrects the following misclassification of SentiseadB from neutral to positive, “Seeing all the information and activity, it does look very constructive and _perhaps_ it shouldn’t have been closed so eagerly!”. RoBERTa also corrects this misclassification of SentiseadB from neutral to negative: “The problem is, the application is developed in Java not python” (in Lin et al. (Lin-SentimentDetectionNegativeResults-ICSE2018, ) app review dataset).
Therefore, when we can afford to use GPUs that are required to develop the PTMs and when we need even slight performance improvement like 1.8% (Macro F1-score) over a hybrid of shallow and rule-based models in SentiseadB, we could use the PTMs. Otherwise, SentiseadRF might be sufficient to meet real-world needs for sentiment detection in SE.
4.2. RQ7 Can a deep learning model for Sentisead outperform the BERT-based models?
4.2.1. Motivation
As we observed in RQ6, the stand-alone PTMs slightly outperform SentiseadB, i.e., the Random Forest-based hybrid of five rule-based and shallow learning SE-specific sentiment detectors (Opiner, POME, Senti4SD, SentiCR, and SentistrengthSE). The PTMs offer better recall than SentiseadB, but suffers from lower precision. The current ensembler in SentiseadB is a Random Forest, which is a shallow learning model. Therefore, we investigate whether we could further improve the performance of SentiseadB by introducing a PTM as ensembler.
4.2.2. Approach
Our goal is to replace the Random Forest algorithm in SentiseadB by the PTMs from RQ6, as follows. For each studied dataset, we do a 10-fold cross validation using a PTM following an approach similar to RQ1 in Section 3.1.2. Each iteration takes as input the following features for each unit: bag of words and sentiment polarity labels of the five rule-based and shallow models (i.e., OpinerPOME, Senti4SD, SentiCR, and SentistrengthSE). The target value is the manual label for each unit. Instead of Random Forest as ensembler, we use one of the PTM. Therefore, for each studied datasets, we do a total of runs, 10 for each of the PTMs and therefore iterations. We call the new ensemble models SentiseadBERT, SentiseadRoBERTa, SentiseadALBERT, and SentiseadXLNet when using BERT, RoBERTa, ALBERT, and XLNet, respectively.
| Macro | Micro | ||||||
|---|---|---|---|---|---|---|---|
| F1 | P | R | F1 | P | R | ||
| SentiseadBERT | 0.69 | 0.791 | 0.791 | 0.79 | 0.807 | 0.807 | 0.807 |
| Macro/Micro Change Over SentiseadRF | – | 0.5% | -3.1% | 4.1% | 0.2% | 0.2% | 0.2% |
| Macro/Micro Change Over BERT | – | -0.3% | -0.3% | -0.3% | -0.4% | -0.4% | -0.4% |
| SentiseadRoBERTa | 0.72 | 0.805 | 0.807 | 0.803 | 0.82 | 0.82 | 0.82 |
| Macro/Micro Change Over SentiseadRF | – | 2.3% | -1.1% | 5.8% | 1.9% | 1.9% | 1.9% |
| Macro/Micro Change Over RoBERTa | – | 0.5% | 1.0% | -0.1% | 0.6% | 0.6% | 0.6% |
| SentiseadALBERT | 0.68 | 0.779 | 0.779 | 0.779 | 0.798 | 0.798 | 0.798 |
| Macro/Micro Change Over SentiseadRF | – | -1.0% | -4.5% | 2.6% | -0.9% | -0.9% | -0.9% |
| Macro/Micro Change Over ALBERT | – | -1.0% | -2.0% | -0.1% | -1.0% | -1.0% | -1.0% |
| SentiseadXLNet | 0.71 | 0.8 | 0.799 | 0.801 | 0.815 | 0.815 | 0.815 |
| Macro/Micro Change Over SentiseadRF | – | 1.7% | -2.1% | 5.5% | 1.2% | 1.2% | 1.2% |
| Macro/Micro Change Over XLNet | – | 0.1% | 0.3% | 0.1% | 0.1% | 0.1% | 0.1% |
| Category | SentiseadBERT | SentiseadRoBERTa | SentiseadALBERT | SentiseadXLnet |
|---|---|---|---|---|
| Context/Pragmatics (62) | 21% | 23% | 33% | 30% |
| Diverse Polarity (35) | 17% | 14% | 4% | 11% |
| Domain Specificity (23) | 9% | 4% | 17% | 4% |
| General Error (22) | 9% | 9% | 14% | 9% |
| Politeness (17) | 12% | 29% | 18% | 24% |
4.2.3. Results
Table 15 shows the performance of the four new PTM-based ensemblers SentiseadRoBERTa, SentiseadBERT, SentiseadALBERT, and SentiseadXLNet. It also reports how their performances are different from those of SentiseadB and the stand-alone PTMs.
In terms of Macro F1-score, SentiseadRoBERTa is the best performer with an F1-score of 0.805. It outperforms SentiseadB by 2.3% and the stand-alone RoBERTa model by 0.5%. The second best performer is SentiseadXLNet with a Macro F1-score of 0.8, which outperforms SentiseadB by 1.7% and the stand-alone XLNet by 0.1%. The other two ensemblers, SentiseadBERT and SentiseadALBERT perform worse than the corresponding stand-alone models (i.e., BERT and ALBERT, respectively).
Similar to the stand-alone PTM, RoBERTa, the increase in F1-score of SentiseadRoBERTa over SentiseadB is due to a higher recall. However, SentiseadRoBERTa does have better precision than RoBERTa: the incorporation of polarity labels from the five rule-based and shallow learning models has reduced the loss of precision from SentiseadB from 7.1% (in RoBERTa) to 6.2% in SentiseadRoBERTa.
Table 16 reports the distribution of error categories per ensembler PTMs on the dataset and categories from Table 6. The best SentiseadRoBERTa shows a reduction from stand-alone RoBERTa in misclassifications for two error categories (domain specificity from 9% to 4% and general error from 14% to 9%). For the other three error categories, the performance of SentiseadRoBERTa is actually lower than the stand-alone RoBERTa mode. For example, for errors related to lack of context/pragmatics, SentiseadRoBERTa shows the error in 23% of all cases. In contrast, stand-alone RoBERTa shows the error in 21% of all such cases. This means that the ensemble model was slightly more confused to correct such errors compared to the stand-alone model. This confusion could arise in the ensembler from the polarity labeling of stand-alone tools, which themselves can be confused with the exact polarity labeling of a sentence. This can happen for different reasons like the underlying context was implicit, or it was not annotated properly during the manual labeling. Indeed, subjectivity in annotation can be a problem with SE-specific datasets (see Novielli et al. (Novielli-BenchmarkStudySentiSE-MSR2018, ; Uddin-OpinionValue-TSE2019, )). A detailed understanding of the exact reasons of performance drop in a deep learning ensembler compared to the stand-alone PTMs requires the analysis of the PTMs and the ensemblers based on the principles of explainable/interpretable machine learning, which we leave as our future work. Nevertheless, it is arguable whether a performance improvement of 0.5% over stand-alone PTM does warrant a PTM-based ensembler over a stand-alone PTM.
4.3. RQ8 Can Sentisead based on an ensemble of all the individual models offer the best performance?
4.3.1. Motivation
Our findings from RQ6 show that stand-alone PTMs, like RoBERTa, can outperform SentiseadB based on shallow learning. Our findings from RQ7 show that an ensemble of the five rule-based and shallow learning models based on PTMs, like SentiseadRoBERTa, can offer 0.5% increase in Macro F1-score over the stand-alone RoBERTa model. Given the superiority of the stand-alone PTM over SentiseadB, we want to learn whether an ensemble of all the available stand-alone models (i.e., rule-based, shallow, and PTMs) could offer the best performance of all the available ensemblers and stand-alone models.
4.3.2. Approach
We replicate the approach of RQ7 for each dataset as follows. We perform a 10-fold cross validation similar to the approach in Section 3.1.2. For each unit in a dataset, we consider the following items as input features: textual contents of the unit as vectors in word embedding, sentiment polarity labels from the five rule-based and shallow learning models and the four PTMs. The target is the sentiment polarity label based on manual label. For the ensembler, we use one PTM at a time. As such, similar to RQ7, for each PTM as an ensembler, we run 10 iterations per dataset. We report the performance of the ensemblers on the test dataset. The ensembler model is named after each PTM as follows: Sentisead, Sentisead, Sentisead, and Sentisead.
| Macro | Micro | ||||||
|---|---|---|---|---|---|---|---|
| F1 | P | R | F1 | P | R | ||
| SentiseadBERT+ | 0.69 | 0.79 | 0.79 | 0.79 | 0.807 | 0.807 | 0.807 |
| Macro/Micro Change Over SentiseadRF | – | 0.4% | -3.2% | 4.1% | 0.2% | 0.2% | 0.2% |
| Macro/Micro Change Over SentiseadBERT | – | -0.1% | -0.1% | 0.0% | 0.0% | 0.0% | 0.0% |
| Macro/Micro Change Over BERT | – | -0.4% | -0.4% | -0.3% | -0.4% | -0.4% | -0.4% |
| SentiseadRoBERTa+ | 0.71 | 0.8 | 0.797 | 0.802 | 0.814 | 0.814 | 0.814 |
| Macro/Micro Change Over SentiseadRF | – | 1.7% | -2.3% | 5.7% | 1.1% | 1.1% | 1.1% |
| Macro/Micro Change Over SentiseadRoBERTa | – | -0.6% | -1.2% | -0.1% | -0.7% | -0.7% | -0.7% |
| Macro/Micro Change Over RoBERTa | – | -0.1% | -0.3% | -0.2% | -0.1% | -0.1% | -0.1% |
| SentiseadALBERT+ | 0.68 | 0.783 | 0.784 | 0.782 | 0.801 | 0.801 | 0.801 |
| Macro/Micro Change Over SentiseadRF | – | -0.5% | -3.9% | 3.0% | -0.5% | -0.5% | -0.5% |
| Macro/Micro Change Over SentiseadALBERT | – | 0.5% | 0.6% | 0.4% | 0.4% | 0.4% | 0.4% |
| Macro/Micro Change Over Albert | – | -0.5% | -1.4% | 0.3% | -0.6% | -0.6% | -0.6% |
| SentiseadXLNet+ | 0.70 | 0.797 | 0.795 | 0.799 | 0.811 | 0.811 | 0.811 |
| Macro/Micro Change Over SentiseadRF | – | 1.3% | -2.6% | 5.3% | 0.7% | 0.7% | 0.7% |
| Macro/Micro Change Over SentiseadXLNet | – | -0.4% | -0.5% | -0.2% | -0.5% | -0.5% | -0.5% |
| Macro/Micro Change Over XLNet | – | -0.3% | -0.3% | -0.1% | -0.4% | -0.4% | -0.4% |
| Category | SentiseadBERT+ | SentiseadRoBERTa+ | SentiseadALBERT+ | SentiseadXLNet+ |
|---|---|---|---|---|
| Context/Pragmatics (62) | 21% | 26% | 25% | 25% |
| Diverse Polarity (35) | 14% | 14% | 14% | 11% |
| Domain Specificity (23) | 9% | 4% | 9% | 0% |
| General Error (22) | 5% | 14% | 9% | 14% |
| Politeness (17) | 18% | 18% | 24% | 24% |
4.3.3. Results
Table 17 reports the performance of the four new PTM-based ensemblers that produce the sentiment polarity label for a unit by taking as input the unit and the polarity labels from eight stand-alone sentiment detectors for SE (rule-based, shallow-learning, and four PTMs). For each model, like Sentisead, we also compare how its performance has increased/decreased against previous tools like SentiseadB, stand-alone PTM (i.e, BERT), and the ensembler from RQ7 (i.e., BERT-based ensembler of five rule-based and shallow learning models).
The best performing model is Sentisead, with a Macro F1-score of 0.8. This F1-score is lower than the F1-score of SentiseadRoBERTa, which is 0.805. The inclusion of polarity labels from the PTMs has not increased the performance of Sentisead. However, Sentisead does show an increase of 1.7% in Macro F1-score over SentiseadB. Overall, among the four ensemblers in this RQ, only Sentisead shows a Macro F1-score lower than SentiseadB. These findings are consistent with those from RQ7 and RQ6 and recent results from Zhang et al. (Zhang-SEBERTSentiment-ICSME2020, ), which show that deep learning models offer better performance than rule-based and shallow learning models for SE-specific sentiment detection.
However, as shown in RQ6 to RQ7, the increase in performance is at most 2.3% over the shallow learning-based ensembler (which we observed in SentiseadRoBERTa). In addition, the lack of performance improvement in PTM-based ensembler of all stand-alone models in this RQ can serve as a guidance that a hybrid tool cannot outperform other tools by simply adding polarity labels from all available stand-alone SE-specific sentiment detectors.
5. Discussions
In this section, we discuss major themes we observed during the analysis of our study results.
5.1. The Underwhelming Roles of Polarity Entropy Metrics in Sentiment Labeling
The findings from RQ5 suggest that the three polarity entropy metrics were not effective to further improve the performance of our hybrid sentiment detection engine. To determine the root cause of this, we assessed the impact of the diversity metrics on the misclassification of the polarity labels from the three tools, Senti4SD, SentiCR and SentistrengthSE. The three tools are the three most dominant features in Sentisead. For each tool, the response variable is “Misclassification”, i.e., for a given unit whether the tool output is wrong or not. The explanatory variables are the four diversity metrics above, i.e., entropy measurements using polarity, adjective, and verb. To fit and interpret the models, we follow standard practices in the literature (Patanamon-ReviewParticipationInCodeReview-JournalEMSE2017, ; Valiev-EcosystemLevelSurvivalPyPI-FSE2018, ): (1) When fitting the models, we test for multicollinearity between the explanatory variables using the Variable Inflation Factor (VIF), and remove variables with VIF scores above the recommended maximum of 5 (Cohen-AppliedMultipleRegression-Lawrence2002, ). (2) When interpreting the models, we consider coefficient importance if they are statistically significant (). We also estimate their effect sizes based on ANOVA type-2 analyses (column “LR-Chisq” of Table 19). (3) We report the goodness of fit using the McFadden’s pseudo . In Table 19, we show the results of regression models of each of the three tools for the inputs for which the tool was wrong but at least one of the other two tools was right, i.e., the wrong tool could have benefited from the correct classifications from other tools. The is statistically significant for each tool, i.e., the misclassification of each tool increases with the increase in the diversity of polarity words. The is significant for SentiCR and is significant for SentistrengthSE. However, the is only between 3.06-3.86%. That means that the entropy metrics can only capture around 3-4% of variations in the data while correcting a tool. This low impact can become negligible in the presence of more dominant features, e.g., bag of words.
| Senti4SD | SentiCR | SentistrengthSE | |||||||
| Pseudo = 3.06% | Pseudo = 3.86% | Pseudo = 3.74% | |||||||
| Coeffs | Std. Err | LR Chisq | Coeffs | Std. Err | LR Chisq | Coeffs | Std. Err | LR Chisq | |
| (Intercept) | 2.66*** | 0.27 | -2.77*** | 0.27 | -1.64*** | 0.22 | |||
| Polarity Entropy | 0.45*** | 0.11 | 25.72*** | 0.52*** | 0.11 | 36.15*** | 0.64*** | 0.10 | 75.16*** |
| Adjective Entropy | 0.01 | 0.11 | 0.01 | 0.23* | 0.11 | 4.57* | 0.01 | 0.10 | 0.00 |
| Verb Entropy | 0.01 | 0.12 | 0.11 | -0.17 | 0.12 | 1.50 | 0.22* | 0.10 | 6.07* |
| Signif. codes: ***, **, * | |||||||||
5.2. Issues with Politeness in Sentiment Labeling
17 of the 153 manually analyzed misclassified units in our complementary dataset (Section 3.3) were related to the confusions among the sentiment tools to handle politeness. While around 76% of those were corrected by Sentisead, the the rest 24% remained misclassified across all the different settings of Sentisead and Sentisead+ (see Table 9). There are two main reasons for this. First, the presence of politeness does not necessarily make a unit positive. Second, the manual annotation of units carrying politeness were judged differently by different human raters in the benchmarks. For example, the following is labeled as neutral in the Jira Ortu et al. (Ortu-BulliesMoreProductive-MSR2015, ) dataset, “Jacopo Thanks for diving in a pointing Scott at the appropriate screens.”. However, the following is labeled as positive in the same dataset “Patch applied! Thanks.”. This discrepancy can confuse a supervised classifier, including Sentisead.
5.3. The Problems with Contextual Inference Using Surrounding Sentences in Sentiment Detection
Among the six benchmark datasets in our study, SentiseadB achieves 0.83-0.98 F1-score to label both positive and negative classes for four datasets: Jira and App reviews from Lin et al. (Lin-SentimentDetectionNegativeResults-ICSE2018, ), SO Calefato et al. (Calefato-Senti4SD-EMSE2017, ), and Jira Ortu et al. (Ortu-BulliesMoreProductive-MSR2015, ). Sentisead shows only 0.31-0.47 F1-scores for the positive and negative classes in other two datasets: SO Lin et al. (Lin-SentimentDetectionNegativeResults-ICSE2018, ) and SO Uddin et al. (Uddin-OpinionValue-TSE2019, ), with the worst in SO Uddin et al. (Uddin-OpinionValue-TSE2019, ). Both of these use data from Stack Overflow. The SO Uddin et al. (Uddin-OpinionValue-TSE2019, ) dataset is different from other benchmarks, because it is based on all the sentences from 1338 posts from Stack Overflow. Thus, when the raters were presented those sentences, they also saw other sentences immediately after and before the sentences. This surrounding contextual information influenced their annotation. This particular issue was also discussed in Uddin et al. (Uddin-OpinionValue-TSE2019, ). The SO Lin et al. (Lin-SentimentDetectionNegativeResults-ICSE2018, ) benchmark seems to have the same problem. For example, the following sentence is rated as ‘negative’ in the dataset “I am not sure about Map implementation in HazelCast.” No sentiment detection tool is designed to check such domain specificity and surrounding sentences as contexts during the polarity classification. Therefore, further improvement in Sentisead for these two datasets will need the development of algorithms to handle such domain specificity and contextual information.
5.4. Run-time Performance
In Section 1 (Introduction), we write about different use cases for Sentisead: Sentisead is useful for situations where we do not want to pick different tools for different datasets. Instead, we simply run each stand-alone tool for a given dataset and let Sentisead make the final decision on sentiment polarity.
An analysis can be done offline or online. For example, when analyzing millions of code reviews from a large software system like OpenStack, we expect that the sentiment detection would be done offline and not in real-time. Nevertheless, we were able to run all stand-alone tools within reasonable time e.g, SentiCR for any dataset for one iteration (i.e., one of the 10-folds) took around 2 minutes (training + testing). Note that this was done on a Laptop machine with only 2 cores and 4GB RAM. During testing, for a given sentence, SentiCR (Ahmed-SentiCRNIER-ASE2017, ) was able to produce a polarity label in less than a second. Please note that like any machine learning model, the training of a tool takes the most amount of time (often around 95%). This is true for any currently available SE-specific sentiment detection tool. With advances in computing infrastructure, parallel processing, and high-performance computing, we can expect to further reduce such training and testing time. Indeed, we had some performance issues with Senti4SD (Calefato-Senti4SD-EMSE2017, ) initially, but Senti4SD was recently updated to a new and faster version to support large-scale data. Therefore, while the training of such a tool takes the majority of time in Sentisead, the tool can make a polarity label on a given unit at run-time in a short time (as noted above with SentiCR example). Indeed, Sentisead can determine the polarity label of a given unit in less than a second, given it is built on SentiCR - which as noted above is fast to produce labels. Note that, we previously analyzed large number of OpenStack code reviews in a reasonably short time using some of the the studied tools in this paper (e.g., Senti4SD, SentiCR) (please see Asri et al. (Ikram-SentimentCodeReview-IST2019, )).
5.5. The Role of Features in Sentisead Accuracy Improvement
An important area of research in machine learning is the handling of overfitting of a machine learning model. Indeed, in machine learning literature, it is a standard practice to prune the feature space of a model to improve model inference runtime. Models like Random Forest are designed to handle overfitting efficiently by automatically pruning the decision trees. In RQ4 (Section 3.4), we find that a Random Forest-based hybrid tool is the best performer in each individual dataset. In RQ5 (Section 3.5), we find that by simply adding extra features (e.g., partial polarity, polarity entropy), we could not gain notable performance improvement in the new hybrid tool in RQ5 (i.e., SentiseadB+) over the the hybrid tool from RQ4 (i.e, SentiseadB). In RQ8, we attempted to develop a hybrid Sentisead engine by taking polarity labels of all 9 stand-alone sentiment detectors (5 rule-based and shallow learning and 4 BERT-based PTMs from Zhang et al. (Zhang-SEBERTSentiment-ICSME2020, )). We found that this Sentisead engine performed a bit worse than the Sentisead engine that only took polarity labels from 5 rule-based and shallow learning sentiment detectors. These three observations offer insights that by simply adding new features, we cannot not improve the performance of our hybrid sentiment detection tool.
5.6. Best Performers Per Dataset
When we analyzed the results of each tool, we analyzed along two dimensions: Per dataset and across all datasets. We provide a detailed explanation of how we trained and tested each tool per dataset in Section 3.1.2. We also explain in Section 3.1.2, how we combine the test results from each dataset to report an overall performance score of a tool across the six datasets.
An overall performance score across the six datasets informs us of the overall effectiveness of a tool across the six datasets. This score is important given that these datasets are designed for different purposes. As noted in Section 1, the major motivation behind designing our hybrid tool Sentisead was to obtain better results than the stand-alone sentiment detectors on diverse datasets. This overall performance score tells us whether the tool does indeed outperform each stand-alone tool across the datasets using a single metric.
Given that we studied six benchmark datasets, nine stand-alone sentiment detection tools, various settings of our hybrid tool Sentisead by answering eight research questions in the revised manuscript, it is a non-trivial to report the performance of each studied tool and the hybrid tool for each research question per studied dataset: doing so would be lengthy and difficult to read. Nevertheless, we share the results of each tool per dataset and per research question in our online replication package (website:senisead-online-appendix-ase2020, ). In Table 20, we report the top three tools in each dataset of our study based in Macro F1 score.
| Dataset | First | Second | Third | |||
|---|---|---|---|---|---|---|
| Tool | F1 | Tool | F1 | Tool | F1 | |
| JIRA Lin et al. (Lin-SentimentDetectionNegativeResults-ICSE2018, ) | SentistrengthSE | 0.98 | SentiseadBERT | 0.97 | RoBERTa | 0.97 |
| SO Uddin et al. (Uddin-OpinionValue-TSE2019, ) | SentiseadXLNet | 0.59 | SentiseadXLNet+ | 0.59 | SentiseadRoBERTa | 0.59 |
| Mobile App Lin et al. (Lin-SentimentDetectionNegativeResults-ICSE2018, ) | BERT | 0.72 | SentiseadRoBERTa | 0.68 | RoBERTa | 0.62 |
| SO Lin et al. (Lin-SentimentDetectionNegativeResults-ICSE2018, ) | SentiseadRoBERTa+ | 0.78 | RoBERTa | 0.77 | SentiseadXLNert+ | 0.74 |
| SO Calefato et al. (Calefato-Senti4SD-EMSE2017, ) | SentiseadRoBERTa | 0.89 | SentiseadXLNet | 0.88 | RoBERTa | 0.88 |
| JIRA Ortu et al.. (Ortu-BulliesMoreProductive-MSR2015, ) | XLNet | 0.83 | SentiseadRoBERTa | 0.82 | SentiseadRoBERTa+ | 0.82 |
Around 61% (i.e., 11 out of the 18) places of the best performing tools in Table 20 are occupied by the different ensemble combinations of Sentisead (e.g., SentiseadRoBERTa), while 33% of the tools (i.e., 6 out of 18) are the stand-alone PTMs, and the rest (i.e., 1 out of 18) of the tools is SentistrengthSE. Among the 61% places occupied by Sentisead variations, all datasets contain different combinations of the PTMs as the ensembler. For the one dataset (JIRA Lin et al. (Lin-SentimentDetectionNegativeResults-ICSE2018, )), where SentistrengthSE is the best performer with a Macro F1-score of 0.98, the second best are two tools with an F1-score of 0.97 (Sentisead and RoBERTa). For the other five datasets, the topmost performer is Sentisead-based in three SO-related datasets: SO Uddin et al. (Uddin-OpinionValue-TSE2019, ), SO Lin et al. (Lin-SentimentDetectionNegativeResults-ICSE2018, ), and SO Calefato et al. (Calefato-Senti4SD-EMSE2017, ). For the other two datasets, stand-alone PTMs are the best performers: BERT for Mobile App Lin et al. (Lin-SentimentDetectionNegativeResults-ICSE2018, ) and XLNet for JIRA Ortu et al.. (Ortu-BulliesMoreProductive-MSR2015, ). The findings denote that PTMs as stand-alone tool or as an ensembler of existing tools can be the best candidates to detect sentiments in diverse SE-specific datasets.
6. Threats to Validity
We discuss the threats to validity of our studies following common guidelines for empirical studies (Woh00, ).
Construct Validity Threats concern the relation between theory and observations. In our study, they could be due to measurement errors. For our manual labeling of error categories, we followed the coding guide and examples of Novielli et al. (Novielli-BenchmarkDatasetSentiSE-MSR2018, ). This is not first time we did the manual labeling of such error categories. In our previously published paper (Uddin-OpinionValue-TSE2019, ), we did similar exercise on a different dataset. Nevertheless, similar to Novieli et al. (Novielli-BenchmarkDatasetSentiSE-MSR2018, ), we found three error categories: Contextual information, Politeness, and General Errors. In addition, we found two new error categories: Domain-specificity and presence of diverse polarity. We provide examples of each category in Section 3 (RQ3). In addition, we share the manually labeled dataset in our online appendix (website:senisead-online-appendix-ase2020, ).
Internal validity warrants the presence of systematic error (e.g., bias) in the study. This can happen due to the reporting of a performance metric that may not be standard or the due to the error in the computation of the standard metric. We mitigated the first bias by reporting standard metrics used in the literature. For example, we compute both Macro and Micro scores, following standard reporting practices in sentiment analysis for software engineering. We mitigated the second concern by confirming the computation of the metrics against the same metrics that are presently computed in widely used open source libraries (e.g., scikit-learn (website:scikitlearn, )). In addition, we also report the details of how each metric parameters are computed (e.g., true positives, false positives, etc.).
External validity concerns the generalizability of the results presented in this paper, which are based on six publicly-available sentiment benchmarks. Together, these benchmarks consist of more than 17K units (sentences, posts, etc.), each manually annotated for polarity by multiple coders. Therefore, our evaluation corpus is bigger than any previous research on sentiment detection for software engineering.
Reliability concerns the possibility of replicating this evaluation. We provide the necessary details in an online appendix (website:senisead-online-appendix-ase2020, ).
7. Related Work
Sentiment analysis in SE research has focused on two main areas: studying sentiments SE repositories/scenarios (Section 7.1) and developing tools to improve sentiment detection in SE (Section 7.2).
7.1. Studying Sentiments SE Repositories/Scenarios
A significant number of studies are conducted to analyze the prevalence and impact of sentiments in SE repositories and development scenarios, such as IT tickets (Castaldi-SentimentAnalysisITSupport-MSR2016, ), collaborative distributed team communications (Guzman-SentimentAnalysisGithub-MSR2014, ), twitter feeds (Guzman-NeedleInHaystackTwitterSoftware-RE2016, ), commit logs (Sinha-DeveloperSentimentCommitLog-MSR2016, ), security-related discussions in GitHub (Pletea-SecurityEmotionSE-MSR2014, ), API reviews from developer forums by resolving API mentions and by associating opinions to the API mentions (Uddin-OpinionValue-TSE2019, ; Uddin-OpinionSurvey-TSE2019, ; Uddin-OpinerReviewAlgo-ASE2017, ; Uddin-OpinerReviewToolDemo-ASE2017, ; Uddin-OpinerAPIUsageScenario-TOSEM2020, ; Uddin-OpinerAPIUsageScenario-IST2020, ; Uddin-APIAspectMining-TechReport2017, ; Uddin-ResolvingAPIMentions-TechReport2015a, ), and code reviews (Ikram-SentimentCodeReview-IST2019, ). Studies also combined sentiment analysis with other techniques to improve domain-specific classification, such as to classify app reviews (Maalej-AutomaticClassificationAppReviews-RE2016, ; Panichella-ClassifyAppUserReview-ICSME2015, ).
In parallel, a number of research efforts analyze emotions in SE repositories. While sentiment analysis focuses on polarity (positive, negative, neutral), emotion analysis focuses finer grained expressions such as anger, love, etc. Emotion analysis is used to determine team cohesions, such as the impact of bullies in an SE team (Ortu-AreBulliesMoreProductive-MSR205, ), the relation of VAD (Valence, Arousal, Dominance) scores (Warriner-VadLexicons-BRM2013, ) with productivity and burn-out in SE teams (Mika-MiningValenceBurnout-MSR2016, ), and the usage of expressed emotions to prioritize improvements or raise team awareness (Guzman-EmotionalAwareness-FSE2013, ; Gachechiladze-AngerDirectionCollaborativeSE-ICSENIER2017, ). Overall, analysis of sentiments and emotions is an increasingly popular field in SE (Novielli-IntroToSpIssueAffectSE-JSS2019, ; Novielli-SentimentEmotionSE-IEEESoftware2019, )
Contrary to the above work, in this paper, we focus on the development of a sentiment tool for SE.
7.2. Development of Sentiment Detection Tools in SE
SE-specific sentiment tools are needed, because off-the-shelf sentiment detection tools from other domains are not very accurate (Jongeling-SentimentAnalysisToolsSe-ICSME2015, ; Jongeling-SentimentNegative-EMSE2017, ). Subsequently, a number of sentiment and emotion detectors and benchmarks were developed for SE (Islam-DevaEmotionSE-ACMSAC2018, ; Islam-SentistrengthSE-MSR2017, ; Lin-PatternBasedOpinionMining-ICSE2019, ; Uddin-OpinionValue-TSE2019, ; Calefato-Senti4SD-EMSE2017, ; Ahmed-SentiCRNIER-ASE2017, ; Murgia-DoDevelopersFeelEmotion-MSR2014, ; Ortu-EmotionalSideJira-MSR2016, ; Chen-SentiEmoji-FSE2019, ; Islam-Deva-ACMSAC2018, ; Calefato-EmoTxt-ACII2017, ; Maipradit-SentimentClassificationNGram-IEEESW2019, ). Largely, sentiment detection efforts for SE can be divided into three categories: rule-based, shallow learning-based, and deep learning-based.
We started to build our Hybrid tool, Sentisead, by combining the polarity labels of five SE-specific rule-based and shallow learning sentiment detection tools (Opiner (Uddin-OpinionValue-TSE2019, ), POME (Lin-PatternBasedOpinionMining-ICSE2019, ), SentiCR (Ahmed-SentiCRNIER-ASE2017, ), Senti4SD (Calefato-Senti4SD-EMSE2017, ), and SentistrengthSE (Islam-SentistrengthSE-MSR2017, )). SentistrengthSE (Islam-SentistrengthSE-MSR2017, ) was studied by Lin et al. (Lin-SentimentDetectionNegativeResults-ICSE2018, ) along with other tools. Recently, Novielli et al. (Novielli-BenchmarkStudySentiSE-MSR2018, ) showed that the two supervised detectors (Senti4SD (Calefato-Senti4SD-EMSE2017, ) and SentiCR (Ahmed-SentiCRNIER-ASE2017, )) performed better once re-trained for a domain. Thus, we retrained those for each of our six benchmarks. In a subsequent study, Novielli et al. (Novielli-SEToolCrossPlatform-MSR2020, ) found that unsupervised sentiment tools for SE, such as SentistrengthSE work better than supervised tools when applied in a cross-platform setting. Maipradit et al. (Maipradit-SentimentClassificationNGram-IEEESW2019, ) reported superior performance using n-grams in shallow learning models, like SVM, in multiple datasets. However, it is not clear which value of in the n-grams provided the best result.
Recently, several deep learning models to detect sentiment in SE artifacts were described in the literature (Chen-SentiEmoji-FSE2019, ; Biswas-SentiSEWordEmbedding-MSR2019, ; Biswas-ReliableSentiSEBERT-ICSME2020, ; Zhang-SEBERTSentiment-ICSME2020, ). In 2019, Chen et al. (Chen-SentiEmoji-FSE2019, ) proposed SentiEmoji, an emoji-powered sentiment detection tools for SE data. SentiEmoji uses posts containing emotional emojis from Tweets and GitHub posts as new data to automatically produce new sentiment benchmark dataset. SentiEmoji combines the dataset with existing SE sentiment benchmark dataset and proposes a representation learning approach to train/test sentiments in the dataset. The approach offered superior performance than shallow learning tools like Senti4SD.
In 2020, several papers reported language-based pre-trained transformer models (PTMs) (Biswas-ReliableSentiSEBERT-ICSME2020, ; Zhang-SEBERTSentiment-ICSME2020, ). Biswas et al. (Biswas-ReliableSentiSEBERT-ICSME2020, ) showed that the use of PTMs, like BERT, can offer superior performance to other deep learning models, like RNN, which they studied before (Biswas-ReliableSentiSEBERT-ICSME2020, ). At the same time, Zhang et al. (Zhang-SEBERTSentiment-ICSME2020, ) investigated four PTMs: BERT, ALBERT, RoBERTa, XLNet. They found that the PTMs outperformed state-of-the-art shallow learning and rule based SE-specific sentiment detectors across multiple datasets. The findings of Zhang et al. (Zhang-SEBERTSentiment-ICSME2020, ) and Biswas et al. (Biswas-ReliableSentiSEBERT-ICSME2020, ) motivated our inclusion of the PTMs into our hybrid tool.
Unlike our paper, none of the above studies investigate the feasibility of combining the tools. Our study, for the first time in SE, shows that a hybrid of the stand-alone SE-specific sentiment detection tools can be developed and that such a tool can indeed outperform each of those stand-alone SE-specific sentiment tool.
8. Conclusions
Sentiment detection is important to understand and support diverse scenarios in software engineering and software-engineering research, yet studies from Lin et al. (Lin-SentimentDetectionNegativeResults-ICSE2018, ) and Jongeling et al. (Jongeling-SentimentNegative-EMSE2017, ) showed that currently available sentiment detection tools for software engineering may not accurately detect polarity in software textual contents.
To determine whether and how the existing SE-specific sentiment tools could be combined to increase their performance, we reported the results of an empirical study that explores the feasibility of creating a hybrid sentiment detection tool. We started with five stand-alone rule-based and shallow learning sentiment detectors for SE. We reported that the stand-alone tools can complement each other to offer better performance, but a majority voting-based unsupervised classifier fails to increase performance. We found that a simple supervised combination of polarity labels from individual tools and bag of words as features could increase the performance (F1-scores) of stand-alone tools by 4% to more than 100%. We named the developed supervised hybrid tool Sentisead. Therefore, Sentisead can offer better performance than stand-alone detection tool, but it was not more than 4% against the best performing stand-alone tool (Senti4SD).
Our study was motivated by the negative results reported by Lin et al. (Lin-SentimentDetectionNegativeResults-ICSE2018, ) in 2018 and then the positive results reported by Lin et al. (Lin-PatternBasedOpinionMining-ICSE2019, ) in 2019 based on a newly developed tool. We wanted to understand whether we could further improve the performance of the stand-alone sentiment detectors (which were publicly available at the time of our analysis). Instead of creating a new stand-alone sentiment detection tool for software engineering, we wanted to determine whether we could leverage the strengths of each individual SE-specific individual tool. Therefore, we studied the feasibility of developing an ensemble of those stand-alone tools. With a comparison of the performance of SentistrengthSE reported in Lin et al. (Lin-SentimentDetectionNegativeResults-ICSE2018, ) and Sentisead, we found that Sentisead offers better performance in the three datasets summarized in Table 21. Note that the performance of SentistrengthSE on Jira Lin et al. (Lin-SentimentDetectionNegativeResults-ICSE2018, ) dataset was reported as 0.91 by Lin et al. (Lin-SentimentDetectionNegativeResults-ICSE2018, ), but we observed it to be 0.97 as shown in in Table 20 (Section 5.6).
| Positive Polarity | Negative Polarity | |||
|---|---|---|---|---|
| Dataset | Lin (Lin-SentimentDetectionNegativeResults-ICSE2018, ) | Sentisead | Lin (Lin-SentimentDetectionNegativeResults-ICSE2018, ) | Sentisead |
| SO | 0.26 | 0.35 | 0.27 | 0.31 |
| App | 0.78 | 0.89 | 0.45 | 0.83 |
| Jira | 0.91 | 0.95 | 0.82 | 0.98 |
The recent promising results in SE-specific sentiment detection with language-based pre-trained transformer models (PTMs, e.g., BERT), as reported in several works, e.g., Zhang et al.(Zhang-SEBERTSentiment-ICSME2020, ), has motivated the second phase of our study, where we compared Sentisead with four stand-alone PTMs (BERT, RoBERTa, ALBERT, and XLNet). We found that a stand-alone RoBERTa outperforms Sentisead by 1.8% (in terms of Macro F1-score). When we replaced the ensembler in Sentisead from a Random Forest to RoBERTa, we observed a performance increase of 2.3% over the Random Forest-based Sentisead (i.e., SentiseadRF). However, when we checked the performance per dataset, the findings were inconclusive against the stand-alone PTMs, i.e., Sentisead-based various ensemble marginally outperformed the stand-alone PTMs in several cases but were outperformed by those PTMs in other cases. In particular, we found in Section 4 that PTMs like RoBERTa performed considerably well as stand-alone sentiment detectors. Therefore, when such marginal improvment via Sentisead is not warranted, a stand-alone PTM might suffice for sentiment detection in SE datasets.
As noted in Section 3.3, out of the five misclassification categories, we observed that three categories were also previously observed and reported by Novielli et al. (Novielli-BenchmarkStudySentiSE-MSR2018, ). While Novielli et al. (Novielli-BenchmarkStudySentiSE-MSR2018, ) observed the error categories in units where all tools were wrong, we observed the error categories for units where at least one of the tools is correct. The purpose of our study to derive the misclassification categories was twofold: first, we needed to know the specific reasons for misclassification in one tool where another tool could offer the correct result. Second, we wanted to use knowledge gained from the error categories to develop our hybrid tool, Sentisead.
Around 50% of all misclassifications were due to the inability of the wrong tool to understand the underlying contexts, while the correct tool understood the context. Based on this insight, we hypothesized that if we could combine the polarity labels of all tools (where the correct tool is also included) with the bag of words of the unit that would serve as contexts, we could offer better results in our hybrid tool, Sentisead. Indeed, Sentisead corrects the contexts-based error for 80% of the cases (i.e., it was wrong in only 20% of the 62 units where at least one stand-alone tool is wrong), which is more than any of the stand-alone tools. Table 9 offers a qualitative breakdown of how Sentisead offered improvement over each stand-alone tool based on the five error categories.
Sentisead infrastructure could be leveraged to add the polarity labels of any newly introduced SE-specific stand-alone sentiment detection tool. We envision that this flexibility of Sentisead will allow the co-creation of two new-breeds of efforts in software engineering research: (1) More efforts to create new SE-specific stand-alone sentiment detection tool focusing on diverse SE datasets, and (2) Studying (a) the incorporation of diverse complementary SE-specific stand-alone sentiment detection tools. (b) The effectiveness of diverse features, such as fine-grained emotions from various tools into Sentistead (or its extension).
As we noted in Section 1, recent advances in deep learning-based SE-specific sentiment detection shows more promising results than those observed by Lin et al. (Lin-SentimentDetectionNegativeResults-ICSE2018, ). While within the limited space of this paper, we attempted to offer a comprehensive analysis by investigating the feasibility of developing a hybrid tool based on rule-based, shallow and deep learning stand-alone classifiers, we leave following extensions to Sentisead for future work:
We conclude that our empirical study with Sentisead offers valuable insights to the field of SE-specific sentiment detection research with empirical insights, actionable results, and a hybrid tool Sentisead that shows marginal to promising performance over stand-alone SE-specific sentiment detection tools.
Acknowledgment
We would like to thank the anonymous reviewers, who helped improve our work with comments and suggestions. We would like to thank Nibir Mandal, Mohamed Raed El Aoun, and Houssem Ben Braiek, who helped run the experiments with the advanced language-based pre-trained models in Section 4.
References
- [1] T. Ahmed, A. Bosu, A. Iqbal, and S. Rahimi. Senticr: A customized sentiment analysis tool for code review interactions. In Proceedings of the 32nd International Conference on Automated Software Engineering, pages 106–111, 2017.
- [2] I. E. Asri, N. Kerzazi, G. Uddin, F. Khomh, and M. J. Idrissi. An empirical study of sentiments in code reviews. Information and Software Technology, 114:37–54, 2019.
- [3] E. Biswas, M. E. Karabulut, L. Pollock, and K. Vijay-Shanker. Achieving reliable sentiment analysis in the software engineering domain using bert. In IEEE International Conference on Software Maintenance and Evolution, pages 162–173, 2020.
- [4] E. Biswas, K. Vijay-Shanker, and L. Pollock. Exploring word embedding techniques to improve sentiment analysis of software engineering texts. In Proceedings of the 16th International Conference on Mining Software Repositories, pages 68–78, 2019.
- [5] F. Calefato, F. Lanubile, F. Maiorano, and N. Novielli. Sentiment polarity detection for software development. Journal Empirical Software Engineering, pages 2543–2584, 2017.
- [6] F. Calefato, F. Lanubile, and N. Novielli. Emotxt: A toolkit for emotion recognition from text. In Proc. 7th Affective Computing and Intelligent Interaction, page 2, 2017.
- [7] C. Castaldi, A. Blaz, and K. Becker. Sentiment analysis in tickets for IT support. In IEEE/ACM 13th Working Conference on Mining Software Repositories, pages 235–246, 2016.
- [8] N. V. Chawla, K. W. Bowyer, L. O. Hall, and W. P. Kegelmeyer. Smote: synthetic minority over-sampling technique. Journal of Artificial Intelligence Research, 16(1):321–357, 2002.
- [9] Z. Chen, Y. Cao, X. Lu, Q. Mei, and X. Liu. Sentimoji: an emoji-powered learning approach for sentiment analysis in software engineering. In 27th ACM Joint Meeting on European Software Engineering Conference and Symposium on the Foundations of Software Engineering, pages 841–852, 2019.
- [10] J. Cohen, S. G. West, L. Aiken, and P. Cohen. Applied Multiple Regression/Correlation Analysis for the Behavioral Sciences. Lawrence Erlbaum Associates, 3rd edition, 2002.
- [11] J. Devlin, M.-W. Chang, K. Lee, and K. Toutanova. BERT: Pre-training of deep bidirectional transformers for language understanding. Technical report, https://arxiv.org/abs/1810.04805, 2018.
- [12] P. P. B. Filho, L. Avanco, T. A. S. Pardo, and M. G. V. Nunes. Nilc_usp: An improved hybrid system for sentiment analysis in twitter messages. In Proceedings of the 8th International Workshop on Semantic Evaluation, pages 428–432, 2014.
- [13] D. Gachechiladze, F. Lanubile, N. Novielli, and A. Serebrenik. Anger and its direction in collaborative software development. In 39th International Conference on Software Engineering: New Ideas and Emerging Results Track, pages 11–14, 2017.
- [14] B. Ghotra, S. McIntosh, and A. E. Hassan. Revisiting the impact of classification techniques on the performance of defect prediction models. In Proceedings of the 37th International Conference on Software Engineering, pages 789–800, 2015.
- [15] P. Goncalves, M. Araujo, F. Benevenuto, and M. Cha. Comparing and combining sentiment analysis methods. In Proceedings of the first ACM conference on Online social networks, pages 27–38, 2013.
- [16] E. Guzman, R. Alkadhi, , and N. Seyf. A needle in a haystack: What do twitter users say about software? In 24th IEEE International Requirements Engineering Conference, pages 96–105, 2016.
- [17] E. Guzman, D. Azócar, and Y. Li. Sentiment analysis of commit comments in github: an empirical study. In Proceedings of the 11th Working Conference on Mining Software Repositories, pages 352–355, 2014.
- [18] E. Guzman and B. Bruegge. Towards emotional awareness in software development teams. In Proceedings of the 2013 9th Joint Meeting on Foundations of Software Engineering, pages 671–674, 2013.
- [19] E. Guzman and B. Bruegge. Towards emotional awareness in software development teams. In Proceedings of the 7th Joint Meeting on Foundations of Software Engineering, pages 671–674, 2013.
- [20] A. E. Hassan. Predicting faults using the complexity of code changes. In Proc. 31st International Conference on Software Engineering, pages 78–89, 2009.
- [21] M. Hu and B. Liu. Mining and summarizing customer reviews. In ACM SIGKDD International Conference on Knowledge Discovery and Data Mining, pages 168–177, 2004.
- [22] M. R. Islam and M. F. Zibran. Leveraging automated sentiment analysis in software engineering. In Proc. 14th International Conference on Mining Software Repositories, pages 203–214, 2017.
- [23] M. R. Islam and M. F. Zibran. Deva: Sensing emotions in the valence arousal space in software engineering text. In 33rd Annual ACM Symposium on Applied Computing, page 1536–1543, 2018.
- [24] M. R. Islam and M. F. Zibran. Deva: Sensing emotions in the valence arousal space in software engineering text. In 33rd Annual ACM Symposium on Applied Computing, page 1536–1543, 2018.
- [25] R. Jongeling, S. Datta, and A. Serebrenik. Choosing your weapons: On sentiment analysis tools for software engineering research. In Proceedings of the 31st International Confernece on Software Maintenance and Evolution, 2015.
- [26] R. Jongeling, P. Sarkar, S. Datta, and A. Serebrenik. On negative results when using sentiment analysis tools for software engineering research. Journal Empirical Software Engineering, 22(5):2543–2584, 2017.
- [27] F. Khomh, B. Chan, Y. Zou, and A. E. Hassan. An entropy evaluation approach for triaging field crashes: A case study of mozilla firefox. In Proceedings of the 2011 18th Working Conference on Reverse Engineering, pages 261–270, 2011.
- [28] A. J. Ko, B. A. Myers, and D. H. Chau. A linguistic analysis of how people describe software problems. In 2005 IEEE Symposium on Visual Languages and Human-Centric Computing, pages 127–134, 2005.
- [29] D. Lab. An Empirical Study of the Effectiveness of an Ensemble of Stand-alone Sentiment Detection Tools for Software Engineering Datasets (Online Appendix). https://github.com/disa-lab/HybridSESentimentTOSEM, 21 April 2021 (last accessed).
- [30] Z. Lan, M. Chen, S. Goodman, K. Gimpel, P. Sharma, and R. Soricut. ALBERT: A lite bert for self-supervised learning of language representations. Technical report, https://arxiv.org/abs/1909.11942, 2020.
- [31] B. Lin, F. Zampetti, G. Bavota, M. D. Penta, and M. Lanza. Pattern-based mining of opinions in Q&A websites. In Proc. 41st International Conference on Software Engineering, pages 548–559, 2019.
- [32] B. Lin, F. Zampetti, G. Bavota, M. D. Penta, M. Lanza, and R. Oliveto. Sentiment analysis for software engineering: how far can we go? In Proc. 40th International Conference on Software Engineering, pages 94–104, 2018.
- [33] B. Liu. Sentiment Analysis and Opinion Mining. Morgan & Claypool Publishers, 1st edition, May 2012.
- [34] Y. Liu, M. Ott, N. Goyal, J. Du, M. Joshi, D. Chen, O. Levy, M. Lewis, L. Zettlemoyer, and V. Stoyanov. RoBERTa: A robustly optimized bert pretraining approach. Technical report, https://arxiv.org/abs/1907.11692, 2019.
- [35] W. Maalej, Z. Kurtanović, H. Nabil, and C. Stanik. On the automatic classification of app reviews. In International Requirements Engineering Conference, page 311–331, 2016.
- [36] R. Maipradit, H. Hata, and K. Matsumoto. Sentiment classification using n-gram inverse document frequency and automated machine learning. IEEE Software, 36(5):65–70, 2019.
- [37] C. D. Manning, P. Raghavan, and H. Schütze. An Introduction to Information Retrieval. Cambridge Uni Press, 2009.
- [38] M. Mȧntylȧ, B. Adams, G. Destefanis, D. Graziotin, and M. Ortu. Mining valence, arousal, and dominance – possibilities for detecting burnout and productivity? In Proceedings of the 13th Working Conference on Mining Software Repositories, pages 247–258, 2016.
- [39] A. T. Misirli, A. B. Bener, and B. Turhan. An industrial case study of classifier ensembles for locating software defects. Software Quality Journal, 19(3):515–536, 2011.
- [40] A. Murgia, P. Tourani, B. Adams, and M. Ortu. Do developers feel emotions? an exploratory analysis of emotions in software artifacts. In Proceedings of the 11th Working Conference on Mining Software Repositories, 2014.
- [41] N. Novielli, A. Begel, and W. Maalej. Introduction to the special issue on affect awareness in software engineering. Journal of Systems and Software, 148:180–182, 2019.
- [42] N. Novielli, F. Calefato, D. Dongiovanni, D. Girardi, and F. Lanubile. Can we use se-specific sentiment analysis tools in a cross-platform setting? In 17th International Conference on Mining Software Repositories, page 11, 2020.
- [43] N. Novielli, F. Calefato, and F. Lanubile. The challenges of sentiment detection in the social programmer ecosystem. In Proceedings of the 7th International Workshop on Social Software Engineering, pages 33–40, 2015.
- [44] N. Novielli, F. Calefato, and F. Lanubile. A gold standard for emotion annotation in stack overflow. In Proceedings of the 15th International Conference on Mining Software Repositories (Data Showcase), page 4, 2018.
- [45] N. Novielli, D. Girardi, and F. Lanubile. A benchmark study on sentiment analysis for software engineering research. In Proceedings of the 15th International Conference on Mining Software Repositories, page 12, 2018.
- [46] N. Novielli and A. Serebrenik. Sentiment and emotion in software engineering. IEEE Software, 36(5):6–23, 2019.
- [47] D. D. Nucci, F. Palomba, R. Oliveto, and A. D. Lucia. Dynamic selection of classifiers in bug prediction: An adaptive method. IEEE Transactions on Emerging Topics in Computational Intelligence, 1(3):202–212, 2017.
- [48] M. Ortu, B. Adams, G. Destefanis, P. Tourani, M. Marchesi, and R. Tonelli. Are bullies more productive? empirical study of affectiveness vs. issue fixing time. In Proceedings of the 12th Working Conference on Mining Software Repositories, pages 303–313, 2015.
- [49] M. Ortu, B. Adams, G. Destefanis, P. Tourani, M. Marchesi, and R. Tonelli. Are bullies more productive? empirical study of affectiveness vs. issue fixing time. In Proceedings of the 12th Working Conference on Mining Software Repositories, 2015.
- [50] M. Ortu, A. Murgia, G. Destefanis, P. Tourani, R. Tonelli, M. L. Marchesi, and B. Adams. The emotional side of software developers in jira. In 13th International Conference on Mining Software Repositories, pages 480–483, 2016.
- [51] B. Pang, L. Lee, and S. Vaithyanathan. Thumbs up? sentiment classification using machine learning techniques. In Conference on Empirical Methods in Natural Language Processing, pages 79–86, 2002.
- [52] S. Panichella, A. D. Sorbo, E. Guzman, C. A. Visaggio, G. Canfora, and H. C. Gall. How can i improve my app? classifying user reviews for software maintenance and evolution. In IEEE International Conf. on Software Maintenance and Evolution, pages 281–290, 2015.
- [53] J. Petric, D. Bowes, T. Hall, B. Christianson, and N. Baddoo. Building an ensemble for software defect prediction based on diversity selection. In Proceedings of the 10th ACM/IEEE International Symposium on Empirical Software Engineering and Measurement, page Article No. 46, 2016.
- [54] D. Pletea, B. Vasilescu, and A. Serebrenik. Security and emotion: sentiment analysis of security discussions on github. In Proceedings of the 11th Working Conference on Mining Software Repositories, pages 348–351, 2014.
- [55] scikit learn. Machine Learning in Python. http://scikit-learn.org/stable/index.html#, 2017.
- [56] F. Sebastiani. Machine learning in automated text categorization. Journal of ACM Computing Surveys, 34(1):1–47, 2002.
- [57] C. E. Shannon. A mathematical theory of communication. The Bell System Technical Journal, 27(3):379–423, 1948.
- [58] V. Sinha, A. Lazar, and B. Sharif. Analyzing developer sentiment in commit logs. In 13th International Conference on Mining Software Repositories, pages 281–290, 2016.
- [59] R. Socher, A. Perelygin, J. Wu, C. Manning, A. Ng, and J. Chuang. Recursive models for semantic compositionality over a sentiment treebank. In Proc. Conference on Empirical Methods in Natural Language Processing (EMNLP), page 12, 2013.
- [60] M. Thelwall, K. Buckley, G. Paltoglou, D. Cai, and A. Kappas. Sentiment in short strength detection informal text. Journal of the American Society for Information Science and Technology, 61(12):2544–2558, 2010.
- [61] P. Thongtanunam, S. Mcintosh, A. E. Hassan, and H. Iida. Review participation in modern code review: An empirical study of the android, qt, and openstack projects. Journal of Empirical Software Engineering, 22(2):768–817, 2017.
- [62] G. Uddin, O. Baysal, L. Guerroj, and F. Khomh. Understanding how and why developers seek and analyze api related opinions. IEEE Transactions on Software Engineering, page 40, 2019.
- [63] G. Uddin and F. Khomh. Automatic summarization of API reviews. In Proc. 32nd IEEE/ACM International Conference on Automated Software Engineering, pages 159–170, 2017.
- [64] G. Uddin and F. Khomh. Mining api aspects in api reviews. Technical report, https://swat.polymtl.ca/data/opinionvalue-technical-report.pdf, 2017.
- [65] G. Uddin and F. Khomh. Opiner: A search and summarization engine for API reviews. In Proc. 32nd IEEE/ACM International Conference on Automated Software Engineering, pages 978–983, 2017.
- [66] G. Uddin and F. Khomh. Automatic opinion mining from API reviews from stack overflow. IEEE Transactions on Software Engineering, page 35, 2019.
- [67] G. Uddin, F. Khomh, and C. K. Roy. Automatic api usage scenario documentation from technical q&a sites. ACM Transactions on Software Engineering and Methodology, page 43, 2020.
- [68] G. Uddin, F. Khomh, and C. K. Roy. Automatic mining of api usage scenarios from stack overflow. Information and Software Technology (IST), page 16, 2020.
- [69] G. Uddin and M. P. Robillard. Resolving api mentions in forum texts. Technical report, McGill University, 2015.
- [70] M. Valiev, B. Vasilescu, and J. Herbsleb. Ecosystem-level determinants of sustained activity in open-source projects: a case study of the pypi ecosystem. In Proceedings of the 2018 26th ACM Joint Meeting on European Software Engineering Conference and Symposium on the Foundations of Software Engineering, pages 644–655, 2018.
- [71] L. Villarroel, G. Bavota, B. Russo, R. Oliveto, and M. D. Penta. Release planning of mobile apps based on user reviews. In Proceedings of the 38th International Conference on Software Engineering, pages 14–24, 2016.
- [72] S. Wang and C. D. Manning. Baselines and bigrams: simple, good sentiment and topic classification. In Proceedings of the 50th Annual Meeting of the Association for Computational Linguistics, pages 90–94, 2012.
- [73] A. B. Warriner, V. Kuperman, and M. Brysbaert. Norms of valence, arousal, and dominance for 13,915 english lemmas. Behavior Research Methods, 45(4):1191–1207, 2013.
- [74] C. Wohlin, P. Runeson, M. Höst, M. C. Ohlsson, B. Regnell, and A. Wesslén. Experimentation in software engineering: an introduction. Kluwer Academic Publishers, Norwell, MA, USA, 2000.
- [75] X. Yang, D. Lo, X. Xia, and J. Sun. TLEL: A two-layer ensemble learning approach for just-in-time defect prediction. Information and Software Technology, 87(2):206 – 220, 2017.
- [76] Z. Yang, Z. Dai, Y. Yang, J. Carbonell, R. Salakhutdinov, and Q. V. Le. XLNet: Generalized autoregressive pretraining for language understanding. Technical report, https://arxiv.org/abs/1906.08237, 2020.
- [77] T. Zhang, B. Xu, F. Thung, S. A. Haryono, D. Lo, and L. Jiang. Sentiment analysis for software engineering: How far can pre-trained transformer models go? In IEEE International Conference on Software Maintenance and Evolution, pages 70–80, 2020.
- [78] Y. Zhang, D. Lo, X. Xia, and J. Sun. Combined classifier for cross-project defect prediction: an extended empirical study. Frontiers of Computer Science, 22(2):280 – 296, 2018.
Appendix A Details of Performance Analysis of Tools
| Positive | Negative | Neutral | |||||||
| F1 | P | R | F1 | P | R | F1 | P | R | |
| Majority-All | 0.721 | 0.825 | 0.640 | 0.645 | 0.859 | 0.516 | 0.819 | 0.734 | 0.925 |
| Majority-Supervised | 0.706 | 0.818 | 0.621 | 0.645 | 0.879 | 0.510 | 0.825 | 0.735 | 0.939 |
| Majority-Unsupervised | 0.536 | 0.736 | 0.422 | 0.490 | 0.762 | 0.361 | 0.755 | 0.647 | 0.907 |
| Baseline - Senti4SD | 0.731 | 0.773 | 0.692 | 0.690 | 0.748 | 0.640 | 0.822 | 0.783 | 0.865 |
| Baseline - SentiCR | 0.728 | 0.803 | 0.667 | 0.687 | 0.804 | 0.599 | 0.830 | 0.767 | 0.903 |
| Baseline - SentistrengthSE | 0.720 | 0.752 | 0.690 | 0.640 | 0.736 | 0.566 | 0.795 | 0.750 | 0.847 |
| Baseline - Opiner | 0.494 | 0.467 | 0.524 | 0.512 | 0.577 | 0.460 | 0.676 | 0.668 | 0.684 |
| Baseline - POME | 0.127 | 0.389 | 0.076 | 0.065 | 0.415 | 0.035 | 0.697 | 0.550 | 0.950 |
| Positive | Negative | Neutral | |||||||
| F1 | P | R | F1 | P | R | F1 | P | R | |
| SentiseadRF-B | 0.764 | 0.832 | 0.706 | 0.738 | 0.827 | 0.666 | 0.843 | 0.790 | 0.905 |
| SentiseadRF-N | 0.759 | 0.797 | 0.724 | 0.72 | 0.777 | 0.671 | 0.837 | 0.801 | 0.877 |
| Performance Increase of SentiseadB (i.e., Hybrid with Bag of Words) | |||||||||
| Over Baseline (SentiSE = SentistrengthSE) | |||||||||
| Majority | 6.0% | 0.8% | 10.3% | 14.4% | -3.7% | 29.1% | 2.9% | 7.6% | -2.2% |
| Senti4SD | 4.5% | 7.6% | 2.0% | 7.0% | 10.6% | 4.1% | 2.6% | 0.9% | 4.6% |
| SentiCR | 4.9% | 3.6% | 5.8% | 7.4% | 2.9% | 11.2% | 1.6% | 3.0% | 0.2% |
| SentiSE | 6.1% | 10.6% | 2.3% | 15.3% | 12.4% | 17.7% | 6.0% | 5.3% | 6.8% |
| Opiner | 54.7% | 78.2% | 34.7% | 44.1% | 43.3% | 44.8% | 24.7% | 18.3% | 32.3% |
| POME | 501.6% | 113.9% | 828.9% | 1035.4% | 99.3% | 1802.9% | 20.9% | 43.6% | -4.7% |
| Positive | Negative | Neutral | |||||||
| F1 | P | R | F1 | P | R | F1 | P | R | |
| SentiseadRF-B+ | 0.767 | 0.832 | 0.712 | 0.74 | 0.818 | 0.675 | 0.844 | 0.794 | 0.901 |
| SentiseadRF-BNE+ | 0.761 | 0.831 | 0.702 | 0.738 | 0.832 | 0.663 | 0.843 | 0.788 | 0.906 |
| SentiseadRF-BNP+ | 0.765 | 0.829 | 0.711 | 0.737 | 0.813 | 0.674 | 0.843 | 0.793 | 0.899 |
| SentiSeadRF-N+ | 0.747 | 0.777 | 0.719 | 0.698 | 0.741 | 0.66 | 0.822 | 0.793 | 0.854 |
| SentiseadRF-NNE+ | 0.755 | 0.791 | 0.722 | 0.708 | 0.772 | 0.653 | 0.834 | 0.796 | 0.876 |
| SentiseadRF-NNP+ | 0.746 | 0.773 | 0.721 | 0.698 | 0.741 | 0.66 | 0.821 | 0.793 | 0.852 |
| Sentisead: With bag of words. Sentisead: No bag of words. | |||||||||
| NP = No partial polarity. NE = No polarity entropy | |||||||||
| Positive | Negative | Neutral | |||||||
|---|---|---|---|---|---|---|---|---|---|
| F1 | P | R | F1 | P | R | F1 | P | R | |
| BERT | 0.772 | 0.768 | 0.775 | 0.759 | 0.767 | 0.752 | 0.847 | 0.845 | 0.848 |
| Change Over SentiseadRF | 1.0% | -7.7% | 9.8% | 2.8% | -7.3% | 12.9% | 0.5% | 7.0% | -6.3% |
| RoBERTa | 0.788 | 0.773 | 0.804 | 0.768 | 0.768 | 0.768 | 0.847 | 0.855 | 0.839 |
| Change Over SentiseadRF | 3.1% | -7.1% | 13.9% | 4.1% | -7.1% | 15.3% | 0.5% | 8.2% | -7.3% |
| ALBERT | 0.767 | 0.792 | 0.743 | 0.747 | 0.764 | 0.731 | 0.846 | 0.828 | 0.865 |
| Change Over SentiseadRF | 0.4% | -4.8% | 5.2% | 1.2% | -7.6% | 9.8% | 0.4% | 4.8% | -4.4% |
| XLNet | 0.779 | 0.749 | 0.812 | 0.767 | 0.786 | 0.749 | 0.848 | 0.857 | 0.84 |
| Change Over SentiseadRF | 2.0% | -10.0% | 15.0% | 3.9% | -5.0% | 12.5% | 0.6% | 8.5% | -7.2% |
| Positive | Negative | Neutral | |||||||
|---|---|---|---|---|---|---|---|---|---|
| F1 | P | R | F1 | P | R | F1 | P | R | |
| SentiseadBERT | 0.77 | 0.771 | 0.768 | 0.76 | 0.761 | 0.759 | 0.843 | 0.842 | 0.844 |
| Change Over SentiseadRF | 0.8% | -7.3% | 8.8% | 3.0% | -8.0% | 14.0% | 0.0% | 6.6% | -6.7% |
| Change Over BERT | -0.3% | 0.4% | -0.9% | 0.1% | -0.8% | 0.9% | -0.5% | -0.4% | -0.5% |
| SentiseadRoBERTa | 0.787 | 0.78 | 0.794 | 0.774 | 0.792 | 0.757 | 0.853 | 0.849 | 0.857 |
| Change Over SentiseadRF | 3.0% | -6.2% | 12.5% | 4.9% | -4.2% | 13.7% | 1.2% | 7.5% | -5.3% |
| Change Over RoBERTa | -0.1% | 0.9% | -1.2% | 0.8% | 3.1% | -1.4% | 0.7% | -0.7% | 2.1% |
| SentiseadALBERT | 0.764 | 0.769 | 0.76 | 0.735 | 0.731 | 0.738 | 0.839 | 0.838 | 0.84 |
| Change Over SentiseadRF | 0.0% | -7.6% | 7.6% | -0.4% | -11.6% | 10.8% | -0.5% | 6.1% | -7.2% |
| Change Over ALBERT | -0.4% | -2.9% | 2.3% | -1.6% | -4.3% | 1.0% | -0.8% | 1.2% | -2.9% |
| SentiseadXLNet | 0.785 | 0.774 | 0.796 | 0.767 | 0.772 | 0.763 | 0.848 | 0.852 | 0.844 |
| Change Over SentiseadRF | 2.7% | -7.0% | 12.7% | 3.9% | -6.7% | 14.6% | 0.6% | 7.8% | -6.7% |
| Change Over XLNet | 0.8% | 3.3% | -2.0% | 0.0% | -1.8% | 1.9% | 0.0% | -0.6% | 0.5% |
| Positive | Negative | Neutral | |||||||
|---|---|---|---|---|---|---|---|---|---|
| F1 | P | R | F1 | P | R | F1 | P | R | |
| SentiseadBERT+ | 0.769 | 0.766 | 0.771 | 0.757 | 0.76 | 0.755 | 0.844 | 0.844 | 0.844 |
| Change Over SentiseadRF | 0.7% | -7.9% | 9.2% | 2.6% | -8.1% | 13.4% | 0.1% | 6.8% | -6.7% |
| Change Over SentiseadBERT | -0.1% | -0.6% | 0.4% | -0.4% | -0.1% | -0.5% | 0.1% | 0.2% | 0.0% |
| Change Over BERT | -0.4% | -0.3% | -0.5% | -0.3% | -0.9% | 0.4% | -0.4% | -0.1% | -0.5% |
| SentiseadRoBERTa+ | 0.783 | 0.758 | 0.809 | 0.768 | 0.776 | 0.761 | 0.847 | 0.857 | 0.837 |
| Change Over SentiseadRF | 2.5% | -8.9% | 14.6% | 4.1% | -6.2% | 14.3% | 0.5% | 8.5% | -7.5% |
| Change Over SentiseadRoBERTa | -0.5% | -2.8% | 1.9% | -0.8% | -2.0% | 0.5% | -0.7% | 0.9% | -2.3% |
| Change Over RoBERTa | -0.6% | -1.9% | 0.6% | 0.0% | 1.0% | -0.9% | 0.0% | 0.2% | -0.2% |
| SentiseadALBERT+ | 0.766 | 0.763 | 0.768 | 0.744 | 0.752 | 0.736 | 0.84 | 0.838 | 0.843 |
| Change Over SentiseadRF | 0.3% | -8.3% | 8.8% | 0.8% | -9.1% | 10.5% | -0.4% | 6.1% | -6.9% |
| Change Over SentiseadALBERT | 0.3% | -0.8% | 1.1% | 1.2% | 2.9% | -0.3% | 0.1% | 0.0% | 0.4% |
| Change Over Albert | -0.1% | -3.7% | 3.4% | -0.4% | -1.6% | 0.7% | -0.7% | 1.2% | -2.5% |
| SentiseadXLNet+ | 0.777 | 0.752 | 0.803 | 0.768 | 0.781 | 0.756 | 0.845 | 0.852 | 0.837 |
| Change Over SentiseadRF | 1.7% | -9.6% | 13.7% | 4.1% | -5.6% | 13.5% | 0.2% | 7.8% | -7.5% |
| Change Over SentiseadXLNet | -1.0% | -2.8% | 0.9% | 0.1% | 1.2% | -0.9% | -0.4% | 0.0% | -0.8% |
| Change Over XLNet | -0.3% | 0.4% | -1.1% | 0.1% | -0.6% | 0.9% | -0.4% | -0.6% | -0.4% |