From hidden-order to antiferromagnetism:
electronic structure changes in Fe-doped URu2Si2
Abstract
In matter, any spontaneous symmetry breaking induces a phase transition characterized by an order parameter, such as the magnetization vector in ferromagnets, or a macroscopic many-electron wave-function in superconductors. Phase transitions with unknown order parameter are rare but extremely appealing, as they may lead to novel physics. An emblematic, and still unsolved, example is the transition of the heavy fermion compound URu2Si2 (URS) into the so-called hidden-order (HO) phase when the temperature drops below K. Here we show that the interaction between the heavy fermion and the conduction band states near the Fermi level has a key role in the emergence of the HO phase. Using angle resolved photoemission spectroscopy, we find that while the Fermi surfaces of the HO and of a neighboring antiferromagnetic (AFM) phase of well-defined order parameter have the same topography; they differ in the size of some, but not all, of their electron pockets. Such a non-rigid change of the electronic structure indicates that a change in the interaction strength between states near the Fermi level is a crucial ingredient for the HO-to-AFM phase transition.
The transition of URu2Si2 from a high-temperature paramagnetic (PM) phase to the HO phase below is accompanied by anomalies in specific heat [1, 2, 3], electrical resistivity [1, 3], thermal expansion [4] and magnetic susceptibility [2, 3] that are all typical of magnetic ordering. However, the small associated antiferromagnetic (AFM) moment [5] is insufficient to explain the large entropy loss, and was shown to be of extrinsic origin [6]. Inelastic neutron scattering (INS) experiments revealed gapped magnetic excitations below at commensurate and incommensurate wave-vectors [7, 8, 9], while an instability and partial gapping of the Fermi surface was observed by angle-resolved photoemission spectroscopy (ARPES) [10, 11, 12, 13, 14, 15, 16] and scanning tunneling microscopy/spectroscopy (STM/STS) [17, 18]. More recently, high-resolution low-temperature ARPES experiments imaged the Fermi surface (FS) reconstruction across the hidden-order transition, unveiling the nesting vectors between Fermi sheets associated with the gapped magnetic excitations seen in INS experiments [14, 19], and quantitatively explaining, from the changes in Fermi surface size and quasiparticle mass, the large entropy loss in the hidden-order phase [19]. Nonetheless, the nature of the HO parameter is still hotly debated [20, 21, 22, 23].
The HO phase is furthermore unstable above a temperature-dependent critical pressure, of about GPa at , at which it undergoes a first-order transition into a large moment AFM phase where the value of the magnetic moment per U atom exhibits a sharp increase, by a factor of 10-50 [24, 25, 6, 26, 27, 28, 29, 30]. When the system crosses the HOAFM phase boundary, the characteristic magnetic excitations of the HO phase are either suppressed or modified [8, 31], while resistivity and specific heat measurements suggest that the partial gapping of the Fermi surface is enhanced [24, 27].
As the AFM phase has a well defined order parameter, studying the evolution of the electronic structure across the HO/AFM transition would help develop an understanding of the HO state. So far the experimental determination of the Fermi surface by means of Shubnikov de Haas (SdH) oscillations only showed minor changes across the HOAFM phase boundary [32]. Here, we take advantage of the HO/AFM transition induced by chemical pressure in URu2Si2, through the partial substitution of Ru with Fe [33, 34, 35, 36, 37], to directly probe its electronic structure in the AFM phase using ARPES. As we shall see, our results reveal that changes in the Ru -U hybridisation across the HO-AFM phase boundary seem essential for a better understanding of the HO state.
ARPES measurements were performed at the UE112-PGM-2b-13 endstation of BESSY II using a hemispherical electron analyser. The instrumental resolution varied from 3 to 7 meV according to experimental conditions. Samples were cleaved in situ at a temperature below 20K, and measured at temperatures between 1 K and 25 K. The pressure was at all times lower than mbar. Single crystals of (Fe-doped) URu2Si2 were grown in a tetra-arc furnace using the Czochralski method in an argon atmosphere. The quality of the synthesised crystals was confirmed by X-ray diffraction measurements. Sample pieces were oriented by means of Laue diffraction. The Supplementary Information (SI..1, SI..2 and SI..3) provides complete technical details about the crystal growth, characterization, and ARPES measurements.
Results & Discussion
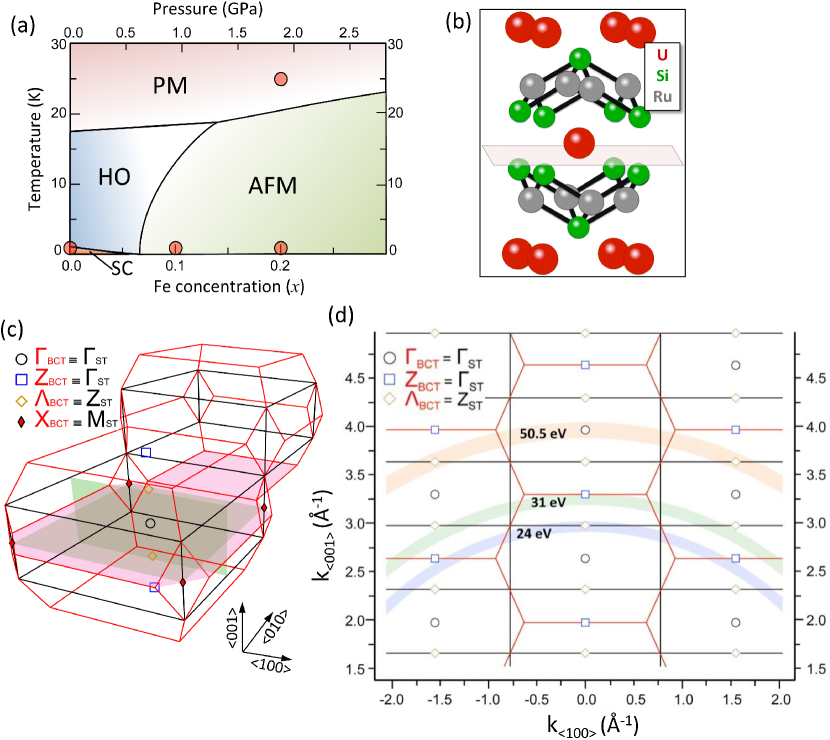
Fig. 1(a) shows the phase diagram of URu2-xFexSi2 as a function of Fe concentration () and of the associated chemical pressure. The quantum-critical transition at from the HO to the AFM phase occurs at . Our samples (orange markers) are characteristic of the HO, AFM and PM phases. This study will focus on changes across the HO/AFM phase boundary. As schematized in Fig. 1(b), henceforth we will characterize the electronic structure of Fe-doped URu2Si2(001) surfaces with a Si termination layer, which corresponds to a buried bulk-like U layer, as the bulk-derived heavy bands of U origin are a key feature of the low energy electronic structure of URu2Si2 [11, 12, 13, 15, 16, 19]. A detailed comparison with the alternative U-terminated surfaces, and the stability of cleaved surfaces in UHV, is presented in the Supplementary Information (SI..4 and SI..5).
Fig. 1(c) presents the 3D body-centered tetragonal (BCT, PM phase, red lines) and simple-tetragonal (ST, HO and AFM phases, black lines) Brillouin zone (BZ) of URS, and highlights the typically measured planes. Fig. 1(d) illustrates how reciprocal space is probed using photon energies of eV, eV and eV. At normal emission () these energies correspond to bulk , Z and high-symmetry points of the BCT Brillouin zone. Off-normal emission, in the neighboring Brillouin zones, the same photon energies probe the states near the ( eV and eV) and Z ( eV) high-symmetry points.
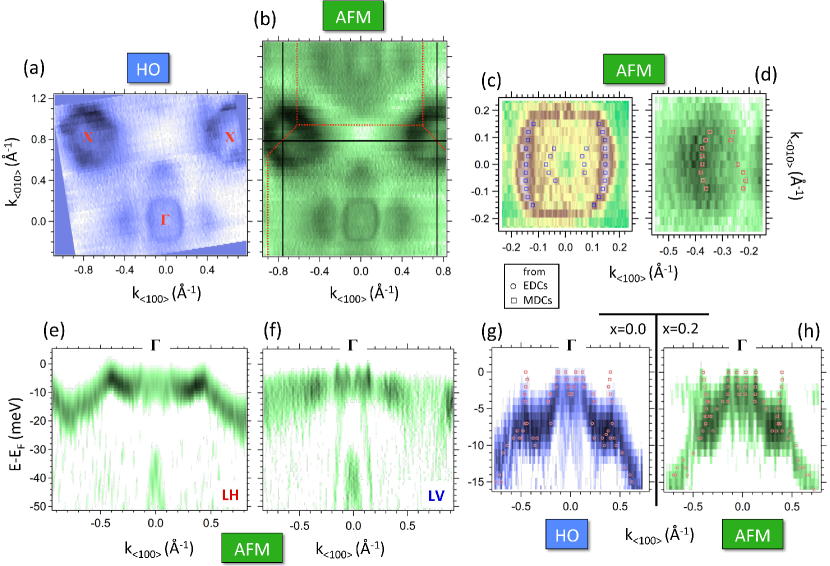
Figs. 2(a, b) show the experimental in-plane Fermi surface of pure and Fe-doped URu2Si2 (Fe-URS) in the low-temperature HO and AFM states, respectively. Their striking similarity demonstrates that the HO and AFM phases share common nesting vectors, as inferred from INS experiments [7, 8, 9] and theoretical calculations [21, 40], and directly confirms conclusions from previous measurements of extremal Fermi surface contours by means of SdH oscillations, which showed only minor differences between the HO and the AFM phases [32].
Specifically, as seen from Figs. 2(a, b), there are two Fermi sheets centered around : an intense square-like outer contour with Å-1 along , and a circumscribed weaker circular-like inner contour –see Fig. 2(c). These contours correspond, respectively, to hole-like and electron-like pockets. The pockets are formed by an M-shaped band resulting from the interaction between heavy and light states, as discussed in previous works on pure URu2Si2 [19], and described by means of a phenomenological toy model in the Supplementary Information (SI..6, Fig. 10 and Fig. 11). At larger momenta of the order of Å-1, there are four off-centered “Fermi Petals” symmetrically distributed around [19], shown in detail in Fig. 2(d). All these Fermi sheets around agree well with previous LSDA calculations in the AFM phase of URS [21, 41]. Additionally, large electron pockets centered at the corners of the ST Brillouin zone (the X points) are observed in both the HO and AFM states –Figs. 2(a, b). These pockets arise from the interaction (hybridization) of heavy bands of U character with a dispersing hole-like band [19].
Figs. 2(e, f) present band dispersions of Fe-URS along using photons with linear horizontal (LH) and linear vertical (LV) polarisation, respectively. The dispersion of the heavy bands can be best detected using LH photons, while a light hole-like band and the M-shaped feature are best probed with LV photons. The necessity for light with variable polarisation reflects the different orbital character of those states, namely the heavy bands of U origin and the light bands of likely Ru origin. The phenomenological model presented in the Supplementary Information (SI..6) includes two pairs of bands with very different effective masses to mimic the light and heavy bands. Finally, the hole-like band with a maximum at meV is common to both polarisations and corresponds to a surface state [42].
Figs. 2(g, h) show a zoom of the near- electronic dispersion around , both for the pure and Fe-doped compounds. One clearly observes the M-shaped band around forming the outer square-like hole pocket and inner circular-like electron pocket. The shallow Fermi petals form above the “spikes” of the M-shaped band at Å-1. Our experimental resolution, which worsens as photon energy increases, does not allow us to draw conclusions about electronic structure changes around between the pure (HO) and Fe-doped (AFM) compounds. On the other hand, as we shall see next, the electronic structure around the and Z points, which are both probed with smaller photon energies, show clear changes between the two phases.
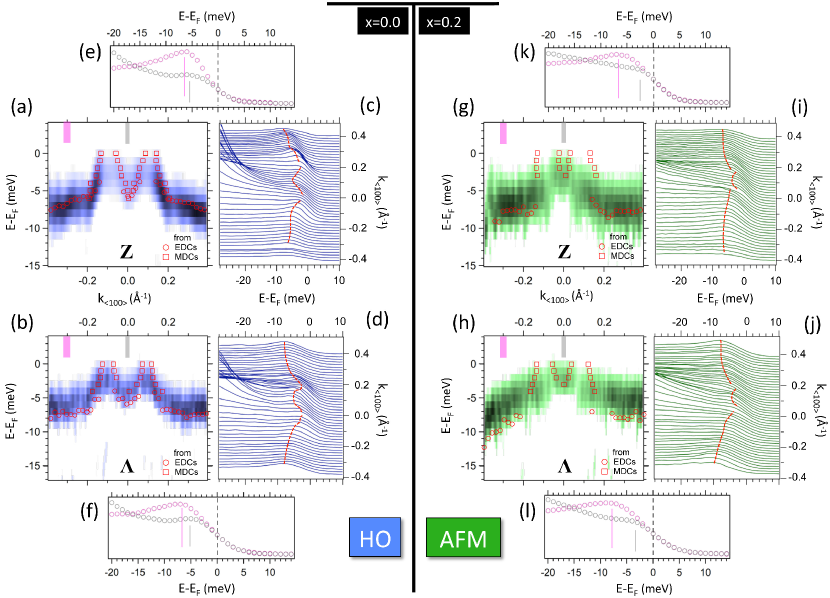
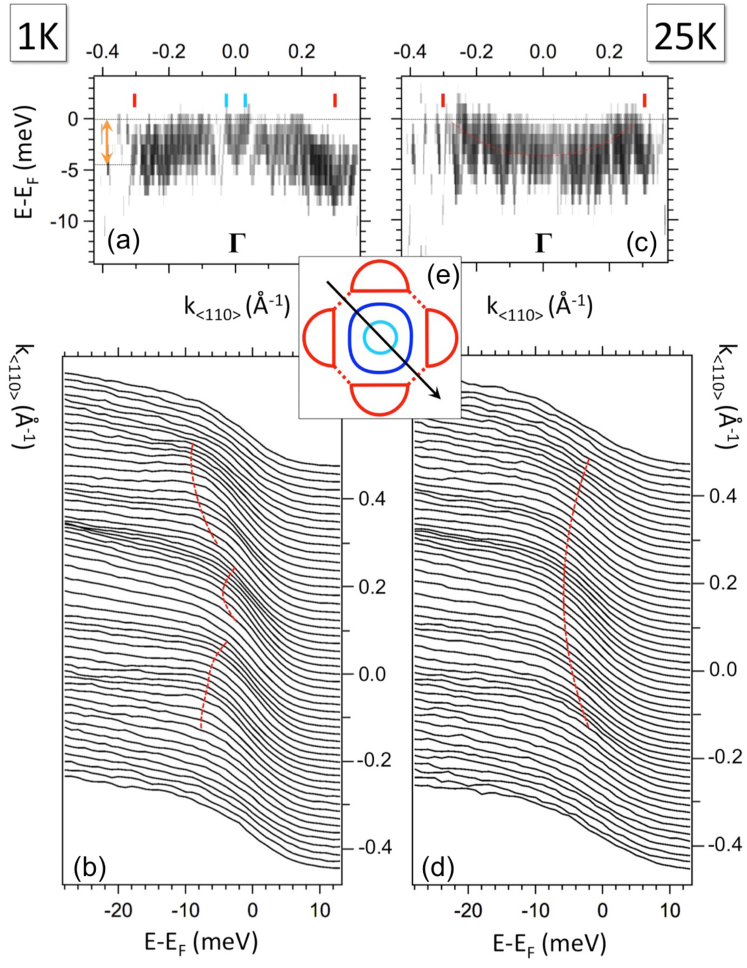
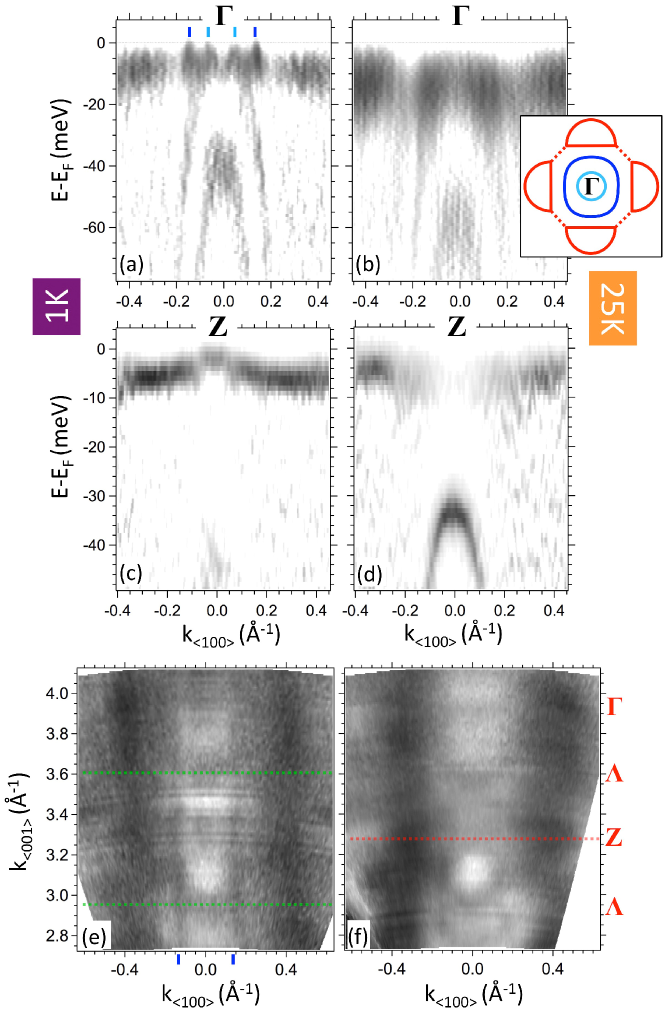
Fig. 3 compares the near- electronic structure of URu2-xFexSi2 in the HO () and deep into the AFM () [33, 34, 37, 35, 43] phases, around the Z and high-symmetry points of the BCT Brillouin zone. We observe small but unequivocal changes around these points within the first few meV below the Fermi level. In particular, both in the HO phase, Figs. 3(a-d), and in the AFM phase, Figs. 3(g-j), the band dispersions around Z and exhibit a clear M-shaped feature with an electron pocket centered at . However, the band minimum of this electron pocket, located at meV in the HO state, is pushed up in energy to meV in the AFM state. This is also seen from the grey momentum-integrated energy distribution curves (EDCs) around Z and , shown in Figs. 3(e, f) and Figs. 3(k, l). More important, as demonstrated by the momentum-integrated magenta EDCs in Figs. 3(e, f) and Figs. 3(k, l), such changes do not correspond to a rigid energy shift, as there are no observable differences in the binding energy of the heavy bands at large momenta ( Å-1), far from the hybridization region (around ). The Supplementary Information (SI..6) presents complementary analyses of the band structure changes between the HO and AFM phases around Z and , as well as a comparison of the out-of-plane dispersions in both phases (SI..7), and a discussion of the changes in electronic structure at fixed doping () across the PM/AFM transition (SI..8) The latter are qualitatively the same as those observed across the PM/HO transition [19], namely the gapping of a large diamond-like Fermi surface around along and the concomitant formation of the four Fermi petals, as discussed in Fig. 2.
The direct observation of a slight but distinct electronic band structure change across the HO/AFM phase boundary gives crucial insight to previous results obtained by other experimental probes. Specifically, extremal Fermi surface contours by means of SdH oscillations showed only minor differences between the HO and the AFM phases [32], while transport measurements concluded that the partially gapped Fermi surface of the HO phase [1] would be further gapped, and/or its volume reduced (decrease in the Sommerfeld coefficient), when the system is driven into the AFM phase [27, 33]. Moreover, inelastic neutron scattering experiments suggested that the Fermi surface pockets at the , Z and/or (connecting two Fermi petals) wave-vectors should slightly distort upon crossing the HO/AFM phase boundary, so as to modify the optimal energy for nesting [43]. In agreement with those previous findings indicating only subtle Fermi surface changes that might be a consequence of better nesting conditions, our results in the AFM phase, compared to those in the HO phase, show a slightly modified electronic structure. Specifically, we observe an upwards energy shift of the electron pockets around the Z and high-symmetry points. Given the isotropic shape of the electron-like pocket around , Fig. 2(c), an upward energy shift would be translated into a concomitant reduction of the corresponding Fermi surface contours, resulting in a smaller number of charge carriers in the AFM state. It is worth noting that, according to recent electronic structure calculations, a decrease in the volume of the unit cell, such as the one induced by chemical pressure through the partial substitution of Ru with Fe, would induce an energy shift in the opposite direction to the one experimentally observed at the Z and points [41]. We conclude that across the HO/AFM phase boundary, changes of the interaction strength between states near the Fermi level are at the origin of a minor but essential Fermi surface change in the system, stabilizing one or the other phase. We thus hope that our work will motivate further theoretical studies of the AFM phase of URu2Si2 aiming to couple the observed energy shifts with the effect of the AFM nesting vectors [44].
One may speculate, as predicted by some models [45], that pressure (physical or chemical) could have the effect of decreasing the Ru - U interaction strength to a critical value below which the conduction carriers that were coupled to localized electrons are no longer able to screen the magnetic interactions of the latter. Therefore, at high pressures, due to unscreened magnetic moments, the system is driven into the AFM phase.
More generally, within the Mott-Doniach picture of heavy-fermion systems [46, 47], the competition between antiferromagnetic interactions and the Kondo effect leads to a quantum phase transition between an antiferromagnetic ground state, characterized by localized-like electrons, and a Kondo lattice of itinerant electrons. Our results show that the interaction strength of near- electronic states is another crucial ingredient that needs to be taken into account in the understanding of the phase diagram and quantum phase transitions of heavy-fermion systems.
Acknowledgements.
We thank Marie-Aude Méasson, Sergio G. Magalhães and Peter Riseborough for comments and discussions. ARPES work at ISMO was supported by public grants from the French National Research Agency (ANR), project Fermi-NESt No ANR-16-CE92-0018. Single-crystal growth at UCSD was supported by the US Department of Energy, Office of Basic Energy Sciences, Division of Materials Sciences and Engineering, under Grant No. DE-FG02-04-ER46105. Sample characterization at UCSD was sponsored by the National Science Foundation under Grant No. DMR-1810310.Data Availability
All relevant data are contained in this manuscript and the Supplementary Information. Reproduction of these data on different samples is available upon reasonable request by emailing the corresponding authors.
Author Contributions
Author contributions: A.F.S.-S. and M.B.M. designed research; E.F, J.D., T.C.R., M.G., C.B. and F.F. performed ARPES measurements, under the supervision of A.F.S.-S; E.D.L.R. provided support with instrumentation at UE112-PGM-2b-13 endstation; S.R., N.K., K.H., N.P., C.T.W., M.B.M. and P.L. prepared and characterized single crystals; E.F. and C.B., and A.F.S.-S. analyzed and interpreted data; E.F. and A.F.S.-S wrote the paper. All authors discussed extensively the results and the manuscript.
SUPPLEMENTARY INFORMATION
.1 Preparation and characterization of URu2-xFexSi2 single crystals
The single crystals of Fe-substituted URu2Si2 on which the ARPES measurements were made were grown by the Czochralski method in a tetra-arc furnace at UCSD. These crystals were characterized at UCSD by means of X-ray diffraction, electrical resistivity, magnetization, specific heat, and thermal expansion measurements as a function of temperature, magnetic field and pressure as described in several publications [37, 48, 49]. The electrical resistivity measurements were performed using a home-built probe in a liquid He Dewar by means of a standard four-wire technique at Hz, using a Linear Research LR700 a.c. resistance bridge. Magnetization measurements were made in a magnetic field of T, using a Quantum Design magnetic property measurement system (MPMS). Specific heat measurements were performed in a Quantum Design DynaCool physical property measurement system (DC-PPMS-9), using a heat-pulse technique. Thermal expansion measurements were made in a Quantum Design DC-PPMS-9 with a dilatometer measurement option (model P680). The single crystals with (pure URu2Si2) and prepared at UCSD were further characterized by means of spectroscopic measurements, performed in the laboratories of collaborators or national laboratories, which include neutron diffraction [50, 34], inelastic neutron scattering [9, 35], ultrasonic [51, 52], infrared spectroscopy [53], Raman spectroscopy [36], ultrafast optical spectroscopy [54], X-ray scattering [55, 56], EXAFS [57], and quasiparticle scattering [58] measurements. A simple measurement that is often used to assess the quality of a metallic sample is the electrical resistivity. The electrical resistivity measurements in the vicinity of the transition temperature for the single crystal samples of URu1-xFexSi2 with , and are shown in Refs. [37] and [48]. The width of the resistive transitions for the samples in the LMAFM phase with Fe concentrations of and are only slightly broadened when compared to those reported for the pristine URu2Si2 sample in the HO phase. The sharp transitions in the single crystal samples of URu1-xFexSi2 with and indicate the samples are of high quality. However, there is a certain amount of broadening of the transition, which is to be expected with an increase in Fe concentration. Here, the larger concentrations of Fe that are introduced into the melts grown by the Czochralski method can result in a larger degree of inhomogeneity within the sample, especially in the direction of the vertical axis of the rod-shaped boule that is pulled from the melt. Furthermore, the transition temperatures of , , and K, for the , , and samples, respectively, are consistent with the behavior of the phase boundary in both the HO and LMAFM phases across a broad range of Fe concentrations, e.g., vs in Ref. [37] and vs in Ref. [48].
.2 ARPES measurements
ARPES measurements were performed at the UE112-PGM-2b-13 endstation of BESSY II with a Scienta R4000 hemispherical electron analyser. Data for angle-resolved measurements were collected with photon energies between 20 and 67 eV. Higher photon energies were used for angle-integrated measurements, (see SI..4). The instrumental resolution varied from 3 to 7 meV according to experimental conditions. The light polarisation was linear horizontal or linear vertical as mentioned in the figure captions. The size of the beam spot was 40 m. Samples were cleaved in situ at a temperature below 20K. The pressure was at all times lower than mbar. The raw ARPES spectra were normalized to the total intensity of the energy distribution curves and -if necessary- served to calculate the 2D curvature [39]. All data comparisons refer to identical experimental conditions and data treatment. The results have been reproduced in at least five different cleaves. The location of the normal-emission high-symmetry , and Z points was always double-checked by performing in advance in-plane Fermi-surface maps in steps of or degrees around these points.
Similar to previous ARPES studies [15, 19], we note that although our low-temperature data (1K) were acquired at slightly below the superconducting (SC) transition for , the corresponding energy gap [59] is at least 1-2 orders of magnitude smaller than our experimental resolution, and any possible changes associated with superconductivity cannot be seen in the present study.
.3 3D -space mapping
Within the free-electron final state model, ARPES measurements at constant photon energy give the electronic structure at the surface of a spherical cap of radius . Here, is the free electron mass, is the work function, and eV is the “inner potential” of URu2Si2 [10, 11, 42, 19]. Measurements around normal emission provide the electronic structure in a plane nearly parallel to the surface plane. Likewise, measurements as a function of photon energy provide the electronic structure in a plane perpendicular to the surface.
.4 Electronic structure of (Fe-doped) URu2Si2 as a function of surface termination
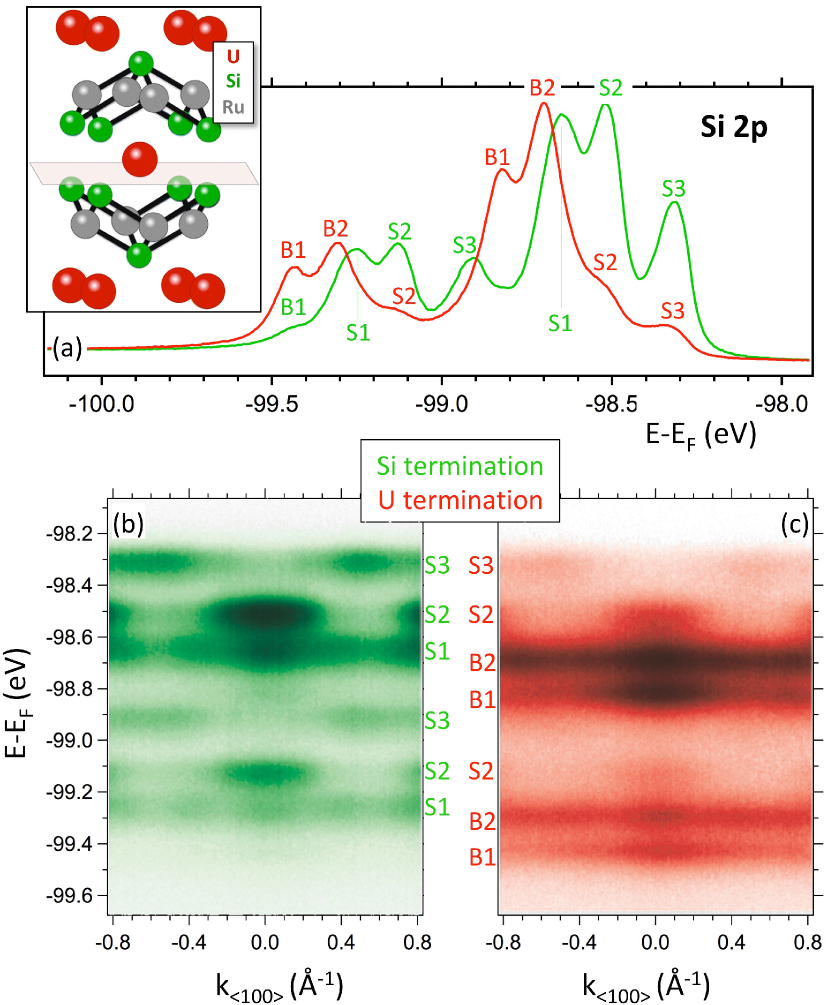
The crystal structure of URu2Si2 is shown in the inset of Fig. 4(a). The lattice has a body-centred tetragonal symmetry with Ru, Si and U atoms forming in-plane square lattices and each Ru tetrahedrally coordinated to four Si atoms [60]. In Fe-doped URS (Fe-URS), there is a partial substitution of Ru by Fe. Due to the smaller size of the Fe atoms, a reduction of the unit cell volume may be expected, producing an effective chemical pressure [33]. The characteristic -U-Si-Ru-Si-U- atomic stacking permits fracturing in UHV conditions to expose (001) cleavage surfaces. A cleavage plane is indicated in the inset of Fig. 4(a) and may yield a Si- or a U-terminated surface.
Despite important advances in revealing the electronic band structure of URS by means of ARPES [10, 11, 61, 62, 12, 13, 14, 15, 16, 19, 63] and in visualising different terminations in the nanometer scale by means of STM [18], there are scarce reports including an effort to combine these findings 111The electronic band structure of different terminations by photoemission has been the focus of studies of isostructural compounds such as CeRu2Si2 and YbRh2Si2 [10, 65, 66, 63].. Unveiling the relationship between surface termination and electronic band structure is of fundamental importance as surface effects can dominate the ARPES spectra and thus complicate the interpretation of electronic band structure changes when comparing samples from different regions of the phase diagram.
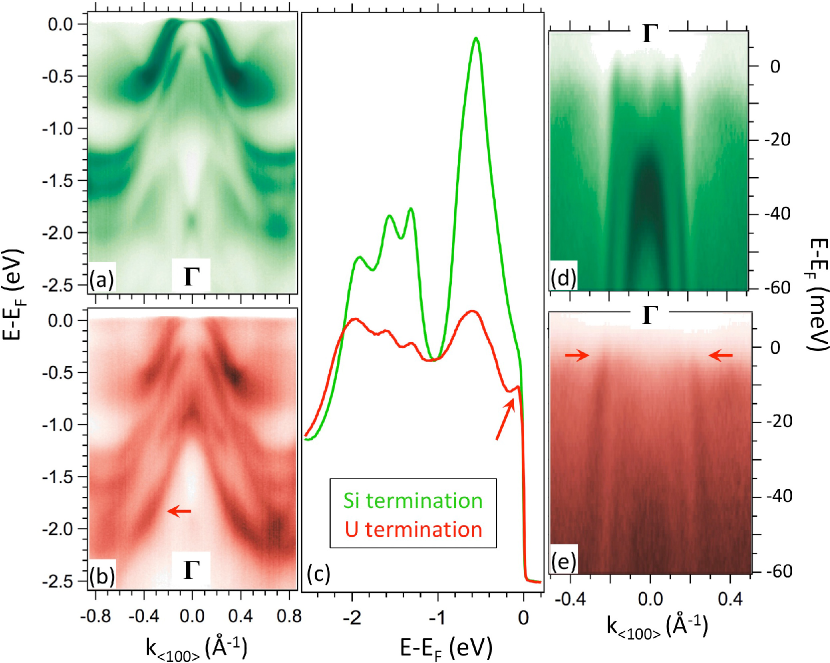
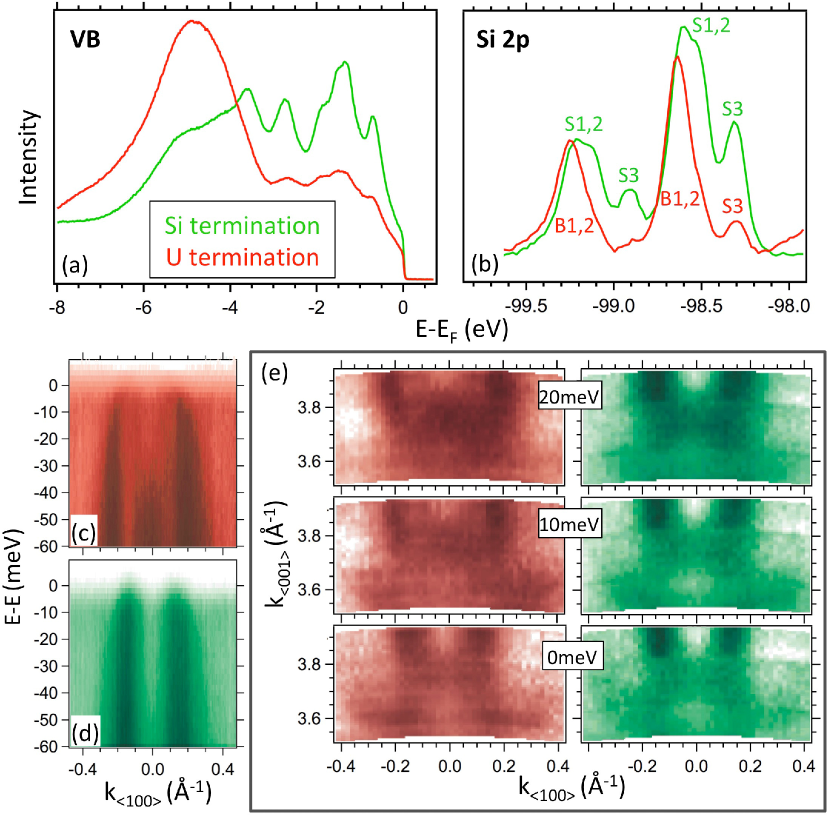
Fig. 4(a) presents the Si core level spectra from different areas of a Fe-URS (001) cleavage surface. Si surface sites are expected to give rise to satellites of the main Si bulk core levels peaks. We therefore attribute the green (red) curve to a sample location where the surface termination is dominated by Si (U) atoms. ‘B’ and ‘S’ denote the bulk and surface origin of the corresponding peaks, while the numbers group together the spin-orbit counterparts of each Si site. The red curve reveals that there are more than one Si bulk sites, in agreement with the URu2Si2 crystal structure. On comparison of the two curves, we note that there are no energy shifts, but only changes in the relative intensity of the peaks.
Fig. 4(b, c) prove that each core level peak exhibits a characteristic intensity distribution in -space, due to photoelectron diffraction. Since the intensity distribution is expected to vary only when the associated Si site becomes different, this observation permits us to unequivocally associate each peak to its spin-orbit counterpart and to the corresponding peak of the other termination. Taking advantage of their intensity distributions, one can be certain that the features termed S1 and S2 correspond to different Si sites from those termed B1 and B2. As expected, the spectroscopic fingerprint of S1, S2 and S3 is very weak on the surface with a termination layer dominated by U atoms. A well-defined photoelectron diffraction pattern from surface sites proves that the surface atoms are arranged into a periodic lattice rather than in a number of random steps and edges. Therefore, our results suggest that areas of a dominant Si- (or U-) termination layer can be at least as large as our beam spot (40 m), although terraces with a strictly unique atomic termination are much smaller [18].
The valence band spectra in Figs. 5(a, b) show that dispersing states are present in both terminations. The U-terminated surface exhibits additional non-dispersing spectral weight just below the Fermi level, which is presumably of U 5 origin [arrow in Fig. 5(c)], but also a strongly dispersing state within the energy range of 1-2 eV that is centred at and has no counterpart in the Si-terminated surface [arrow in Fig. 5(b)]. Moreover, looking closer at the electronic structure within the first few meV below , the U-terminated surface presents a rapidly dispersing hole-like state crossing the Fermi level [arrows in Fig. 5(e)] that cannot be identified with any of the states observed on the Si-terminated surface [Fig. 1 of the main text and Fig. 5(d)]. The presence of dispersing states that are unique to each surface termination confirms that both surfaces are well-ordered. Fig. 6 summarizes our results on URu1.8Fe0.2Si2. Despite changes in stoichiometry and differences in experimental conditions (e.g. photon energy, energy resolution) between Figs. 4/5 and Fig. 6, one can draw common conclusions for the two terminations. Most dispersing states within the valence band continuum are common to both terminations, but there are certain electronic states that are termination-specific. For the Si-terminated surface, these are a hole-like parabolic surface state and the light-hole conduction band –see Fig. 6(d). On the other hand, the fingerprints of the the U-terminated surface are a strongly dispersing band with a maximum at 1 eV below [Fig. 5(b)] and the hole-like electronic state crossing [Figs. 5(e) and 6(c)]. The angle-integrated spectrum of the valence band in the U-termination is nevertheless dominated by a broad peak at a binding energy of 5 eV –see Fig. 6(a). In Fig. 6(e), we have followed the out-of-plane dispersion of the low energy states that are characteristic for each termination. Although there are no clear differences at , data at slightly higher binding energies show that the contours in the U-terminated surface are found at larger values than those in the Si-terminated surface. This observation is agreement with a comparison of Fig. 6(c) and 6(d) where the light-hole conduction band is somewhat wider in momentum in the U termination. Last but not least, there are important differences in the Si 2 peaks, which have been already addressed in the discussion of Fig. 4: the surface-related (bulk-related) Si peaks are enhanced in the Si-terminated (U-terminated) surface. As shown in Fig. 6(b), we note that the Si 2 core level peaks for the two terminations can be perfectly reproduced under different experimental conditions.
.5 Robustness of the URu2-xFexSi2 cleavage surfaces in a UHV environment
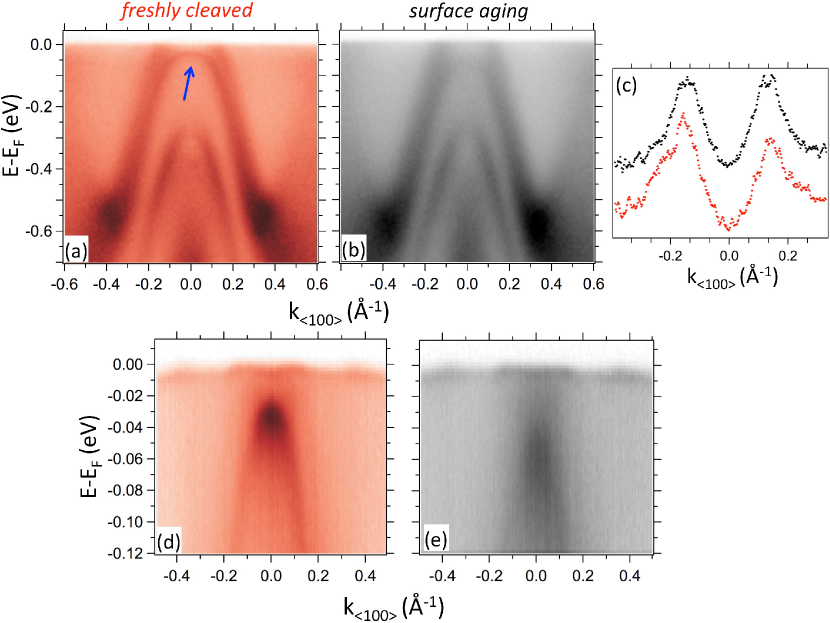
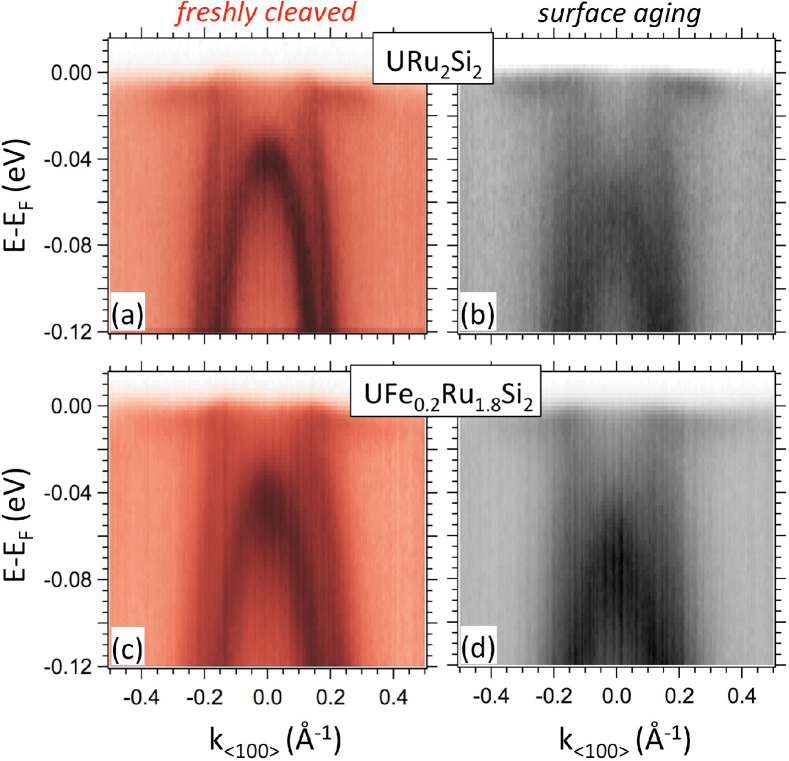
The Si-terminated cleavage surfaces of URS and Fe-URS are sensitive to the residual gases in UHV conditions. Figs. 7 and 8 present a comparison of the ARPES data acquired on a freshly cleaved (Fe)-URu2Si2 surface (red-hued images) and on the same surface after intentional exposure to residual UHV gases for a few hours (gray-scale images). The hole-like surface state is dramatically affected by aging: its spectral signature becomes broader, while its maximum shifts to higher binding energy. It is precisely the sensitivity of this spectral feature to surface contamination that demonstrated its surface origin in previous works [42]. The degradation rate and the size of the energy shift depend on the residual gas pressure and the presence of excited molecular species [42]. As seen in Figs. 7(d, e), a base pressure of mbar induces a shift of the order of 25 meV in 23 hours. This rate is smaller by a factor of 10-20 with respect to the results presented in previous works [42], a study performed under similar UHV conditions but using a He discharge lamp, whose plasma can produce a considerable amount of excited species coming from contaminants in the gas. We note that the energy shift and degradation of the surface state is appreciable even in the absence of incoming photons [Fig. 8, bottom]. We therefore exclude photo-ionisation and photo-dissociation of residual gas molecules as mechanisms of surface degradation.
The rest of the electronic structure is also affected by surface aging, albeit to a smaller extent than the surface state. The light-hole conduction band presents a decreased signal-to-noise ratio after exposure to residual gas molecules (Fig. 8). Despite the degradation, there is no observed energy shift of the light-hole conduction band, as its Fermi wave-vectors do not change before and after exposure to residual gases [Fig. 7(c)]. It is noteworthy that the heavy bands just below are the least affected by surface contamination [Fig. 7(bottom) and Fig. 8]. Variations in the sensitivity of different bulk states to surface aging can be an additional proof of their orbital origin. In a Si-terminated surface, as shown in Fig. 4(a), U atoms are far from the topmost layer, thus states of U 5 origin would be indeed the least sensitive to surface contamination.
.6 Further comparison and simplified modeling of the near- electronic structure of pure and Fe-doped URu2Si2
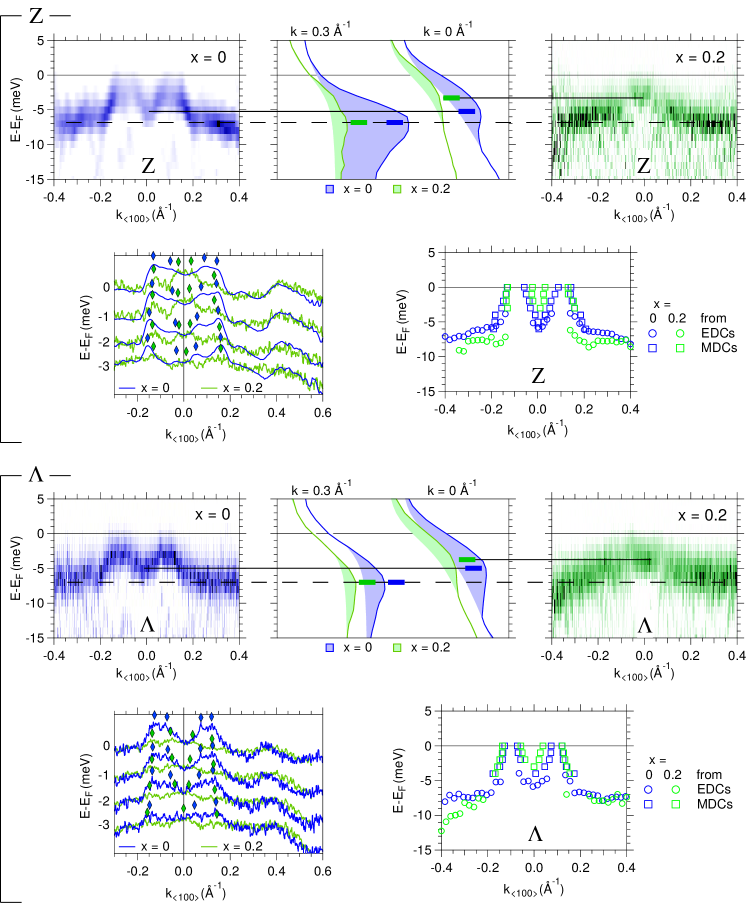
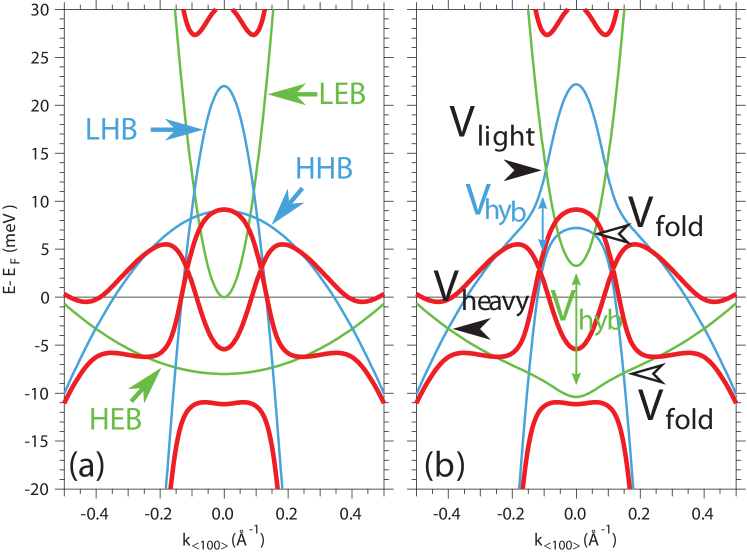
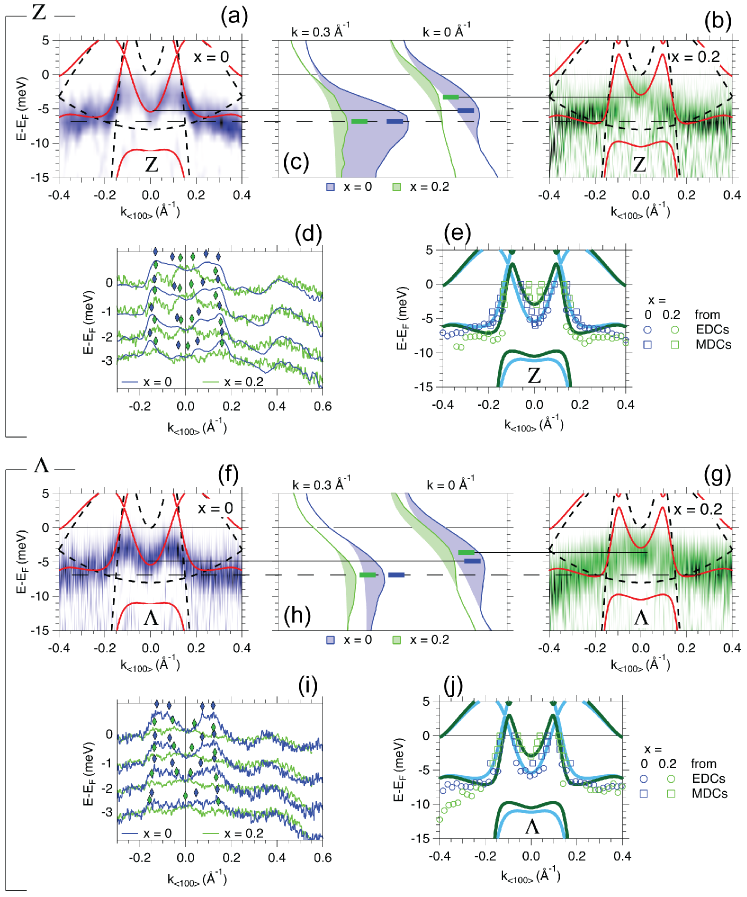
Fig. 9 presents complementary data showing the decrease in size of the electron pockets around Z and in the AFM state (URu1.8Fe0.2Si2 sample, green hues, curves, bars and markers) compared to the HO state (URu2Si2 sample, blue colors). Figs. 9(a, b) show the ARPES energy-momentum dispersion around the Z point in, respectively, pure URu2Si2 and URu1.8Fe0.2Si2. The corresponding energy distribution curves at (Z point) and at Å-1 (heavy tail of the M-shaped band) are shown in Fig. 9(c). One observes that, while the heavy band at high momenta is essentially unaffected by the HO/AFM transition, the electron pocket at Z is shifted up in energy: its band bottom moves up by about meV. This is corroborated by the analysis of the MDC and EDC peak positions, Figs. 9(d, e), which show a concomitant reduction of the Fermi momenta of the electron pocket in the AFM state –see in particular the complete band dispersions of the M-shaped bands, extracted from the MDC and EDC peaks, in Fig. 9(e). As demonstrated by Figs. 9(f-j), the electron pocket around shows a comparable up-shift in energy, of about meV, as well as a reduction of the Fermi momenta in the AFM state.
The band structure we observe at the vicinity of the Fermi level around normal emission can be fairly described with a toy model, introduced in our previous works [15, 19], generalized here to four parabolic “parent” bands: one heavy electron-like band (HEB), one light electron-like band (LEB), one heavy hole-like band (HHB), and one light hole-like band (LHB). These four parent bands, shown in panel (a) of Fig. 10, are then subject to pair-wise interactions (see below). As pointed out in Ref. [19], the effective bands resulting from our model compare well (modulo the experimentally observed mass renormalization) with DFT calculations near [41]. Moreover, they are reminiscent of the results of more recent DFT calculations that revealed electron-like contours around and hole-like contours around Z [62].
Given the weak out-of-plane dispersion of the bands around (Supplementary Information, SI..7), we used the same toy model to fit the band dispersion around the Z and high symmetry points, both in the HO and AFM phases. The results of the fit, discussed next, are superimposed on the experimental data in Fig. 11. The fitting masses of the different parent bands were , , , . The large difference in effective masses between the light and heavy bands suggests that the latter are of predominant U character, while the light bands are of predominant Ru character. The effective masses and the energy position of the parent bands are summarized in Table 1.
| Parent bands parameters | ||
|---|---|---|
| effective mass | energy position | |
| HEB | ||
| LEB | ||
| HHB | ||
| LHB | ||
Interactions between the different bands can be separated in two types. We assimilate the first type to a Kondo hybridization of strength meV, present in the paramagnetic, HO and AFM states, between the heavy electron- (hole-)like band and the light electron- (hole-)band. These are the interactions marked with blue and green fonts in panel (b) of Fig. 10. We assign the second type to band folding in the ordered states, induced by the change in the symmetry of the Brillouin zone from BCT in the PM state to ST in the HO [19] and AFM states. Such band folding implies anti-crossing of electron-like and hole-like bands. The corresponding interactions are marked with black fonts in panel (b) of Fig. 10. To accurately fit our ARPES measurements in the HO phase ( samples), the interaction between the two heavy bands in the direction was found to be meV, the one between the two light bands was meV, and the interaction between the heavy electron- (hole-)like band and the light hole- (electron-)like band was meV.
From this toy model, the upward shift of the inner electron-like band observed by ARPES in the AFM phase ( samples) could result either from an increased interaction with the heavy electron-like band that lies below, or from a decreased interaction with the heavy hole-like band that lies above. These two scenarios would correspond, respectively, to an increase of from meV to meV, or to a decrease of the folding induced anti-crossing from meV to meV. The interaction parameters between different bands in the two scenarios are summarized in Tables 2 and 3. The latter scenario is pictured in the Supplementary Fig. 11.
| Interaction parameters – scenario 1: Increased Kondo hybridization HO AFM | ||||
| HEB | LEB | HHB | LHB | |
| HEB | – | 5 8 meV | meV | meV |
| LEB | 5 8 meV | – | meV | meV |
| HHB | meV | meV | – | 5 8 meV |
| LHB | meV | meV | 5 8 meV | – |
| Interaction parameters – scenario 2: Decreased folding interaction HO AFM | ||||
| HEB | LEB | HHB | LHB | |
| HEB | – | meV | meV | 8.5 5.5 meV |
| LEB | meV | – | 8.5 5.5 meV | meV |
| HHB | meV | 8.5 5.5 meV | – | meV |
| LHB | 8.5 5.5 meV | meV | meV | – |
.7 Out-of-plane Fermi surfaces of URu2-xFexSi2 vs. URu2Si2
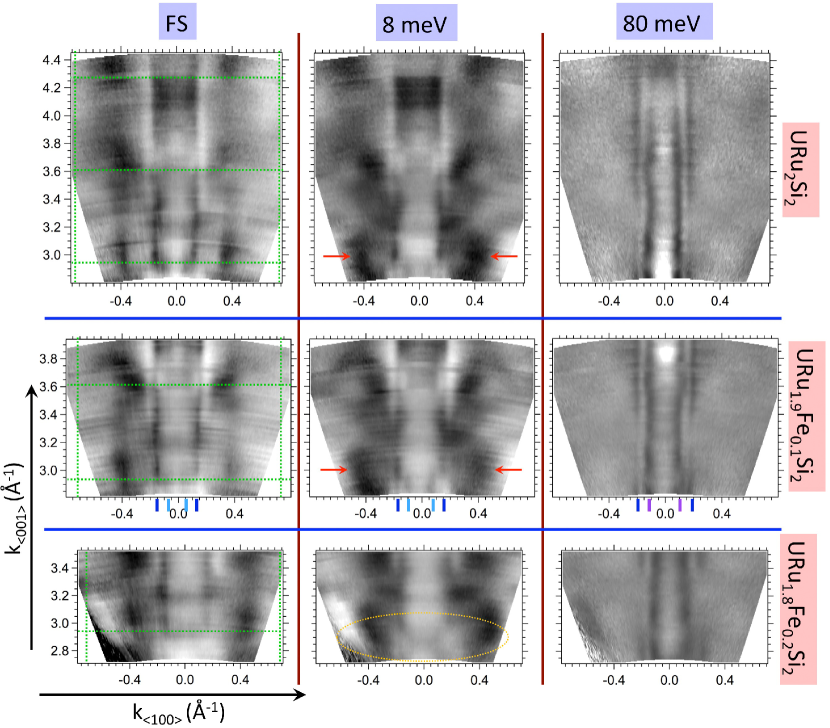
Fig. 12 compares the out-of-plane constant energy maps of pure URS and Fe-doped URS at 1K. Similarly to its in-plane counterpart discussed in the main text, the out-of-plane FS of URS presents minimal changes as a function of Fe concentration, as shown in Fig. 12 (left column). A closer inspection to the constant energy maps at a binding energy of 8 meV (middle column) reveals that URu1.8Fe0.2Si2 shows less sharp contours at the lower point ( = Å-1, dashed ellipse) with respect to other Fe concentrations. This observation is in line with the data presented in the main text, where the near- electronic structure disperses down to a smaller binding energy at for = . Although the light-hole conduction band and the M-shaped feature show no appreciable out-of-plane dispersion, we cannot assign a surface origin to them because the corresponding in-plane contours shown in the main text, Figs. 2(a-d), are in excellent agreement with bulk LSDA calculations [21, 41]. We underline that the limited resolution of the experimental technique (i.e. inversely proportional to the photoelectron escape depth [38], which is almost as high as one-fourth of the simple tetragonal BZ in our case) can sometimes mask the out-of-plane dispersion in an ARPES experiment.
The middle column of Fig. 12 reveals the existence of closed constant energy contours (some of them marked by arrows) in the plane: a proof for non-negligible out-of-plane dispersion of the heavy bands, hence of their 3D bulk character. The out-of-plane dispersion of the heavy bands is also captured by the supplementary ancillary movie. showing the dispersion for successive values. On the other hand, the light-hole conduction band (dark blue marker), the M-shaped band (light blue marker) and the surface state (purple marker) show no appreciable dispersion along .
.8 Changes in the electronic structure of URu2-xFexSi2 across the PM/AFM transition
Similar to the pure URu2Si2, whose in-plane Fermi-surface in the PM state gets gapped along the directions in the HO state [19], the electronic structure of URu1.8Fe0.2Si2 also develops a gap along the directions upon the PMAFM phase transition. Figs. 13 and 14 present the changes in the electronic structure of URu2-xFexSi2, respectively along and , across the PM/AFM phase transition.
Fig. 13 shows the electronic dispersion along , of URu1.8Fe0.2Si2 at 1K (left column, AFM phase) and 25K (right column, PM phase). In the PM state, the most prominent feature is a large heavy electron band crossing , forming a diamond-like Fermi surface centered around . We note that this heavy electron band is qualitatively captured by the parent bands of the toy model presented in Fig. 10. In the AFM phase, the band structure undergoes substantial changes: a gap of about 5 meV opens along in the diamond Fermi surface, at the so-called “hot-spots”, and the band dispersion becomes M-shaped, forming a shallow heavy electron pocket surrounded by a heavy hole-like pocket around .
Fig. 14 compares the electronic dispersion along , and corresponding out-of-plane FS contours, of URu1.8Fe0.2Si2 at 1K (left column, AFM phase) and 25K (right column, PM phase). In the PM state, the heavy bands near show again the large electron-like pocket forming the diamond-like Fermi surface. Deep into the AFM state, as also shown in the main text, such electron pocket transforms into an M-shaped band, giving rise to four off-centered “Fermi petals” at Å-1.
All the changes in the near- electronic structure across the PM/AFM transition are similar to the ones observed in pure URu2Si2 across the PM/HO transition [19], as also discussed in the main text.
We note that changes between the AFM and the PM phase as shown in Figs. 13 and 14 are fundamental and not related to extrinsic factors such as surface quality. For instance, the surface quality in Fig. 14(d) was higher than in Fig. 14(c) as can be inferred from the well-resolved surface state in the former. The differences in the near- dispersion of the light-hole conduction band are also reflected in the out-of-plane FS contours, bottom panels of Fig. 14. In the AFM phase [Fig. 14(e)], one can clearly track Fermi-surface contours reflecting the apparent lack of dispersion of the light-hole band. These open FS contours are barely visible in the PM phase [Fig. 14(f)]. This is not surprising knowing that the light-hole conduction band exhibits no intensity at energies higher than the -band continuum [Fig. 14(b)]. As a side note, we point out that the apparent closed contours in the vicinity of the lower point in Fig. 14(f) do not belong to a single state: they consist of small portions of the light-hole conduction band (outer part of the contour) and a shallow electron pocket (inner part of the contour). The shallow electron pocket at -also known as the ‘lentil’ [19]- has been already discussed in the main text.
References
- Maple et al. [1986] M. B. Maple, J. W. Chen, Y. Dalichaouch, T. Kohara, C. Rossel, M. S. Torikachvili, M. W. McElfresh, and J. D. Thompson, Partially gapped Fermi surface in the heavy-electron superconductor URu2Si2, Phys. Rev. Lett. 56, 185 (1986).
- Palstra et al. [1985] T. T. M. Palstra, A. A. Menovsky, J. van den Berg, A. J. Dirkmaat, P. H. Kes, G. J. Nieuwenhuys, and J. A. Mydosh, Superconducting and Magnetic Transitions in the Heavy-Fermion System URu2Si2, Phys. Rev. Lett. 55, 2727 (1985).
- Schlabitz et al. [1986] W. Schlabitz, J. Baumann, B. Pollit, U. Rauchschwalbe, H. M. Mayer, U. Ahlheim, and C. D. Bredl, Superconductivity and magnetic order in a strongly interacting fermi-system: URu2Si2, Z. Phys. B 62, 171 (1986).
- de Visser et al. [1986] A. de Visser, F. E. Kayzel, A. A. Menovsky, J. J. M. Franse, J. van der Berg, and G. J. Nieuwenhuys, Thermal expansion and specific heat of monocrystalline URu2Si2, Phys. Rev. B 34, 8168(R) (1986).
- Broholm et al. [1987] C. Broholm, J. K. Kjems, W. J. L. Buyers, P. Matthews, T. T. M. Palstra, A. A. Menovsky, and J. A. Mydosh, Magnetic excitations and ordering in the heavy-electron superconductor URu2Si2, Phys. Rev. Lett. 58, 1467 (1987).
- Matsuda et al. [2001] K. Matsuda, Y. Kohori, T. Kohara, K. Kuwahara, and H. Amitsuka, Spatially Inhomogeneous Development of Antiferromagnetism in URu2Si2: Evidence from 29Si NMR under Pressure, Phys. Rev. Lett. 87, 087203 (2001).
- Wiebe et al. [2007] C. R. Wiebe, J. A. Janik, G. J. MacDougall, G. M. Luke, J. D. Garrett, H. D. Zhou, Y.-J. Jo, L. Balicas, Y. Qiu, J. R. D. Copley, Z. Yamani, and W. J. L. Buyers, Gapped itinerant spin excitations account for missing entropy in the hidden-order state of URu2Si2, Nature Phys. 3, 96 (2007).
- Villaume et al. [2008] A. Villaume, F. Bourdarot, E. Hassinger, S. Raymond, V. Taufour, D. Aoki, and J. Flouquet, Signature of hidden order in heavy fermion superconductor URu2Si2: Resonance at the wave vector , Phys. Rev. B 78, 012504 (2008).
- Butch et al. [2015] N. P. Butch, M. E. Manley, J. R. Jeffries, M. Janoschek, K. Huang, M. B. Maple, A. H. Said, B. M. Leu, and J. W. Lynn, Symmetry and correlations underlying hidden order in URu2Si2, Phys. Rev. B 91, 035128 (2015).
- Denlinger et al. [2001] J. D. Denlinger, G.-H. Gweon, J. W. Allen, C. G. Olson, M. B. Maple, J. L. Sarrao, P. E. Armstrong, Z. Fisk, and H. Yamagami, Comparative study of the electronic structure of XRu2Si2: probing the Anderson lattice, J. Electron Spectr. Rel. Phenom. 117-118, 347 (2001).
- Santander-Syro et al. [2009] A. F. Santander-Syro, M. Klein, F. L. Boariu, A. Nuber, P. Lejay, and F. Reinert, Fermi-surface instability at the ‘hidden-order’ transition of URu2Si2, Nature Phys. 5, 637 (2009).
- Yoshida et al. [2012] R. Yoshida, M. Fukui, Y. Haga, E. Yamamoto, Y. Onuki, M. Okawa, W. Malaeb, S. Shin, Y. Muraoka, and T. Yokoya, Observation of two fine structures related to the hidden order in the spectral functions of URu2Si2, Phys. Rev. B 85, 241102(R) (2012).
- Yoshida et al. [2013] R. Yoshida, K. Tsubota, T. Ishiga, M. Sunagawa, J. Sonoyama, D. Aoki, J. Flouquet, T. Wakita, Y. Muraoka, and T. Yokoya, Translational Symmetry Breaking and Gapping of Heavy-Quasiparticle Pocket in URu2Si2, Sci. Rep. 3, 2750 (2013).
- Meng et al. [2013] J.-Q. Meng, P. M. Oppeneer, J. A. Mydosh, P. S. Riseborough, K. Gofryk, J. J. Joyce, E. D. Bauer, Y. Li, and T. Durakiewicz, Imaging the Three-Dimensional Fermi-Surface Pairing near the Hidden-Order Transition in URu2Si2 Using Angle-Resolved Photoemission Spectroscopy, Phys. Rev. Lett. 111, 127002 (2013).
- Boariu et al. [2013] F. L. Boariu, C. Bareille, H. Schwab, A. Nuber, P. Lejay, T. Durakiewicz, F. Reinert, and A. F. Santander-Syro, Momentum-resolved evolution of the kondo lattice into “hidden order” in URu2Si2, Phys. Rev. lett. 110, 156404 (2013).
- Chatterjee et al. [2013] S. Chatterjee, J. Trinckauf, T. Hänke, D. E. Shai, J. W. Harter, T. J. Williams, G. M. Luke, K. M. Shen, and J. Geck, Formation of the coherent heavy fermion liquid at the hidden order transition in URu2Si2, Phys. Rev. Lett. 110, 186401 (2013).
- Schmidt et al. [2010] A. R. Schmidt, M. H. Hamidian, P. Wahl, F. Meier, A. V. Balatsky, J. D. Garrett, T. J. Williams, G. M. Luke, and J. C. Davis, Imaging the Fano lattice to ‘hidden order’ transition in URu2Si2, Nature 465, 570 (2010).
- Aynajian et al. [2010] P. Aynajian, E. H. da Silva Neto, C. V. Parker, Y. Huang, A. Pasupathy, J. Mydosh, and A. Yazdani, Visualizing the formation of the kondo lattice and the hidden order in URu2Si2, PNAS 107, 10383 (2010).
- Bareille et al. [2014] C. Bareille, F. L. Boariu, H. Schwab, P. Lejay, F. Reinert, and A. F. Santander-Syro, Momentum-resolved hidden-order gap reveals symmetry breaking and origin of entropy loss in URu2Si2, Nature Commun. 5, 4326 (2014).
- Haule and Kotliar [2009] K. Haule and G. Kotliar, Arrested Kondo effect and hidden order in URu2Si2, Nature Phys. 5, 796 (2009).
- Elgazzar et al. [2009] S. Elgazzar, J. Rusz, M. Amft, P. M. Oppeneer, and J. A. Mydosh, Hidden order in URu2Si2 originates from fermi surface gapping induced by dynamic symmetry breaking, Nature Mater. 8, 337 (2009).
- Mydosh and Oppeneer [2011] J. A. Mydosh and P. M. Oppeneer, Colloquium: Hidden order, superconductivity, and magnetism: The unsolved case of URu2Si2, Rev. Mod. Phys. 83, 1301 (2011).
- Mydosh and Oppeneer [2014] J. A. Mydosh and P. M. Oppeneer, Hidden order behaviour in URu2Si2 (A critical review of the status of hidden order in 2014), Philos. Mag. 94, 3642 (2014).
- McElfresh et al. [1987] M. W. McElfresh, J. D. Thompson, J. O. Willis, M. B. Maple, T. Kohara, and M. S. Torikachvili, Effect of pressure on competing electronic correlations in the heavy-electron system URu2Si2, Phys. Rev. B 35, 43 (1987).
- Amitsuka et al. [1999] H. Amitsuka, M. Sato, N. Metoki, M. Yokoyama, K. Kuwahara, T. Sakakibara, H. Morimoto, S. Kawarazaki, Y. Miyako, and J. A. Mydosh, Effect of pressure on tiny antiferromagnetic moment in the heavy-electron compound URu2Si2, Phys. Rev. Lett. 83, 5114 (1999).
- Motoyama et al. [2003] G. Motoyama, T. Nishioka, and N. K. Sato, Phase Transition between Hidden and Antiferromagnetic Order in URu2Si2, Phys. Rev. Lett. 90, 166402 (2003).
- Jeffries et al. [2007] J. R. Jeffries, N. P. Butch, B. T. Yukich, and M. B. Maple, Competing Ordered Phases in URu2Si2: Hydrostatic Pressure and Rhenium Substitution, Phys. Rev. Lett. 99, 217207 (2007).
- Butch et al. [2010] N. P. Butch, J. R. Jeffries, S. Chi, J. B. Leao, J. W. Lynn, and M. B. Maple, Antiferromagnetic critical pressure in URu2Si2 under hydrostatic conditions, Phys. Rev. B 82, 060408(R) (2010).
- Bourdarot et al. [2011] F. Bourdarot, N. Martin, S. Raymond, L.-P. Regnault, D. Aoki, V. Taufour, and J. Flouquet, Magnetic properties of URu2Si2 under uniaxial stress by neutron scattering, Phys. Rev. B 84, 184430 (2011).
- Knafo et al. [2020] W. Knafo, S. Araki, G. Lapertot, D. Aoki, G. Knebel, and D. Braithwaite, Destabilization of hidden order in URu2Si2 under magnetic field and pressure, Nat. Phys. https://doi.org/10.1038/s41567-020-0927-4 (2020).
- Williams et al. [2017a] T. J. Williams, H. Barath, Z. Yamani, J. A. Rodriguez-Riviera, J. B. Leao, J. D. Garrett, G. M. Luke, W. J. L. Buyers, and C. Broholm, Gapped excitations in the high-pressure antiferromagnetic phase of URu2Si2, Phys. Rev. B 95, 195171 (2017a).
- Hassinger et al. [2010] E. Hassinger, G. Knebel, T. D. Matsuda, D. Aoki, V. Taufour, and J. Flouquet, Similarity of the Fermi Surface in the Hidden Order State and in the Antiferromagnetic State of URu2Si2, Phys. Rev. Lett. 105, 216409 (2010).
- Kanchanavatee et al. [2011] N. Kanchanavatee, M. Janoschek, R. E. Baumbach, J. J. Hamlin, D. A. Zocco, K. Huang, and M. B. Maple, Twofold enhancement of the hidden-order/large-moment antiferromagnetic phase boundary in the URu2-xFexSi2 system, Phys. Rev. B 84, 245122 (2011).
- Das et al. [2015] P. Das, N. Kanchanavatee, J. S. Helton, K. Huang, R. E. Baumbach, E. D. Bauer, B. D. White, V. W. Burnett, M. B. Maple, J. W. Lynn, and M. Janoschek, Chemical pressure tuning of URu2Si2 via isoelectronic substitution of Ru with Fe, Phys. Rev. B 91, 085122 (2015).
- Butch et al. [2016] N. P. Butch, S. Ran, I. Jeon, N. Kanchanavatee, K. Huang, A. Breindel, M. B. Maple, R. L. Stillwell, Y. Zhao, L. Harriger, and J. W. Lynn, Distinct magnetic spectra in the hidden order and antiferromagnetic phases in URu2-xFexSi2, Phys. Rev. B 94, 201102(R) (2016).
- Kung et al. [2016] H.-H. Kung, S. Ran, N. Kanchanavatee, V. Krapivin, A. Lee, J. A. Mydosh, K. Haule, M. B. Maple, and G. Blumberg, Analogy Between the “Hidden Order” and the Orbital Antiferromagnetism in URu2-xFexSi2, Phys. Rev. Lett. 117, 227601 (2016).
- S.Ran et al. [2016] S.Ran, C. T. Wolowiec, I. Jeon, N. Pouse, N. Kanchanavatee, B. D. White, K. Huang, D. Martien, T. DaPrond, D. Snow, M. Williamsen, S. Spagna, P. S. Riseborough, and M. B. Maple, Phase diagram and thermal expansion measurements on the system URu2-xFexSi2, PNAS 113, 13348 (2016).
- Strocov [2003] V. N. Strocov, Intrinsic accuracy in 3-dimensional photoemission band mapping, J. Electron Spectr. Rel. Phenom. 130, 65 (2003).
- Zhang et al. [2011] P. Zhang, P. Richard, T. Qian, Y.-M. Xu, X. Dai, and H. Ding, A precise method for visualizing dispersive features in image plots, Review of Scientific Instruments 82, 043712 (2011).
- Ikeda et al. [2012] H. Ikeda, M.-T. Suzuki, R. Arita, T. Takimoto, T. Shibauchi, , and Y. Matsuda, Emergent rank-5 nematic order in URu2Si2, Nat. Phys. 8, 528 (2012).
- Oppeneer et al. [2010] P. M. Oppeneer, J. Rusz, S. Elgazzar, M.-T. Suzuki, T. Durakiewicz, and J. A. Mydosh, Electronic structure theory of the hidden-order material URu2Si2, Phys. Rev. B 82, 205103 (2010).
- Boariu et al. [2010] F. L. Boariu, A. Nuber, A. F. Santander-Syro, M. Klein, F. Forster, P. Lejay, and F. Reinert, The surface state of URu2Si2, J. Electron Spectr. Rel. Phenom. 181, 82 (2010).
- Williams et al. [2017b] T. J. Williams, A. A. Aczel, M. B. Stone, M. N. Wilson, and G. M. Luke, Hidden order signatures in the antiferromagnetic phase of U(Ru1-xFex)2Si2, Phys. Rev. B 95, 104440 (2017b).
- Oppeneer et al. [2011] P. M. Oppeneer, S. Elgazzar, J. Rusz, Q. Feng, T. Durakiewicz, and J. A. Mydosh, Spin and orbital hybridization at specifically nested fermi surfaces in URuSi2, Phys. Rev. B 84, 241102 (2011).
- Dubi and Balatsky [2011] Y. Dubi and A. V. Balatsky, Hybridization wave as the “hidden order” in URu2Si2, Phys. Rev. Lett. 106, 086401 (2011).
- Mott [1974] N. F. Mott, Rare-earth compounds with mixed valencies, Philosophical Magazine 30, 403 (1974).
- Doniach [1977] S. Doniach, The kondo lattice and weak antiferromagnetism, Physica B+C 91, 231 (1977).
- Wolowiec et al. [2016] C. T. Wolowiec, N. Kanchanavatee, K. Huang, S. Ran, and M. B. Maple, Evolution of critical pressure with increasing Fe substitution in the heavy-fermion system URu2-xFexSi2, Phys. Rev. B 94, 085145 (2016).
- Ran et al. [2017] S. Ran, I. Jeon, N. Pouse, A. J. Breindel, N. Kanchanavatee, K. Huang, A. Gallagher, K.-W. Chen, D. Graf, R. E. Baumbach, J. Singleton, and M. B. Maple, Phase diagram of URu2-xFexSi2 in high magnetic fields, PNAS 114, 9826 (2017).
- Das et al. [2013] P. Das, R. E. Baumbach, K. Huang, M. B. Maple, Y. Zhao, J. S. Helton, J. W. Lynn, E. D. Bauer, and M. Janoschek, Absence of a static in-plane magnetic moment inthe ‘hidden-order’ phase of URu2Si2, New J. Phys. 15, 053031 (2013).
- Yanagisawa et al. [2013] T. Yanagisawa, S. Mombetsu, H. Hidaka, H. Amitsuka, M. Akatsu, S. Yasin, S. Zherlitsyn, J. Wosnitza, K. Huang, M. Janoschek, and M. B. Maple, Hybridization-driven orthorhombic lattice instability in URu2Si2, Phys. Rev. B 88, 195150 (2013).
- Yanagisawa et al. [2018] T. Yanagisawa, S. Mombetsu, H. Hidaka, H. Amitsuka, P. T. Cong, S. Yasin, S. Zherlitsyn, J. Wosnitza, K. Huang, N. Kanchanavatee, M. Janoschek, M. B. Maple, and D. Aoki, Search for multipolar instability in URu2Si2 studied by ultrasonic measurements under pulsed magnetic field, Phys. Rev. B 97, 155137 (2018).
- Hall et al. [2015] J. S. Hall, M. R. Movassagh, M. N. Wilson, G. M. Luke, N. Kanchanavatee, K. Huang, M. Janoschek, M. B. Maple, and T. Timusk, Electrodynamics of the antiferromagnetic phase in URu2Si2, Phys. Rev. B 92, 195111 (2015).
- Kissin et al. [2019] P. Kissin, S. Ran, D. Lovinger, V. K. Thorsmolle, N. Kanchanavatee, K. Huang, M. B. Maple, and R. D. Averitt, Quasiparticle relaxation dynamics in URu2-xFexSi2 single crystals, Phys. Rev. B 99, 165144 (2019).
- Wray et al. [2015] L. A. Wray, J. Denlinger, S. Huang, H. He, N. P. Butch, M. B. Maple, Z. Hussain, and Y. Chuang, Spectroscopic Determination of the Atomic f-Electron Symmetry Underlying Hidden Order in URu2Si2, Phys. Rev. Lett. 114, 236401 (2015).
- Amorese et al. [2020] A. Amorese, M. Sundermann, B. Leedahl, A. Marino, D. Takegami, H. Gretarsson, A. Gloskovskii, C. Schlueter, M. W. Haverkort, Y. Huang, M. Szlawska, D. Kaczorowski, S. Ran, M. B. Maple, E. D. Bauer, A. L.-J. and. Ph. Hansmann, P. Thalmeier, L. H. Tjeng, and A. Severing, From antiferromagnetic and hidden order to pauli paramagnetism in UM2Si2 compounds with 5 electron duality, PNAS 117, 30220 (2020).
- Bridges et al. [2020] F. Bridges, R. Dudschus, C. Mackeen, T. Keiber, C. H. Booth, and M. B. Maple, EXAFS investigation of the local structure in URu2-xFexSi2: Evidence for distortions below 100 K, Phys. Rev. B 102, 014109 (2020).
- Zhang et al. [2020] S. Zhang, G. Chappell, N. Pouse, R. E. Baumbach, M. B. Maple, L. H. Greene, and W. K. Park, Origin of gaplike behaviors in URu2Si2: Combined study via quasiparticle scattering spectroscopy and resistivity measurements, Phys. Rev. B 102, 081101(R) (2020).
- Hasselbach et al. [1999] K. Hasselbach, J. R. Kirtley, and P. Lejay, Point-contact spectroscopy of superconducting URu2Si2, Phys. Rev. B 46, 5826 (1999).
- Ban and Sikirica [1965] Z. Ban and M. Sikirica, The crystal structure of ternary silicides ThM2Si2 (M = Cr, Mn, Fe, Co, Ni and Cu), Acta Cryst. 18, 594 (1965).
- Yoshida et al. [2010] R. Yoshida, Y. Nakamura, M. Fukui, Y. Haga, E. Yamamoto, Y. Onuki, M. Okawa, S. Shin, M. Hirai, Y. Muraoka, and T. Yokoya, Signature of hidden order and evidence for periodicity modification in URu2Si2, Phys. Rev. B 82, 205108 (2010).
- Kawasaki et al. [2011] I. Kawasaki, S. Fujimori, Y. Takeda, T. Okane, A. Yasui, Y. Saitoh, H. Yamagami, Y. Haga, E. Yamamoto, and Y. Onuki, Band structure and Fermi surface of URu2Si2 studied by soft x-ray angle-resolved photoemission spectroscopy, Phys. Rev. B 83, 235121 (2011).
- i. Fujimori [2016] S. i. Fujimori, Band structures of and materials studied by angle-resolved photoelectron spectroscopy, J. Phys.: Condens. Matter 28, 153002 (2016).
- Note [1] The electronic band structure of different terminations by photoemission has been the focus of studies of isostructural compounds such as CeRu2Si2 and YbRh2Si2 [10, 65, 66, 63].
- Denlinger et al. [2002] J. D. Denlinger, G.-H. Gweon, J. W. Allen, and J. L. Sarrao, Possibility of minimal surface contributions to low photon energy angle-resolved photoemission of CeRu2Si2, Physica B 312-313, 670 (2002).
- Danzenbächer et al. [2007] S. Danzenbächer, Y. Kucherenko, D. V. Vyalikh, M. Holder, C. Laubschat, A. N. Yaresko, C. Krellner, Z. Hossain, C. Geibel, X. J. Zhou, W. L. Yang, N. Mannella, Z. Hussain, Z.-X. Shen, M. Shi, L. Patthey, and S. L. Molodtsov, Momentum dependence of hybridization in heavy-fermion compounds: Angle-resolved photoemission study of YbIr2Si2 and YbRh2Si2, Phys. Rev. B 75, 045109 (2007).