The GALAH Survey: No chemical evidence of an extragalactic origin for the Nyx stream
Abstract
The results from the ESA Gaia astrometric mission and deep photometric surveys have revolutionized our knowledge of the Milky Way. There are many ongoing efforts to search these data for stellar substructure to find evidence of individual accretion events that built up the Milky Way and its halo. One of these newly identified features, called Nyx, was announced as an accreted stellar stream traveling in the plane of the disk. Using a combination of elemental abundances and stellar parameters from the GALAH and APOGEE surveys, we find that the abundances of the highest likelihood Nyx members are entirely consistent with membership of the thick disk, and inconsistent with a dwarf galaxy origin. We conclude that the postulated Nyx stream is most probably a high-velocity component of the Milky Way’s thick disk. With the growing availability of large data sets including kinematics, stellar parameters, and detailed abundances, the probability of detecting chance associations increases, and hence new searches for substructure require confirmation across as many data dimensions as possible.
1 Introduction
In the CDM paradigm for the formation and growth of galaxies and large-scale structures in the Universe, the growth of large galaxies like the Milky Way happens as a result of mergers with smaller bodies. As a smaller galaxy is accreted by the Milky Way, its stars will be tidally stripped into long tails, which can remain spatially coherent for many orbits because of the long dynamical time in the Galactic halo, and will retain their kinematic association for longer (e.g., Freeman & Bland-Hawthorn, 2002; Bullock & Johnston, 2005; Johnston et al., 2008). As a consequence, a history of accretion events will lead to an accumulation of stellar streams and tidal debris throughout the Milky Way; these structures serve as a fossil record of the events that created them, with examples present even in the Solar neighborhood (e.g., Helmi et al., 1999). Such structures provide opportunities to explore the gravitational potential of the Galaxy and the presence of substructure in the dark matter distribution, as well as the properties of the systems that have contributed to the growth of the Milky Way.
The Gaia mission (Gaia Collaboration et al., 2016, 2018) is revolutionizing this work, providing accurate and precise spatial and kinematic information for a huge sample of stars in the Galaxy. These data can be combined with the results from large spectroscopic surveys to identify and investigate streams and other stellar substructures of the Galaxy.
One of the major results from the Second Data Release of the Gaia mission (Gaia DR2; Gaia Collaboration et al., 2016, 2018) was that a significant proportion of the halo stars near the Sun appears to have been accreted some 9 Gyr ago from a single dwarf galaxy, dubbed “Gaia-Enceladus” by Helmi et al. (2018), and independently confirmed (including Myeong et al., 2018a, b; Haywood et al., 2018; Fattahi et al., 2019; Belokurov et al., 2018, among others).
Spurred by this dramatic discovery, researchers have continued to sift through Gaia DR2 for evidence of more accretion events. Recently, one group searching for structures of accreted stars used a deep neural network classifier on the subset of stars for which Gaia provided astrometry and radial velocity measurements to identify an apparent prograde stellar stream in the Solar vicinity, which they named Nyx (Necib et al., 2019). The stars identified as members of Nyx were found to be on orbits that trail the Galactic disk by about 90 , which is at the edge of the velocity distribution of the thick disk. This structure was explored further in Necib et al. (2020), using abundance data from the publicly available RAVE-on (Casey et al., 2017) and GALAH DR2 (Buder et al., 2018) catalogs. Based on the orbital information and elemental abundances of the stars, the authors concluded that Nyx must be the remnant of a disrupted dwarf galaxy.
The key abundance information applied in that work was the magnesium abundance of the stars relative to iron, . The evolution of element abundances (Mg, Si, S, Ca, Ti) with overall metallicity is sensitive to the mass and star formation history of a galaxy, in the sense that the ratio, which always begins at a super-Solar level at low metallicity, declines as increases, and the start of that decline occurs at lower in lower-mass galaxies (Venn et al., 2004; Tolstoy et al., 2009). Seven of the Nyx stars had been observed by the RAVE survey and had abundance results in the RAVE-on catalog, and when Necib et al. (2020) compared their values to literature abundances for the thick disk and halo, they found that the stars had systematically lower magnesium abundances than would be expected for thick disk stars at the same , which would suggest they formed in a dwarf galaxy, rather than in situ in the Milky Way (e.g., Sheffield et al., 2012).
In this work, we re-examine Nyx using high quality abundance data from the Third Data Release of the GALAH Survey (Buder et al., 2020, submitted to MNRAS, arXiv:2011.02505) and the Sixteenth Data Release of the APOGEE Survey (Ahumada, 2020). Looking at the abundances of key elements from these catalogs we find that Nyx in fact shows the same abundance patterns as the -rich thick disk of the Milky Way, and that the abundances considered by Necib et al. (2020) — key evidence for an accretion origin — were likely erroneous or misinterpreted. We therefore conclude that Nyx is probably simply a group of stars at the tail of the thick disk’s kinematic distribution.
2 Data
In this work we make use of abundance data from three large stellar spectroscopic surveys: GALAH DR3, APOGEE DR16, and RAVE-on. The Third Data Release (DR3; Buder et al., 2020) of the GALactic Archaeology with HERMES (GALAH) survey presents stellar parameters, radial velocities, and up to 30 elemental abundances for 588,571 stars, derived from optical spectra at a typical resolution of . We use the following criteria to select a reliable data set for this project: (i) GALAH flag (no problems noted in the input data, reduction, or analysis); (ii) GALAH flag (no problems noted in the iron abundance determination); (iii) GALAH flag when considering an individual abundance [x/Fe]; (iv) GALAH flag (an average signal-to-noise in the red camera greater than 30 per pixel).
The Sixteenth Data Release (DR16; Ahumada, 2020) of the Apache Point Observatory Galactic Evolution Experiment (APOGEE) contains stellar parameters, radial velocities, and abundances of up to 20 elements for more than 430,000 stars, derived from -band infrared spectra at a resolution of . We only considered stars with , indicating no problems in the data, reduction, or analysis, and when considering an individual abundance [x/Fe], we required .
The Fifth Data Release (DR5; Kunder et al., 2017) of The Radial Velocity Experiment (RAVE) covers 457,588 stars, with medium-resolution spectra ( in the region of the Ca triplet (Å). In this work we use results from the RAVE-on catalog (Casey et al., 2017), as this was the catalog primarily used by Necib et al. (2020). RAVE-on is a re-analysis of RAVE DR5 spectra using the data-driven “label transfer” method of The Cannon (Ness et al., 2015), and provides stellar parameters and abundances of up to seven elements per star (O, Mg, Al, Si, Ca, Fe, and Ni). Here we required (indicating that stars meet data quality constraints), and for stars with multiple spectra, we chose the one with the highest signal-to-noise ratio.
For all surveys, the Galactic orbital properties of the stars were calculated in the same manner as used to construct the GALAH DR3 kinematic value-added catalog. This is described in detail in the GALAH DR3 data release paper (Buder et al., 2020). Briefly, we used galpy, with the McMillan2017 potential (McMillan, 2017) and the values kpc and (Gravity Collaboration et al., 2019). We set in keeping with Reid & Brunthaler (2004) and Schönrich et al. (2010). For APOGEE and RAVE stars, we used the radial velocities reported by each survey, and distances from Bailer-Jones et al. (2018). For GALAH we used DR3 radial velocities and distances from the age and mass value-added catalog, which primarily incorporated distances found by the Bayesian Stellar Parameters estimator (bstep; described in Sharma et al., 2018), which calculates distance simultaneously with mass, age, and reddening.
3 Abundances for candidate Nyx stars
The primary aim of our work is to compare Nyx in the context of abundance space to the disk and halo of our Galaxy, as well as to nearby dwarf galaxies. Necib et al. (2020) provided a catalogue of 232 high confidence members of Nyx found in Gaia DR2. We cross-matched these stars with each of the surveys described in Section 2 using their Gaia DR2 source_id and found that 18 Nyx stars had results in GALAH DR3, 19 stars were in RAVE-on, and 9 stars were included in APOGEE DR16. There is one Nyx star in common between all three surveys. We used the velocities and orbital properties of the stars to confirm that the Nyx stars in GALAH, APOGEE and RAVE-on are kinematically unbiased relative to the overall Nyx population. The orbital properties we calculate are consistent with those in Necib et al. (2020); namely, these stars are on prograde orbits (i.e., ) with relatively large orbital energies for disk stars.
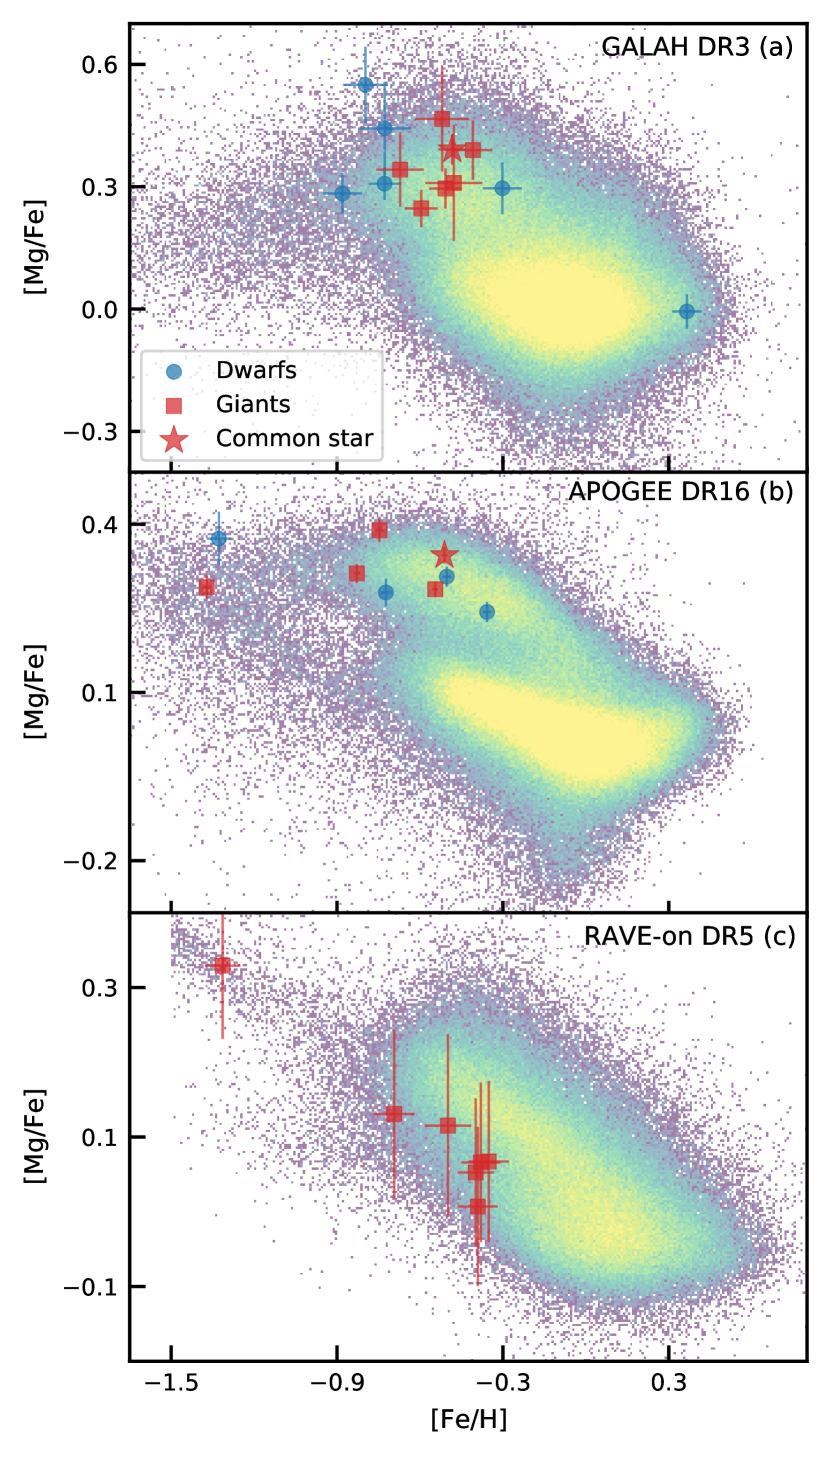
Figure 1 shows the - plane as recovered by each of the three surveys. The background distribution includes all stars that meet the relevant quality flags. Each survey is dominated by the disk of the Milky Way, so we see the canonical -poor and -rich populations. On each panel we highlight the Nyx stars, as identified by Necib et al. (2020), that were observed by each survey. Those stars are split almost evenly between dwarfs and giants (defined as and , respectively); however, none of the RAVE-on dwarfs (nor the one common star, which is a giant) had abundances measured by RAVE-on.
The key piece of evidence that Necib et al. (2020) used to conclude that the Nyx stars were accreted was the abundance data from RAVE-on. They noted that the stars had low for their metallicity, compared to thick disk abundances collated from the literature by Venn et al. (2004). This direct comparison between RAVE-on and literature abundances could be problematic, but from Figure 1c, we would draw the same conclusion as Necib et al. (2020) — in the RAVE-on data set, the Nyx stars are systematically lower in for their metallicity compared to the -rich thick disk.
However, the sample of Nyx stars in the GALAH DR3 and APOGEE DR16 catalogues sit squarely in the region of the - plane occupied by the thick disk. We only show here, but this consistency with the thick disk also holds for other elements. There are a number of potential explanations for this, including the possibility of a systematic issue with RAVE-on abundances, or, alternatively, the existence of a large intrinsic scatter in Nyx, with the subset of stars with RAVE-on abundances coincidentally all having low .
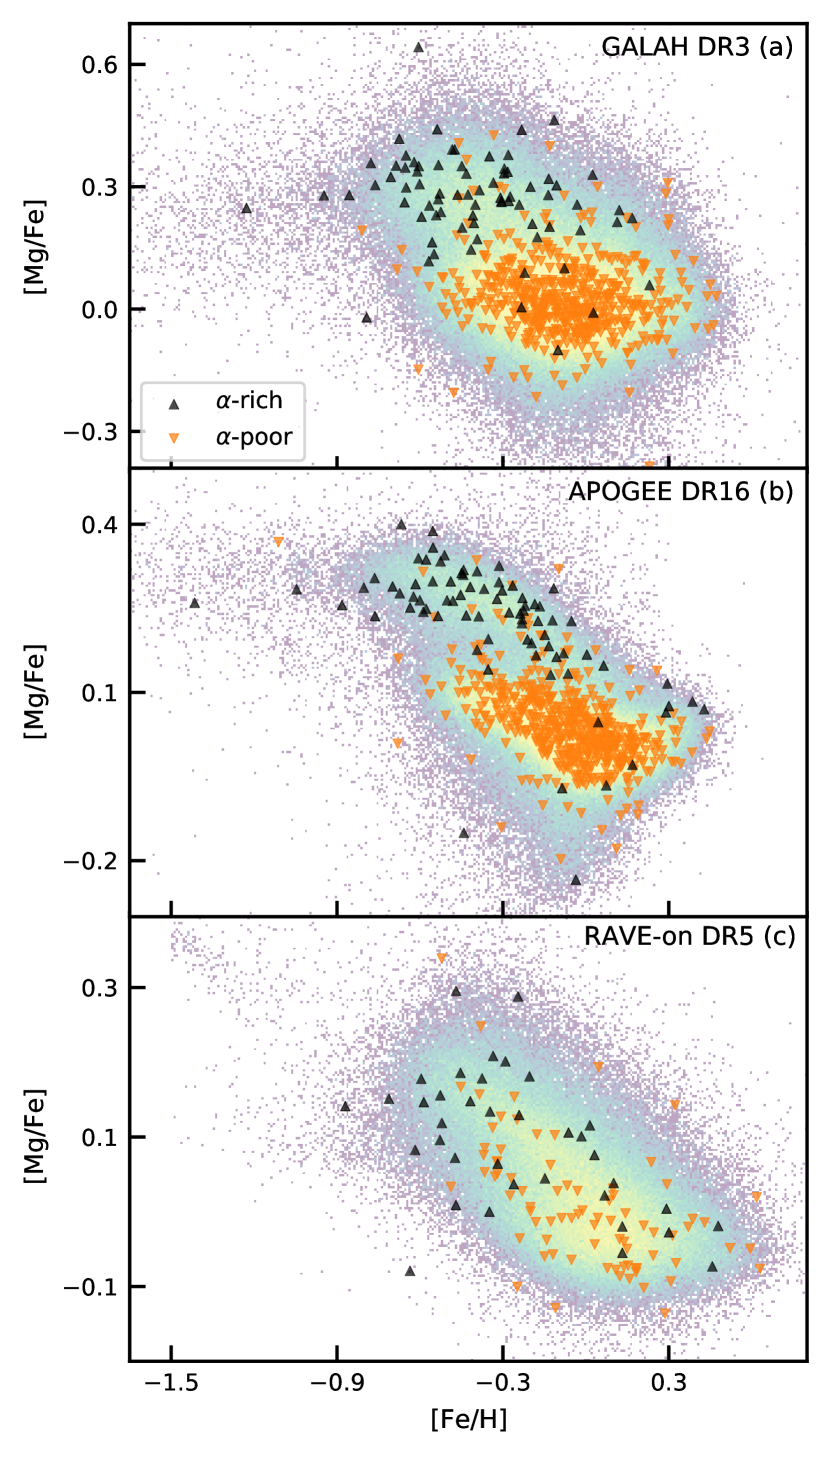
Pursuing this first explanation, we look at the 891 stars in common between GALAH DR3, APOGEE DR16, and RAVE-on (as identified by Gaia DR2 source_id). It should be noted that direct comparison of the surveys requires us to compare results from GALAH and APOGEE, which have broad spectral coverage at high resolution (), to RAVE, whose spectra covered only the calcium triplet region at moderate resolution (). There are also differences in data quality between the surveys due to differing target selection choices and instrumental capabilities. The common stars have data quality that is typical for RAVE, while they are somewhat low in signal to noise for APOGEE.
As we are comparing values across three different surveys, it is important to look for systematic differences. For the stars in common between APOGEE and RAVE-on, average values from the former are larger than those from the latter by dex, while for GALAH compared to RAVE-on, the mean difference is dex. Finally, for APOGEE compared to GALAH, the average difference is only dex.
In Figure 2 we show the distributions of the 891 common stars as recovered by each of the surveys. These are classified as -rich or -poor based on their GALAH ratios, splitting at . Since magnesium is an element, we would expect the ratio determined by each survey to correlate well with the overall abundance. This is true for GALAH and APOGEE, where there is a clear distinction in between the -rich and -poor populations. The RAVE-on results show that, while there is a rough correspondence between our selection and (i.e., the mean for the -rich stars is higher than the mean for the -poor stars), there is no obvious high/low distinction, with both the -rich and -poor groups covering the full range in .
From this comparison of the abundance values reported by the three surveys we can say that it is more likely that the RAVE-on abundances used in Necib et al. (2020) are imprecise than it is that Nyx has a large intrinsic range, and that the RAVE-on Nyx stars are all by coincidence at the low end of the distribution. Nyx stars in both the GALAH and APOGEE data sets have high measured abundances that correlate well with high ratios, and those abundances do not show a large scatter.
4 Comparing Nyx to the thick disk and to dwarf galaxies
The principal aim of the GALAH and APOGEE surveys is to measure the abundances of elements from different stellar nucleosynthetic channels. Here we use these abundance sets to consider the similarity between Nyx stars and those from different formation environments.
In particular, we consider the accretion origin hypothesis from Necib et al. (2020) by comparing Nyx stars to those from nearby dwarf galaxies. The differing galactic chemical enrichment timelines of dwarf galaxies (e.g., Venn et al., 2004) mean that the stars that form in them show different abundance patterns to those of in situ Milky Way stars, e.g., lower [/Fe] abundance ratios than Milky Way stars at a given metallicity. In this section we compare the Nyx stars to samples of stars from three dwarf galaxies: the Sagittarius Dwarf, the Large Magellanic Cloud, and the accretion remnant Gaia-Enceladus. Noting that in Figure 1 the Nyx stars look broadly like the thick disk, given their similarly high ratios, we also select a sample of thick disk stars using kinematic (rather than abundance) criteria for comparison.
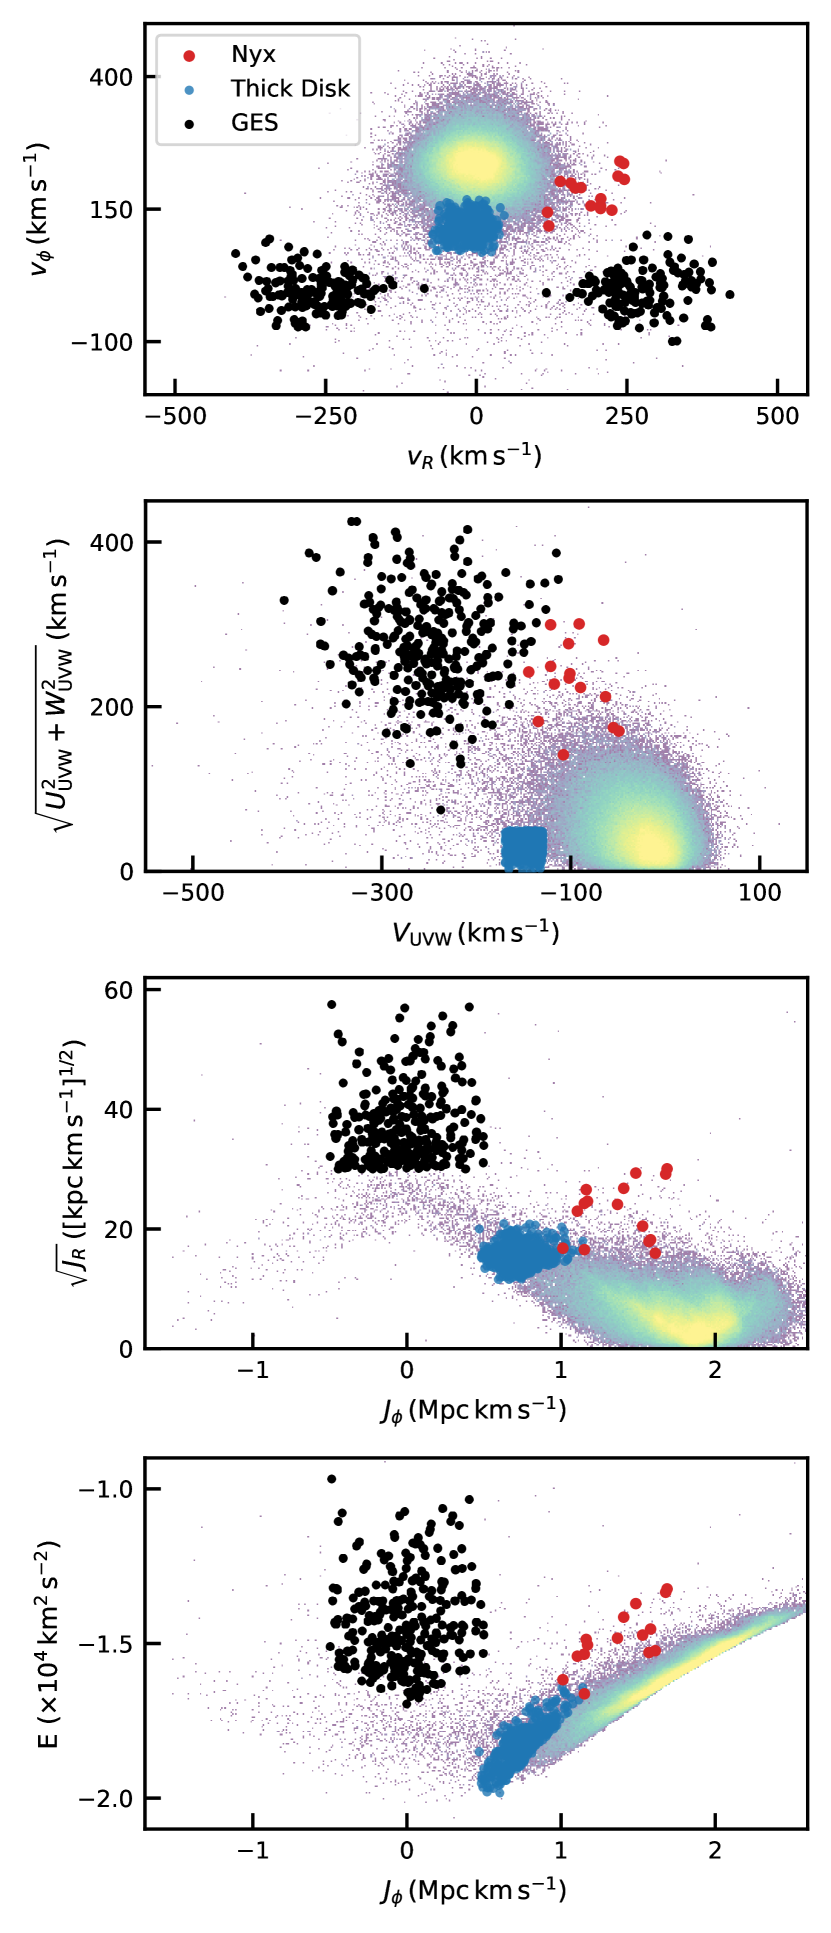
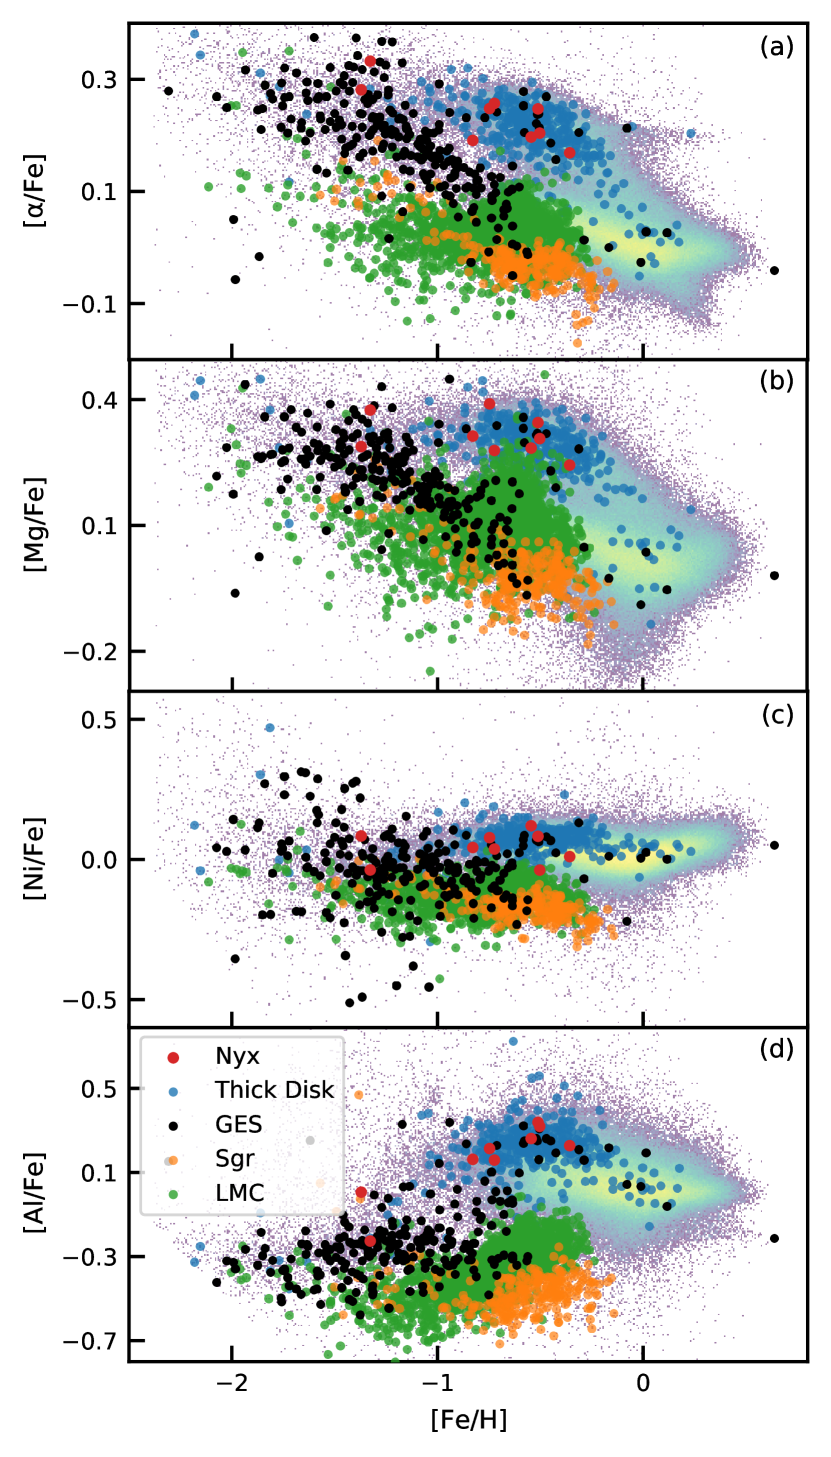
The LMC and Sagittarius stars were identified in APOGEE DR16 by first taking all stars with programname set to “magclouds” or “sgr” and then applying further selections on radial velocity and proper motion. For Sagittarius we then required RV and proper motions within 0.5 of ; for the LMC we required RV and proper motions within 1.0 of . The Gaia-Enceladus stars were selected from both surveys using angular momentum, , and radial action, , (as employed by Feuillet et al., 2020; Simpson et al., 2020), requiring and . The - selection identifies many of the same stars as the different kinematic selections used by other researchers, but it has the advantage of less contamination from non-Gaia-Enceladus stars. We selected comparison sets of thick disk stars from both GALAH and APOGEE for comparison against Nyx by taking all stars in the region of Toomre space with and (, well away from the Nyx stars.
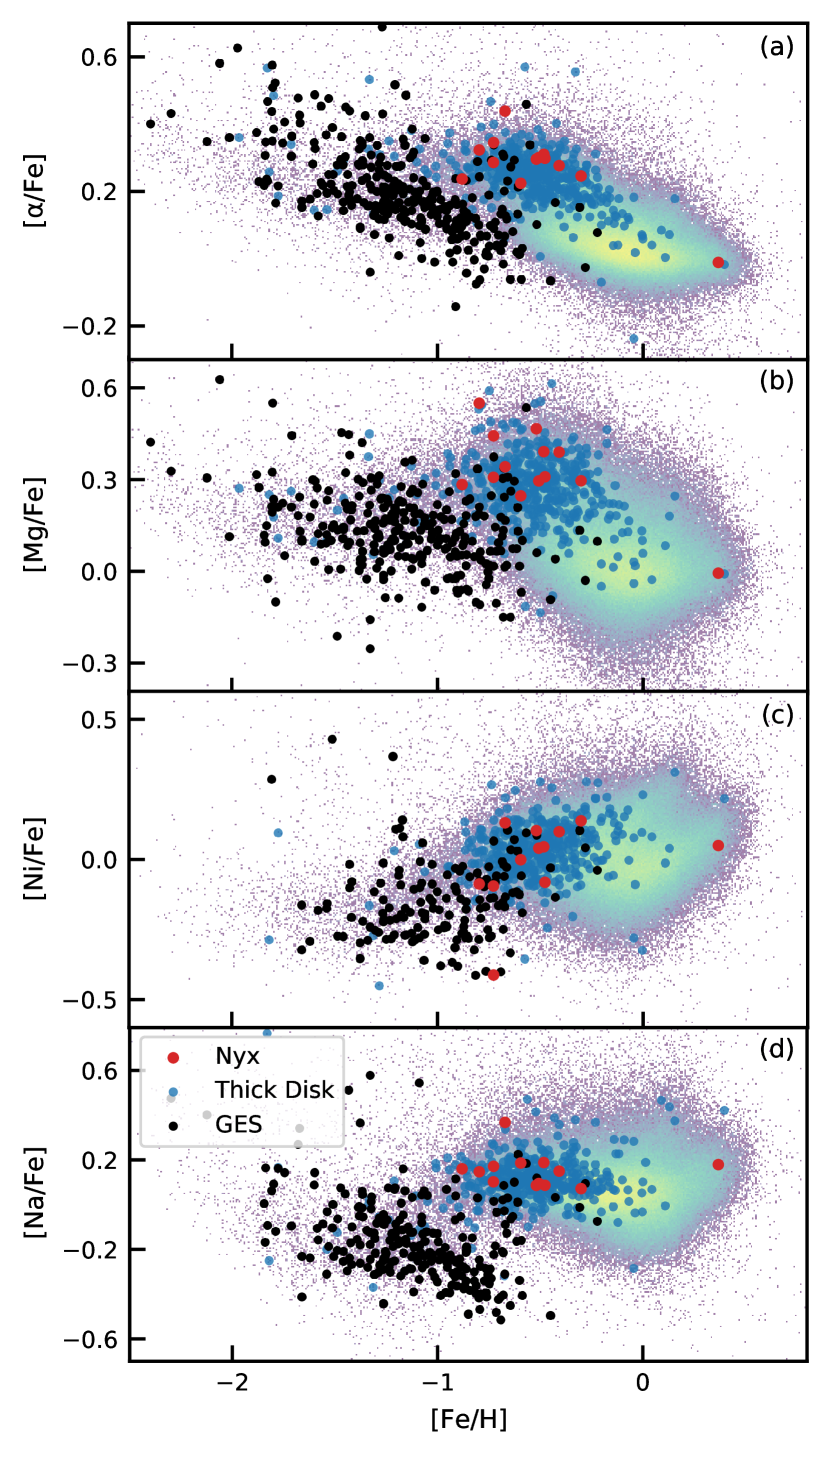
Figure 3 shows the orbital properties of all GALAH stars within 3 kpc of the Sun in four different kinematic coordinate systems. The Nyx stars are shown as red dots, and they clearly do have orbital properties at the extreme end of the distribution of disk stars. The thick disk comparison stars are plotted as blue dots, and the Gaia-Enceladus stars are black dots. This figure shows that the three groups can be more clearly separated in some kinematic spaces than others. In Figure 4, we follow the overall GALAH sample and these three specific groups through the , , , and abundance planes; the latter two elements are chosen because they represent different stellar nucleosynthetic channels. Here we see that the Gaia-Enceladus stars have markedly lower abundances of all these elements at a given metallicity than the thick disk and the Nyx stars. Conversely, the abundances of the Nyx stars are indistinguishable from those of the thick disk stars, although they are on the edge of the orbital parameter distribution.
Figure 5 makes a similar comparison using APOGEE data, and adds stars from Sagittarius (in orange) and the LMC (in green), as those fall within the larger volume explored by that survey. The stellar abundance patterns of these additional galaxies are broadly similar to the Gaia-Enceladus stars and different from the overall APOGEE data set, the thick disk, and Nyx. Again, Nyx is more similar to the thick disk in these abundance planes than it is to dwarf galaxies. What overlap there is with the dwarf galaxies is confined to the two most metal-poor stars, in the regime where the dwarf galaxies are difficult to distinguish from the Galactic halo, and where stars from Gaia-Enceladus appear coincident with the metal-poor end of the thick disk (although it is not clear if this latter feature represents real overlap in abundance space or simply thick disk contamination in the Gaia-Enceladus selection).
5 Discussion
We would expect stars accreted from dwarf galaxies to be distinct from stars formed in situ in a number of their properties. They should be clustered in orbital parameter space, and possibly spatially; their age distribution should be truncated at the time of accretion, with no younger stars; and their abundance patterns should show key signs of their low-mass formation environment, with a lower minimum metallicity and faster depletion, as well as potentially other chemical signatures (e.g., Das et al., 2020; Nissen & Schuster, 2011; Casey et al., 2014a, b). In this study we investigated those aspects of the Nyx stream using data from GALAH DR3, APOGEE DR16, and RAVE-on.
We calculated orbital parameters for the Nyx stars in all three spectroscopic data sets, confirming that the Nyx stars are kinematically similar to each other, and have higher orbital energies and eccentricities than typical thick disk stars.
Necib et al. (2020) find that the colour-magnitude diagram of their stars is consistent with an older isochrone. They take this as support for Nyx being a discrete accreted population, as the Milky Way’s disk displays a range of ages. However, age is not a strong discriminant in this case because the thick disk has been shown to be relatively old (e.g., Gilmore & Wyse, 1985; Sharma et al., 2019, 2020), with a mean age of 10 Gyr, which is consistent with the age inferred for Nyx by Necib et al. (2020).
Comparing abundances for Nyx stars from GALAH, APOGEE, and RAVE-on against the thin and thick disk and dwarf galaxies, we find no elemental abundance differences between Nyx stars and thick disk stars – whether selected kinematically or by – in the GALAH DR3 and APOGEE DR16 data sets. While RAVE-on abundances do appear to show a difference, we consider the RAVE-on abundances potentially unreliable for these stars, as there is no clear distinction between high and low stars in our Figure 2 or in the underlying RAVE dataset (Wojno et al., 2016).
Analysis of abundance information from both the GALAH and APOGEE surveys shows that members of the LMC, Sagittarius and Gaia-Enceladus can be distinguished rather well from Galactic thin and thick disk populations – and from each other – across the space of elements, iron-peak elements, and light odd-Z elements. In that same abundance space, the kinematically-identified Nyx members are entirely consistent with the thick disk. We note that comparisons of this sort are best done within surveys rather than across surveys, as this tends to minimize the effects of differing systematics in the underlying data and their analysis.
The disk and spiral structure of the Milky Way display large-scale perturbations which have been attributed to close interactions with satellites such as the Sagittarius dwarf (e.g., Antoja et al., 2018; Bland-Hawthorn et al., 2019), so it is entirely plausible that Nyx could be the result of an accretion event even if its constituent stars formed in situ in the Milky Way (see, e.g., Jean-Baptiste et al., 2017). Previous studies have revealed the existence of a comparatively metal-rich ( ) stellar population with abundances typical of the thick disk on prograde halo-like orbits in the solar neighborhood (e.g., Bonaca et al., 2017; Belokurov et al., 2020); the latter work postulated that this population consisted of Galactic proto-disk stars heated by a massive merger event, and noted that Nyx could simply be part of this larger population.
Hence Nyx likely joins other kinematically identified streams such as Aquarius (Williams et al., 2011; Casey et al., 2014b) and Hercules (Famaey et al., 2005; Bensby et al., 2007) in the category of stellar substructures created by past interactions or secular processes, and not the debris of a disrupted satellite.
References
- Ahumada (2020) Ahumada, R. 2020, ApJS, 21, doi: 10.3847/1538-4365/ab929e
- Antoja et al. (2018) Antoja, T., Helmi, A., Romero-Gómez, M., et al. 2018, Nature, 561, 360, doi: 10.1038/s41586-018-0510-7
- Astropy Collaboration et al. (2018) Astropy Collaboration, Price-Whelan, A. M., Sipőcz, B. M., et al. 2018, AJ, 156, 123, doi: 10.3847/1538-3881/aabc4f
- Bailer-Jones et al. (2018) Bailer-Jones, C. A. L., Rybizki, J., Fouesneau, M., Mantelet, G., & Andrae, R. 2018, AJ, 156, 58, doi: 10.3847/1538-3881/aacb21
- Belokurov et al. (2018) Belokurov, V., Erkal, D., Evans, N. W., Koposov, S. E., & Deason, A. J. 2018, MNRAS, 478, 611, doi: 10.1093/mnras/sty982
- Belokurov et al. (2020) Belokurov, V., Sanders, J. L., Fattahi, A., et al. 2020, MNRAS, 494, 3880, doi: 10.1093/mnras/staa876
- Bensby et al. (2007) Bensby, T., Oey, M. S., Feltzing, S., & Gustafsson, B. 2007, ApJ, 655, L89, doi: 10.1086/512014
- Binney (2012) Binney, J. 2012, MNRAS, 426, 1324, doi: 10.1111/j.1365-2966.2012.21757.x
- Bland-Hawthorn et al. (2019) Bland-Hawthorn, J., Sharma, S., Tepper-Garcia, T., et al. 2019, MNRAS, 486, 1167, doi: 10.1093/mnras/stz217
- Bonaca et al. (2017) Bonaca, A., Conroy, C., Wetzel, A., Hopkins, P. F., & Kereš, D. 2017, ApJ, 845, 101, doi: 10.3847/1538-4357/aa7d0c
- Bovy (2015) Bovy, J. 2015, ApJS, 216, 29, doi: 10.1088/0067-0049/216/2/29
- Bovy & Rix (2013) Bovy, J., & Rix, H.-W. 2013, ApJ, 779, 115, doi: 10.1088/0004-637X/779/2/115
- Buder et al. (2018) Buder, S., Asplund, M., Duong, L., et al. 2018, MNRAS, 478, 4513, doi: 10.1093/mnras/sty1281
- Buder et al. (2020) Buder, S., Sharma, S., Kos, J., et al. 2020, arXiv e-prints, arXiv:2011.02505. https://arxiv.org/abs/2011.02505
- Bullock & Johnston (2005) Bullock, J. S., & Johnston, K. V. 2005, ApJ, 635, 931, doi: 10.1086/497422
- Casey et al. (2014a) Casey, A. R., Keller, S. C., Da Costa, G., Frebel, A., & Maunder, E. 2014a, ApJ, 784, 19, doi: 10.1088/0004-637X/784/1/19
- Casey et al. (2014b) Casey, A. R., Keller, S. C., Alves-Brito, A., et al. 2014b, MNRAS, 443, 828, doi: 10.1093/mnras/stu1031
- Casey et al. (2017) Casey, A. R., Hawkins, K., Hogg, D. W., et al. 2017, ApJ, 840, 59, doi: 10.3847/1538-4357/aa69c2
- Caswell et al. (2020) Caswell, T. A., Droettboom, M., Lee, A., et al. 2020, Matplotlib/Matplotlib v3.1.3, Zenodo, doi: 10.5281/ZENODO.3633844
- Das et al. (2020) Das, P., Hawkins, K., & Jofré, P. 2020, MNRAS, 493, 5195, doi: 10.1093/mnras/stz3537
- Famaey et al. (2005) Famaey, B., Jorissen, A., Luri, X., et al. 2005, A&A, 430, 165, doi: 10.1051/0004-6361:20041272
- Fattahi et al. (2019) Fattahi, A., Belokurov, V., Deason, A. J., et al. 2019, MNRAS, 484, 4471, doi: 10.1093/mnras/stz159
- Feuillet et al. (2020) Feuillet, D. K., Feltzing, S., Sahlholdt, C. L., & Casagrande, L. 2020, MNRAS, 497, 109, doi: 10.1093/mnras/staa1888
- Freeman & Bland-Hawthorn (2002) Freeman, K., & Bland-Hawthorn, J. 2002, ARA&A, 40, 487, doi: 10.1146/annurev.astro.40.060401.093840
- Gaia Collaboration et al. (2016) Gaia Collaboration, Prusti, T., de Bruijne, J. H. J., et al. 2016, A&A, 595, A1, doi: 10.1051/0004-6361/201629272
- Gaia Collaboration et al. (2018) Gaia Collaboration, Brown, A. G. A., Vallenari, A., et al. 2018, A&A, 616, A1, doi: 10.1051/0004-6361/201833051
- Gilmore & Wyse (1985) Gilmore, G., & Wyse, R. F. G. 1985, AJ, 90, 2015, doi: 10.1086/113907
- Gravity Collaboration et al. (2019) Gravity Collaboration, Abuter, R., Amorim, A., et al. 2019, A&A, 625, L10, doi: 10.1051/0004-6361/201935656
- Harris et al. (2020) Harris, C. R., Millman, K. J., van der Walt, S. J., et al. 2020, Nature, 585, 357, doi: 10.1038/s41586-020-2649-2
- Haywood et al. (2018) Haywood, M., Di Matteo, P., Lehnert, M. D., et al. 2018, ApJ, 863, 113, doi: 10.3847/1538-4357/aad235
- Helmi et al. (2018) Helmi, A., Babusiaux, C., Koppelman, H. H., et al. 2018, Nature, 563, 85, doi: 10.1038/s41586-018-0625-x
- Helmi et al. (1999) Helmi, A., White, S. D. M., de Zeeuw, P. T., & Zhao, H. 1999, Nature, 402, 53, doi: 10.1038/46980
- Hunter (2007) Hunter, J. D. 2007, Computing in Science & Engineering, 9, 90, doi: 10.1109/MCSE.2007.55
- Jean-Baptiste et al. (2017) Jean-Baptiste, I., Di Matteo, P., Haywood, M., et al. 2017, A&A, 604, A106, doi: 10.1051/0004-6361/201629691
- Johnston et al. (2008) Johnston, K. V., Bullock, J. S., Sharma, S., et al. 2008, ApJ, 689, 936, doi: 10.1086/592228
- Kunder et al. (2017) Kunder, A., Kordopatis, G., Steinmetz, M., et al. 2017, AJ, 153, 75, doi: 10.3847/1538-3881/153/2/75
- McMillan (2017) McMillan, P. J. 2017, MNRAS, 465, 76, doi: 10.1093/mnras/stw2759
- Myeong et al. (2018a) Myeong, G. C., Evans, N. W., Belokurov, V., Sanders, J. L., & Koposov, S. E. 2018a, ApJ, 863, L28, doi: 10.3847/2041-8213/aad7f7
- Myeong et al. (2018b) —. 2018b, ApJ, 856, L26, doi: 10.3847/2041-8213/aab613
- Necib et al. (2019) Necib, L., Lisanti, M., Garrison-Kimmel, S., et al. 2019, ApJ, 883, 27, doi: 10.3847/1538-4357/ab3afc
- Necib et al. (2020) Necib, L., Ostdiek, B., Lisanti, M., et al. 2020, Nature Astronomy, doi: 10.1038/s41550-020-1131-2
- Ness et al. (2015) Ness, M., Hogg, D. W., Rix, H. W., Ho, A. Y. Q., & Zasowski, G. 2015, ApJ, 808, 16, doi: 10.1088/0004-637X/808/1/16
- Nissen & Schuster (2011) Nissen, P. E., & Schuster, W. J. 2011, A&A, 530, A15, doi: 10.1051/0004-6361/201116619
- Reid & Brunthaler (2004) Reid, M. J., & Brunthaler, A. 2004, ApJ, 616, 872, doi: 10.1086/424960
- Schönrich et al. (2010) Schönrich, R., Binney, J., & Dehnen, W. 2010, MNRAS, 403, 1829, doi: 10.1111/j.1365-2966.2010.16253.x
- SciPy 1.0 Contributors et al. (2020) SciPy 1.0 Contributors, Virtanen, P., Gommers, R., et al. 2020, Nature Methods, doi: 10.1038/s41592-019-0686-2
- Sharma et al. (2020) Sharma, S., Hayden, M. R., & Bland-Hawthorn, J. 2020, arXiv:2005.03646 [astro-ph]. https://arxiv.org/abs/2005.03646
- Sharma et al. (2018) Sharma, S., Stello, D., Buder, S., et al. 2018, MNRAS, 473, 2004, doi: 10.1093/mnras/stx2582
- Sharma et al. (2019) Sharma, S., Stello, D., Bland-Hawthorn, J., et al. 2019, MNRAS, 490, 5335, doi: 10.1093/mnras/stz2861
- Sheffield et al. (2012) Sheffield, A. A., Majewski, S. R., Johnston, K. V., et al. 2012, ApJ, 761, 161, doi: 10.1088/0004-637X/761/2/161
- Simpson et al. (2020) Simpson, J. D., Martell, S. L., Buder, S., et al. 2020, arXiv:2011.02659 [astro-ph]. https://arxiv.org/abs/2011.02659
- Taylor (2005) Taylor, M. B. 2005, in Astronomical Society of the Pacific Conference Series, Vol. 347, Astronomical Data Analysis Software and Systems XIV, ed. P. Shopbell, M. Britton, & R. Ebert, 29
- Tolstoy et al. (2009) Tolstoy, E., Hill, V., & Tosi, M. 2009, ARA&A, 47, 371, doi: 10.1146/annurev-astro-082708-101650
- Venn et al. (2004) Venn, K. A., Irwin, M., Shetrone, M. D., et al. 2004, AJ, 128, 1177, doi: 10.1086/422734
- Williams et al. (2011) Williams, M. E. K., Steinmetz, M., Sharma, S., et al. 2011, ApJ, 728, 102, doi: 10.1088/0004-637X/728/2/102
- Wojno et al. (2016) Wojno, J., Kordopatis, G., Steinmetz, M., et al. 2016, MNRAS, 461, 4246, doi: 10.1093/mnras/stw1633