A Tip of the Red Giant Branch Distance of Mpc to the Dark Matter Deficient Galaxy NGC 1052–DF2 from 40 Orbits of Hubble Space Telescope Imaging
Abstract
The large and diffuse galaxies NGC 1052–DF2 and NGC 1052–DF4 have been found to have very low dark matter content and a population of luminous globular clusters. Accurate distance measurements are key to interpreting these observations. Recently, the distance to NGC 1052–DF4 was found to be Mpc by identifying the tip of the red giant branch (TRGB) in 12 orbits of Hubble Space Telescope (HST) Advanced Camera for Surveys (ACS) imaging. Here we present 40 orbits of HST ACS data for NGC 1052–DF2 and use these data to measure its TRGB. The TRGB is readily apparent in the color-magnitude diagram. Using a forward model that incorporates photometric uncertainties, we find a TRGB magnitude of mag. The inferred distance is Mpc, consistent with the to the bright elliptical galaxy NGC 1052. The new HST distance rules out the idea that some of NGC 1052–DF2’s unusual properties can be explained if it were at Mpc; instead, it implies that the galaxy’s globular clusters are even more luminous than had been derived using the previous distance . The distance from NGC 1052–DF2 to NGC 1052–DF4 is well-determined at Mpc, significantly larger than the virial diameter of NGC 1052. We discuss the implications for formation scenarios of the galaxies and for the external field effect, which has been invoked to explain the intrinsic dynamics of these objects in the context of modified Newtonian dynamics.
1 Introduction
First identified by Karachentsev et al. (2000), NGC 1052–DF2 is a galaxy in one of the fields of the Dragonfly Nearby Galaxies Survey (Merritt et al., 2016) that was found to be unusual in follow-up observations (van Dokkum et al., 2018b; Cohen et al., 2018). At the distance of the bright elliptical galaxy NGC 1052 (D = Mpc; Blakeslee et al., 2001; Tonry et al., 2001; Tully et al., 2013), NGC 1052–DF2 has the stellar mass () and metallicity of typical dwarf galaxies (Fensch et al., 2019) but a large size ( kpc), placing it in the regime of ultra-diffuse galaxies (van Dokkum et al., 2015). Furthermore, it has a large population of luminous globular clusters (GCs) and a very low velocity dispersion of km s-1 (see van Dokkum et al., 2018b; Danieli et al., 2019; Emsellem et al., 2019; Shen et al., 2020). In 2019, a second galaxy in the same field, NGC 1052–DF4, was found to have properties almost identical to those of NGC 1052–DF2 (van Dokkum et al., 2019; Danieli et al., 2020; Shen et al., 2020). The velocity dispersions of both galaxies ( km s-1; van Dokkum et al., 2018b, 2019; Danieli et al., 2019; Emsellem et al., 2019) are consistent with expectations from the stellar mass alone ( km s-1), suggesting that the galaxies have no or very little dark matter (van Dokkum et al., 2018b). van Dokkum et al. (2018b) claimed that NGC 1052–DF2 invalidates alternative gravity theories such as Modified Newtonian Dynamics (MOND; Milgrom, 1983), as the (apparent) effects of dark matter should be observed in all galaxies in these models.
The unusual nature of NGC 1052–DF2 and NGC 1052–DF4 sparked a vigorous debate in the community. Whereas initial concerns focused on the velocity dispersion measurements (see, e.g., Martin et al., 2018), more recently the distance to the galaxies has become a point of contention. Their radial velocities of km s-1 and km s-1, their projected proximity to the elliptical galaxy NGC 1052, and surface brightness fluctuations in 1+1 orbit F814W and F606W HST images all indicate a distance of Mpc for the galaxies (van Dokkum et al., 2018b; Blakeslee & Cantiello, 2018; Cohen et al., 2018; van Dokkum et al., 2018a). However, Trujillo et al. (2019) and Monelli & Trujillo (2019) derived distances of 13–14 Mpc to both NGC 1052–DF2 and NGC 1052–DF4 from the same 1+1 orbit HST images, claiming that individual red giant stars were detected and associating a sharp increase in the number of detections around mag to be the tip of the red giant branch (TRGB). A distance of 13 Mpc is one way to resolve or alleviate the unusual properties of NGC 1052–DF2 and NGC 1052–DF4: for a smaller distance, the galaxies are no longer “ultra-diffuse”, the GCs are smaller and less luminous, and the dark matter fraction increases.
Accurate distances to both galaxies are important for deriving accurate luminosities, sizes, and masses – of both the galaxies themselves and their GCs – and are also key to placing constraints on alternative gravity models such as MOND. As pointed out by Kroupa et al. (2018), Müller et al. (2019a), Haghi et al. (2019), and Famaey et al. (2018), van Dokkum et al. (2018b) had neglected an essential element of MOND, namely the external field effect (EFE). The EFE, unique to MOND, causes a low mass galaxy in orbit around a massive galaxy to have a lower velocity dispersion than the same object in isolation. Thus, the low velocity dispersions of NGC 1052–DF2 and NGC 1052–DF4 may be consistent with the expectations from MOND if both galaxies are in close proximity to NGC 1052 (Kroupa et al., 2018).
Accurate distances can be obtained using HST data that are much deeper than the 1+1 orbits in the Cohen et al. (2018) study, as the TRGB measurement is sensitive to the depth and quality cuts used in the analysis. In a single F814W orbit, individual red giants can only be detected out to Mpc, right where Trujillo et al. (2019) and Monelli & Trujillo (2019) claimed to see the onset of the giant branch. With orbits, the TRGB can be detected out to 20 Mpc. Danieli et al. (2020) obtained the needed data for NGC 1052–DF4, and using a total of 8 orbits in F814W and 4 orbits in F606W measured a TRGB distance to that galaxy of Mpc. Here, we present even deeper HST imaging (20+20 orbits in F814W and F606W) for NGC 1052–DF2. We unambiguously identify the TRGB and derive a distance to the galaxy that should be definitive. Furthermore, we derive an accurate and (as it turns out) interesting relative distance between NGC 1052–DF2 and NGC 1052–DF4, making use of the fact that nearly all systematic uncertainties cancel in the comparison. This relative distance provides important context for the presence of tidal features in the outskirts of the galaxies (Montes et al., 2020) and constrains the EFE. Vega magnitudes are used throughout this paper.
2 HST/ACS Data
NGC 1052–DF2 was observed with HST ACS in Cycle 27 (program 15851), split in three epochs from June 2020 to September 2020. We obtained 19 orbits each in the F814W and F606W filters. Adding these data to the previous 1 orbit each in the same filters obtained in 2017 (program 14644), the total exposure time is 41840s in F814W and 40560s in F606W. NGC 1052–DF2 was placed near the center of the field of view, varying the exact location between visits to ensure relatively uniform coverage despite the chip gap.
Within each orbit, four exposures were taken in a four-point dither pattern to remove cosmic rays, identify hot pixels, and dither over the chip gap. The STScI standard pipeline was used to perform bias and dark current subtraction, flat-fielding, and CTE correction on individual exposures and produces calibrated flc files. We used the TweakReg utility in DrizzlePac to align the 160 flc files. We used AstroDrizzle to remove astrometric distortion, correct sky background, and flag cosmic-rays in the aligned images, resulting in a combined (drc) image in the F814W and F606W filters.
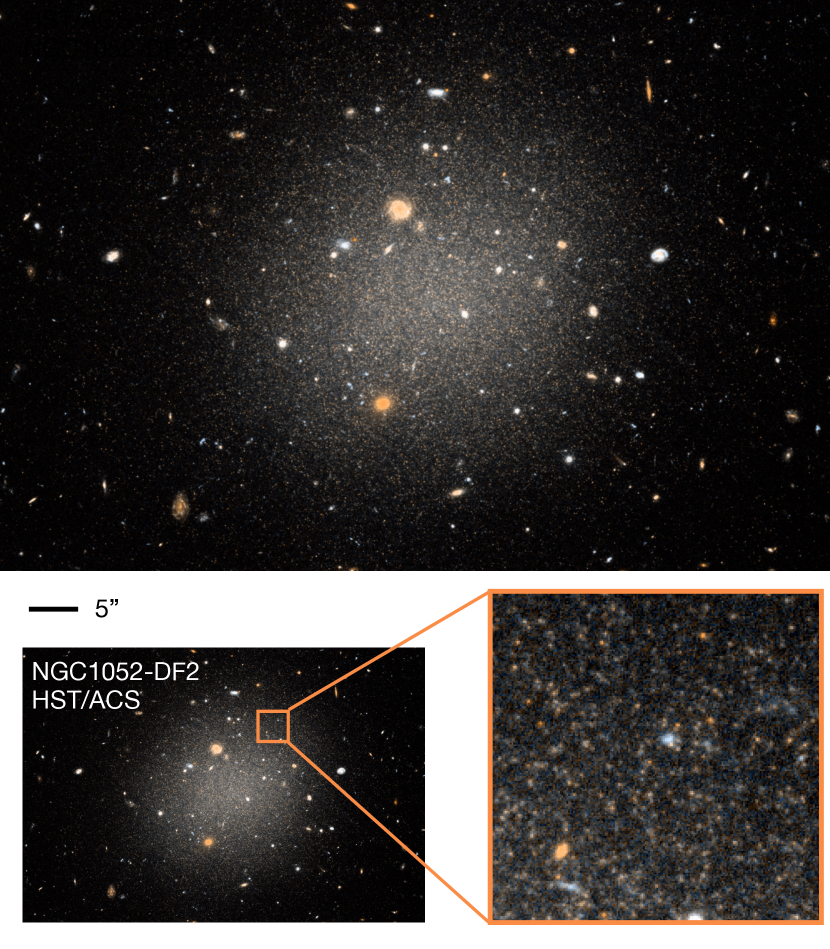
Figure 1 shows a color image of NGC 1052–DF2 generated from the drizzled images. In these deep data, the galaxy is well-resolved. The yellow points are resolved red giants which appear among a background of bluer unresolved subgiants and main sequence stars. We do not confirm the “Maybe Stream” proposed in Abraham et al. (2018). The clumps of luminous giants that make up the apparent feature are detected but we do not find an accompanying excess of fainter stars that would be present if it were a tidal feature. We conclude that the apparent feature is a chance alignment of background galaxies and Poisson fluctuations in the number of bright stars.
3 Photometry
The software package DOLPHOT111http://americano.dolphinsim.com/dolphot/ (Dolphin, 2000) was used to carry out photometry on individual flc files from the STScI ACS pipeline. Before running the photometry detection step, all 160 flc files as well as the deepest drizzled image (which combines 80 stacked F814W flc images with a total exposure time of 41840s) were ran through several preparation steps using the DOLPHOT/ACS pre-processing tools. We used the acsmask routine to mask bad columns and hot pixels, the splitgroups routine to split each flc into two chips, and the calcsky routine to determine the background value in each image.
DOLPHOT analyzed all 160 flc images simultaneously, using the deep combined drc image as reference. Stars were detected in each image by fitting Tiny Tim PSFs (Krist, 1995) and the fluxes were measured separately in the F814W and F606W frames. Although this approach is memory-intensive for a deep data set like ours, the fact that no resampling is required has the advantages of preserving the noise properties and optimally using the information in the flc files. The key DOLPHOT parameters were: the sky fitting parameter FitSky=2, the aperture radius RAper=3, and Force1=1 which forces the sources to be fitted as stars. These parameters were identical to the values used for the TRGB analysis on NGC 1052–DF4 (Danieli et al., 2020), and we refer to that paper for further information.
Stars were selected from the raw DOLPHOT output catalog with a set of quality cuts. The photometry catalog was corrected for Galactic extinction: 0.04 mag in F814W and 0.06 mag in F606W (Schlafly & Finkbeiner, 2011). Objects were considered to be reliable stars only if they pass all of the following criteria: signal-to-noise ratio in F814W and in F606W; object-type , which corresponds to good star or faint star); sharpness parameter and ; crowding parameter and . Compared to the criteria in Danieli et al. (2020), we increased the signal-to-noise threshold in F606W to match our deeper data.
Characterization of the systematic and random uncertainties in the photometry is an important component of the analysis, as they have an impact on the apparent location of the TRGB (see, e.g. Makarov et al., 2006). In DOLPHOT, stellar PSFs (using models appropriate for their individual positions) can be placed in the HST data, and then analyzed alongside the actual stars. The scatter and systematic offset in the magnitudes of injected and recovered stars can then be taken into account in the measurement of the TRGB location. We ran DOLPHOT photometry on 180,000 artificial stars. The stars uniformly sampled the magnitude range and the color range , and were distributed between and . The artificial stars were injected into individual flc images and analyzed with the same methodology as the real stars.
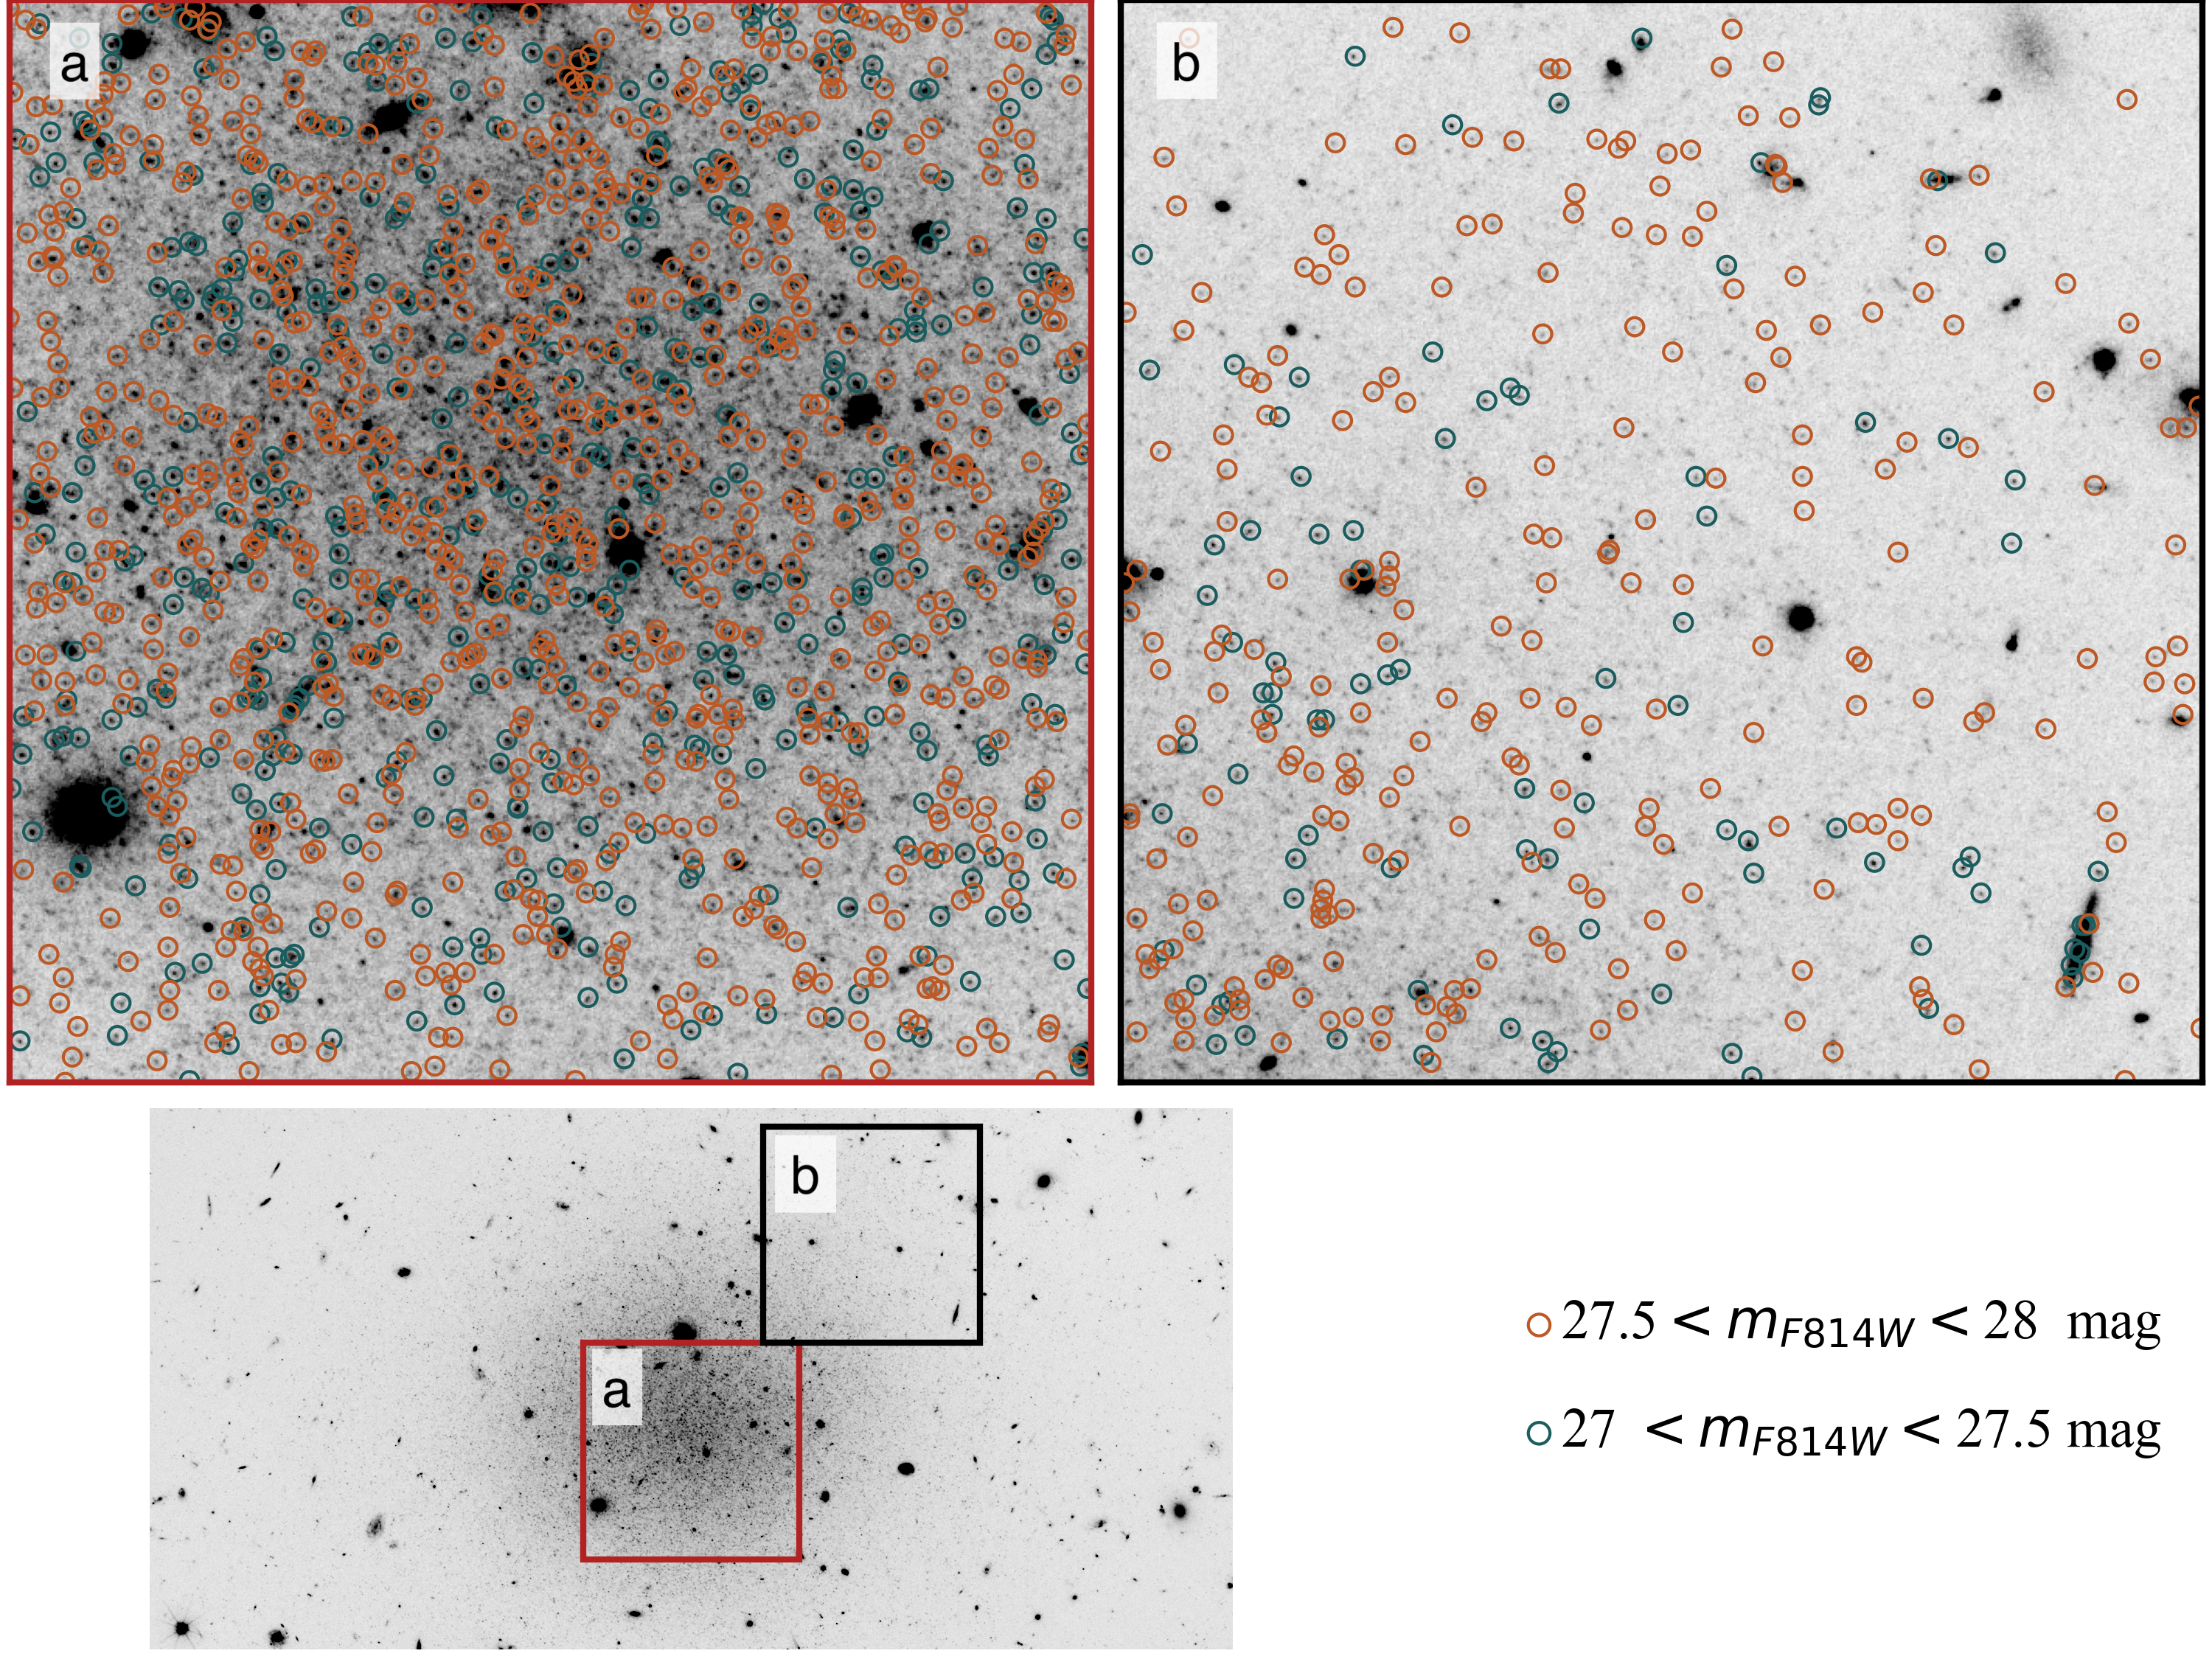
Figure 2 shows examples of stellar detections in two regions of NGC 1052–DF2. There is a sharp increase in the number of sources fainter than 27.5 mag, times more sources detected with than with .
4 TRGB Distance
4.1 Color-magnitude Diagrams
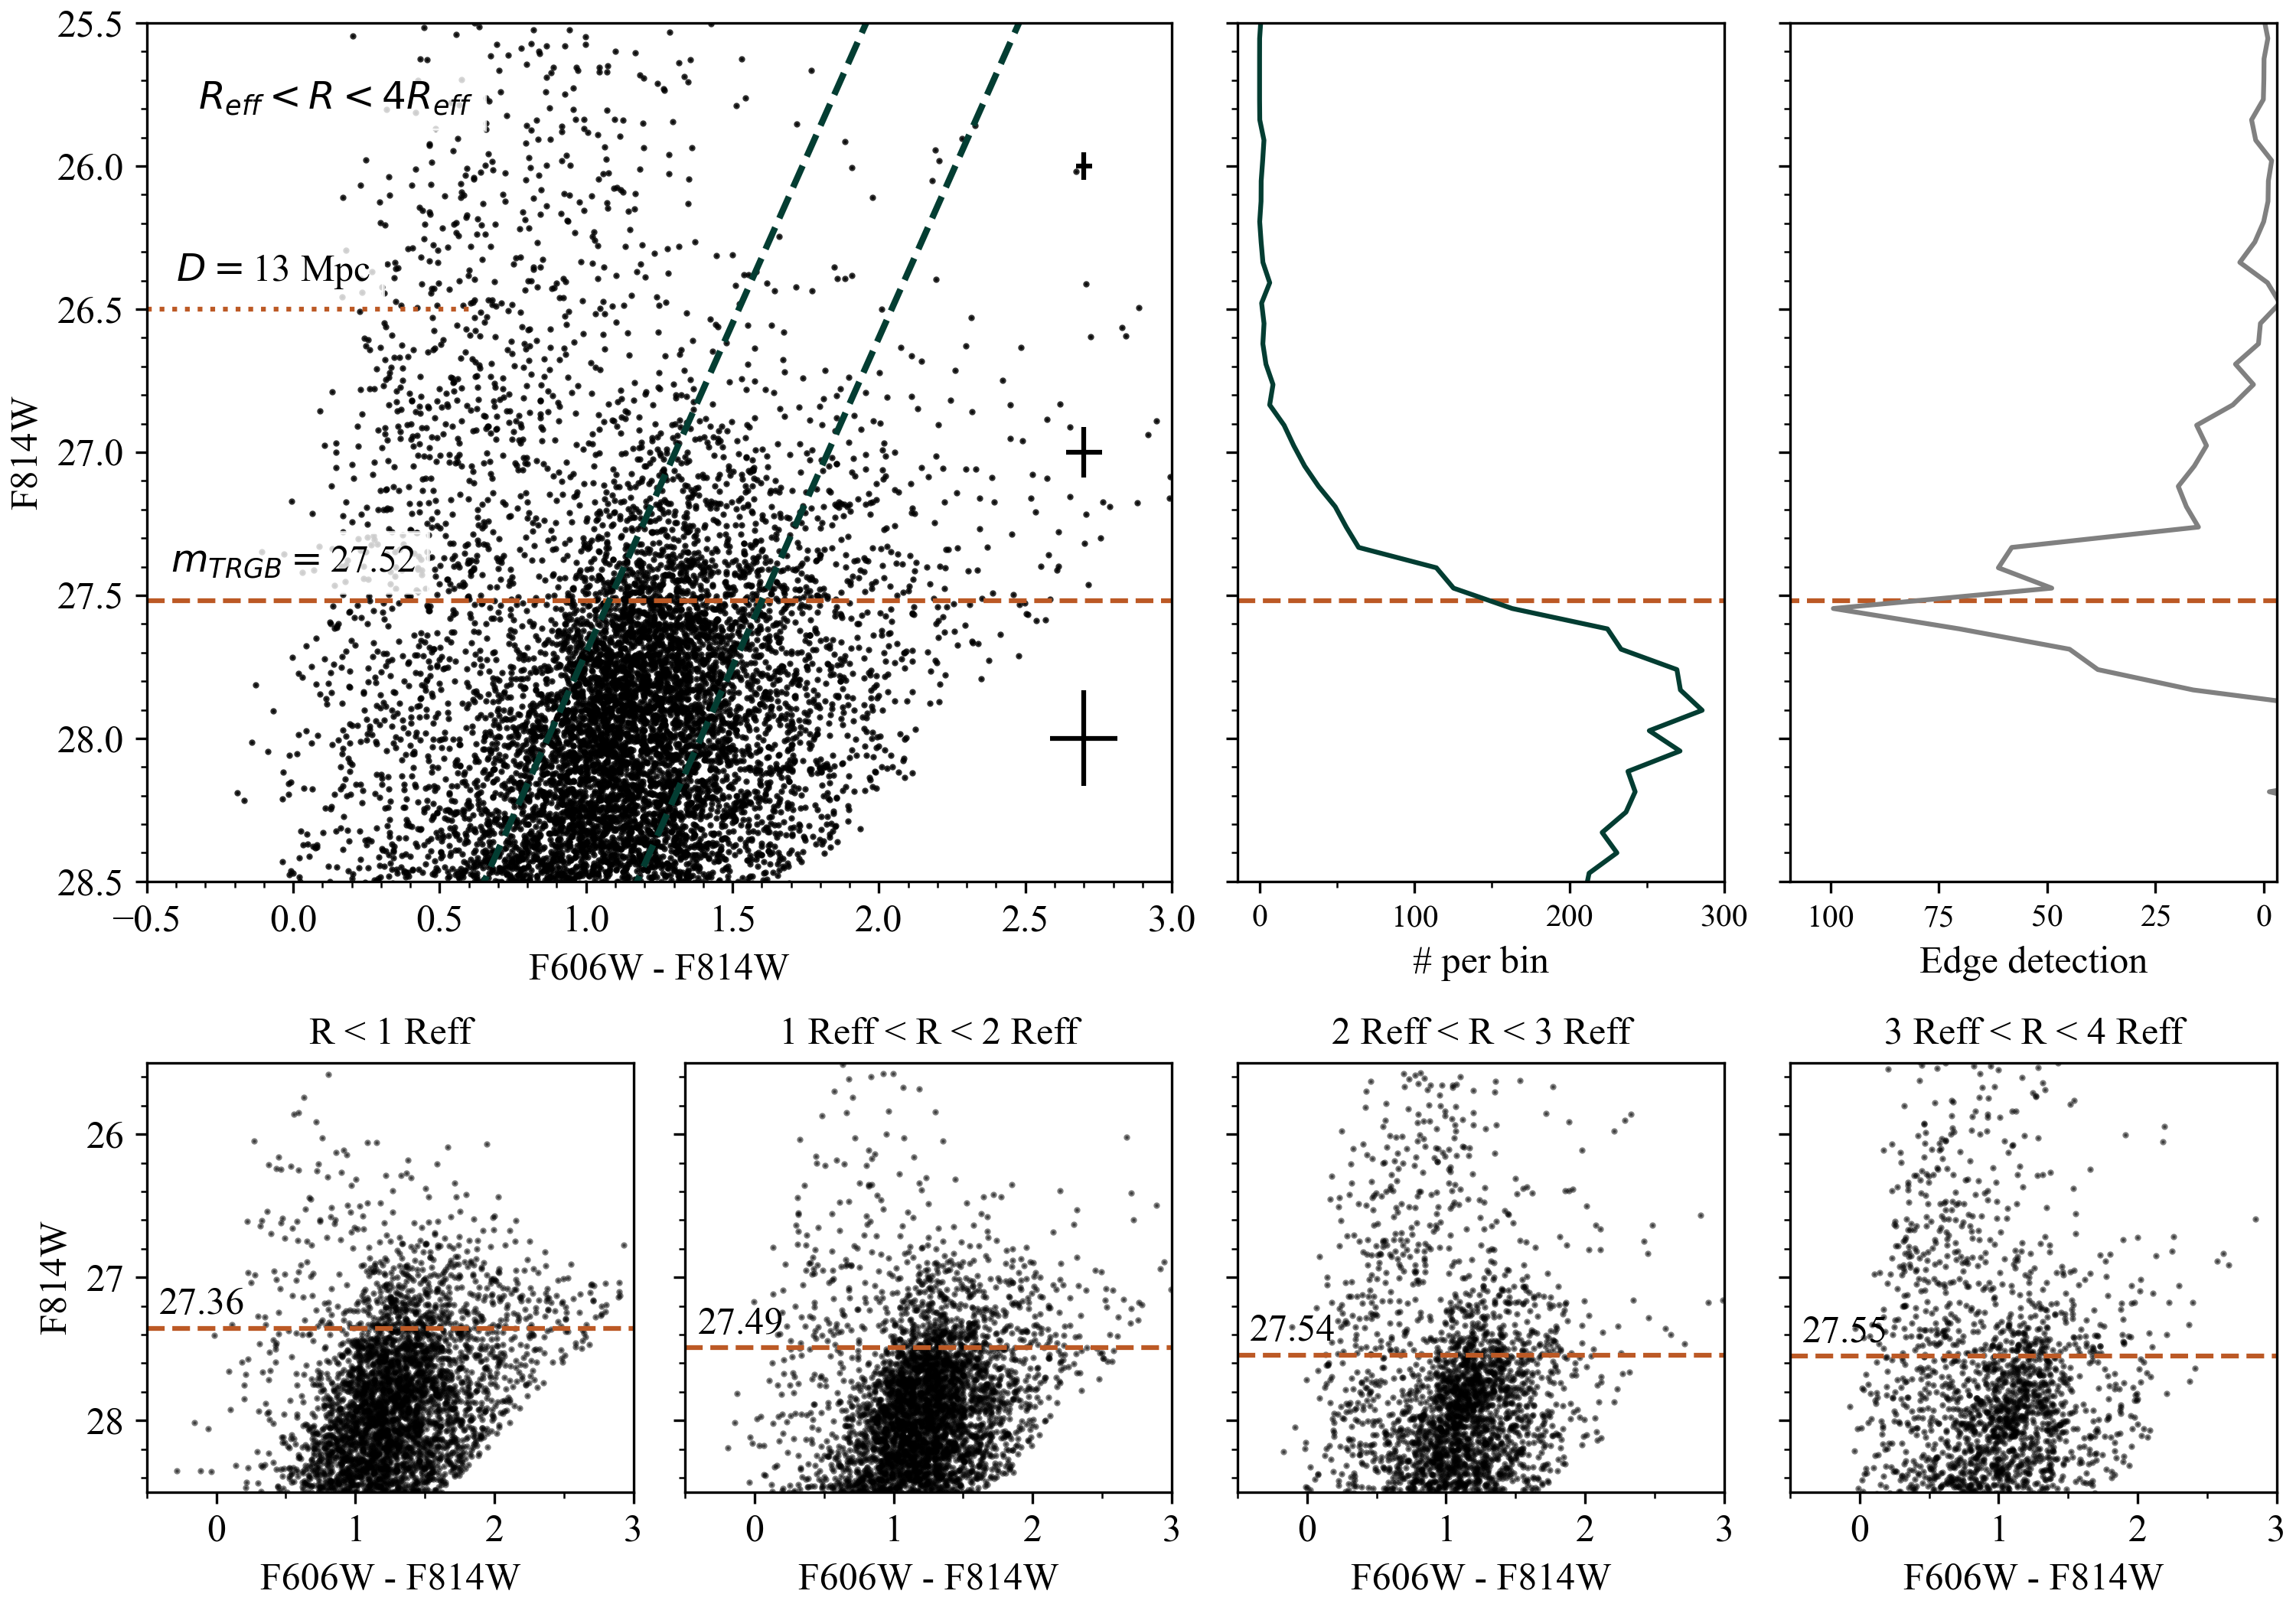
Color–magnitude diagrams (CMDs) were constructed for different radial regions in NGC 1052–DF2 and shown in Figure 3. The main panel and the bottom panels of Figure 3 all show the characteristic sharp decrease in the number of stars around mag, indicating the onset of the red giant branch (RGB)222The photometry catalog is available at https://github.com/zilishen/NGC1052-DF2-public.. The F814W luminosity is shown in the middle panel, as measured within the following color range: . This luminosity function is fitted in § 4.2 and § 4.3 to identify the location of the TRGB, which is then used to derive the distance.
4.2 Edge Detection
The first method, edge detection, measures the TRGB from the first–derivative of the binned and smoothed luminosity function of the RGB and asymptotic giant branch (AGB) stars. This method was previously used for NGC 1052–DF4 (Danieli et al., 2020) and numerous other galaxies (e.g., Lee et al., 1993). Advantages of the method include that it is straightforward to compare results to other studies and other galaxies, and that it provides a robust measurement of the approximate location of the TRGB. We caution, however, that it does not take measurement uncertainties into account.333In practice, the systematic bias (see § 4.3) causes the TRGB to appear fainter than the true value, whereas photometric scatter causes it to appear brighter. The -band luminosity function was smoothed with a Gaussian kernel with a standard deviation of 0.4 mag and then filtered with a Sobel kernel. The response to the Sobel kernel peaks where the slope of the luminosity function reaches a maximum, and this is the location of the TRGB. The peak location was identified by performing a Gaussian fit to the response function to determine its center and width.
The TRGB measurement we obtained with the edge-detection method is shown in Figure 3. The main result came from a sample in the radial region (upper left panel). We measure an extinction–corrected TRGB magnitude of mag for NGC 1052–DF2, where the uncertainty is the width of the Gaussian fit to the peak. The CMD in each radial bin from to and the corresponding measured TRGB magnitude is shown in the bottom row of Figure 3. The measurement is consistent within error bars across all radial bins, even in the innermost region where crowding is most severe and many initial source detections are rejected by the quality cuts. We infer that the TRGB is located near , and not near as was found by Trujillo et al. (2019).
4.3 Forward Modeling
The second method to measure the TRGB is fitting the luminosity functions. We derived a precise TRGB location with the same forward modeling procedure as Danieli et al. (2020). Briefly summarized, this approach generates an intrinsic luminosity function of a stellar population by drawing stars from an isochrone according to a initial mass function, then perturbs the photometry of individual stars according to the (magnitude-dependent) photometric errors to obtain an observed luminosity function, and finally adds contaminating stars according to a simple linear distribution in magnitude. As the of the is not very sensitive to age or metallicity, the results are not sensitive to the details of the stellar population synthesis model; following Danieli et al. (2020) we used an old (10 Gyr), metal-poor ([Fe/H] ) stellar population.
The two parameters, the TRGB magnitude and the contamination, were varied to search for a best fit to the F814W luminosity function.
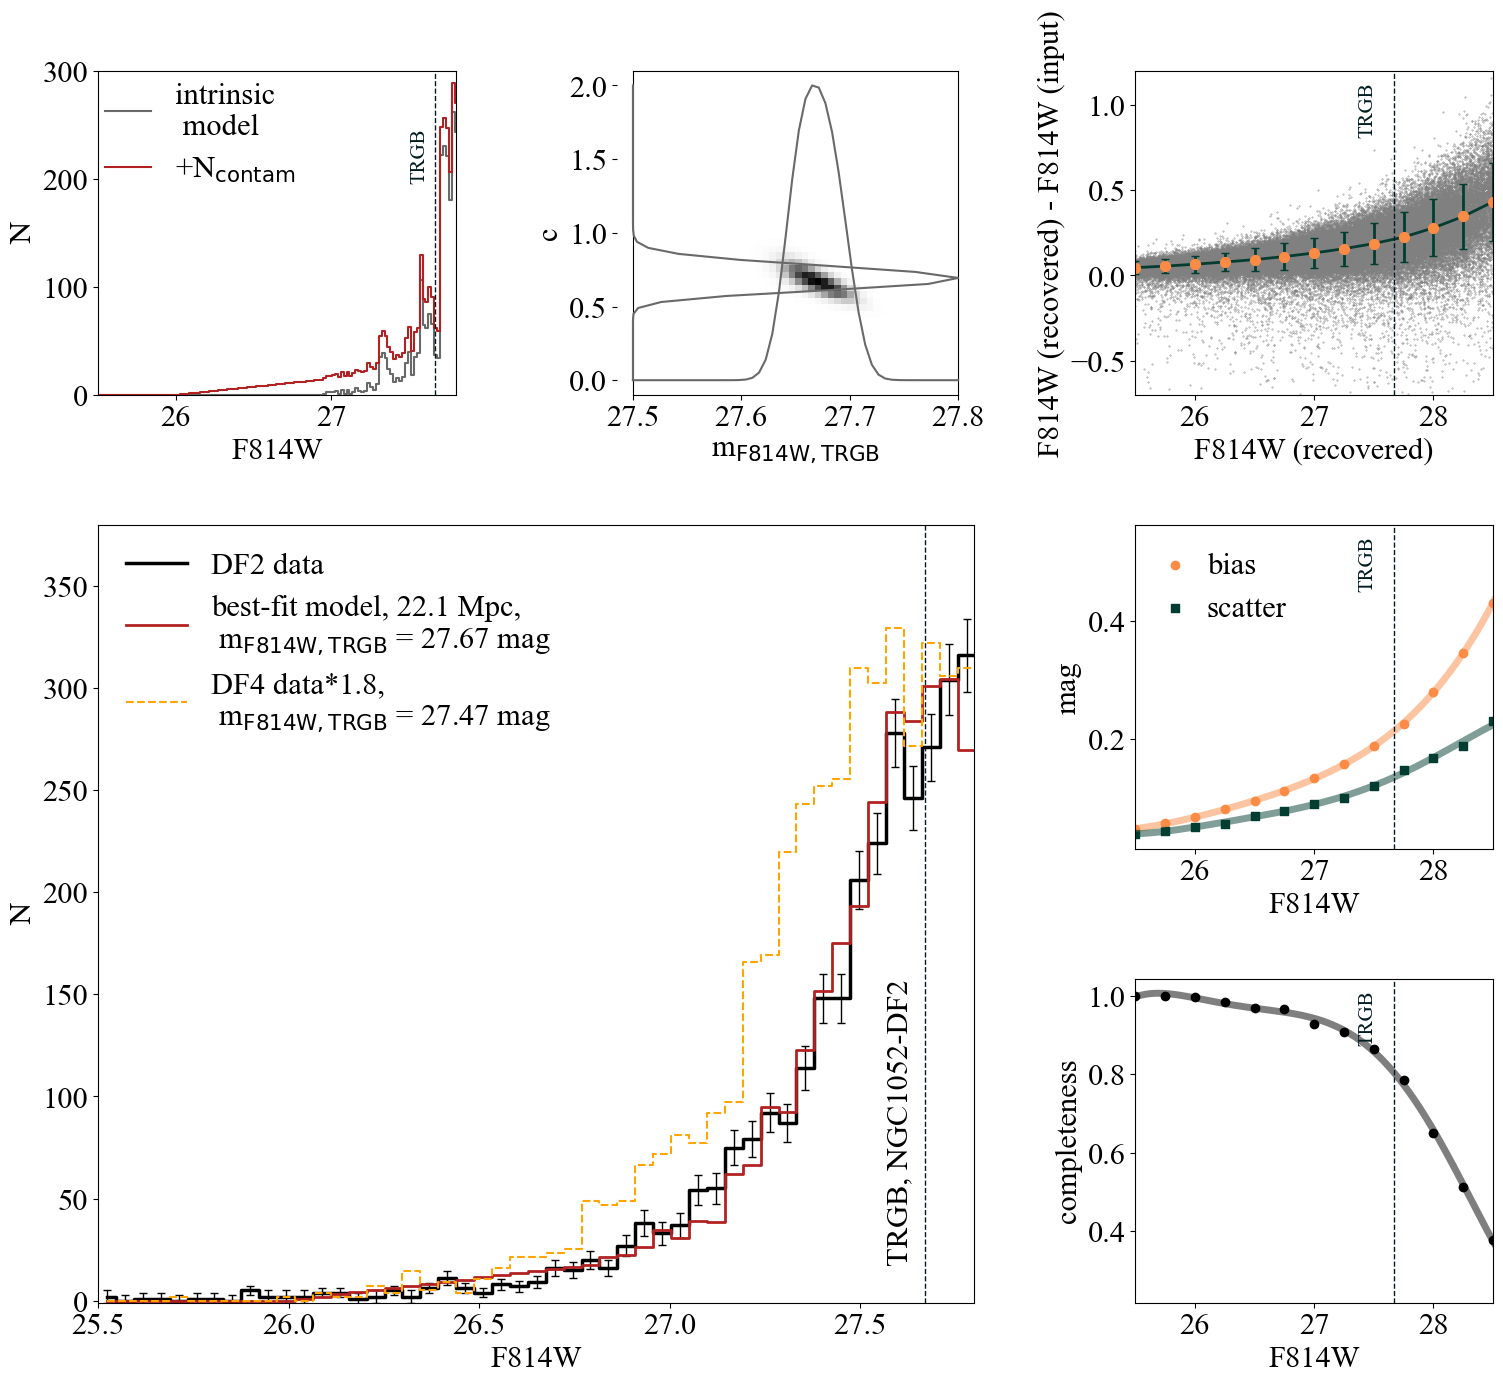
The photometric errors were characterized using artificial star tests (see § 3). Compared to the input magnitudes of injected artificial stars, the recovered magnitudes show a systematic offset (“bias”), scatter, and incompleteness. These results are shown in the right panels of Figure 4. The bias and scatter increase towards fainter magnitudes and completeness decreases as expected for fainter stars. At , the recovered magnitudes are 0.21 mag fainter than the input magnitudes, with a scatter of 0.13 mag, and the completeness fraction is 80%. Compared to the photometric errors of Danieli et al. (2020), our deeper data show a similar level of bias and smaller scatter. We find a mag fainter 50%-completeness limit, as expected from the increase from 8 orbits to 20 orbits in the F814W filter.
Starting from stars drawn from a MIST isochrone (Dotter, 2016; Choi et al., 2016), the magnitude of each star was shifted by the parameterized bias and perturbed by a random sample of the scatter. Possible contamination was parametrized by a linear function
| (1) |
for stars fainter than 26 mag, and no contamination for stars brighter than 26 mag. After adding the contamination, the luminosity function was multiplied by the completeness fraction.
This model was fitted to the stars that satisfy the quality and color cuts and are located between and from the center. The observed F814W luminosity function had 50 magnitude bins from 25.50 to 27.85 mag, and the best fit was found by minimizing while varying and . We obtained a best-fit TRGB magnitude of , where the error is the statistical uncertainty that encompasses 68% of the marginal likelihood. The reduced of the best fit was 1.8. The best-fit model is shown in the main panel of Figure 4. The fit is excellent, as it reproduces not only the overall increase in the number of stars at faint magnitudes but also several of the individual small “steps” in the luminosity function. To our knowledge, our previous paper on NGC 1052–DF4 was the first application of this method; the fact that it is able to fit small scale features in the luminosity function may warrant wider application of this technique.
The TRGB magnitude derived with forward modeling is fainter than that determined from edge detection. This difference of mag, previously seen in Danieli et al. (2020), is due to the effect of photometric scatter on the apparent location of the TRGB. Many more stars scatter from faint to bright magnitudes than the other way, due to the steep increase in the luminosity function around the TRGB. We adopt the forward modeling value as the best measurement. The final result is therefore (random) (systematic).
From the TRGB measurement, we derive the distance to NGC 1052–DF2. The zero-point calibration of the absolute magnitude of the TRGB depends on the color (Rizzi et al., 2007):
| (2) |
For a TRGB median color of 1.25 mag, as measured from the color-magnitude diagram, the absolute magnitude of the TRGB is mag, with a standard uncertainty of 0.07 mag (McQuinn et al., 2017).
The errors on the final distance measurement have three components: the statistical uncertainty from the fitting procedure (0.02 mag), the systematic uncertainty from the artificial star tests (bias of 0.1 mag), and finally the zero-point calibration uncertainty of 0.07 mag. Adding these in quadrature leads to a final distance modulus of mag and a distance of (statistical) (systematic) (calibration) Mpc.
5 Discussion
In this study, we used extremely deep HST/ACS data to measure the TRGB distance to NGC 1052–DF2. Our best fit TRGB distance is Mpc. This distance to NGC 1052–DF2 is just consistent with, but slightly larger than, two previous independent measurements of surface brightness fluctuations (SBF): Mpc (van Dokkum et al., 2018a) and Mpc (Blakeslee & Cantiello, 2018). The TRGB distance should be more reliable than the SBF distances, as SBF absolute magnitudes are more model-dependent (see, e.g., Greco et al., 2021). The new distance measurement to NGC 1052–DF2 is consistent with the distance to the elliptical galaxy NGC 1052 within the uncertainties (19.4 – 21.4 Mpc; Blakeslee et al., 2001; Tonry et al., 2001; Tully et al., 2013), . The new HST data rule out a distance to the galaxy of 13.6 Mpc, which had been proposed by Trujillo et al. (2019). The original single orbit HST data were not deep enough to identify individual RGB stars at a distance of 20 Mpc, and as shown in van Dokkum et al. (2018a), the apparent feature at in those data can be reproduced by a combination of blends and AGB stars.
Our new distance confirms the unusual dark matter and GC properties of NGC 1052–DF2, and the slight upward revision of the distance to NGC 1052–DF2 makes its luminous GCs even more spectacular. The previously reported luminosities of the GCs in van Dokkum et al. (2018c) and Shen et al. (2020) assumed a distance of 20 Mpc. With the revised distance, all of the GCs in NGC 1052–DF2 are 0.2 mag more luminous than previously reported. The GC luminosity function now peaks at , even further from the canonical value of (see Rejkuba, 2012).
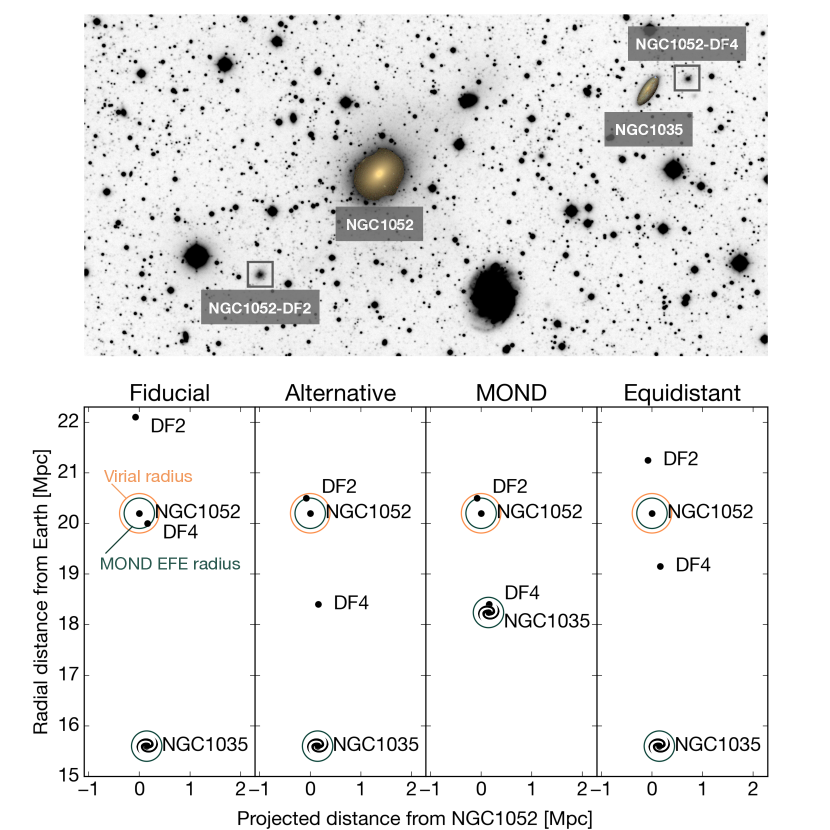
Interestingly, the TRGB distance to NGC 1052–DF2 is 2.1 Mpc larger than the TRGB distance to NGC 1052–DF4 (20.0 1.6 Mpc, Danieli et al., 2020) and this difference is statistically significant. Data for these two galaxies both come from HST/ACS and are analyzed with the same methods, using the same forward modeling assumptions and the same absolute magnitude calibration. The only difference between the two measurements is the depth of the data: in the luminosity function filter (F814W), there are 8 orbits for NGC 1052–DF4 and 20 orbits for NGC 1052–DF2. This translates into a difference in the amplitude of the photometric errors of mag. We conservatively assume that the uncertainty in the relative TRGB magnitudes of the two galaxies is the quadratic sum of the forward modeling fit uncertainties and this 0.05 mag difference. This leads to a distance difference of Mpc. Figure 5 displays a visual summary of these findings. The relative distance from NGC 1052–DF2 to NGC 1052–DF4 is kept fixed in the bottom panels.
As shown in the bottom panels of Figure 5, the relative distance between NGC 1052–DF2 and NGC 1052–DF4 is significantly larger than the virial diameter of NGC 1052, which means that at least one of the galaxies is not bound to the group. The virial diameter is kpc (Forbes et al., 2019), the error comes from their reported velocity dispersion uncertainty. NGC 1052–DF2 is perhaps the most likely candidate for being unbound, given its large radial velocity compared to other galaxies in the group (van Dokkum et al., 2018b), and the fact that its distance is only just consistent with that of NGC 1052.
Previously proposed formation scenarios for dark matter deficient galaxies fall broadly into two categories: formation within the group and tidal stripping. The first group of theories includes formation in the chaotic gas-rich environment of the assembling central galaxy (van Dokkum et al., 2018b) and formation in a QSO outflow from the central black hole in NGC 1052. In particular, it has been proposed that a high-velocity collision between two gas-rich dwarfs occurring in the protogroup environment could explain both the unusual GCs and the lack of dark matter in these galaxies (Silk, 2019). The large relative distance and the large relative velocity could be consistent with such scenarios. The second category of scenarios involves a progenitor falling into a Milky-Way sized halo, losing gas due to supernova feedback and ram pressure and losing dark matter by tidal stripping (Nusser, 2020). Tidal stripping of dark matter is possible if the progenitor is on a tightly bound and quite radial orbit, has a cored density structure for the dark halo (Ogiya et al., 2021), and if the accretion happened early on, . These scenarios are – at least at face value – more difficult to reconcile with at least one of the galaxies being no longer bound to the group.
The relative distance also places a new constraint on the interpretation of NGC 1052–DF2 and NGC 1052–DF4 in the context of MOND (see § 1). van Dokkum et al. (2018b) argued that the low velocity dispersion of NGC 1052–DF2 could falsify MOND, but they neglected the external field effect (EFE). Kroupa et al. (2018), Haghi et al. (2019), and Müller et al. (2019a) found that the observed velocity dispersions of both NGC 1052–DF2 and NGC 1052–DF4 are consistent with MOND if both galaxies are physically close ( kpc; Kroupa et al., 2018) to a massive galaxy. The most obvious candidate for this massive galaxy is NGC 1052 itself, but our relative distance measurement of Mpc rules out NGC 1052–DF2 and NGC 1052–DF4 both being within 300 kpc of NGC 1052. We cannot exclude that two different galaxies independently produce the EFE, as NGC 1052–DF4 is close in projection to the low luminosity spiral galaxy NGC1035 and it has been suggested that it is interacting with it (Montes et al., 2020). The Tully-Fisher distance of NGC1035 is consistent with it being in the foreground of the group ( Mpc, km s-1; Kourkchi & Tully, 2017). The issue with this scenario is that NGC 1052–DF2 and NGC 1052–DF4 would have formed completely independently, one in a massive group and the other as a satellite of an isolated low luminosity galaxy in the foreground, despite their near-identical morphologies, kinematics, and extreme globular cluster populations. Moreover, deep Dragonfly imaging does not confirm the bridge of stars between NGC 1052–DF4 and NGC1035 that was found by Montes et al. (2020) (M. Keim et al., in preparation).
Looking ahead, further constraints on the physical processes that led to the formation of NGC 1052–DF2 and NGC 1052–DF4 can be obtained by combining the new distance information with the GC luminosity functions (Leigh & Fragione, 2020; Trujillo-Gomez et al., 2020), GC dynamics (e.g. orbital decay timescale; Nusser, 2018; Dutta Chowdhury et al., 2019), and tidal features (Müller et al., 2019b).
References
- Abraham et al. (2018) Abraham, R., Danieli, S., van Dokkum, P., et al. 2018, Research Notes of the American Astronomical Society, 2, 16
- Blakeslee & Cantiello (2018) Blakeslee, J. P., & Cantiello, M. 2018, Research Notes of the American Astronomical Society, 2, 146
- Blakeslee et al. (2001) Blakeslee, J. P., Lucey, J. R., Barris, B. J., Hudson, M. J., & Tonry, J. L. 2001, MNRAS, 327, 1004
- Choi et al. (2016) Choi, J., Dotter, A., Conroy, C., et al. 2016, ApJ, 823, 102
- Cohen et al. (2018) Cohen, Y., van Dokkum, P., Danieli, S., et al. 2018, ApJ, 868, 96
- Danieli et al. (2020) Danieli, S., van Dokkum, P., Abraham, R., et al. 2020, ApJ, 895, L4
- Danieli et al. (2019) Danieli, S., van Dokkum, P., Conroy, C., Abraham, R., & Romanowsky, A. J. 2019, ApJ, 874, L12
- Dolphin (2000) Dolphin, A. E. 2000, PASP, 112, 1383
- Dotter (2016) Dotter, A. 2016, ApJS, 222, 8
- Dutta Chowdhury et al. (2019) Dutta Chowdhury, D., van den Bosch, F. C., & van Dokkum, P. 2019, ApJ, 877, 133
- Emsellem et al. (2019) Emsellem, E., van der Burg, R. F. J., Fensch, J., et al. 2019, A&A, 625, A76
- Famaey et al. (2018) Famaey, B., McGaugh, S., & Milgrom, M. 2018, MNRAS, 480, 473
- Fensch et al. (2019) Fensch, J., van der Burg, R. F. J., Jeřábková, T., et al. 2019, A&A, 625, A77
- Forbes et al. (2019) Forbes, D. A., Alabi, A., Brodie, J. P., & Romanowsky, A. J. 2019, MNRAS, 489, 3665
- Greco et al. (2021) Greco, J. P., van Dokkum, P., Danieli, S., Carlsten, S. G., & Conroy, C. 2021, ApJ, 908, 24
- Haghi et al. (2019) Haghi, H., Kroupa, P., Banik, I., et al. 2019, MNRAS, 487, 2441
- Karachentsev et al. (2000) Karachentsev, I. D., Karachentseva, V. E., Suchkov, A. A., & Grebel, E. K. 2000, A&AS, 145, 415
- Kourkchi & Tully (2017) Kourkchi, E., & Tully, R. B. 2017, ApJ, 843, 16
- Krist (1995) Krist, J. 1995, in Astronomical Society of the Pacific Conference Series, Vol. 77, Astronomical Data Analysis Software and Systems IV, ed. R. A. Shaw, H. E. Payne, & J. J. E. Hayes, 349
- Kroupa et al. (2018) Kroupa, P., Haghi, H., Javanmardi, B., et al. 2018, Nature, 561, E4. https://doi.org/10.1038/s41586-018-0429-z
- Lee et al. (1993) Lee, M. G., Freedman, W. L., & Madore, B. F. 1993, ApJ, 417, 553
- Leigh & Fragione (2020) Leigh, N. W. C., & Fragione, G. 2020, ApJ, 892, 32
- Makarov et al. (2006) Makarov, D., Makarova, L., Rizzi, L., et al. 2006, AJ, 132, 2729
- Martin et al. (2018) Martin, N. F., Collins, M. L. M., Longeard, N., & Tollerud, E. 2018, ApJ, 859, L5
- McQuinn et al. (2017) McQuinn, K. B. W., Skillman, E. D., Dolphin, A. E., Berg, D., & Kennicutt, R. 2017, AJ, 154, 51
- Merritt et al. (2016) Merritt, A., van Dokkum, P., Abraham, R., & Zhang, J. 2016, ApJ, 830, 62
- Milgrom (1983) Milgrom, M. 1983, ApJ, 270, 365
- Monelli & Trujillo (2019) Monelli, M., & Trujillo, I. 2019, ApJ, 880, L11
- Montes et al. (2020) Montes, M., Infante-Sainz, R., Madrigal-Aguado, A., et al. 2020, ApJ, 904, 114
- Müller et al. (2019a) Müller, O., Famaey, B., & Zhao, H. 2019a, A&A, 623, A36
- Müller et al. (2019b) Müller, O., Rich, R. M., Román, J., et al. 2019b, A&A, 624, L6
- Nusser (2018) Nusser, A. 2018, ApJ, 863, L17
- Nusser (2020) —. 2020, ApJ, 893, 66
- Ogiya et al. (2021) Ogiya, G., Taylor, J. E., & Hudson, M. J. 2021, arXiv e-prints, arXiv:2102.02786
- Price-Whelan et al. (2018) Price-Whelan, A. M., Sipőcz, B. M., Günther, H. M., et al. 2018, AJ, 156, 123
- Rejkuba (2012) Rejkuba, M. 2012, Ap&SS, 341, 195
- Rizzi et al. (2007) Rizzi, L., Tully, R. B., Makarov, D., et al. 2007, ApJ, 661, 815
- Schlafly & Finkbeiner (2011) Schlafly, E. F., & Finkbeiner, D. P. 2011, ApJ, 737, 103
- Shen et al. (2020) Shen, Z., van Dokkum, P., & Danieli, S. 2020, arXiv e-prints, arXiv:2010.07324
- Silk (2019) Silk, J. 2019, MNRAS, 488, L24
- Tonry et al. (2001) Tonry, J. L., Dressler, A., Blakeslee, J. P., et al. 2001, ApJ, 546, 681
- Trujillo et al. (2019) Trujillo, I., Beasley, M. A., Borlaff, A., et al. 2019, MNRAS, 486, 1192
- Trujillo-Gomez et al. (2020) Trujillo-Gomez, S., Kruijssen, J. M. D., Keller, B. W., & Reina-Campos, M. 2020, arXiv e-prints, arXiv:2010.05930
- Trujillo-Gomez et al. (2021) Trujillo-Gomez, S., Kruijssen, J. M. D., & Reina-Campos, M. 2021, arXiv e-prints, arXiv:2103.08610
- Tully et al. (2013) Tully, R. B., Courtois, H. M., Dolphin, A. E., et al. 2013, AJ, 146, 86
- van Dokkum et al. (2019) van Dokkum, P., Danieli, S., Abraham, R., Conroy, C., & Romanowsky, A. J. 2019, The Astrophysical Journal, 874, L5
- van Dokkum et al. (2018a) van Dokkum, P., Danieli, S., Cohen, Y., Romanowsky, A. J., & Conroy, C. 2018a, ApJ, 864, L18
- van Dokkum et al. (2018b) van Dokkum, P., Danieli, S., Cohen, Y., et al. 2018b, Nature, 555, 629
- van Dokkum et al. (2018c) van Dokkum, P., Cohen, Y., Danieli, S., et al. 2018c, The Astrophysical Journal, 856, L30
- van Dokkum et al. (2015) van Dokkum, P. G., Abraham, R., Merritt, A., et al. 2015, ApJ, 798, L45