The search for failed supernovae with the Large Binocular Telescope: a new candidate and the failed SN fraction with 11 yr of data
Abstract
We present updated results of the Large Binocular Telescope Search for Failed Supernovae. This search monitors luminous stars in 27 nearby galaxies with a current baseline of 11 yr of data. We re-discover the failed supernova (SN) candidate N6946-BH1 as well as a new candidate, M101-OC1. M101-OC1 is a blue supergiant that rapidly disappears in optical wavelengths with no evidence for significant obscuration by warm dust. While we consider other options, a good explanation for the fading of M101-OC1 is a failed SN, but follow-up observations are needed to confirm this. Assuming only one clearly detected failed SN, we find a failed SN fraction at 90 per cent confidence. We also report on a collection of stars that show slow (decade), large amplitude () luminosity changes.
keywords:
black hole physics – surveys – stars: massive – supernovae: general.1 Introduction
The life of every massive star (>8 ) ends with the collapse of its core, which is sometimes followed by the violent ejection of its envelope and the production of a luminous core-collapse supernova (ccSN). Volume-limited samples have shown that around 59 per cent of ccSNe are the hydrogen-rich Type II-P class, with their progenitors identified as red supergiants (RSGs) (Smartt et al., 2009; Li et al., 2011). However, the most massive of the observed Type II-P progenitors has a mass of only 16–18 (Smartt et al., 2009; Smartt, 2015), which is significantly lower than the maximum red supergiant mass of 25 (Humphreys & Davidson, 1979). This implies that the more massive RSGs are not exploding as SNe. The alternative hypothesis, which supposes that increased RSG mass loss causes the stars to explode as stripped SNe (e.g., Ekström et al. 2012; Groh et al. 2013), requires higher mass loss rates than observed (e.g., Beasor et al. 2020).
Modern theoretical models find that these “missing” RSGs with masses of 18–25 are forming cores that are too compact to explode as SNe (O’Connor & Ott, 2011; Ugliano et al., 2012; Sukhbold & Woosley, 2014; Pejcha & Thompson, 2015; Ertl et al., 2016; Sukhbold et al., 2016). These observational and theoretical findings have led to the hypothesis that these massive RSGs instead become “failed SNe” (Kochanek et al., 2008), and form black holes (BHs) with masses of 5–10 that are typical of those observed in our Galaxy (Kochanek, 2014, 2015).
The origin of BHs is particularly important in the wake of the BH-BH and BH-neutron star mergers being detected by the Laser Interferometer Gravitational Wave Observatory (LIGO, Abbott et al. 2016a). These mergers are the end result of a long and complicated process involving binary stellar evolution and the core-collapse of each progenitor star (e.g., Abbott et al. 2016b; Belczynski et al. 2016; Woosley 2016). Understanding the formation of BHs and their subsequent evolution is crucial to understanding the mergers detected by LIGO and future gravitational wave observatories. Here we will focus on detecting the formation of BHs, but other relevant probes include searches for non-interacting, low-mass BHs (Thompson et al., 2019; Jayasinghe et al., 2021), searches and constraints on binaries, bound and unbound, in SN remnants (e.g., Kochanek 2018; Kerzendorf et al. 2019; Kochanek et al. 2019; Maitra et al. 2019), and searches for BHs using gravitational microlensing (e.g., Lu et al. 2016).
Here we present updates on the search for failed SNe with the Large Binocular Telescope (LBT), first proposed by Kochanek et al. (2008). This survey monitors luminous stars in 27 galaxies within 10 Mpc using the Large Binocular Telescope (LBT) and is designed to detect the death of evolved 9–30 stars, independent of whether they explode as SNe. We reference the previous papers in the survey, Gerke et al. (2015), Adams et al. (2017a), Adams et al. (2017b), and Basinger et al. (2020), as G15, A17a, A17b, and B20, respectively. G15 put the first constraints on the failed SN fraction as derived from the first 4 yr of data and identified a first candidate failed SN, A17b updated the constraints using 7 yr of data, and A17a led a detailed analysis of the failed SN candidate N6946-BH1. The most recent analysis of the late-time evolution of N6946-BH1 can be found in B20.
N6946-BH1 is the best existing candidate for a failed SN. It was a 10, 25 RSG that underwent a luminous 10 transient before mostly vanishing in optical and mid-IR wavelengths (A17a). The transient was likely powered by the recombination of the RSG’s envelope that would be gently ejected after core-collapse (Nadezhin, 1980; Lovegrove & Woosley, 2013). Follow-up photometry with the Hubble Space Telescope (HST) and the Spitzer Space Telescope (Spitzer) showed the existence of a faint 2000 remnant luminosity that could be understood as emission from fallback accretion (A17a, B20).
Other surveys have also searched for failed SNe. Reynolds et al. (2015) examined a sample of 15 galaxies with multi-epoch HST data and reported the discovery of NGC 3021-CANDIDATE-1, a 25–30 yellow supergiant (YSG), which disappeared in the optical without a recorded SN. Another failed SN candidate is a luminous blue variable (LBV) in the dwarf galaxy PHL 293B (Allan et al., 2020). While N6946-BH1 and NGC 3021-CANDIDATE-1 were identified by their photometry, this LBV was identified as a failed SN candidate due to the disappearance of broad emission lines, which had been present in the spectra of the object for years prior. While one interpretation is that this source is a failed SN, it is also posited that the source is instead the remnant of an undetected Type IIn SN, or perhaps some other type of stellar variability (Burke et al., 2020).
In addition to constraints on the failed SN fraction, the LBT survey has also produced results on SNe progenitors (Johnson et al., 2017), SN progenitor variability (Szczygieł et al., 2012; Kochanek et al., 2017; Johnson et al., 2018), “SN imposters” (Adams & Kochanek, 2015), SN 2008S and similar events (Adams et al., 2016; Andrews et al., 2020), and LBVs (Grammer et al., 2015). In particular, Johnson et al. (2018) showed that the typical Type II progenitor has no pre-SN mass ejection phase.
In this paper, we present updated results on the failed SN fraction following the work done in G15 and A17b using 11 yr of data. This represents an increase in the baseline of the survey by up to 4 yr compared to the previous results from A17b. In Sections 2 and 3, we discuss our image subtraction methods and our criteria for selecting failed SN candidates from among the millions of processed light curves. In Section 4, we discuss our observations of SNe and other luminous transients that occur in our survey. In Section 5, we discuss two new “disappearing stars”, one of which we classify as a failed SN candidate and one which we ultimately reject. In Section 6, we present a sample of peculiar large-amplitude, slowly-varying stars. In Section 7, we summarize our work and update our estimates of the failed SN fraction.
2 Image Subtraction
| Galaxy | Number of | Observation period | Baseline | Distance | Distance | |
|---|---|---|---|---|---|---|
| epochs | Start | End | (yr) | (Mpc) | reference | |
| M81/NGC 3031 | 45 | 2008-03-08 | 2019-10-26 | 11.1 | 3.65 | 1 |
| M82/NGC 3034 | 34 | 2008-03-08 | 2019-10-26 | 11.1 | 3.52 | 2 |
| M101/NGC 5457 | 35 | 2008-03-08 | 2019-12-21 | 11.1 | 6.43 | 3 |
| NGC 628/M74 | 27 | 2008-11-22 | 2019-12-20 | 9.8 | 8.59 | 4 |
| NGC 672 | 26 | 2008-07-05 | 2019-12-22 | 10.0 | 7.2 | 5 |
| NGC 925 | 26 | 2008-07-06 | 2019-12-21 | 10.0 | 9.16 | 6 |
| NGC 2403 | 44 | 2008-05-05 | 2019-10-26 | 10.2 | 3.56 | 7 |
| NGC 2903 | 19 | 2008-03-08 | 2019-12-21 | 11.5 | 8.9 | 8 |
| NGC 3077 | 25 | 2008-05-04 | 2019-10-26 | 10.4 | 3.82 | 5 |
| NGC 3344 | 21 | 2008-05-04 | 2019-03-31 | 9.5 | 6.9 | 9 |
| NGC 3489 | 20 | 2008-03-12 | 2019-12-21 | 10.9 | 7.18 | 10 |
| NGC 3623/M65 | 22 | 2008-05-04 | 2019-03-31 | 9.3 | 10.62 | 11 |
| NGC 3627/M66 | 22 | 2008-05-04 | 2019-03-31 | 9.3 | 10.62 | 11 |
| NGC 4214 | 19 | 2008-03-13 | 2019-04-01 | 9.2 | 2.98 | 12 |
| NGC 4236 | 18 | 2008-03-09 | 2019-03-30 | 9.3 | 3.65 | 1 |
| NGC 4248 | 44 | 2008-03-08 | 2019-03-31 | 10.2 | 7.21 | 13 |
| NGC 4258/M106 | 44 | 2008-03-08 | 2019-03-31 | 10.2 | 7.21 | 13 |
| NGC 4395 | 17 | 2008-03-10 | 2019-03-31 | 7.1 | 4.27 | 14 |
| NGC 4449 | 22 | 2008-03-09 | 2019-12-21 | 10.2 | 3.82 | 15 |
| NGC 4605 | 18 | 2008-03-13 | 2019-03-31 | 9.1 | 5.47 | 16 |
| NGC 4736/M94 | 17 | 2008-03-10 | 2019-03-31 | 9.3 | 5.08 | 17 |
| NGC 4826/M64 | 21 | 2008-03-08 | 2019-03-30 | 10.0 | 4.4 | 2 |
| NGC 5194/M51 | 25 | 2008-03-09 | 2019-03-31 | 9.4 | 8.3 | 18 |
| NGC 5474 | 21 | 2008-03-13 | 2019-03-31 | 9.4 | 6.43 | 3 |
| NGC 6503 | 29 | 2008-05-04 | 2019-10-24 | 11.2 | 5.27 | 6 |
| NGC 6946 | 48 | 2008-05-03 | 2019-10-24 | 10.4 | 5.96 | 19 |
| IC 2574 | 24 | 2008-03-13 | 2019-12-21 | 10.9 | 4.02 | 6 |
Notes: The baseline is the time from the second observation to the penultimate observation in the selection period. References: (1) Gerke et al. (2011); (2) Jacobs et al. (2009); (3) Shappee & Stanek (2011); (4) Herrmann et al. (2008); (5) Karachentsev et al. (2004); (6) Karachentsev et al. (2003); (7) Willick et al. (1997); (8) Drozdovsky & Karachentsev (2000); (9) Verdes-Montenegro et al. (2000); (10) Theureau et al. (2007); (11) Kanbur et al. (2003); (12) Dopita et al. (2010); (13) Herrnstein et al. (1999); (14) Thim et al. (2004);(15) Annibali et al. (2008); (16) Karachentsev et al. (2006); (17) Tonry et al. (2001); (18) Poznanski et al. (2009), and (19) Karachentsev et al. (2000).
We follow the methods described in G15 and A17b. We use the ISIS image subtraction package (Alard & Lupton, 1998; Alard, 2000) with the same astrometric references as those used in G15. We updated the reference images used for image subtraction by including higher-quality data collected over the current 11 yr baseline of the survey. These references images had better full-widths at half maximum (FWHMs) as well as higher S/N than those used by A17b. These updates were especially important for the UBV images where the number of epochs used to construct the reference images doubled for some fields. We ran image subtraction on all epochs to construct light curves, but for light curve analysis/candidate selection, we excluded epochs with FWHM > 2 arcsec to exclude epochs with bad seeing, background counts > 30,000 to exclude observations taken during twilight, and image subtraction scaling factors < 0.4 to exclude observations with significant cirrus. The number of included/analyzed epochs is given in Table 1. For candidate selection, we only used data taken before January 2020, but later data were used to evaluate candidates.
We follow the same methods for calibration as used by G15 and A17b. Sloan Digital Sky Survey (SDSS, Ahn et al. 2012) stars with SDSS ugriz AB magnitudes are matched with stars in the reference images and transformed to UBVR Vega magnitudes using the conversions reported by Jordi et al. (2006) and zero-points reported by Blanton & Roweis (2007). For the fields where SDSS stars were unavailable, we followed the prescriptions described in G15. The -band data for IC 2574, NGC 925, and NGC 6946 remain uncalibrated.
As in A17b, we use mask files for saturated pixels as opposed to actually masking the saturated pixels in the images by changing the pixel value. This allows us to keep track of sources that were saturated in some epochs but not all. We use the subtracted images generated by ISIS to construct a root mean square (RMS) image. This combines the subtracted images such that each pixel in the RMS image is the RMS of that position’s pixel values in all the subtracted images. This process highlights variable sources.
3 Candidate Selection
For each field, we generate a master catalog of sources by combining two catalogs: (1) a catalog of ‘bright sources’ () generated by running DAOPhot (Stetson, 1987) on the reference image; and (2) a catalog of ‘RMS sources’ generated by running SEXTRACTOR (Bertin & Arnouts, 1996) on the RMS image. Throughout the paper, refers to the band luminosity associated with a given filter while refers to the bolometric luminosity. For a magnitude corresponding to a flux , where is the luminosity distance. We will then select targets based on the temporal changes in these band luminosities. As an example of a field, M101 in -band had 235,559 bright sources, 9,001 RMS sources, and 5,185 sources that appeared in both the bright and the RMS catalogs. Including all galaxies and filters, the master catalog included 6.3 million sources. As shown in G15, we should be sensitive to all core-collapse progenitors except for some Wolf-Rayet stars if we search for band luminosity changes in all four filters. The redder filters are better for RSGs and the bluer filters are better for hot, stripped stars.
From the master catalog, we generate a candidate list by finding sources with light curves that match either of the following two criteria:
(1) between all of the following image pairs: first and last, first and penultimate, second and final, and second and penultimate images. Here, the ‘second’ image is chosen to be at least 1 month after the ‘first’ image. We also require that the change in flux between the first and last image is greater than 10 per cent of the flux in the first image. This criterion is meant to flag sources that become dimmer or brighter over the baseline of the survey, while attempting to exclude variable stars and subtraction artefacts.
(2) in at least two consecutive epochs and for a period of 3 months to 3 yr. This criterion is meant to flag transient flares such as those predicted by Lovegrove &
Woosley (2013) and observed in N6946-BH1 (G15, A17a, B20).
Hereafter we refer to these as criterion 1 and criterion 2. For all sources that match either criterion, we also require that the source be sufficiently compact in the RMS image. This is intended to remove spurious RMS sources that are artefacts of image subtraction. The compactness is computed by comparing the SEXTRACTOR fluxes of the source using apertures of 4 pixels and 8 pixels in radii. We empirically determined a limit to be for rejecting a source.
In total, we found 13223 sources that satisfied at least one of the selection criteria in any of the filters. The authors JMMN, CSK, and KZS independently reviewed the light curves and image subtractions of each source. The vast majority of these sources were bright star image subtraction artefacts (10878, or 82 per cent) or obvious variable stars (2028, or 15 per cent), leaving only 317 sources that passed the initial round of inspection. These 317 sources were matched across filters, leaving 151 distinct sources that were again inspected. After removing known SNe, peculiar transients, and other residual spurious sources, we finalized our candidate list to five candidates. Three of these sources are “rediscovered” candidates, including N6946-BH1, discussed in earlier papers and in Section 5, and two are new candidates discussed in Sections 5.1 and 5.2.
We also re-analyzed the candidate sources presented in A17b. Most of these were already rejected in A17b as “slow-faders” – objects fading over timescales of >1000 d. One particular candidate, labelled N925-OC1, was singled out as fading relatively rapidly and was identified as a cool, luminous supergiant. In our current analysis, we find that in the epochs following those analyzed by A17b, the source returned to near peak brightness in -band, and the source continued to vary over the following 1200 d. While it did satisfy criterion 1 in -band for being less luminous in the last two images, the lack of long-term quiescence means we do not consider it a candidate.
4 Supernovae and other transients
| ID | Galaxy | Criteria | Classification |
|---|---|---|---|
| SN 2008S | NGC 6946 | 1 | IIn |
| SN 2009hd | NGC 3627 | N/A | II-L |
| SN 2011dh | NGC 5194 | 1,2 | IIb |
| SN 2012fh | NGC 3344 | N/A | Ic |
| SN 2013am | NGC 3623 | 2 | II-P |
| SN 2013ej | NGC 628 | 2 | II-P |
| SN 2014bc | NGC 4258 | 1,2 | II-P |
| SN 2016cok | NGC 3627 | 1,2 | II-P |
| SN 2017eaw | NGC 6946 | 1,2 | II-P |
| SN 2011fe | M101 | 2 | Ia |
| SN 2014J | M82 | 1,2 | Ia |
| AT2019abn | NGC 5194 | N/A | ILRT |
| AT2019krl | NGC 628 | 1,2 | ILRT |
Notes: List of SNe and ILRT that occured during the survey. SNe that satisfied the ‘criteria’ described in Section 3 are labelled as such.
SNe are discovered in our survey due to the luminosity changes of the progenitor (satisfying criterion 1) or due to the transient SN itself (satisfying criterion 2). Table 2 presents the SNe that have occured during our survey and their classifications. We also list the candidate criteria described in Section 3 that the SNe satisfied to be considered by our candidate detection pipeline. Most of these SNe were discovered as luminous transients, satisfying criterion 2. SN 2008S was first observed while in outburst and was thus not flagged as a transient. The fading of the SN was observed as a rapidly fading “progenitor”, thus satisfying criterion 1.
As a Type Ia, SN 2011fe has effectively no progenitor luminosity, and since the SN itself has faded significantly, this source does not satisfy criterion 1. SN 2009hd, a Type II-L in NGC 3627, and SN 2012fh, a Type Ic in NGC 3344, satisfy neither criteria due to the relative faintness of the progenitors and the SNe in our data. SN 2009hd was heavily extincted due to the progenitor being in a dust lane of the galaxy, and a more-detailed analysis of SN 2012fh can be found in G15, A17b, and Johnson et al. (2017). SN 2013am and SN 2013ej are still more luminous than their progenitors but with , so they did not satisfy criterion 1.
Of the 6 SNe identified under criterion 1, it is worth commenting that 4 (SN 2014J, SN 2014bc, SN 2016cok, and SN 2017eaw) were flagged because the SNe are still significantly brighter than their progenitors at the end of our observations. SN 2014bc is suspect as it lies in a highly saturated region of the -, -, and - band data, leaving only a rather noisy -band detection. Only SN 2011dh is flagged because the SN is significantly fainter than the progenitor so that the system is flagged through the death of the star. Eventually, we would expect this to be true for most of these other SNe, but we consider the question of how long it takes a SN to become fainter than its progenitor.
The late time luminosity of a Type II-P SN roughly follows the radioactive decay of 56Ni
where is the mass of 56Ni and is the effective decay rate (e.g., Nadyozhin 1994). We can invert this to find the time for the source to fade below luminosity where we should be able to detect most of these stellar deaths by the fading of the progenitor once
Given that Type II-P SNe produce (Hamuy, 2003; Sukhbold et al., 2016), it follows that the timescale for fading is around 3 yr. This ignores -ray escape at late times, which will accelerate the fading, and other radioactive elements like 57Co and 44Ti, which can produce some luminosity at late times, though usually (Seitenzahl et al., 2014).
The other possible source of luminosity is shocked material, which can produce significant luminosity even after the 56Ni decay. The luminosity of a shock interacting with a spherically symmetric pre-SN mass-loss wind (see e.g., Chevalier 1982) is
where is the mass-loss rate, and and are the shock and wind speeds, respectively. This means that the shocked material can produce significant luminosity with a high shock speed or a high mass-loss rate. While this is most likely to be emitted as X-rays because of the high post-shock temperature (Chevalier, 1982), some of the energy emerges as optical line emission as seen in the late-time spectra of SN 1980K and SN 1993J (e.g., Milisavljevic et al. 2012). While it does not seem an ideal mechanism for normal SN, shocked material could support the late-time luminosity of SN 2013am, SN 2013ej, and SN 2014bc, where luminosity from radioactivity is unlikely to power the light curves more than 5 yr after the initial SNe.
We also flagged the intermediate luminosity red/optical transient (ILRT/ILOT) AT2019krl (ZTF19abehwhj). Located at (01:36:49.65, +15:46:46.2) in NGC 628, the transient was detected as a bright flare satisfying criterion 2, and also satisfied criterion 1 because it has not yet faded. The LBT data on this transient is discussed in Andrews et al. (2020). Another ILRT/ILOT, AT2019abn (ZTF19aadyppr), occured in NGC 5194 at (13:29:42.39 +47:11:17.0) over the observing period of our survey, but it was not detected or analyzed because it is bright and saturated in our last epoch of candidate selection.
5 Candidates
| Candidate | ||||||
| ID | RA | Dec | Criteria | [] | [] | Classification |
| N4736-OC1 | 12:51:00.93 | +41:08:30.4 | 1 | OC | ||
| M101-OC1 | 14:03:17.24 | +54:22:07.6 | 1 | OC | ||
| N6946-BH1 | 20:35:27.56 | +60:08:08.3 | 1,2 | FSN | ||
| M101 OT2015-1 | 14:02:16.80 | +54:26:20.7 | 1,2 | > | merger | |
| SN 2011dh | 13:30:05.15 | +47:11:11.8 | 1,2 | > | SN |
Notes: List of candidates that passed the final round of visual inspection. ‘Candidate criteria’ are those listed in Section 3. and are the -band luminosities of the first and last epochs, while and are the maximum and minimum -band luminosities observed for each source in the LBT light curves. N6946-BH1 was previously identified as a failed SN, and M101 OT2015-1 and SN 2011dh are included as candidates due to the “disappearence” of their progenitor sources. FSN = failed SN, OC = other candidate.
Here we describe and analyze the remaining five candidates. Of these, three are “rediscovered” candidates discussed in G15, A17a, A17b, and B20: N6946-BH1, M101 OT2015-1 (PSN J14021678+5426205), and SN 2011dh. N6946-BH1 satisfied both selection criteria in the BVR-bands by producing a luminous optical transient and fading significantly below the progenitor luminosity (for details, see A17a). M101 OT2015-1 was a luminous red nova and suspected stellar merger (Goranskij et al., 2016; Blagorodnova et al., 2017), and the associated LBT data are discussed in detail in A17b. The source satisfied both candidate criteria by producing a luminous transient and fading below its progenitor luminosity. Considering the LBT data alone, without outside analysis/identification, would have lead us to classify this source, along with SN 2011dh as discussed earlier, as a failed SN, hence we include these in Table 3. These sources served as benchmarks for our analysis - that we were able to recover them means that our methods are consistent and we would likely not miss similar sources.
We consider two new candidates, N4736-OC1 and M101-OC1, where a luminous source is present in many or most of the epochs of observation before fading significantly. Neither source is as strong a failed SN candidate as N6946-BH1. Both sources are less luminous and far bluer than N6946-BH1 and were not observed to produce a luminous optical transient. Based on new data from January and March 2021 that was not used for candidate selection, we ultimately reject N4736-OC1 as a candidate failed SN.
5.1 N4736-OC1
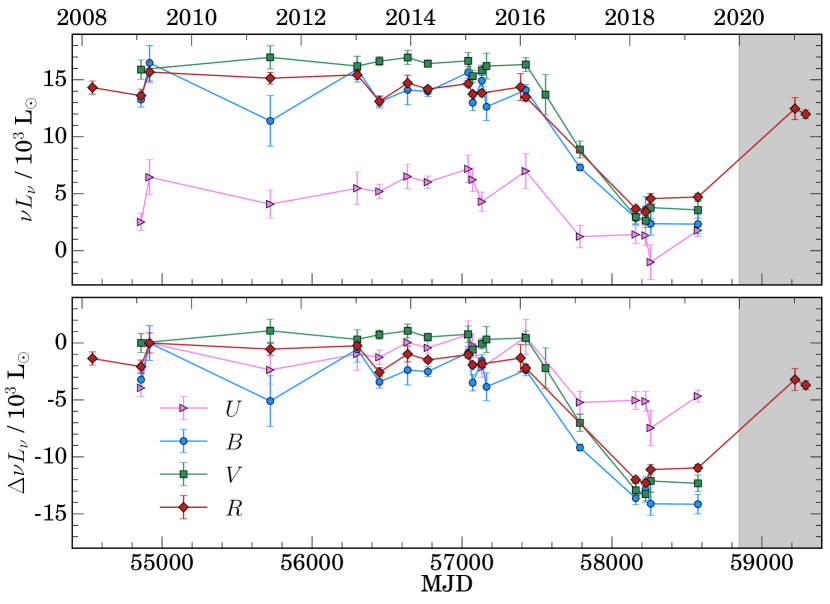
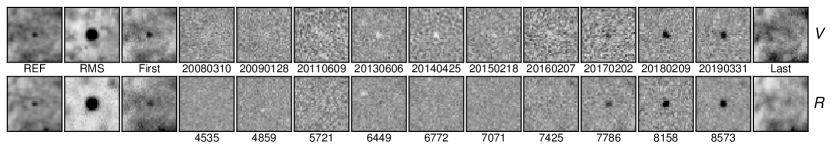
N4736-OC1 is in NGC 4736 at (12:51:00.93, +41:08:30.4). The calibrated and differential light curve of the source are shown in Figure 1, and the LBT subtraction images are shown in Figure 2. The full light-curve data are shown in Table 6. The source remained relatively quiescent for the first 8 yr of the survey. The source then fades by 10 over 2 yr in the BVR-bands and by 5 in the -band. While there is still some residual flux in the final epochs of LBT data (see the top panel of Fig. 1), the point source that is present in earlier epochs is clearly absent in the later epochs (see Fig. 2). The source was not flagged as a candidate in the - or -bands because the measured for criterion 1 was slightly less than in both bands. However, it did satisfy criterion 1 in - and -bands.
There are unfortunately no HST images of the source, limiting our ability to confirm or reject it as a true candidate. There is no evidence for a source or dust emission in the available Spitzer 3.6 and 4.5 micron images from MJD 56906 (September 2014) to 58778 (October 2019). Light curves extracted at the location of the source in Spitzer images have an RMS scatter of 10, slightly below the level of the optical luminosity changes, but with no evidence of systematic flux changes between the earlier and later epochs. While we cannot rule out dust converting some of the optical flux into mid-IR flux, it seems unlikely that dust is the driving mechanism for the optical luminosity change.
Based on the differential light curve, the progenitor star was likely 10, which is quite under-luminous for a supergiant. One explanation is that the source is a post-AGB star (Bloecker, 1995). Such stars have been known to fade significantly in optical wavelengths due to the creation of dust shells (e.g., V4334 Sgr/Sakurai’s object Duerbeck et al. 2000). Another alternative is that the source is an R Coronae Borealis (RCB) star. RCBs are cool supergiants that can fade several magnitudes for up to thousands of days due to variable dust creation (Clayton, 2012). RCBs also have absolute magnitudes of (Tisserand et al., 2009), translating to roughly , which is comparable to what we see in Figure 1. Both of these explanations may be problematic due to the lack of mid-IR flux increase.
We obtained new LBT data in January and March 2021 and found that the star has returned to near peak brightness (see Fig. 1). Thus, we ultimately reject N4736-OC1 as a failed SN candidate. We include this analysis of the source because, considering only the data used in candidate selection, it was a viable candidate, and it illustrates the risk that hitherto-unknown stellar variability could very well mimic a failed SN.
5.2 M101-OC1
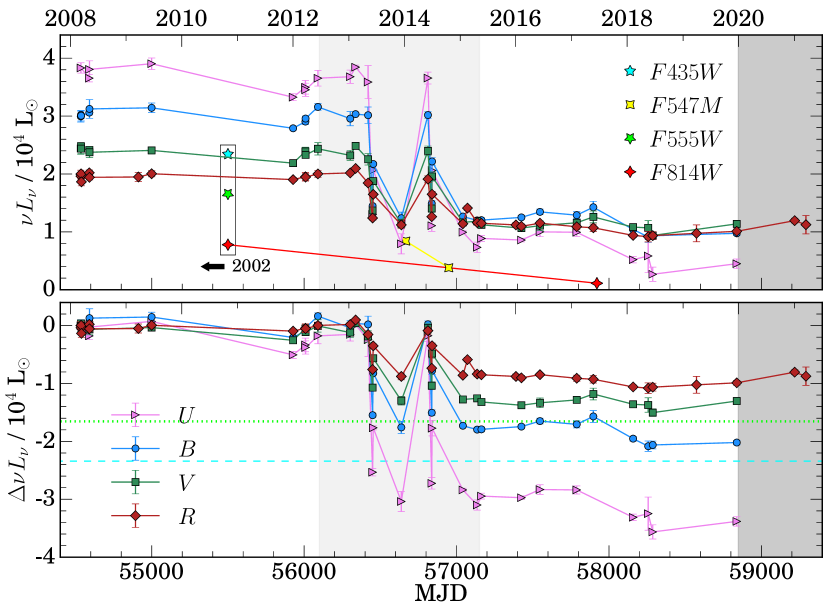
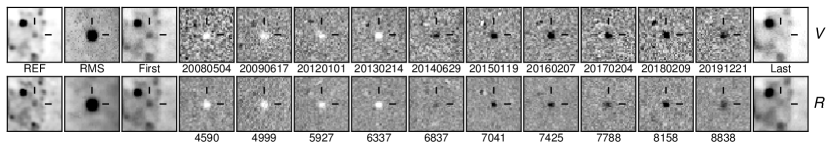
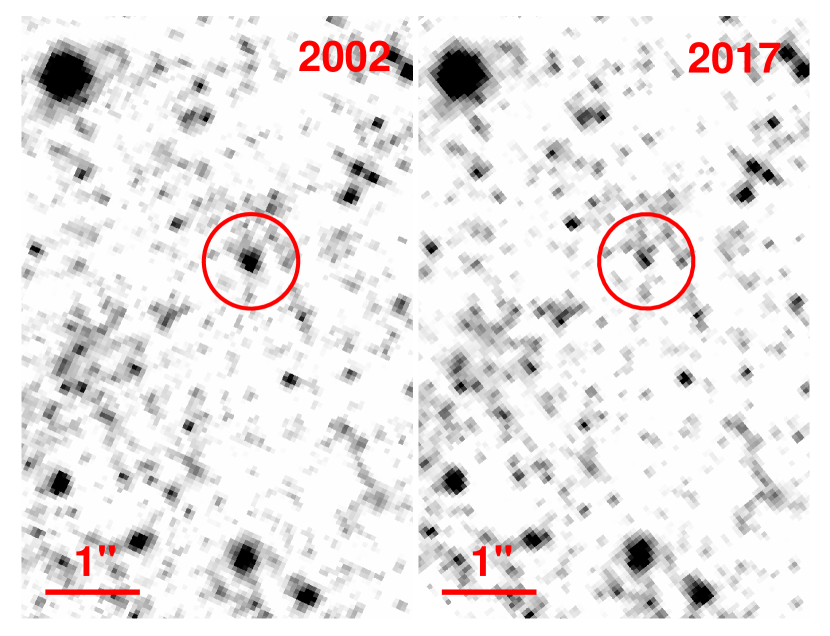
M101-OC1 is in M101 at (14:03:17.24, +54:22:07.6). The calibrated and differential light curves of the source are shown in Figure 3, and the LBT difference imaging is shown in Figure 4. The full light-curve data are shown in Table 7. The source remained quiescent for the first 5 yr of observations, before showing peculiar variability for 2 yr between early 2013 and late 2014. After this “episode” of variability, the source dropped in flux by in the -band. This drop was more extreme in the bluer bands, with in the -band (see Fig. 3). The point source present in the early LBT UBV epochs is not visible in the latest epochs, though there appears to be a faint source in the last few -band images (see Fig. 4). Similar to N4736-OC1, the sourced was flagged in the UBV-bands for satisfying criterion 1 but was not flagged in the -band. We obtained new LBT data in January and March 2021 which show the source to have remained relatively quiescent and faint (see Fig. 3).
| Filter | Date | Epoch (MJD) | (mag) | (mag) | () | Reference |
|---|---|---|---|---|---|---|
| 2002-11-15 | 52594 | 22.998 0.014 | 6.072 | 23413 | PI: K. Kuntz, GO-9490 | |
| 23.036 0.016 | 6.037 | 16548 | ||||
| 2002-11-15 | 52594 | 22.958 0.025 | 6.093 | 7778 | PI: K. Kuntz, GO-9490 | |
| 2017-06-17 | 57921 | 24.433 0.019 | 4.619 | 1999 | PI: B. Shappee, GO-14678 | |
| 2014-01-10 | 56667 | 23.742 0.041 | 5.321 | 8405 | PI: W. Blair, GO-13361 | |
| 2014-10-18 | 56949 | 24.605 0.101 | 4.458 | 3796 |
Notes: and are corrected for Galactic extinction, is not. See Tab. 1 for distance modulus and reference.
Serendipitously, there were multiple HST observations of M101-OC1 across different epochs and with different filters. The resultant photometry was extracted with DOLPHOT (Dolphin, 2000) using the same configuration described in Adams & Kochanek (2015) and using the drizzled image from 2002 as the reference for the source’s location.
The HST PSF photometry magnitudes are presented in Figure 3 and Table 4. is the only filter used to image the source both before and after the fading incident. The pre- and post-fading images are shown in Figure 5. While the source is significantly brighter in the pre-fading image from 2002, there is still a clear point source in the post-fading image from 2017. There are also two epochs with the filter that show the source fading over time, though they occur during the episode of variability, and so it is unclear how these data relate to the other LBT and HST data. The lower luminosities found for the HST filters (e.g., comparing with , with ) are likely due to crowding in the lower resolution LBT data. It is worth noting that the HST luminosities are comparable to the luminosity changes measured in the LBT data (see the bottom panel of Fig. 3), which is expected given that differential light curves are insensitive to crowding. Future HST observations, especially at bluer bands like and will be needed to better understand the source.
Based on differencing the 3.6 and 4.5 micron Spitzer images, there is a source with some dust emission at the position of the star, but it is too confused to identify in the individual images. It also shows no evidence of a change in mid-IR luminosity that is on the scale of the change in the optical emission, to limits of based on RMS variability, over the period of MJD 53072 (March 2004) to 58781 (October 2019). This implies that the intrinsic luminosity of M101-OC1 is dropping rather than being shifted from optical to mid-IR wavelengths. Although the missing luminosity could be hidden in emission from colder dust that would not be detected by Spitzer in the mid-IR, one might expect a dust formation phase with hot dust which would have been detectable.
From the significant drop in luminosity in the blue bands, M101-OC1 is a candidate for a 104–10 blue supergiant (BSG) that disappeared as a failed SN. As a BSG, a failed SN would not be expected to produce a significant transient like N6946-BH1, as BSGs are more compact than YSGs/RSGs. After core collapse, a small fraction of the BSG’s envelope would be ejected and recombine, producing only a short-lived (20 d) transient (Fernández et al., 2018). Because the galaxies in the survey are observed a few times a year, it is unlikely that we would observe such a short-lived event. While there is still a faint point source in the late-time LBT and HST observations, this could be understood as emission from fallback accretion or a faint red binary companion to the progenitor. The latter explanation might be favored, as BSGs are very likely to have binary companions (Sana et al., 2012). Furthermore, the unchanging flux from dust emission seen by Spitzer could be attributed to this hypothetical red companion, since hot stars cannot form dust (Kochanek, 2011).
If M101-OC1 is not a failed SN and is instead a strange variable star, one possible interpretation is that it is a dust-obscured LBV. LBVs undergo “outbursts” where they become significantly cooler while maintaining their intrinsic luminosities (Humphreys & Davidson, 1994), and could thus mimic a disappearance in optical wavelengths by becoming sufficiently cool. LBVs are typically much more luminous at 10, but if there is significant obscuration by cold dust, then the optical luminosity could perhaps be brought down to the level of 104–10 that we see before M101-OC1 disappears, although this would make the relatively blue color of the optical source difficult to explain. The disappearance of M101-OC1 could then be attributed to conventional LBV behavior. This explanation is problematic, as M101-OC1 does not appear to maintain its intrinsic luminosity as it fades, as evidenced by the lack of change in the mid-IR Spitzer flux, whereas LBVs are thought to vary at roughly fixed luminsity except in outburst (Humphreys & Davidson, 1994).
If we consider other options, M101-OC1 could be a hot ( K) RCB star undergoing a dimming episode. However, issues immediately arise with this idea. There are only five hot RCBs known and even fewer with reported distances (De Marco et al., 2002; Tisserand et al., 2020), and M101-OC1 is also significantly more luminous than any hot RCB with a known distance.
Finally, M101-OC1 could be understood as a BSG being enshrouded in cold dust. There is a Spitzer source that is likely due to some warm dust emission, and so some of this warm dust may have cooled and enshrouded the star, leading to a drop in optical flux. However, this scenario is somewhat contrived, and it does not explain how the warm dust is being created, since the BSG is unlikely to be producing significant dust by itself (Kochanek, 2011). Without more data, we are unable to say more. The James Webb Space Telescope (JWST) is needed to determine the importance of cold dust in understanding this source.
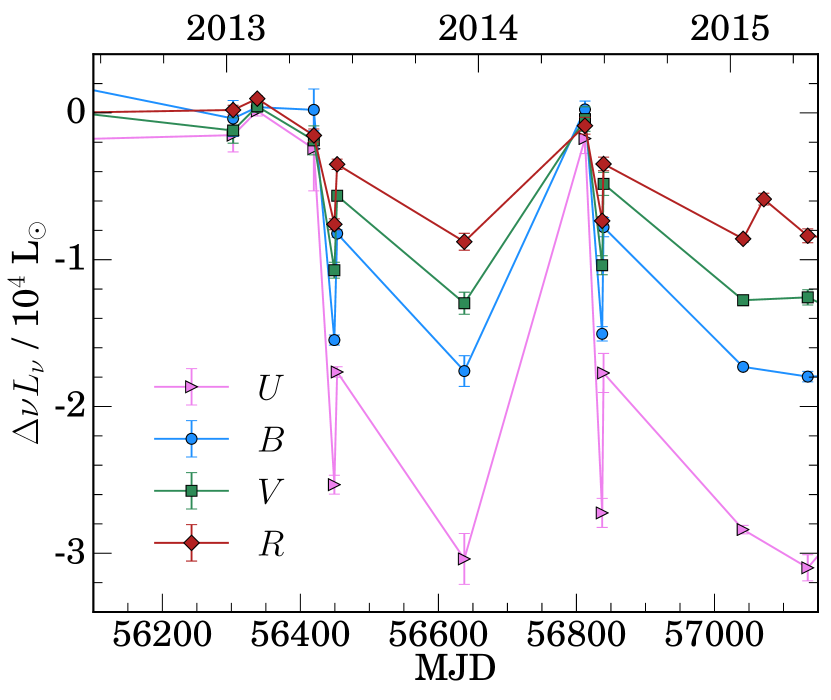
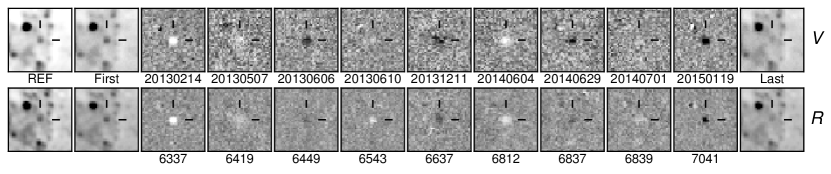
The “episode” of variability prior to the source’s fading is very peculiar. Figure 6 shows a zoom-in of the episode of variability in the differential light curve, and Figure 7 shows the relevant LBT subtraction images. Nearby sources do not show any similar variability, and the variability is replicated in all four bands. This is important, as the UBV-band images are from a different primary mirror and camera on LBT than the -band images. This makes it extremely likely that this variability is real and not an artefact of the data, flux calibration, or image subtraction.
The last epoch before the episode of variability is MJD 56337 (February 2013). Following this epoch, the source undergoes a roughly month-long rise to a peak luminosity, rapidly dimming, and then returning to near peak luminosity. It does this twice, during MJD 5641956453 (May-June 2013) and MJD 5681256839 (June-July 2014). In the middle of these two trends, MJD 56638 (December 2013) the source is observed to have faded significantly. The episode of variability appears to end by the next epoch of MJD 57042 (January 2015), where the source has faded and remains at or below this luminosity for the rest of our observations. The episode of variability lasts 1–2 yr. Spitzer data do not show the source to undergo similar variability in the mid-IR bands, though the closest match in time is the 3.6 micron Spitzer epoch taken 25 d prior (MJD 56394) to the first epoch of variability. Both of the two epochs of HST data in were observed during the episode of variability, though it is unclear how either epoch fit in with the variability seen with LBT due to the mismatch between the HST and LBT fluxes (see earlier discussion of HST photometry).
It is unclear what is producing this variability. One possible interpretation is variable dust creation, which could cover and then expose the progenitor BSG repeatedly. This could explain why the source is able to return to near-progenitor luminosity in the later part of the episode. While Spitzer data do not show any mid-IR variability that could confirm this, the rapid timescales for evolution (i.e., the source brightening by 10 in 2 d) and the mismatch between Spitzer and LBT epochs could explain why we do not see Spitzer variability. As noted earlier, this variable dust creation scenario is unlikely since BSGs are not known to produce significant quantities of dust. Another possibility is that we are observing eclipses of the BSG by a binary companion, which fits in with the remnant optical flux seen in LBT and HST images and the roughly constant mid-IR source seen in Spitzer. From the three epochs during the episode of variability where the source is faintest, we derive an approximate period of 194 d. When we phase-fold the light curve by this period, we find that none of the earlier data points (when the source is consistently bright) land in the phase-space of the eclipse, meaning that the earlier data do not contradict this eclipse interpretation. However, with so little data, we cannot definitively say that these were eclipses.
5.3 Comparing new candidates to N6946-BH1
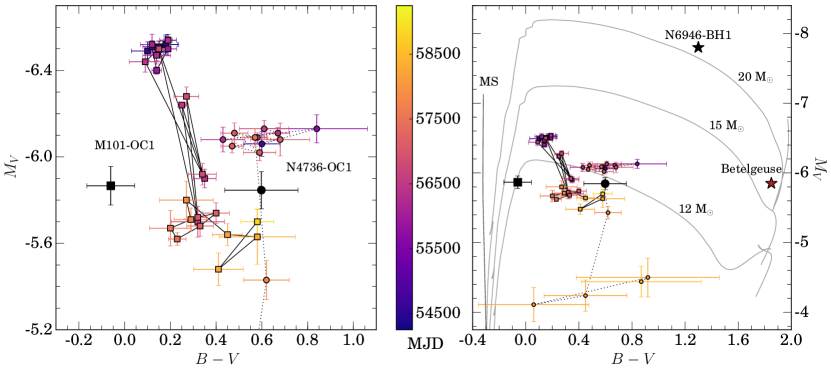
We show the evolution of N4736-OC1 and M101-OC1 in a color-magnitude diagram (CMD) in Figure 8. Since thse are based on estimates of the total flux, they are sensitive to issues like crowding. We also show estimates of the location in the CMD for the “disappearing star” of each source, shown as a black circle and square for N4736-OC1 and M101-OC1, respectively, based on the differential light curves. While the “disappearing star” of N4736-OC1 is nearly 2 mag more luminous than the late-time flux, the “disappearing star” of M101-OC1 is only 0.5 mag more luminous than the late-time flux, though it is significantly bluer. As proposed earlier in the paper, this late time flux could be interpreted as a redder binary companion or fallback accretion and also due to crowding caused by LBT’s resolution limit.
Overall, we can see that both of these sources are significantly bluer and fainter than N6946-BH1 and other RSGs. If we compare these “disappearing stars” to MIST (Dotter, 2016; Choi et al., 2016) stellar evolution tracks, both appear to lie along or near the track of a 12 star, which is less massive and less luminous than the 18–25 RSGs that are most commonly expected to become failed SNe. However, MIST tracks are constructed assuming a single star with no binary interactions, and, since there is at least some evidence for M101-OC1 having a companion, these single star evolution models may not be appropriate. Future analysis with binary evolution models (e.g., BPASS, Eldridge et al. 2017) may be possible with new data to constrain the remnant luminosity and spectral energy distribution.
6 Peculiar Stellar Variables
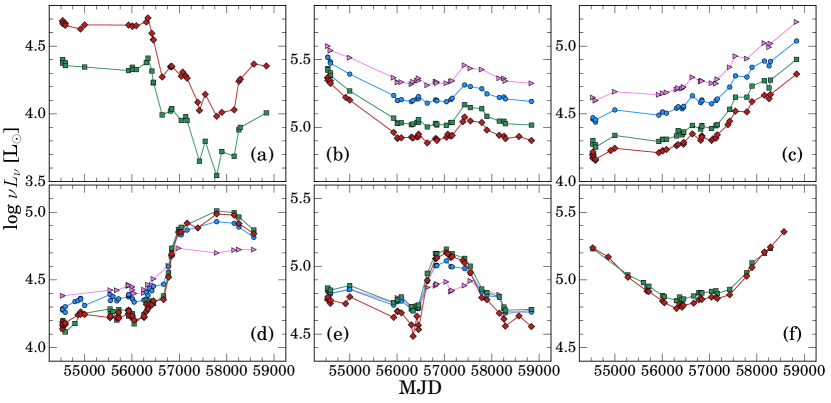
In our search for failed SNe, we examine the light curves of many luminous stars with peculiar long-term variability. In Figure 9, we show a sample of these variable sources. These sources slowly fade, brighten, or both, over the course of years. Some like source (c) change monotonically for over a decade, and some like source (f) exhibit more cyclic behavior. The amplitudes of these luminosity changes are large, ranging from factors of 3 to 10, often with little change in the color. This is significant, since LBVs usually show large changes in color.
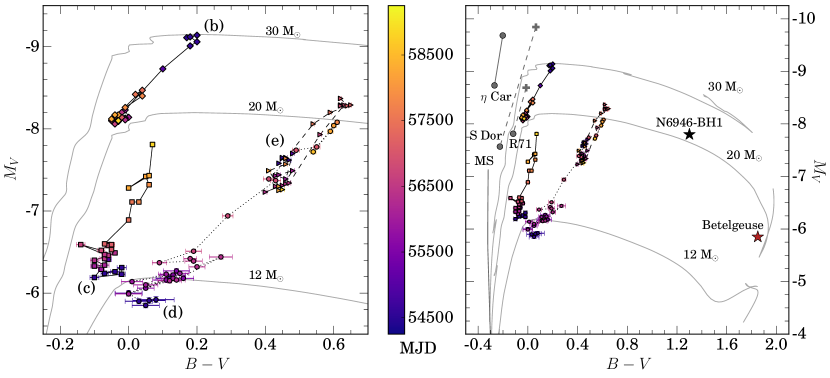
We show the evolution of these sources in the CMD in Figure 10 to better illustrate the changes in color. We also show the approximate locations in the CMD of well-studied LBVs in quiescence and in eruption (Humphreys & Davidson, 1994). Source (b) closely mirrors known LBVs S Doradus and R71 in evolution and in location on the CMD while sources (c), (d), and (e) appear too red and too faint to be LBVs. Because we ultimately reject N4736-OC1 as a failed SN, N4736-OC1 could be considered among these peculiar variables. For now, we simply note these stars as a potentially new and interesting type of variable.
7 Conclusions
We update the LBT search for failed SN survey using a baseline of 11 yr of data. We find:
-
Our analysis re-discovers the original failed SN candidate, N6946-BH1. We find two new “disappearing stars”, N4736-OC1 and M101-OC1, both of which are bluer and less luminous than N6946-BH1 and were not observed to produce a transient flare. While neither of our new candidates resemble N6946-BH1, these are both interesting and peculiar objects.
-
N4736-OC1 is possibly a post-AGB star. New LBT data from January and March 2021 show the source to have returned to near-peak brightness, and thus we reject the source as a candidate failed SN.
-
M101-OC1 is a very complicated source that is either a LBV that has become redder and less luminous by some unknown mechanism or a failed SN candidate with a fainter and redder binary companion. The evidence for the latter interpretation is the remnant optical flux seen by LBT and HST, the non-transient mid-IR flux seen by Spitzer, and the possible eclipses in the LBT light curve. While we favor this failed SN interpretation, more data from the ongoing LBT survey, HST, and JWST is needed confirm or reject M101-OC1 being a failed SN.
-
We present a small sample of peculiar, high-amplitude () long-timescale (decade) variable stars. These stars appear to represent some previously unrecognized variable class which requires further exploration.
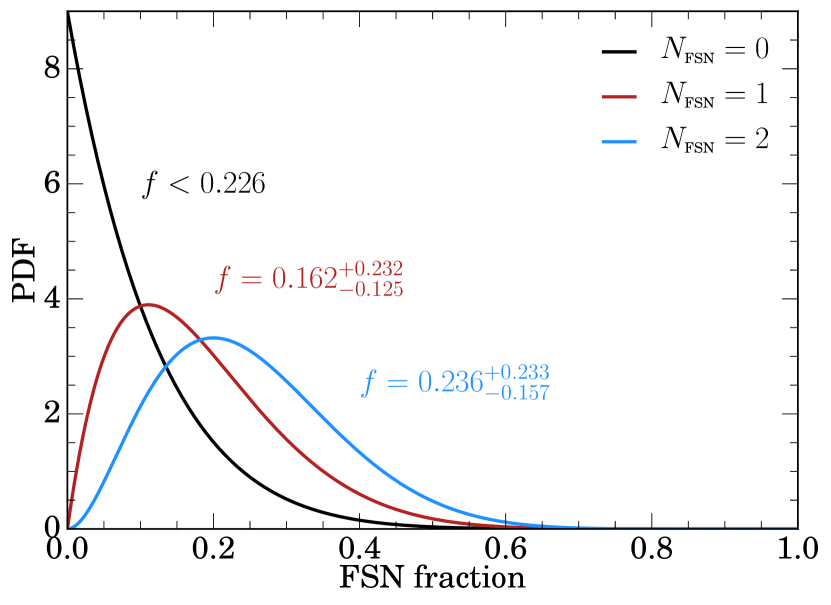
Finally, we can update the estimates from G15 and A17b for the fraction of core collapses which fail to produce SNe. The failed SN/core-collapse fraction, , is described by a binomial probability distribution function (PDF)
where and are the number of successful and failed ccSNe, respectively. In A17b, , but now, with the addition of SN 2016cok and SN 2017eaw, .
| Lower limit | Median | Upper limit | |
| 2 | 0.079 | 0.236 | 0.470 |
| 1 | 0.037 | 0.162 | 0.394 |
| 0 | 0.226 |
Notes: Limits are presented at the 90 per cent confidence level.
In Figure 11, we present the PDFs for the failed SN fraction given and . The case assumes that both M101-OC1 and N6946-BH1 are true failed SNe. The case assumes that only N6946-BH1 is a failed SN. For both cases, we calculate the median fraction as well as the 90 per cent confidence bounds and present them in Table 5. For the case, we calculate a median fraction111In A17b, the reported median fraction was 0.143, but this was actually the mode. The median for and is 0.201. of 0.162 with a 90 per cent confidence interval of . This is in line with estimates of 10–30 per cent that are based on missing RSG progenitors and the Galactic BH mass function (Kochanek, 2015). In comparison with the failed SN fraction reported in A17b using , this measurement represents a shrinking of the confidence interval by 7 percentage points. If all of the candidates are ultimately rejected, we generate an upper limit of at 90 per cent confidence, also presented in Table 5.
Future observations with the LBT are planned so as to continue the survey, detect new candidates, and constrain the failed SN fraction to better precision. Parallel observations will also be obtained with HST and the soon-to-be-launched JWST that will help analyze and confirm the candidates we have detected.
8 Acknowledgements
Financial support for this work was provided by NSF through grant AST-1814440. This work is based on observations made with the Large Binocular Telescope. The LBT is an international collaboration among institutions in the United States, Italy and Germany. LBT Corporation partners are: The University of Arizona on behalf of the Arizona Board of Regents; Istituto Nazionale di Astrofisica, Italy; LBT Beteiligungsgesellschaft, Germany, representing the Max-Planck Society, The Leibniz Institute for Astrophysics Potsdam, and Heidelberg University; The Ohio State University, representing OSU, University of Notre Dame, University of Minnesota and University of Virginia. This work also utilized observations made with the NASA/ESA Hubble Space Telescope, obtained from the data archive at the Space Telescope Science Institute. STScI is operated by the Association of Universities for Research in Astronomy, Inc. under NASA contract NAS 5-26555. This work is based in part on observations made with the Spitzer Space Telescope, which is operated by the Jet Propulsion Laboratory, California Institute of Technology under a contract with NASA.
Data availablity
The data underlying this article are available in the article and in its online supplementary material.
References
- Abbott et al. (2016a) Abbott B. P., et al., 2016a, Physical Review X, 6, 041015
- Abbott et al. (2016b) Abbott B. P., et al., 2016b, ApJ, 818, L22
- Adams & Kochanek (2015) Adams S. M., Kochanek C. S., 2015, MNRAS, 452, 2195
- Adams et al. (2016) Adams S. M., Kochanek C. S., Prieto J. L., Dai X., Shappee B. J., Stanek K. Z., 2016, MNRAS, 460, 1645
- Adams et al. (2017a) Adams S. M., Kochanek C. S., Gerke J. R., Stanek K. Z., Dai X., 2017a, MNRAS, 468, 4968
- Adams et al. (2017b) Adams S. M., Kochanek C. S., Gerke J. R., Stanek K. Z., 2017b, MNRAS, 469, 1445
- Ahn et al. (2012) Ahn C. P., et al., 2012, ApJS, 203, 21
- Alard (2000) Alard C., 2000, A&AS, 144, 363
- Alard & Lupton (1998) Alard C., Lupton R. H., 1998, ApJ, 503, 325
- Allan et al. (2020) Allan A. P., Groh J. H., Mehner A., Smith N., Boian I., Farrell E. J., Andrews J. E., 2020, MNRAS, 496, 1902
- Andrews et al. (2020) Andrews J. E., et al., 2020, arXiv e-prints, p. arXiv:2009.13541
- Annibali et al. (2008) Annibali F., Aloisi A., Mack J., Tosi M., van der Marel R. P., Angeretti L., Leitherer C., Sirianni M., 2008, AJ, 135, 1900
- Basinger et al. (2020) Basinger C. M., Kochanek C. S., Adams S. M., Dai X., Stanek K. Z., 2020, arXiv e-prints, p. arXiv:2007.15658
- Beasor et al. (2020) Beasor E. R., Davies B., Smith N., van Loon J. T., Gehrz R. D., Figer D. F., 2020, MNRAS, 492, 5994
- Belczynski et al. (2016) Belczynski K., Holz D. E., Bulik T., O’Shaughnessy R., 2016, Nature, 534, 512
- Bertin & Arnouts (1996) Bertin E., Arnouts S., 1996, A&AS, 117, 393
- Blagorodnova et al. (2017) Blagorodnova N., et al., 2017, ApJ, 834, 107
- Blanton & Roweis (2007) Blanton M. R., Roweis S., 2007, AJ, 133, 734
- Bloecker (1995) Bloecker T., 1995, A&A, 299, 755
- Burke et al. (2020) Burke C. J., et al., 2020, ApJ, 894, L5
- Chevalier (1982) Chevalier R. A., 1982, ApJ, 258, 790
- Choi et al. (2016) Choi J., Dotter A., Conroy C., Cantiello M., Paxton B., Johnson B. D., 2016, ApJ, 823, 102
- Clayton (2012) Clayton G. C., 2012, Journal of the American Association of Variable Star Observers (JAAVSO), 40, 539
- De Marco et al. (2002) De Marco O., Clayton G. C., Herwig F., Pollacco D. L., Clark J. S., Kilkenny D., 2002, AJ, 123, 3387
- Dolphin (2000) Dolphin A. E., 2000, PASP, 112, 1383
- Dopita et al. (2010) Dopita M. A., et al., 2010, Ap&SS, 330, 123
- Dotter (2016) Dotter A., 2016, ApJS, 222, 8
- Drozdovsky & Karachentsev (2000) Drozdovsky I. O., Karachentsev I. D., 2000, A&AS, 142, 425
- Duerbeck et al. (2000) Duerbeck H. W., et al., 2000, AJ, 119, 2360
- Ekström et al. (2012) Ekström S., et al., 2012, A&A, 537, A146
- Eldridge et al. (2017) Eldridge J. J., Stanway E. R., Xiao L., McClelland L. A. S., Taylor G., Ng M., Greis S. M. L., Bray J. C., 2017, Publ. Astron. Soc. Australia, 34, e058
- Ertl et al. (2016) Ertl T., Janka H. T., Woosley S. E., Sukhbold T., Ugliano M., 2016, ApJ, 818, 124
- Fernández et al. (2018) Fernández R., Quataert E., Kashiyama K., Coughlin E. R., 2018, MNRAS, 476, 2366
- Gerke et al. (2011) Gerke J. R., Kochanek C. S., Prieto J. L., Stanek K. Z., Macri L. M., 2011, ApJ, 743, 176
- Gerke et al. (2015) Gerke J. R., Kochanek C. S., Stanek K. Z., 2015, MNRAS, 450, 3289
- Goranskij et al. (2016) Goranskij V. P., et al., 2016, Astrophysical Bulletin, 71, 82
- Grammer et al. (2015) Grammer S. H., Humphreys R. M., Gerke J., 2015, AJ, 149, 152
- Groh et al. (2013) Groh J. H., Meynet G., Georgy C., Ekström S., 2013, A&A, 558, A131
- Hamuy (2003) Hamuy M., 2003, ApJ, 582, 905
- Herrmann et al. (2008) Herrmann K. A., Ciardullo R., Feldmeier J. J., Vinciguerra M., 2008, ApJ, 683, 630
- Herrnstein et al. (1999) Herrnstein J. R., et al., 1999, Nature, 400, 539
- Humphreys & Davidson (1979) Humphreys R. M., Davidson K., 1979, ApJ, 232, 409
- Humphreys & Davidson (1994) Humphreys R. M., Davidson K., 1994, PASP, 106, 1025
- Jacobs et al. (2009) Jacobs B. A., Rizzi L., Tully R. B., Shaya E. J., Makarov D. I., Makarova L., 2009, AJ, 138, 332
- Jayasinghe et al. (2021) Jayasinghe T., et al., 2021, arXiv e-prints, p. arXiv:2101.02212
- Johnson et al. (2017) Johnson S. A., Kochanek C. S., Adams S. M., 2017, MNRAS, 472, 3115
- Johnson et al. (2018) Johnson S. A., Kochanek C. S., Adams S. M., 2018, MNRAS, 480, 1696
- Jordi et al. (2006) Jordi K., Grebel E. K., Ammon K., 2006, A&A, 460, 339
- Kanbur et al. (2003) Kanbur S. M., Ngeow C., Nikolaev S., Tanvir N. R., Hendry M. A., 2003, A&A, 411, 361
- Karachentsev et al. (2000) Karachentsev I. D., Sharina M. E., Huchtmeier W. K., 2000, A&A, 362, 544
- Karachentsev et al. (2003) Karachentsev I. D., et al., 2003, A&A, 398, 479
- Karachentsev et al. (2004) Karachentsev I. D., Karachentseva V. E., Huchtmeier W. K., Makarov D. I., 2004, AJ, 127, 2031
- Karachentsev et al. (2006) Karachentsev I. D., et al., 2006, AJ, 131, 1361
- Kerzendorf et al. (2019) Kerzendorf W. E., et al., 2019, A&A, 623, A34
- Kochanek (2011) Kochanek C. S., 2011, ApJ, 743, 73
- Kochanek (2014) Kochanek C. S., 2014, ApJ, 785, 28
- Kochanek (2015) Kochanek C. S., 2015, MNRAS, 446, 1213
- Kochanek (2018) Kochanek C. S., 2018, MNRAS, 473, 1633
- Kochanek et al. (2008) Kochanek C. S., Beacom J. F., Kistler M. D., Prieto J. L., Stanek K. Z., Thompson T. A., Yüksel H., 2008, ApJ, 684, 1336
- Kochanek et al. (2017) Kochanek C. S., et al., 2017, MNRAS, 467, 3347
- Kochanek et al. (2019) Kochanek C. S., Auchettl K., Belczynski K., 2019, MNRAS, 485, 5394
- Li et al. (2011) Li W., et al., 2011, MNRAS, 412, 1441
- Lovegrove & Woosley (2013) Lovegrove E., Woosley S. E., 2013, ApJ, 769, 109
- Lu et al. (2016) Lu J. R., Sinukoff E., Ofek E. O., Udalski A., Kozlowski S., 2016, ApJ, 830, 41
- Maitra et al. (2019) Maitra C., et al., 2019, MNRAS, 490, 5494
- Milisavljevic et al. (2012) Milisavljevic D., Fesen R. A., Chevalier R. A., Kirshner R. P., Challis P., Turatto M., 2012, ApJ, 751, 25
- Nadezhin (1980) Nadezhin D. K., 1980, Ap&SS, 69, 115
- Nadyozhin (1994) Nadyozhin D. K., 1994, ApJS, 92, 527
- O’Connor & Ott (2011) O’Connor E., Ott C. D., 2011, ApJ, 730, 70
- Pejcha & Thompson (2015) Pejcha O., Thompson T. A., 2015, ApJ, 801, 90
- Poznanski et al. (2009) Poznanski D., et al., 2009, ApJ, 694, 1067
- Reynolds et al. (2015) Reynolds T. M., Fraser M., Gilmore G., 2015, MNRAS, 453, 2885
- Sana et al. (2012) Sana H., et al., 2012, Science, 337, 444
- Seitenzahl et al. (2014) Seitenzahl I. R., Timmes F. X., Magkotsios G., 2014, ApJ, 792, 10
- Shappee & Stanek (2011) Shappee B. J., Stanek K. Z., 2011, ApJ, 733, 124
- Smartt (2015) Smartt S. J., 2015, Publ. Astron. Soc. Australia, 32, e016
- Smartt et al. (2009) Smartt S. J., Eldridge J. J., Crockett R. M., Maund J. R., 2009, MNRAS, 395, 1409
- Stetson (1987) Stetson P. B., 1987, PASP, 99, 191
- Sukhbold & Woosley (2014) Sukhbold T., Woosley S. E., 2014, ApJ, 783, 10
- Sukhbold et al. (2016) Sukhbold T., Ertl T., Woosley S. E., Brown J. M., Janka H. T., 2016, ApJ, 821, 38
- Szczygieł et al. (2012) Szczygieł D. M., Gerke J. R., Kochanek C. S., Stanek K. Z., 2012, ApJ, 747, 23
- Theureau et al. (2007) Theureau G., Hanski M. O., Coudreau N., Hallet N., Martin J. M., 2007, A&A, 465, 71
- Thim et al. (2004) Thim F., Hoessel J. G., Saha A., Claver J., Dolphin A., Tammann G. A., 2004, AJ, 127, 2322
- Thompson et al. (2019) Thompson T. A., et al., 2019, Science, 366, 637
- Tisserand et al. (2009) Tisserand P., et al., 2009, A&A, 501, 985
- Tisserand et al. (2020) Tisserand P., et al., 2020, A&A, 635, A14
- Tonry et al. (2001) Tonry J. L., Dressler A., Blakeslee J. P., Ajhar E. A., Fletcher A. B., Luppino G. A., Metzger M. R., Moore C. B., 2001, ApJ, 546, 681
- Ugliano et al. (2012) Ugliano M., Janka H.-T., Marek A., Arcones A., 2012, ApJ, 757, 69
- Verdes-Montenegro et al. (2000) Verdes-Montenegro L., Bosma A., Athanassoula E., 2000, A&A, 356, 827
- Willick et al. (1997) Willick J. A., Courteau S., Faber S. M., Burstein D., Dekel A., Strauss M. A., 1997, ApJS, 109, 333
- Woosley (2016) Woosley S. E., 2016, ApJ, 824, L10
Appendix
| MJD | err | err | … | err | ||||||||
|---|---|---|---|---|---|---|---|---|---|---|---|---|
| 54535.4 | 22.32 | -6.30 | 0.04 | 14318.39 | … | |||||||
| 54859.4 | 22.38 | -6.24 | 0.05 | 13604.59 | 22.57 | -6.06 | 0.06 | 15894.51 | 23.19 | … | 0.33 | 2512.2 |
| 54916.4 | 22.22 | -6.40 | 0.06 | 15680.30 | 22.95 | … | 0.26 | 6450.57 | ||||
| … | … | … | … | … | … | … | … | … | … | … | … | … |
| 58258.3 | 23.53 | -5.09 | 0.07 | 4715.36 | 24.19 | -4.44 | 0.22 | 3577.2 | 25.07 | … | 0.32 | 1781.09 |
Notes: Full data is available as supplementary material as a machine-readable table.
| MJD | err | err | … | err | ||||||||
|---|---|---|---|---|---|---|---|---|---|---|---|---|
| 54534.5 | 22.40 | -6.66 | 0.04 | 19975.47 | 22.54 | -6.52 | 0.04 | 24404.58 | 22.73 | … | ||
| 54535.5 | 22.42 | -6.64 | 0.03 | 19613.66 | 22.52 | -6.54 | 0.03 | 24776.21 | 22.72 | … | 0.03 | 38315.53 |
| 54536.5 | 22.40 | -6.66 | 0.02 | 20022.80 | 22.54 | -6.52 | 0.04 | 24371.69 | 22.73 | … | ||
| … | … | … | … | … | … | … | … | … | … | … | … | … |
| 58838.5 | 23.14 | -5.92 | 0.05 | 10092.65 | 23.37 | -5.70 | 0.06 | 11376.49 | 23.95 | … | 0.20 | 4495.01 |
Notes: Full data is available as supplementary material as a machine-readable table.