Anomalous Angiogenesis in Retina
Abstract
Age-related macular degeneration (AMD) may cause severe loss of vision or blindness particularly in elderly people. Exudative AMD is characterized by angiogenesis of blood vessels growing from underneath the macula, crossing the blood-retina barrier (that comprise Bruch’s membrane, BM, and the retinal pigmentation epithelium RPE), leaking blood and fluid into the retina and knocking off photoreceptors. Here, we simulate a computational model of angiogenesis from the choroid blood vessels via a cellular Potts model, as well as BM, RPE cells, drusen deposits and photoreceptors. Our results indicate that improving AMD may require fixing the impaired lateral adhesion between RPE cells and with BM, as well as diminishing Vessel Endothelial Growth Factor (VEGF) and Jagged proteins that affect the Notch signaling pathway. Our numerical simulations suggest that anti-VEGF and anti-Jagged therapies could temporarily halt exudative AMD while addressing impaired cellular adhesion could be more effective on a longer time span.
I Introduction
Among diseases that cause disability but not substantial mortality, age-related macular degeneration (AMD) may cause severe loss of vision or blindness in many people, particularly the elderly. Wong et al have projected that 196 million people will be affected by age-related macular degeneration in 2020, increasing to 288 million by 2040 won14 , which is likely an underestimation jon14 . Exudative or wet AMD is characterized by a breakdown of the blood-retina barrier: blood vessels grow from underneath the macula and leak blood and fluid into the retina jag08 ; niv14 . These blood vessels and their leaking may form scars leading to permanent loss of central vision. Diagnosis of wet AMD niv14 has improved with important non invasive techniques such as optical coherence tomography man10 ; cos15 or, quite recently, transscleral optical phase imaging laf20 . The retina contains many membranes and tissue layers that make imaging cells and understanding pathologies difficult. The growth of blood vessels in the retina is well documented in pathological cases, such as wet AMD, and in normal cases, such as retinal vascularization in fetuses and newborns GG05 ; fru07 ; sco10 ; sel18 . In these cases, blood vessels grow out of a primary vessel, which is a complex multiscale process called angiogenesis. Retinal angiogenesis adds a complex geometry to the process.
Normal angiogenesis determines organ growth and regeneration, wound healing, repair of tissues, etc GG05 ; fru07 ; sco10 ; sel18 ; car05 ; CT05 ; car11 ; ton00 ; fig08 . In these processes, tissue inflammation may occur and cells may experience hypoxia. Then they may activate signaling pathways leading to secretion of pro-angiogenic proteins, such as Vessel Endothelial Growth Factor (VEGF). VEGF diffuses in the tissue, binds to extracellular matrix (ECM) components and forms a spatial concentration gradient in the direction of hypoxia. In retinal vascularization, astrocyte neurons issuing from the optical nerve form a network and locally secrete VEGF fru07 ; sco10 ; sel18 . VEGF molecules that reach an existing blood vessel diminish adhesion of its cells and activate the tip cell phenotype in endothelial cells (ECs) of the vessel through the Notch signaling pathway. Tip cells grow filopodia with many VEGF receptors, pull the other ECs, open a pathway in the ECM, lead the new sprouts, and migrate in the direction of increasing VEGF concentration ger03 . Branching of new sprouts occurs as a result of signaling and mechanical cues between neighboring ECs hel07 ; jol15 ; pag19 ; veg20 . ECs in growing sprouts alter their shape to form a lumen connected to the initial vessel that is capable of carrying blood geb16 . Sprouts meet and merge in a process called anastomosis to improve blood circulation inside the new vessels. Poorly perfused vessels may become thinner and their ECs, in a process that inverts angiogenesis, may retract to neighboring vessels leading to a more robust blood circulation fra15 . Thus, the vascular plexus remodels into a highly organized and hierarchical network of larger vessels ramifying into smaller ones szy18 . In normal processes of wound healing or organ growth, the cells inhibit the production of growth factors when the process is finished.
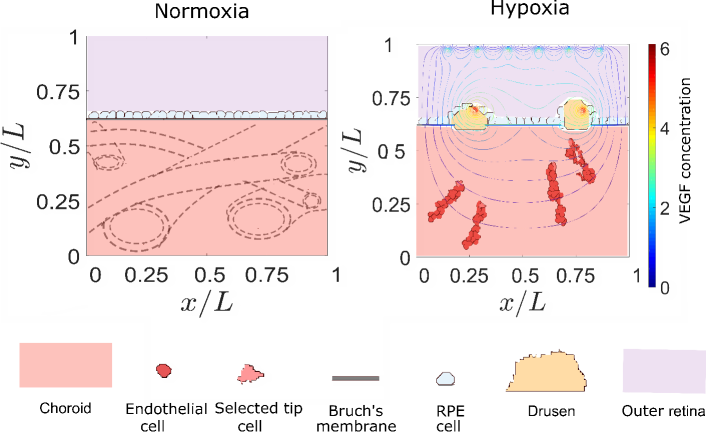
Pathological angiogenesis changes the previous picture in important ways. For example, hypoxic tumor cells produce VEGF that induces angiogenesis, interfere with Notch signaling and promotes tumor growth duf08 . In wet AMD, negative control mechanisms are breached, angiogenic sprouts issue from choroid blood vessels, cross Bruch’s membrane (BM), pass retinal pigment epithelium (RPE) cells and knock down photoreceptors producing loss of central vision sel18 . Under normal circumstances, oxygen and nutrients diffuse from the choroid vascular layer through the thin BM and the layer of RPE cells to reach photoreceptors. Inversely, RPE process photoreceptor debris, including shed photoreceptor outer segments, pass it through BM, and the debris is removed by the choriocapillaries in the choroid; see the left panel of Fig. 1. With age, BM becomes thicker and a variety of factors such as oxidative stress, immune activation, genetic constitution and local anatomy of the neural retina, RPE and BM may affect the ability of the latter to process debris. Lipid deposits called drusen may form on different layers of BM and the RPE boo10 . Calcification of BM also diminishes the adhesion of RPE cells. Damage to RPE cells and their loss is compensated by the same wound healing mechanism as in other epithelial cells. However, this process is impaired in AMD tissues boo10 . Drusen deposits thicken BM and create a barrier that interferes with the normal situation. They decrease the diffusion of oxygen and nutrients from the choroid to the photoreceptors and the RPE in one direction, and decrease the removal of debris by the choriocapillaries into the other direction mam20 . While this dry AMD produces some loss of vision (severe in the case of geographical atrophy of RPE geh06 ), it also leads to relative hypoxia within retinal layers. In response, the RPE secrete proangiogenic factors, such as VEGF and vasculogenic and inflammatory cytokines, that go into the choroidal space. This may start angiogenesis thereby producing choroidal neovascularization (CNV); see the right panel of Fig. 1. CNV vessel sprouts may penetrate BM and remain underneath the RPE layer (type 1 or ‘occult’ CNV), or surpass it and go through the outer retina (type 2 or ‘classic’ CNV). In the later condition, sprouts may leak blood and fluid that eventually produce scars and the death of photoreceptors, which signals the wet phase of AMD geh06 ; see also sketch in Fig. 1 of Ref. mam20 . During AMD, RPE cells degenerate, lose their characteristic epithelial morphology and function, enabling their migration into the retina and the sub-RPE space rad15 . These cells may have undergone a reversible Epithelial-to-Mesenchymal Transition (EMT), detach themselves from the RPE and migrate to survive the adverse environment during AMD shu20 . The loss of RPE cells due to the EMT and the similar transformation of endothelial cells to a motile phenotype during angiogenesis are very important factors in wet AMD shu20 . In this disease, the process of RPE detachment and dissociation is crucial, and the initiation of the EMT requires the disruption of RPE cell-cell contact tam10 .
We have just sketched the complexity of the retinal structures involved in AMD. While there are many mathematical and computational models describing the development of retinal vascularization, less work has been devoted to such models for AMD; see e.g., rob16 . Early modeling research on CNV focus on relating the blood flow in the CNV to that in the underlying choriocapillaries in an appropriate two dimensional (2D) geometry flo01 . Darcy’s law for a porous medium is used to model flow in choriocapillaries and in blood vessels that connect them to the CNV. Changes in the flow in the connecting vessels strongly influence the flow through the CNV and controling the connecting vessels may be used to block the flow in the CNV, with beneficial effects for wet AMD flo01 . A similar idea but using the incompressible Navier-Stokes equation has been recently used to study drug delivery across the blood-retina barrier dav20 . These studies consider fixed choroid and CNV networks, ignoring the development and progression of the latter. To account for the formation and expansion of the CNV, Shirinifard et al have used a 3D cellular Potts model of the choroid and outer retina shi12 . They conclude that failures in cellular adhesion determine the formation and expansion of CNV. Cells include tip and stalk ECs, cells at RPE and BM, photoreceptor cell outer and inner segments, ECM and fluid regions. Continuum equations model media surrounding cells, VEGF, oxygen and matrix metalloproteinases and are coupled to the Potts hamiltonian that is updated using a modified Metropolis algorithm. EC chemotaxis and haptotaxis are implemented. Stalk cells may increase their volume and proliferate, BM cells may decrease their volume and die. Different cells have different adhesion parameters. The model does not include blood flow, signaling pathways and change of EC phenotype, or drusen shi12 .
Here we use a 2D Potts model that includes EC Notch signaling, chemotaxis, haptotaxis and durotaxis veg20 to ascertain the influence of these mechanisms on AMD. We consider the simple geometry sketched in Fig. 1: a square domain in which BM separates the choroid crisscrossed by blood vessels, which may issue angiogenic sprouts, from RPE cells, eventual drusen and a subretinal space on top of which there are photoreceptors. The choroid vessels may issue sprouts at randomly chosen points provided the VEGF concentration surpasses some threshold in those points. The growth of drusen above RPE cells turns on VEGF sources that attract the sprouts issued from the choroid vessels to them. Once ECs have crossed BM, they either form subRPE type 1 CNV or subretinal type 2 CNV. Type 1 CNV occurs if the sprouts form a network between BM and the RPE cells, whereas type 2 CNV occurs if the sprouts succeed moving beyond the RPE layer and towards the VEGF emitting photoreceptors. We find that adhesion between RPE cells, between ECs, and between RPE cells and BM decides whether angiogenic sprouts succeed in invading the subRPE space or the subretinal space, thereby producing type 1 or 2 CNV, respectively. We study how local VEGF gradients and Notch signaling proteins affect CNV in presence of drusen and defects in BM. Notch signaling dynamics confirms that CNV is an example of pathological angiogenesis with thin and leaky capillary sprouts veg20 .
II Materials and Methods
To describe angiogenesis in the retina, we need a model able to describe cellular processes at cellular and subcellular sizes. The cellular Potts model (CPM) gra92 is particularly useful at these scales, as it incorporates in a natural way constraints for the volume, area or length of the cells, as well as adhesion between cells or with the extracellular matrix (haptotaxis) shi12 ; gra92 . Attraction due to chemical gradients (chemotaxis) bau07 or to substrate stiffness gradients (durotaxis)oer14 have also been added to CPMs. Strains in the cells together with the unsupervised K-means algorithm can be used to implement branching of growing sprouts veg20 . The phenotype of leading tip cells or follower stalk cells is decided by the Notch signaling pathway, and the corresponding dynamics boa15 can also be incorporated to the CPM veg20 .
II.1 Cellular Potts model
In our simulations, we consider different entities: the choroid, Bruch’s membrane, Retinal Pigmented Epithelium cells, endothelial cells, extracellular matrix, photoreceptors, and drusen. We ignore the outer segments of photoreceptors and their dynamics. Thus, there is a free space between the RPE layer and the photoreceptors. We fix the number of drusen, and of RPE cells, whereas the number of ECs varies. Different cells comprise a number of elementary squares or pixels in a square domain of side (in numerical simulations, m). See Appendix A for the precise labels (or spins) of pixels belonging to different cells. For each pixel configuration, we define the Hamiltonian
| (1) | |||||
where the three first terms are sums over cells. These terms impel them to reach target areas, perimeters and lengths with strengths given by their Potts parameters , and . Numerical values of target areas , perimeters , and lengths can be found in Table 1. The fourth term (haptotaxis) sums over all pixels and accounts for adhesion between elements. It is zero for pixels belonging to the same cell and calibrates the repulsion between pixels belonging to different cells (adhesion is stronger for smaller repulsion), depending on the value of the corresponding Potts parameter . The fifth and sixth terms correspond to durotaxis and chemotaxis, impelling cells to move toward gradients of stiffness and VEGF concentration, respectively veg20 . See also Appendix A. At each Monte Carlo time step (MCTS) , we select randomly a pixel , belonging to object , and propose to copy its spin to a neighboring (target) pixel that does not belong to . The proposed change in the spin configuration (spin flip) changes the configuration energy by an amount , and it is accepted with probability (Metropolis algorithm) gra92 ; oer14 . BM does not change throughout the simulation. Thus, Monte Carlo (MC) attempts involving or are discarded. An appropriate temperature for our simulations is .
| Param. | |||||||
|---|---|---|---|---|---|---|---|
| Value | 78 m2 | 50 m | 60 m | 169 m2 | 52 m | 2827 m2 | 188 m |
II.2 Continuum fields at the extracellular scale
VEGF concentration.
The VEGF concentration obeys the following initial-boundary value problem bau07 :
| (2a) | |||
| (2b) | |||
| (2c) | |||
| (2d) | |||
where are the points in which BM is located with the corresponding holes. In Eq. (2a), the amount of VEGF bound by an EC per unit time is
| (3) |
where , mm2/h, h, (corresponding to 50 ng/mL for a sample having a 10 m height ari11 ; sug15 ), and is the maximum amount of VEGF that it could be consumed by a cell per hour man04 ; bau07 ; veg20 . In eq. (2a), the VEGF source due to the hypoxia caused by drusen and photoreceptors is
| (4) |
Here the coefficient is the amplitude, or is the center and are the x and y spreads of the blob, . After a sprout arrives nearby a drusen, the surrounding region ceases to be hypoxic, therefore the corresponding Gaussian of the first summation disappears from .
Durotaxis.
ECs generate mechanical strains in the substrate, perceive a stiffening of the substate along the strain orientation, and extend preferentially on stiffer substrate. The simulated ECs spread out on stiff matrices, contract on soft matrices, and become elongated on matrices of intermediate stiffness oer14 . Strains enter the durotaxis term in the Hamiltonian (1), cf Appendix A and Refs. oer14 ; veg20 .
II.3 Signaling processes and cell dynamics
A crucial distinction between ECs is that between tip and stalk phenotypes. Tip cells are highly motile, do not proliferate, act as leaders of angiogenic sprouts, sense chemical gradients and advance towards VEGF sources produced by hypoxic cells. Stalk cells proliferate and are less motile, often following tip cells. The tip-stalk cell phenotype is selected by the Notch signaling communication pathway, which is quantified by model differential equations explained in Appendix B. The unknowns in these equations are the Notch, Delta-4, and Jagged-1 proteins in a cell, and the number Notch intracellular domain and VEGF molecules and of VEGF receptors in the cell. The phenotype of a cell is decided by whether the number of its VEGF molecules surpasses appropriate thresholds boa15 . See the precise criterion in Ref. veg20 and in Appendix B. This means that stalk cells may become tip cells and vice versa. There are also hybrid stalk-tip cells that can lead thinner angiogenic sprouts boa15 ; veg20 . Advancing blood vessels may undergo branching, thereby creating new sprouts, and fuse with existing vessels (anastomosis). The details are explained in Ref. veg20 and Appendix B.
II.4 Retinal configuration and onset of angiogenesis
We consider a simplified configuration for the space (measuring about m) between the choroid and the photoreceptors as sketched in Fig. 1. The choroid contains several layers comprising blood vessels of different sizes, including narrow capillaries. In a 2D section, choriocapillaries oriented in different directions may issue angiogenic sprouts that are then attracted towards openings in BM and the RPE layer. Instead of modeling the fixed choriocapillaries (parent vessels) issuing new blood vessels, we randomly generate a fixed number of points that may initiate sprouts and establish an external VEGF activation threshold for the sprouts to start. The parent vessels are randomly placed at the rectangle , m and the concentration of external VEGF satisfies Eqs. (2). The m wide BM is a segment placed at m man10 ; bai17 and it is followed by RPE cells with interspersed drusen, which have Gaussian sources of VEGF representing hypoxic areas. These sources placed at m are farther than 100 m from the choriocapillaries, which is consistent with the criterion for hypoxia to occur. New sprouts grow from the initial points only if the external VEGF concentration in them is larger than a threshold. The described CPM causes the sprouts to advance toward the drusen and they may or may not pass BM and RPE attracted by the VEGF sources at the photoreceptors.
After the CPM simulation begins, we need a criterion for RPE cells and photoreceptors to become hypoxic and issue VEGF. During the first hundreds of MCTS, RPE cells and drusen grow to acquire their target size friberg12 ; shi12 . Once a drusen reaches forty percent of its target size, it produces a hole in BM, the RPE cells around it become hypoxic and start producing VEGF. The VEGF source associated with drusen is represented by a Gaussian function centered at . This process also activates sources of VEGF associated with photoreceptors equally spaced on the axis at m. We ignore the photoreceptors outer segments and their dynamics. As in the case of the sources associated with drusen, these VEGF sources are represented by Gaussian functions centered at m) poh20 . The holes divide BM into pieces. Once VEGF sources are activated, new sprouts can start from the parent vessels at their predetermined sites if the external VEGF concentration there surpasses the activation threshold. VEGF sources stop emitting it when they are reached by ECs.
III Results
Different adhesion parameters between ECs, and between RPE and BM cells characterize haptotaxis, which, together with VEGF gradients, determine the formation and type of CNV shi12 . In addition to confirming impaired lateral adhesion between BM and RPE and between RPE cells themselves as major drives of CNV, we explore how adhesion between ECs, chemotaxis and Notch signaling affect CNV. We find that Notch signaling proteins are markers of the CNV type that develops during AMD and decreasing the production of Jagged-1 may prevent type 2 CNV.
III.1 Impaired adhesion
Adhesion defects modify the pattern of choroidal neovascularization in the retina shi12 . The adhesion Potts parameter measures the energetic cost for cells to stay together: it is zero for pixels of the same cell and it is larger for pixels of different cells. The larger the Potts parameter between pixels of different cells is, the stronger these neighboring cells repel each other (thereby meaning weaker adhesion among them). Thus, impared adhesion among cells implies that the corresponding Potts parameter has increased with respect to the normal adhesion values. We now consider the effect that modifying Potts parameters for different cell types has on the formation and type of CNV.
III.1.1 Adhesion between RPE and BM
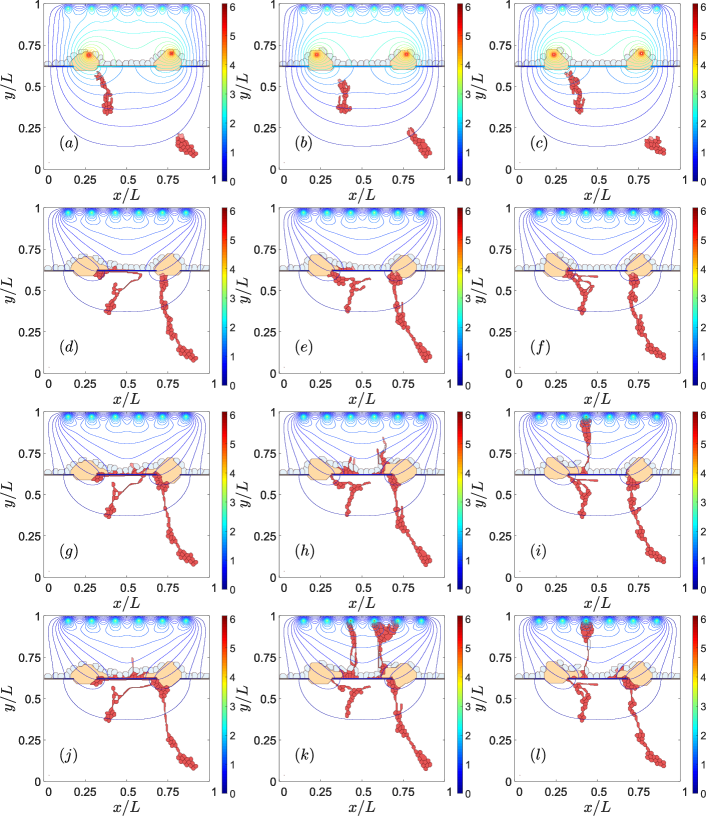
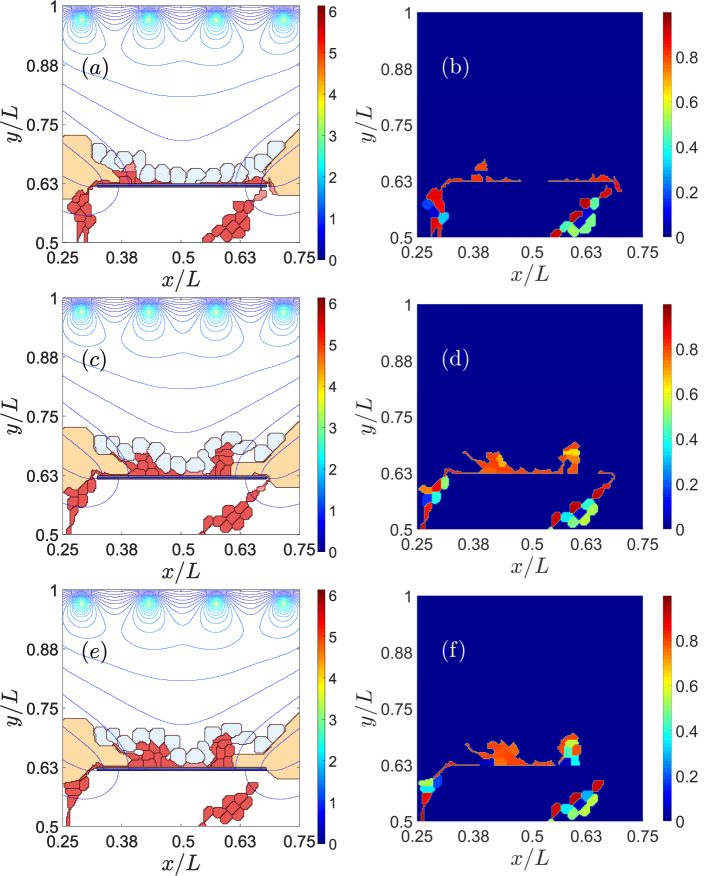
Reducing the adhesion between the basement membrane of the RPE and BM may enable CNV to invade the sub-RPE space shi12 ; vamsi05 . As chemotaxis attracts vessel sprouts towards sites with higher VEGF concentration beyond the RPE, vessels may cross this layer at sites where adhesion is weakest, e.g., near drusen. If adhesion between RPE and BM is weak (large Potts parameter), ECs move easily in the space between them, thereby producing type 1 CNV, as observed in the left panels of Fig. 2. If the Potts parameter decreases (central and right panels of Fig. 2), the adhesion between RPE and BM increases. ECs then try to surpass the RPE near the drusen that have opened a hole in BM. Eventually, the sprouts reach the subretinal space, whereby producing type 2 CNV. The resulting CNV does not form a dense network of blood vessels between RPE and BM.
III.1.2 RPE - RPE & EC - EC adhesion
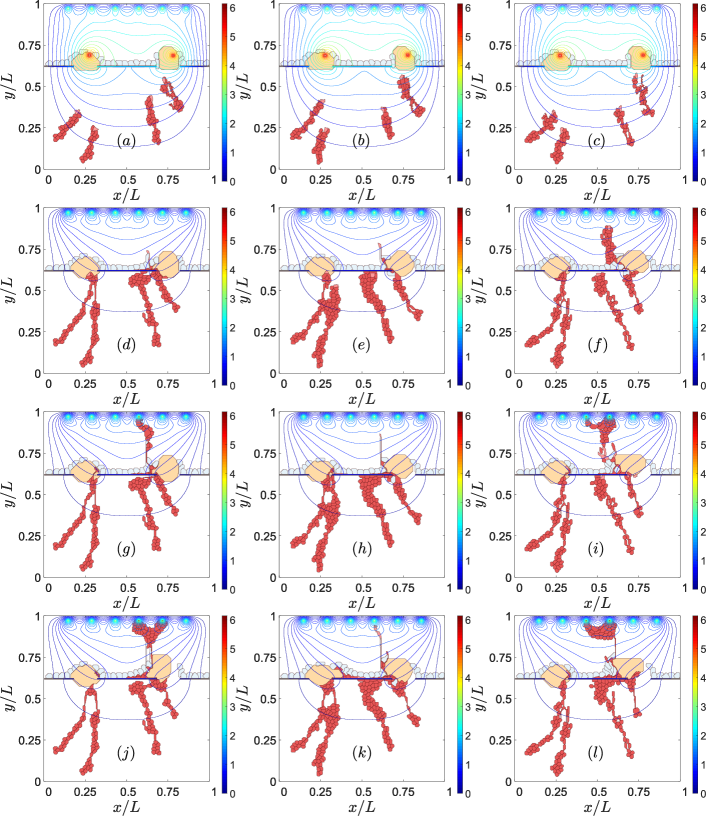
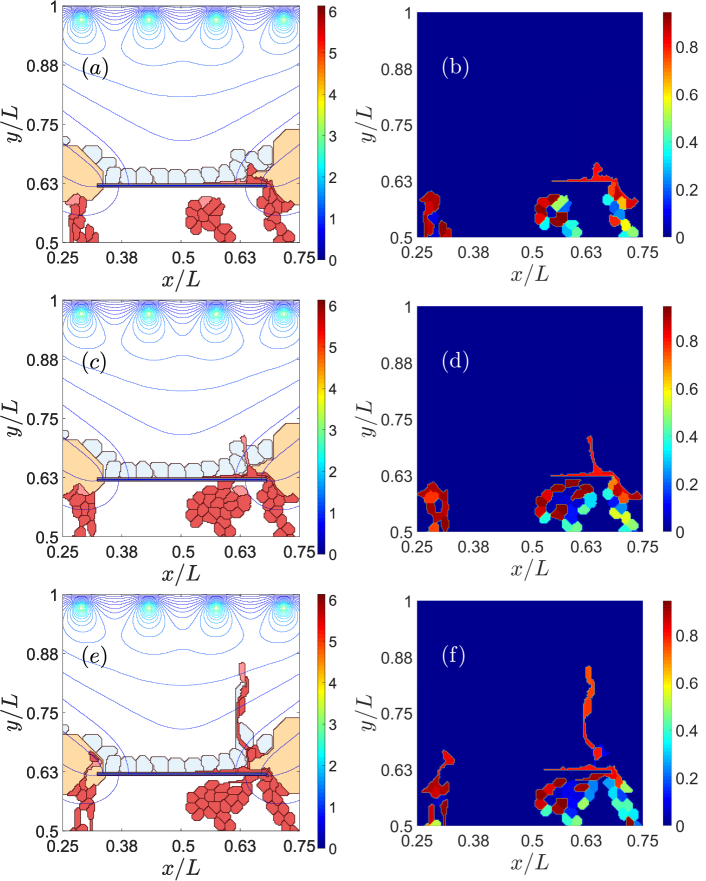
Impaired lateral adhesion between RPE cells facilitates type 2 CNV imamura05 ; simo10 . ECs and the sprouts they generate are able to penetrate the RPE layer effortlessly, as shown in the left column of Fig. 3. Stronger adhesion between cells in RPE makes it difficult for sprouts to cross the layer, thereby favoring type 1 over type 2 CNV, as shown in the middle column of Fig. 3.
While adhesion between endothelial cells affects the quality of the resulting blood vessels ramos18 , it also influences the resulting type of CNV, cf the middle and right columns of Fig. 3. Reduced adhesion between ECs has the consequences displayed on the right column of Fig. 3: ECs are able to intersperse RPE cells and drusen to change quickly from type 1 to type 2 CNV. This produces blood vessels of poorer quality. Strong EC-EC adhesion makes it difficult for the sprout to pass through RPE cells since the ECs have to disconnect from their EC neighbors to cross the RPE, as shown by the middle column of Fig. 3.
To sum up, Fig 3 shows that we can favor type 1 CNV and prevent type 2 CNV by making stronger the adhesion between cells in RPE (from left column to middle column). In addition, if the adhesion between ECs weakens, poor quality sprouts will pass RPE layer and produce type 2 CNV (from middle column to right column).
III.2 Sources of VEGF
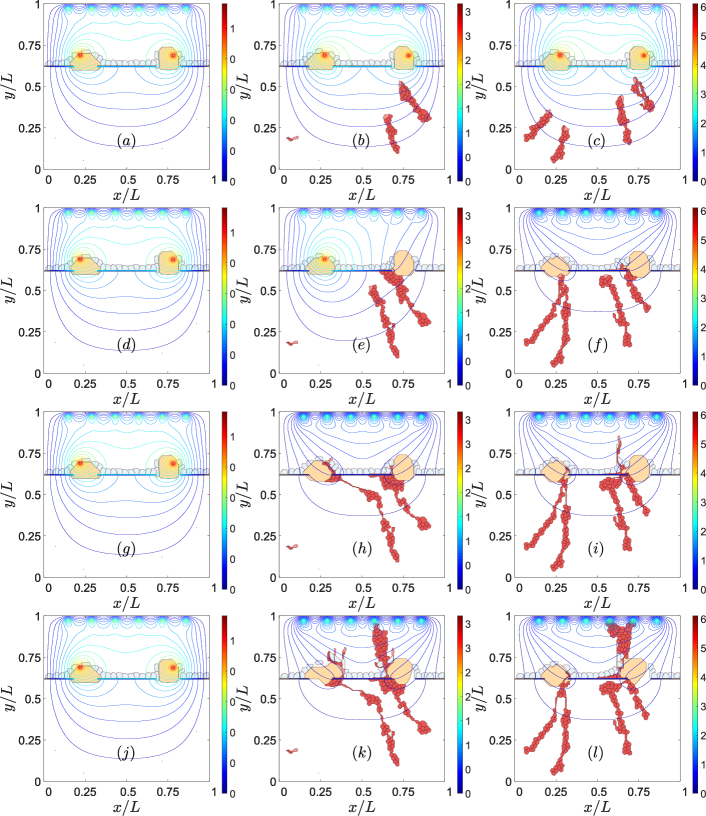
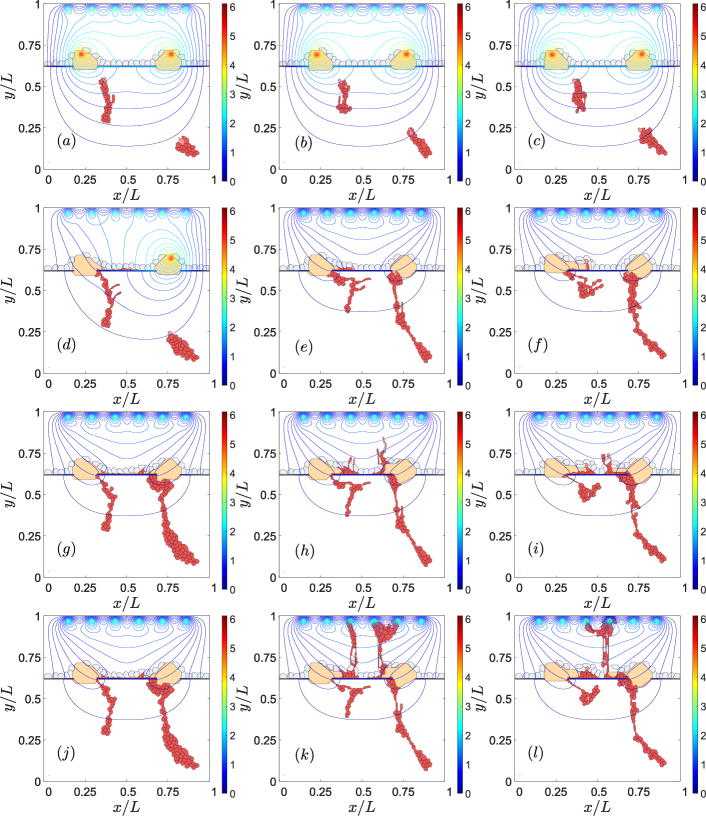
High levels of VEGF concentration generated by sources produce large VEGF gradients that drive sprouts, therefore being one chief cause of CNV bhutto06 . This is illustrated by Fig. 4. The VEGF concentration at the sources in this figure increases from the left column to the middle and right ones, whereas time as measured by MCTS increases from top to bottom. If the level of VEGF is too low, the ECs at the walls of the choroid vessels do not have enough VEGF to activate and start to develop a sprout, as shown on the left column of Fig. 4. Medium and high levels of VEGF concentration produce CNV, cf middle and right column of Fig. 4. On the middle column of this figure, only two of the four possible choroid vessels that emit sprouts have been activated, whereas all four sites have been activated on the right column of Fig. 4. The subsequent larger chemotaxis causes the sprouts to reach the let drusen earlier on the right column of Fig. 4 than on its middle column. The larger levels of VEGF favor the faster evolution from type 1 to type 2 CNV shown on the right column of Fig. 4.
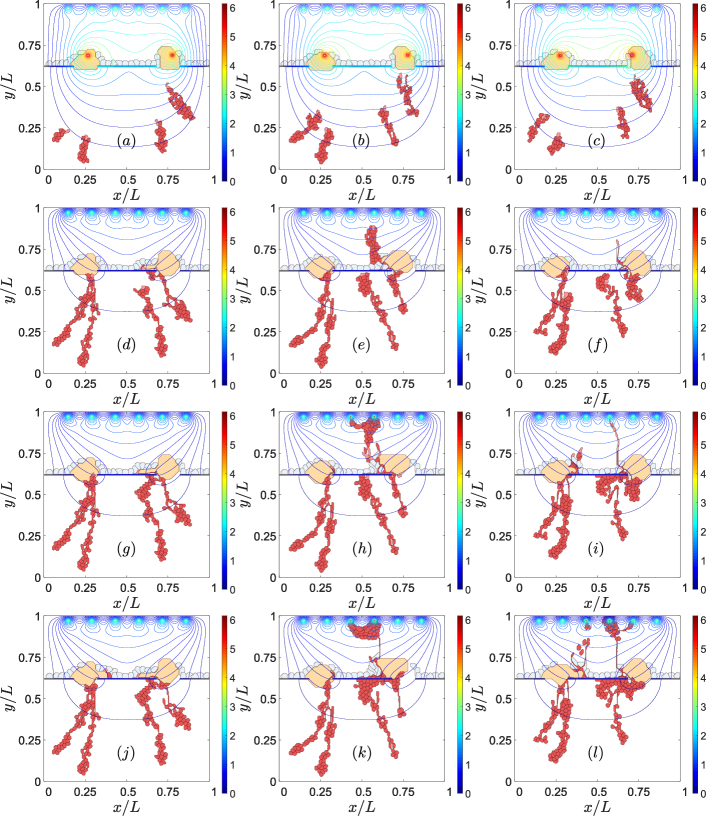
The value of the VEGF gradient at the point where the sprout tries to cross the RPE determines the sprout chances of starting type 2 CNV. The VEGF concentration throughout the domain and the parameter values are the same for Figs. 5 and 6, which have a different seed of the random number generator that determines the sprout initiation points. The local VEGF gradient at the point where the sprouts are closest to the end of the RPE is larger for Fig. 6 than for Fig. 5. The larger chemotactic force experienced by the leading EC implies that type 2 CNV is produced in Fig. 6 while only type 1 CNV is observed in Fig. 5. The right columns of figures 5 and 6 depict the number of active VEGF receptors at the times corresponding to panels on the left columns. It is clear that the number of active VEGF receptors is larger when there is successful type 2 CNV, as in Fig. 6, as compared with type 1 CNV as in Fig. 5. Having the same adhesion and VEGF concentration do not determine the type of CNV. The setup of the parent vessels in the choroid may generate different CNV outcomes.
III.3 Notch signaling
While Figs. 5 and 6 show the effect of active VEGF receptors on retinal CNV, other proteins involved in the Notch signaling pathway may characterize the resulting CNV network.
Jagged and Delta dynamics determine sprouting veg20 , therefore also CNV. The thresholds of Delta concentration of cells to change the phenotype depend on the Jagged production rate . The simulations shown previously have a Jagged production rate, , and a Delta production rate, . The chosen values correspond to pathological angiogenesis veg20 , which is the most similar scenario to type 2 CNV. Figs. 7 and 8 show the effect of decreasing in the left column and increasing in the right column from the reference simulation placed in the middle of the figures. The reference simulation in Fig. 7 is the one corresponding to middle column in Fig. 2. The reference simulation in Fig. 8 is the one corresponding to right column in Fig. 3. In both figures, 7 and 8, reducing the Jagged production rate, left column, favors type 1 over type 2 CNV and makes the blood vessels thicker than the ones in the middle column. However, the increase of the Delta production rate does not prevent type 2 CNV. We also observe that the resulting blood vessels are thinner and worse organized than the ones in the middle column.
IV Discussion
The mathematical model of angiogenesis in retina presented here illustrate the relative importance of mechanical, chemical and cellular cues to study AMD. When Bruch’s membrane deteriorates, transport of oxygen, nutrients and debris across it become impaired and there appear drusen deposits that displace retinal pigment epithelial cells. In our model, the drusen deposits further deteriorate BM and affect the RPE cells. The latter may undergo changes in their adhesion properties, experience hypoxia and become local sources of VEGF (we do not distinguish here different varieties of VEGF). The extra VEGF reaches choroid vessels, which may issue sprouts led by tip endothelial cells if the local VEGF concentration surpasses a threshold. These sprouts form the choroidal neovascularization, whose type depends on the impaired adhesion between BM and RPE and between the RPE cells themselves. Notch signaling decides the EC phenotype, and alterations thereof strongly influence CNV type and configuration. In particular, overexpression of Jagged as shown by a large production thereof yields high proliferation of stalk ECs and thin vessels led by hybrid type tip cells. These leaky vessels could be important in exudative AMD.
Let us now examine in some detail the roles of adhesion defects and Notch signaling in CNV. Impaired adhesion between the basement membrane of the RPE and BM allow the cells to move easily in this space, which may produce type 1 CNV. If the adhesion between RPE and BM is strong, vessel sprouts may not be able to move between them, which impedes type 1 CNV. Our simulations show that a reduced lateral adhesion between RPE cells makes it easier for ECs to cross the RPE to the subretinal space, thereby producing type 2 CNV. Even if the impaired adhesion between BM and RPE allows formation of type 1 CNV, weaker lateral adhesion between RPE cells may facilitate vessel sprout crossing of the RPE layer. Then, the CNV changes from type 1 to type 2.
Drusen deposits pinpoint the deterioration of the RPE and BM, which are the hallmarks of dry AMD and may produce exudative (wet) AMD. In our model, extra sources of VEGF appear near drusen and trigger angiogenesis. Large VEGF gradients result and may cause CNV. While a low level of VEGF at the walls of the choroid vessels does not activate ECs that start a sprout, medium and high VEGF levels produce CNV and the number of sprouts that are activated depends on these levels. The VEGF concentration is not only related to CNV start, but also to its type. Under the same parameter values and conditions, the value of the VEGF gradient at the point where the sprout tries to cross the RPE determines the sprout chances of starting type 2 CNV. Higher VEGF concentration produces more active VEGF and greater number of VEGF receptors in tip cells so that the larger chemotactic force experienced by the leading ECs favors type 2 CNV over type 1 CNV.
In the Notch signaling pathway, VEGF receptors, active VEGF and a large Jagged production rate produce pathological angiogenesis veg20 , which is most similar to type 2 CNV. Decreasing the Jagged production rate yields thicker blood vessels and reduces the number of hybrid cells behaving as tip cells, thereby bringing in type 1 CNV. While a large Delta production rate counters a high Jagged production rate veg20 , it does not prevent type 2 CNV in retina. In this case, the resulting blood vessels are thinner and worse organized, but they are still able to cross the RPE layer, as shown in Figs. 8(c,f,i,l). The content of VEGF in the ECs as a function of the external VEGF or of the Jagged content also indicates the CNV type. The wider the range of VEGF content is, the greater the probability of having type 2 CNV is.
Our simulations suggest possible therapies based on using drugs to tinker with parameters controling CNV outcomes. Anti-VEGF treatments are commonly used to stop angiogenesis and provide a temporary reprieve of exudative AMD fog18 . Our simulations also corroborate that lowering VEGF production stops angiogenesis. According to our results, anti-Jagged antibodies patent ; sie17 could have a similar effect inhibiting CNV in AMD. To this end, progress in robotic-assisted subretinal injections may provide a beneficial and standardized implementation of anti-angiogenic therapies zho20 . The same end can be achieved by enforcing the adhesion properties of RPE cells to BM and among themselves. Promising experiments involve inhibition of the EMT transition to regenerate the RPE rad15 . Surgical procedures include RPE and choroid transplantation when appropriate donors are available par20 . Current lines of ongoing experimental preclinical research aim at placing implants to stimulate RPE and photoreceptors or replace their function che17 ; may17 ; tan18 , seed pluripotent stem cells to replace the lost RPE cells and photoreceptors gag19 ; sin20 , use gene addition therapies and genome editing to restore function to a non-functional or absent protein in the appropriate RPE signaling pathways, or to block function by knocking-down proteins sti20 , or repairing BM with biomaterials and growing RPE and photoreceptors over it jem20 . Clearly, the lifetime of working implants will depend on that of their underlying devices whereas transplants and stem cells may recover RPE cells and improve their lateral and BM adhesion properties, and also recover photoreceptors. However, BM may continue its defective performance and AMD may reappear with time. Replacing BM, RPE cells and photoreceptors is a more drastic but perhaps longer lasting solution if it works.
To allow for quantitative comparisons with experiments, our 2D model of angiogenesis in retina needs to be extended in several directions to be made more realistic and to predict the evolution of wet AMD. The extension of the model to three dimensional configurations is straightforward although it requires more computing power. To move toward later stages of the formation of an advancing vascular plexus, we need to add lumen formation and blood circulation to the model. These processes will allow us to tackle the concurrent sprouting and anastomosis on the front of the advancing vascular plexus and the pruning of poorly perfused sprouts on its back.
V Conclusions
To conclude, we have proposed a cellular Potts model of wet AMD that accounts for deterioration of Bruch’s membrane, growing drusen deposits that turn on sources of VEGF in addition to those active near photoreceptors. Numerical simulations of the model show that choroid neovascularization mainly results from three causes: (i) impairment of the adhesion between retinal pigmentation epithelium cells, between these cells and Bruch’s membrane and among endothelial cells; (ii) excess VEGF producing strong gradients thereof, (iii) excess Jagged production. Anti-VEGF and anti-Jagged treatments address (ii) and (iii) and could halt angiogenesis on a temporary basis, but do they not resolve the deterioration of Bruch’s membrane that produces AMD. While anti-VEGF treatments are standard for wet AMD fog18 , anti-Jagged drugs have been tried in cancer treatments and more research would be useful to ascertain their value for AMD patent ; sie17 . Our numerical simulations suggest the need for further experiments to confirm our findings, sharpen and validate our AMD model. More drastic remedies to address cellular adhesion loss (i) are electrobiological implants replacing the function of RPE and photoreceptors che17 ; may17 ; tan18 , seeding pluripotential stem cells to replace the lost RPE and photoreceptor cells themselves gag19 ; sin20 , or replacing Bruch’s membrane by an artificial biohybrid retina jem20 . These researches are still in early preclinical stages and are much more intrusive for aged patients. Experiments to quantify the adhesion of the new cells generated by pluripotent stem cells and their ability to stop angiogenesis would be needed. Our passive model of RPE cells could be replaced by a vertex model of the epithelium able to describe wound healing bon20 . Including reversible EMT signaling pathways shu20 in future models would be desirable and could bring about new therapies. Modeling and numerical simulation can thus be key to identifying critical experiments that are most likely to improve our understanding of AMD and possible treatments.
Acknowledgments. This research was funded by FEDER/Ministerio de Ciencia, Innovación y Universidades – Agencia Estatal de Investigación grant number MTM2017-84446-C2-2-R.
Appendix A Appendix A: Cellular Potts model
We consider a square domain of side (in numerical simulations, m) having nodes on each side. On , there are grid points and elementary squares (pixels) , each having an area . Pixels can belong to different cells or ECM, , and are labelled by their spin as follows:
| (A.1) |
where is the number of drusen and is the number of RPE cells.
Energy functional.
In the Hamiltonian of Eq. (1), we have
- •
-
•
The variation of the chemotaxis term is bau07
(A.3) where is the VEGF concentration in the corresponding pixel, given by Eqs. (2), and is a Potts parameter that depends on the type of EC or ECM occupying pixels and . We have
(A.6) where and are ECs. The positive constant measures the magnitude of chemotaxis. The level of Delta-4 determines the EC phenotype and, according to Eqs. (A.3) and (A.6), the strength of their chemotactic drive. Tip cells have a higher level of Delta-4 and, consequently by Eq. (A.6), they are more motile than stalk cells.
| Parameter | (EC) | (RPE) | (DR) | (EC) | (RPE) | (DR) | (EC) | ||
|---|---|---|---|---|---|---|---|---|---|
| Value | 25000 | 100000 | 750000 | 75 | 100 | 500 | 180 | 25 | 50000 |
| Parameter | EC-EC | EC-ECM | EC-RPE | EC-DR | RPE-ECM | RPE-BM | RPE-DR | RPE-RPE | DR-ECM | DR-DR |
|---|---|---|---|---|---|---|---|---|---|---|
| Value | 70-80 | 40 | 60 | 80 | 40 | 0-30 | 160 | 80-90 | 80 | 200 |
The values of the Potts parameters are listed in Tables A.1 and A.2 from Ref. veg20 . They are adjusted so that the terms in the net variation of the hamiltonian all have the same order. The perimeter contribution, absent in Refs. bau07 ; oer14 , is small compared to the other terms in Eq. (1), so that it only affects the computations in extreme cases (e.g., extremely thin cells, thin cells that stick to the blood vessel). The sensitivity of this CPM to parameter values is discussed in Ref. veg20 .
Appendix B Appendix B: Notch signaling pathway equations
The Notch signaling pathway is activated when the transmembrane receptor Notch belonging to a particular cell interacts with the transmembrane ligands Delta-4 or Jagged-1 belonging to its neighboring cell (trans-activation), thereby releasing the Notch intracellular domain (NICD). NICD then enters the nucleus and modulates the expression of many target genes of the Notch pathway, including both the ligands Delta and Jagged. However, when Notch of a cell interacts with Delta or Jagged belonging to the same cell, no NICD is produced; rather, both the receptor (Notch) and ligand (Delta or Jagged) are degraded (cis-inhibition) and therefore the signaling is not activated. These mechanisms are incorporated into model differential equations proposed in Ref. boa15 , and coupled to the CPM in Ref. veg20 . Here, we describe these equations for a given cell surrounded by other cells. At time , let , , and be the number of Notch, Delta-4, and Jagged-1 proteins in the th cell, respectively. Similarly, let , and be the number of NICD, VEGF receptor and VEGF molecules, respectively. These variables satisfy the following equations,
| (B.1a) | |||
| (B.1b) | |||
| (B.1c) | |||
| (B.1d) | |||
| (B.1e) | |||
| (B.1f) | |||
Here, , , , and , are the production rates of , , , and , respectively. The cis-inhibition and trans-activation rates are and , respectively, whereas and are degradation rates for , , , and for , , respectively. These parameters, their representative values and units are listed in Table B.1. The shifted, excitatory and inhibitory Hill functions appearing in Eqs. (B.1) are:
| (B.2a) | |||
| (B.2b) | |||
where is excitatory for and inhibitory for . In Eqs. (B.2), , , and (the subscript refers to Fringe, cf. boa15 ). The dimensionless parameters and appearing in the Hill functions are listed in Table B.2. We solved Eqs. (B.1) with zero initial conditions for all unknowns but the outcome of the simulations does not change if other initial conditions are used.
| Parameter | , , | |||||
|---|---|---|---|---|---|---|
| Value | 1200 | 1000 | 0.1 | 0.5 | ||
| Unit | molec/h | molec/h | (h molec)-1 | (h molec)-1 | h-1 | h-1 |
| Parameter | , , | , | , , , | , | |||||
|---|---|---|---|---|---|---|---|---|---|
| Value | 2.0 | 0.0 | 3.0 | 0.3 | 2.0 | 5.0 | 1.0 | 200 | 1.0 |
If are the cells sharing boundary of length with cell , the number of molecules outside cell is
| (B.3) |
The perimeter of cell , , minus is the length of its boundary that is not shared with any other cell. Note that is simply the sum of all if the lengths are all equal and because the whole boundary of cell is shared with other cells. As the cell moves and its boundaries fluctuate due to cellular Potts dynamics, the membrane protein levels of the neighboring cells interacting with the moving cell also vary. In this way, the production rates of the different proteins in a cell are directly influenced by the interactions with its neighborhood and, in particular, by the membrane fluctuations of the cell. is the number of VEGF molecules outside the th cell that interact with VEGF receptor cells to produce VEGF molecules inside the th cell. The external VEGF cells come from the continuum field , which diffuses from . Let be the pixel of the th cell that is closer to the hypoxic region. The number of external VEGF molecules in that pixel is multiplied by the conversion factor , where is the molecular weight of the VEGF molecules and is the Avogadro number. We have used , which is representative of VEGF molecules with a large molecular weight. In the numerical simulation, is known in the grid points and its value at a pixel should be the average value of the four grid points of the pixel. Since these values are quite similar, we adopt the value of at the bottom left grid point of the pixel as .
| Variable | , , , , , | |||||
|---|---|---|---|---|---|---|
| Scale | ||||||
| Value | ||||||
| Unit | molec | molec | molec | molec | molec | h |
References
- (1) Wong, W.L.; Su, X.; Li, X.; Cheung, C.M.G.; Klein, R.; Cheng, C.-Y.; Wong, T.Y. Global prevalence of age-related macular degeneration and disease burden projection for 2020 and 2040: a systematic review and meta-analysis. Lancet Glob. Health 2014, 2, 106–116.
- (2) Jonas, J.B. Comment. Global prevalence of age-related macular degeneration. Lancet Glob. Health 2014, 2, E65–E66.
- (3) Jager, R.D.; Mieler, W.F.; Miller, J.W. Age-related macular degeneration. N. Engl. J. Med. 2008, 358(24), 2606–2617.
- (4) Nivison-Smith, L.; Milston, R.; Madigan, M.; Kalloniatis, M. Age-Related Macular Degeneration: Linking Clinical Presentation to Pathology. Optometry Vision Sci. 2014, 91(8), 832-.848.
- (5) Manjunath, V.; Taha, M.; Fujimoto, J.G.; Duker, J.S. Choroidal Thickness in Normal Eyes Measured Using Cirrus-HD Optical Coherence Tomography. Am J. Ophtalmol. 2010, 150(3), 325–329.
- (6) Coscas, G.; Lupidi, M.; Coscas, F. Atlas of OCT: Angiography in AMD. Comparison with multimodal imaging. Societé Francaise de Retine, L’Europeenne d’Editions: Paris, France, 2015.
- (7) Laforest, T.; Künzi, M.; Kowalczuk, L.; Carpentras, D.; Behar-Cohen, F.; Moser, C. Transscleral optical phase imaging of the human retina. Nature Photonics 2020. doi: 10.1038/s41566-020-0608-y
- (8) Gariano, R.F.; Gardner, T.W. Retinal angiogenesis in development and disease. Nature 2005, 438 960–966.
- (9) Fruttiger, M. Development of the retinal vasculature. Angiogenesis 2007, 10, 77–88.
- (10) Scott, A.; Powner, M.B.; Gandhi, P.; Clarkin, C.; Gutmann, D.H.; Johnson, R.S.; Ferrara, N.; Fruttiger, M. Astrocyte-Derived Vascular Endothelial Growth Factor Stabilizes Vessels in the Developing Retinal Vasculature. PLoS One 2010, 5, e11863.
- (11) Selvam, S.; Kumar, T.; Fruttiger, M. Retinal vasculature development in health and disease. Progress in Retinal and Eye Research 2018, 63, 1–19.
- (12) Carmeliet, P.F. Angiogenesis in life, disease and medicine. Nature 2005, 438, 932–936.
- (13) Carmeliet, P.; Tessier-Lavigne, M. Common mechanisms of nerve and blood vessel wiring. Nature 2005, 436, 193–200.
- (14) Carmeliet, P.; Jain, R.K. Molecular mechanisms and clinical applications of angiogenesis. Nature, 2011, 473, 298–307.
- (15) Tonnesen, M.G.; Feng, X.; Clark, R.A. Angiogenesis in wound healing. Journal of Investigative Dermatology Symposium Proceedings 2000, 5, 40–46.
- (16) Figg, W.D.; Folkman, J. Eds. Angiogenesis. An Integrative Approach From Science to Medicine. Springer: Berlin, Germany, 2008.
- (17) Gerhardt, H.; Golding, M.; Fruttiger, M.; Ruhrberg, C.; Lundkvist, A.; Abramsson, A.; Jeltsch, M.; Mitchell, C.; Alitalo, K.; Shima, D.; Betsholtz, C. VEGF guides angiogenic sprouting utilizing endothelial tip cell filopodia. J. Cell Biol. 2003, 161(6), 1163–1177.
- (18) Hellström, M.; Phng, L.K.; Hofmann, J.J.; Wallgard, E.; Coultas, L.; Lindblom, P.; Alva, J.; Nilsson, A.-K.; Karlsson, L.; Gaiano, N.; Yoon, K.; Rossant, J.; Iruela-Arispe, M.L.; Kalén, M.; Gerhardt, H.; Betsholtz, C. Dll4 signalling through Notch1 regulates formation of tip cells during angiogenesis, Nature 2007, 445(7129), 776–780.
- (19) Jolly, M.K.; Boareto, M.; Lu, M.; Onuchic, J.N.; Clementi, C.; Ben-Jacob, E. Operating principles of Notch-Delta-Jagged module of cell-cell communication. New J. Phys. 2015, 17, 055021.
- (20) Page, D.J.; Thuret, R.; Venkatraman, L.; Takahashi, T.; Bentley, K.; Herbert, S.P. Positive Feedback Defines the Timing, Magnitude, and Robustness of Angiogenesis. Cell Rep. 2019, 27, 3139–3151.
- (21) Vega, R.; Carretero, M.; Travasso, R.D.M.; Bonilla, L.L. Notch signaling and taxis mechanims regulate early stage angiogenesis: A mathematical and computational model. PLoS Comput. Biol. 2020, 16(1), e1006919.
- (22) Gebala, V.; Collins, R.; Geudens, I.; Phng, L.-K.; Gerhardt, H. Blood flow drives lumen formation by inverse membrane blebbing during angiogenesis in vivo. Nat. Cell Biol. 2016, 18(4), 443–450.
- (23) Franco, C.A.; Jones, M.L.; Bernabeu, M.O.; Geudens, I.; Mathivet, T.; Rosa A.; Lopes, F.M.; Lima, A.P.; Ragab, A.; Collins, R.T.; Phng, L.-K.; Coveney, P.V.; Gerhardt, H. Dynamic endothelial cell rearrangements drive developmental vessel regression. PLoS Biology 2015, 13, e1002125.
- (24) Szymborska, A.; Gerhardt, H. Hold me, but not too tight – endothelial cell-cell junctions in angiogenesis. Cold Spring Harb. Perspect. Biol. 2018, 10(8), a029223.
- (25) Dufraine, J.; Funahashi, Y.; Kitajewski, J. Notch signaling regulates tumor angiogenesis by diverse mechanisms. Oncogene 2008, 27, 5132–5137.
- (26) Booij, J.C.; Baas, D.C.; Beisekeeva, J.; Gorgels, T.G.M.F.; Bergen, A.A.B. The dynamic nature of Bruch’s membrane. Prog. Ret. Eye Res. 2010, 29, 1–18.
- (27) Mammadzada, P.; Corredoira, P.M.; André, H. The role of hypoxia-inducible factors in neovascular age-related macular degeneration: a gene therapy perspective. Cellular and Molecular Life Sciences 2020, 77, 819–833.
- (28) Gehrs, K.M.; Anderson, D.H.; Johnson, L.V.; Hageman, G.S. Age-related macular degeneration–emerging pathogenetic and therapeutic concepts. Ann. Med. 2009, 38, 450–471.
- (29) Radeke, M.J.; Radeke, C.M.; Shih, Y.-H.; Hu, J.; Bok, D.; Johnson, L.V.; Coffey, P.J. Restoration of mesenchymal retinal pigmented epithelial cells by TGF pathway inhibitors: Implications for age-related macular degeneration. Genome Med. 2015, 7, 58.
- (30) Shu, D.Y.; Butcher, E.; Saint-Geniez, M. EMT and EndMT: Emerging Roles in Age-Related Macular Degeneration. Int. J. Mol. Sci. 2020, 21, 4271.
- (31) Tamiya, S.; Liu, L.; Kaplan, H.J. Epithelial-mesenchymal transition and proliferation of retinal pigment epithelial cells initiated upon loss of cell-cell contact. Investig. Ophthalmol. Vis. Sci. 2010, 51, 2755–2763.
- (32) Roberts, P.A.; Gaffney, E.A.; Luthert, P.J.; Foss, A.J.E.; Byrne, H.M. Mathematical and Computational Models of the Retina in Health, Development and Disease. Progress in Retinal and Eye Research 2016, 53, 48–69.
- (33) Flower, R.W.; von Kerczek, C.; Zhu, L.; Eggleton, E.C.; Topoleski, L.D.T. Theoretical Investigation of the Role of Choriocapillaris Blood Flow in Treatment of Subfoveal Choroidal Neovascularization Associated With Age-related Macular Degeneration. Am. J. Opthtalmol. 2001, 132(1), 85–93.
- (34) Davies, A.E.; Williams, R.L.; Lugano, G.; Pop, S.R.; Kearns, V.R. In vitro and computational modelling of drug delivery across the outer blood-retinal barrier. Interface Focus 2020, 10, 20190132.
- (35) Shirinifard, A.; Glazier, J.A.; Swat, M.; Gens, J.S.; Family, F.; Jiang, Y.; Grossniklaus, H.E. Adhesion Failures Determine the Pattern of Choroidal Neovascularization in the Eye: A Computer Simulation Study. PLOS Comput. Biol. 2012, 8(5), e1002440.
- (36) Graner, F.; Glazier, J.A. Simulation of Biological Cell Sorting Using a Two-Dimensional Extended Potts Model. Phys. Rev. Lett. 1992, 69, 2013–2016.
- (37) Bauer, A.L.; Jackson, T.L.; Jiang, Y. A Cell-Based Model Exhibiting Branching and Anastomosis during Tumor-Induced Angiogenesis. Biophys. J. 2007, 92, 3105–3121.
- (38) Van Oers, R.F.M.; Rens, E.G.; La Valley, D.J.; Reinhart-King, C.A.; Merks, R.M.H. Mechanical cell-matrix feedback explains pairwise and collective endothelial cell behavior in vitro. PLoS Comput. Biol. 2014, 10(8), el003774.
- (39) Boareto, M.; Jolly, M.K. Ben-Jacob, E.; Onuchic, J.N. Jagged mediates differences in normal and tumor angiogenesis by affecting tip-stalk fate decision. Proc. Natl. Acad. Sci. USA 2015, 112, E3836–E3844.
- (40) Arima, S.; Nishiyama, K.; Ko, T.; Arima, Y.; Hakozaki, Y.; Sugihara, K.; Koseki, K.; Uchijima, H; Kurihara, Y.; Kurihara, H. Angiogenic morphogenesis driven by dynamic and heterogeneous collective endothelial cell movement. Development 2011, 138, 4763–4776.
- (41) Sugihara, K.; Nishiyama, K.; Fukuhara, S.; Uemura, A.; Arima, S.; Kobayashi, R.; Köhn-Luque, A.; Mochizuki, N.; Suda, T.; Ogawa, H.; Kurihara, H. Autonomy and Non-autonomy of Angiogenic Cell Movements Revealed by Experiment-Driven Mathematical Modeling. Cell Rep. 2015, 13, 1814–1827.
- (42) Mantzaris, N.V.; Webb, S.; Othmer, H.G. Mathematical modeling of tumor-induced angiogenesis. J. Math. Biol. 2004, 49, 111–187.
- (43) Bai, H.X.; Mao, Y.; Shen, L.; Xu, X.L.; Gao, F.; Zhang, Z.B.; Li, B.; Jonas, J.B. Bruch’s membrane thickness in relationship to axial length. PLoS One 2017, 12(8), e0182080.
- (44) Friberg, T.R.; Bilonick, R.A.; Peter Brennen, P. Is Drusen Area Really So Important? An Assessment of Risk of Conversion to Neovascular AMD Based on Computerized Measurements of Drusen. Invest. Ophthalmol. Vis. Sci. 2012, 53(4), 1742-1751.
- (45) Poh, S.; Tham, Y.; Chee, M.L.; Dai, W.; Majithia, S.; Soh, Z.D.; Fenwick, E.K.; Tao, Y.; Thakur, S.; Rim, T.H.; Sabanayagam, C.; Cheng, C.-Y. Association between Macular Thickness Profiles and Visual Function in Healthy Eyes: The Singapore Epidemiology of Eye Diseases (SEED) Study. Sci. Rep. 2020, 10, 6142.
- (46) Gullapalli, V.K.; Sugino, I.K.; Van Patten, Y.; Shah, S.; Zarbin, M.A. Impaired RPE survival on aged submacular human Bruch’s membrane. Exp. Eye Res. 2005, 80(2), 235–248.
- (47) Imamura, Y.; Noda, S.; Hashizume, K.; Shinoda, K.; Yamaguchi, M.; Uchiyama, S.; Shimizu, T.; Mizushima, Y.; Shirasawa, T.; Tsubota, K. Drusen, choroidal neovascularization, and retinal pigment epithelium dysfunction in SOD1-deficient mice: A model of age-related macular degeneration. Procs. Natl. Acad. Sci. 2005, 103(30), 11282–11287.
- (48) Simó, R.; Villarroel, M.; Corraliza, L.; Hernández, C.; Garcia-Ramírez, M. The retinal pigment epithelium: something more than a constituent of the blood-retinal barrier–implications for the pathogenesis of diabetic retinopathy. J. Biomed. Biotechnol. 2010, 2010, 190724.
- (49) Ramos, J.R.D.; Travasso, R. Carvalho, J. Capillary network formation from dispersed endothelial cells: Influence of cell traction, cell adhesion, and extracellular matrix rigidity. Phys. Rev. E 2018, 97, 012408.
- (50) Bhutto, I.A.; McLeod, D.S.; Hasegawa, T.; Kim, S.Y.; Merges, C.; Tong, P.; Lutty, G.A. Pigment epithelium-derived factor (PEDF) and vascular endothelial growth factor (VEGF) in aged human choroid and eyes with age-related macular degeneration. Exp. Eye Res. 2006, 82, 99–110.
- (51) Fogli, S.; Del Re, M.; Rofi, E.; Posarelli, C.; Figus, M.; Danesi, R. Clinical pharmacology of intravitreal anti-VEGF drugs, Eye 2018, 32, 1010-1020.
- (52) West, J.W.; Sagert, J.G.; Bessette, P. H.; Lowman, H.B.; Stagliano, N.E.; Vasiljeva, O.; Menendez, E.-E.M. Anti-jagged 1/jagged 2 cross-reactive antibodies, activatable anti-jagged antibodies and methods of use thereof. US patent in https://patents.google.com/patent/US9127053B2/en
- (53) Sierra, R.A.; Trillo-Tinoco, J.; Mohamed, E.; Yu, L.; Achyut, B. R.; Arbab, A.; Bradford, J.W.; Osborne, B.A.; Miele, L.; Rodriguez, P.C. Anti-Jagged immunotherapy inhibits MDSCs and overcomes tumor-induced tolerance, Cancer Res. 2017, 77, 5628-5638.
- (54) Zhou, M.; Yu, Q.; Huang, K.; Mahov, S.; Eslami, A.; Maier, M.; Lohmann, C.P.; Navab, N.; Zapp, D.; Knoll, A.; Nasseri, M.A. Towards Robotic-assisted Subretinal Injection: A Hybrid Parallel-Serial Robot System Design and Preliminary Evaluation. IEEE Trans. Ind. Electron. 2020, 67(8), 6617–6628.
- (55) Parolini, B.; Nava, U.; Palmieri, M.; Lucente, A.; Finzi, A.; Frisina, R. RPE and Choroid Transplantation in Macular Degeneration. In Macular Surgery; Chang, A., Mieler, W.F., Ohji, M., Eds.; Springer Nature Switzerland, 2020; pp. 401-422.
- (56) Cheng, D.L.; Greenberg, P.B.; Borton, D.A. Advances in retinal prosthetic research: a systematic review of engineering and clinical characteristics of current prosthetic initiatives. Curr. Eye Res. 2017, 42, 334–347.
- (57) Maya-Vetencourt, J.F.; Ghezzi, D.; Antognazza, M.R.; Colombo, E.; Mete, M.; Feyen, P.; Desii, A.; Buschiazzo, A.; Di Paolo, M.; Di Marco, S.; Ticconi, F.; Emionite, L.; Shmal, D.; Marini, C.; Donelli, I.; Freddi, G.; Maccarone, R.; Bisti, S.; Sambuceti, G.; Pertile, G.; Lanzani, G.; Benfenati, F. A fully organic retinal prosthesis restores vision in a rat model of degenerative blindness. Nature Mater. 2017, 16, 681–689.
- (58) Tang, J.; Qin, N.; Chong, Y.; Diao,Y.; Yiliguma; Wang, Z.; Xue, T.; Jiang, M.; Zhang, J.; Zheng, G. Nanowire arrays restore vision in blind mice. Nat. Commun. 2018, 9, 786.
- (59) Gagliardi, G.; Ben M’Barek, K.; Goureau, O. Photoreceptor cell replacement in macular degeneration and retinitis pigmentosa: A pluripotent stem cell-based approach. Prog. Ret. Eye Res. 2019, 71, 1–25.
- (60) Singh, M.S.; Park, S.S.; Albini, T.A.; Canto-Soler, M.V.; Klassen, H.; MacLaren, R.E.; Takahashi, M.; Nagiel, A.; Schwartz, S.D.; Bharti, K. Retinal stem cell transplantation: Balancing safety and potential. Prog. Ret. Eye Res. 2020, 75, 100779.
- (61) Stieger, K.; Lorenz, B. RPE and gene therapy. In Retinal Pigment Epithelium in Health and Disease; Klettner, A.K., Dithmar, S., Eds.; Springer Nature Switzerland, 2020; pp. 265-279.
- (62) Jemni-Damer, N.; Guedan-Duran, A.; Cichy, J.; Lozano-Picazo, P.; Gonzalez-Nieto, D.; Perez-Rigueiro, J.; Rojo, F; Guinea, G.V.; Virtuoso, A.; Cirillo, G;. Papa, M.; Armada-Maresca, F.; Largo-Aramburu, C.; Aznar-Cervantes, S.D.; Cenis, J.L.; Panetsos, F. First steps for the development of silk fibroin-based 3D biohybrid retina for age-related macular degeneration (AMD). J. Neural Eng. 2020, 17, 055003.
- (63) Bonilla, L.L.; Carpio, A.; Trenado, C. Tracking collective cell motion by topological data analysis. PLoS Comput. Biol. 2020, 16(12), e1008407.