No dependence of radio properties of brightest group galaxies on the luminosity gap
Abstract
We study the radio and optical properties of the brightest group galaxies (BGGs) in a sample of galaxy groups from the SDSS DR7. The luminosity difference between the BGG and the second ranked galaxy in the group (known as the luminosity, or magnitude, gap) has been used as a probe for the level of galaxy interaction for the BGG within the group. We study the properties of BGGs with magnitude gaps in the range 0-2.7 magnitudes, in order to investigate any relation between luminosity gap and the radio properties of the BGG. In order to eliminate selection biases, we ensure that all variations in stellar mass are accounted for. We then confirm that, at fixed stellar mass, there are no significant variations in the optical properties of the BGGs over the full range of luminosity gaps studied. We compare these optical results with the EAGLE hydrodynamical simulations and find broad consistency with the observational data. Using EAGLE we also confirm that no trends begin to arise in the simulated data at luminosity gaps beyond our observational limits. Finally, we find that, at fixed stellar mass, the fraction of BGGs that are radio-loud also shows no trends as a function of luminosity gap. We examine how the BGG offset from the center of group may affect the radio results and find no significant trend for the fraction of radio-loud BGGs with magnitude gap in either the BGG samples with greater or less than 100kpc offset from the center of group.
1 Introduction
The radio emission of galaxies at low frequencies is dominated by synchrotron emission of free electrons in the interstellar or intergalactic magnetic field. Star formation and active galactic nucleus (AGN) activity are known to be the primary sources of these relativistic electrons. The observed radio luminosity of a galaxy is a combination of these two processes. Weak micro-Jansky radio sources generally have star-forming host galaxies, whereas strong radio sources are more commonly hosted by AGN (Padovani et al. 2007, 2011; Novak et al. 2018). The most powerful radio sources, harbouring supermassive black holes, may have strong radio jets which can extend up to Mpcs from the centre of the galaxy.
The simple picture described above is well-established, and a wide range of observations have established connections between radio activity and various galaxy properties. The radio emission appears to be tightly correlated with the far-infrared (FIR) emission for star-forming galaxies (Van der Kruit 1971; Gürkan et al. 2018), whereas radio-loud AGN lie offset from this relation, with more substantial radio emission (e.g. Hardcastle et al. 2016).
In the local Universe, the radio AGN population is dominated by red, elliptical galaxies with low accretion rates (Best & Heckman 2012; Best et al. 2014). This is consistent with the theory of hot accretion flows which predict the ubiquity of outflows in hot accretion mode systems (Narayan & Yi 1995; Yuan & Narayan 2014). The fraction of galaxies that host radio AGN is a strong function of galaxy stellar mass (Best et al. 2005; Brown et al. 2011; Janssen et al. 2012; Rees et al. 2016), black hole mass (Ishibashi et al. 2014, Barišić et al. 2017) and optical luminosity (Jiang et al. 2007). It is also reported that the brightest galaxies within groups or clusters are more likely to host radio AGN than other galaxies with the same stellar mass (Von der Linden et al. 2007; Best et al. 2007). The latter is thought to be associated with the enhanced gas cooling within the hot gas halos of groups and clusters (Best et al. 2007), but may also reflect an increased importance of galaxy interactions in triggering radio AGN (e.g. Sabater et al. 2013).
The radio luminosity of an AGN is expected to depend fundamentally on the availability of gas and the efficiency of the accretion of this gas onto the black hole. The large-scale drivers of these dependencies can be studied observationally via investigating the properties and environment of the host galaxy. However, there may also be some intrinsic properties influencing the powering of radio AGN, e.g. the black hole spin (Garofalo et al. 2010, McNamara et al. 2011), that are not detectable using current observational facilities.
The relation between radio properties and galaxy environment, in particular in terms of interactions and mergers, has been studied extensively. These include investigations of the radio power in major and minor merging systems (Chiaberge et al. 2015), non-merging systems (Miraghaei et al. 2014), dense environments (Sabater et al. 2013, Kolwa et al. 2018) or galaxy clusters (Mittal et al. 2009, Mo et al. 2018), galaxy pairs (Argudo-Fernández et al. 2016) and isolated galaxies (Sabater et al. 2008). These studies have provided mixed results, with some in favour of a positive effect of galaxy interactions on triggering AGN while others report no enhancement in AGN activity due to galaxy interactions (Coziol et al. 2017, Wen et al. 2012). The relations derived are sensitive to the type of AGN studied, i.e. optical, IR or radio AGN (Ellison et al. 2008, 2011, 2015; Satyapal et al. 2014; Miraghaei 2020) or the rate of gas accretion into the super massive black hole as discussed earlier. The latter is probed using a sample of high excitation or low excitation AGN (Sabater et al. 2012; 2013; 2015). The morphology of galaxies studied can also play a role (Davies et al. 2017). Furthermore, the very strong dependence of the radio-AGN fraction on stellar mass means that sample selection biases can have a profound effect on the results obtained.
In this paper, we study the effect of galaxy interactions on radio-mode AGN activity by exploring the properties of the brightest group galaxy (BGG) in galaxy groups as a function of the difference between the optical luminosities of the first and second ranked galaxies within a group: the luminosity gap. The BGG in a galaxy group is formed by the continuous merging of smaller galaxies, which can lead to a large gap between the luminosities of the first and second ranked galaxies in the group. The brighter galaxies in a group have a relatively shorter merging time-scale and so a galaxy system with a small luminosity gap is more likely to undergo a merger. On the contrary, galaxy groups with large luminosity gaps, which tend to comprise one dominant galaxy and some dwarf galaxies with long merging timescales, undergo fewer interactions and are more likely to be merger-free. (Lacey & Cole 1993; van den Bosch et al. 2007; Jiang et al. 2008). A study by Dariush et al. (2007) also shows that galaxy groups with magnitude gaps greater than 2 display a lack of major mergers over the past 4 Gyr of their histories (compared to groups without a large magnitude gap). Using the Millennium simulation, they show that these systems are early-forming, having accumulated 80 of their mass before this time. This may have observational consequences on the properties of the central galaxies in the groups, which is the subject of our work.
The radio luminosities of large magnitude gap systems (Mr1.7) have been studied by Khosroshahi et al. (2017). They showed that BGGs that reside within 100kpc of the centre of a galaxy group with a large magnitude gap are under-luminous (in the radio) compared to BGGs that lie more than 100kpc from the centre of small magnitude gap systems. To investigate this further, we explore how the magnitude gap correlates with the radio-mode AGN activity in galaxy groups, focussing on the BGG. Our aim is then to understand the opposing trends observed for small and large magnitude gap systems, using a large, continuous range in r-band magnitude gap, from Mr=0 to Mr=2.7. In addition, we investigate whether an offset in the position of the BGG from the center of the group would affect our results. We are particularly careful to avoid potential selection biases due to stellar mass effects. To achieve this, we draw a large sample of galaxy groups from the seventh data release of the Sloan Digital Sky Server (SDSS), and then make conservative selection cuts to ensure unbiased samples. The sample has been limited to radio-loud AGN and corrected for the radio emission from star formation.
To confirm that our results are not influenced by any secondary effects, we also investigate any dependence of the optical properties of the BGGs and the magnitude gap. In this regard, Trevisian et al. (2017) find no significant correlation between the optical properties and the magnitude gap up to Mr=2.5. We further compare the optical properties of the BGGs as a function of luminosity gap to predictions from state-of-the-art cosmological simulations, both to support the observational results and to ensure that the simulations do not predict any change in behaviour at luminosity gaps larger than we are able to probe with our unbiased observational samples. We use the Evolution and Assembly of GaLaxies and their Environments (EAGLE) simulation (Schaye et al. 2015, Crain et al. 2015), which follows the formation of galaxies and supermassive black holes in a standard CDM universe. The simulation includes subgrid prescriptions for radiative cooling, star formation, stellar evolution, mass-loss and metal enrichment, energy feedback from star formation and AGN, mergers, gas accretion and the growth of supermassive black holes. Feedback from star formation and AGN is implemented thermally, such that outflows develop as a result of pressure gradients and without the need to impose winds by hand. The simulation reproduces observational properties of galaxies with an accuracy that is unprecedented for hydrodynamical simulations.
The layout of this paper is as follows. The galaxy and radio source samples
are presented in Section 2. Section 3 presents the construction of matched sub-samples.
The connection between luminosity gap and optical and radio properties of the BGGs are
shown in Section 4 and 5 respectively. In Section 6, we consider the impact
of a spatial offset of the BGG from the centre of the group on the
radio results presented in Section 5. We summarise and draw
conclusions in Section 7. Throughout the paper we assume
a CDM cosmology with the following parameters: ,
and km s-1 Mpc-1 where =
0.70.
2 Sample and classification
The galaxy sample and the radio and optical properties are taken from Best & Heckman (2012). They cross-matched the seventh data release (DR7; Abazajian et al. 2009) of the Sloan Digital Sky Survey (SDSS; York et al. 2000) with the National Radio Astronomy Observatory (NRAO) Very Large Array (VLA) Sky Survey (NVSS; Condon et al. 1998) and the Faint Images of the Radio Sky at Twenty centimetres (FIRST) survey (Becker, White & Helfand 1995), following the techniques of Best et al. (2005a). We use the SDSS Main Galaxy Sample, which is a magnitude-limited sample with 14.5mr17.77.
Parameters that we use from the catalogue include total stellar mass, black hole mass (estimated from the velocity dispersion using the relation of McConnell & Ma 2013), 4000 break strength as a probe for the stellar age, galaxy magnitude, rest-frame g-r colour (which we convert to the AB magnitude system), half light radius in the i-band (R50) as a proxy for galaxy size, concentration: C=R90/R50, half-light surface mass density: = 0.5 M⋆/ ( R502), and radio luminosity including the radio AGN/star forming galaxy (SFG) separation (see Miraghaei & Best 2017 for the details). We used the rest-frame 1.4 GHz radio luminosities calculated from NVSS flux densities, assuming =0.75 for the spectral index (where ).
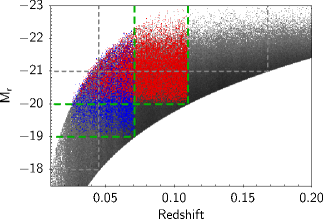
To identify galaxies in groups against field galaxies, we used the Tago et al. (2010) group samples which provide volume-limited group samples of SDSS galaxies, based on the modified friends-of-friends (FOF) algorithm. The limits of Mr = r5 log(h) -18, -19, -20 and -21 (where r is the r-band absolute magnitude) were used by Tago et al to construct four group samples; these correspond to the redshifts of 0.045, 0.071, 0.110 and 0.168 at the magnitude limit of the SDSS main galaxy sample (see Fig. 1, left). The galaxy group catalogues provide group member locations in addition to their redshifts and the SDSS optical magnitudes. The group center was defined as the center of light derived from the r-band luminosity of the group members (Robotham et al. 2011). The projected comoving distance from the center of the group was defined as the offset from the center for each of the group members. The r-band magnitude gaps, Mr, were calculated for galaxy groups with two or more galaxy members within 500 kpc h-1 radius. The rest of the galaxies were classified as isolated galaxies.
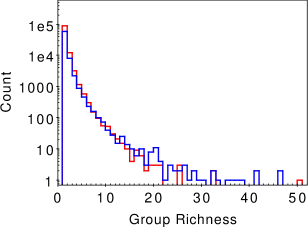
The four different group sample cuts from Tago et al were considered and the -19 and -20 cuts were selected to present in this work. A -18 magnitude cut did not provide sufficient volume (number statistics) while a -21 magnitude cut does not allow a sufficient range of luminosity gap. Either of the group sample with -19 and -20 cuts provide good sample sizes. The former has better ability to reach higher magnitude gap for the lower redshift galaxy groups and the latter gives better statistics at lower magnitude gap for the higher redshift galaxy groups; hence the results from both are considered. The distribution of the group richness is presented in Fig. 1 (right).
3 Construction of matched sub-samples
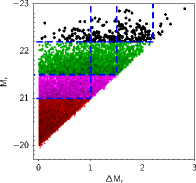
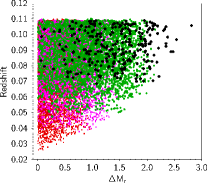
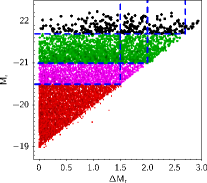
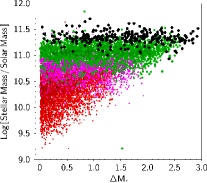
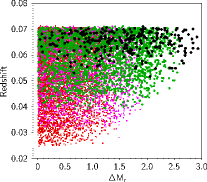
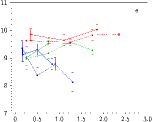
To investigate the radio and optical properties of the BGGs, it is first essential to ensure that we are making unbiased comparisons of the BGGs with different luminosity gaps. The r-band magnitudes, stellar masses and redshifts of the BGGs for each sample are shown in Fig. 2 (red circles). Galaxy groups with large luminosity gaps have BGGs with brighter r-band magnitudes, higher stellar masses, and are typically located at higher redshifts (the last of which arises from the correlation between stellar mass and redshift due to selection biases in the magnitude-limited SDSS sample). This dependence arises trivially due to the r-band magnitude -19 (or -20) limit of the Tago et al. (2010) group sample. Accordingly, a system can only be identified as a group if the second-ranked galaxy within the group has a magnitude of -19 (or -20) or brighter, and hence at large luminosity gaps only BGGs of the brightest magnitudes are included in the catalogue. BGGs with large luminosity gaps at fainter magnitudes will be identified as isolated galaxies which imposes incompleteness on the catalogue at large luminosity gaps. This incompleteness means that any naive comparison of the BGGs at different luminosity gap would be biased by differences in stellar mass, magnitude and redshift, which could easily have more influence than the luminosity gap itself.
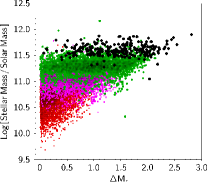
To correct for this effect, we build up three subsamples with additional magnitude cuts on the BGG. This is illustrated in the left panel of Fig. 2. For the galaxy group sample with -19 cut (lower left), a second cut at Mr=-20.5 for the BGGs allows for a complete sample out to Mr=1.5, as do cuts at Mr=-21.0 and Mr=-21.7 out to Mr=2.0 and Mr=2.7 respectively. In the -20 cut sample (upper left), the second cuts for the BGGs at Mr=-21.0, -21.5 and -22.2 allow for complete samples out to Mr=1.0, 1.5 and 2.2 respectively. These cuts also largely remove the mass and redshift biases in the distribution of the BGGs at different luminosity gap for each of the samples up to their completeness limits for Mr. The stellar mass (middle panel) and redshift (right panel) distributions are shown in Fig. 2. Nevertheless, we apply additional mass limits to each subsample, derived from the middle panel of Fig. 2 to include the bulk of the BGGs in the given magnitude range, while ensuring that the results are not dominated by any outlying sources.
Specifically, in the rest of the paper, we study
three sub-samples of the BGGs with three different
cuts on BGG absolute magnitude and in specific mass ranges
for each of the -20 and -19 galaxy group samples.
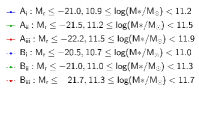
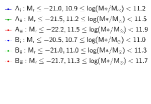
A: Galaxy group sample with -20 cut:
-
i- Mr-21.0, 10.9Log11.2, Mr1.0
-
ii- Mr-21.5, 11.2Log11.5, Mr1.5
-
iii-Mr-22.2, 11.5Log11.9, Mr2.2
B: Galaxy group sample with -19 cut:
-
i- Mr-20.5, 10.7Log11.0, Mr1.5
-
ii- Mr-21.0, 11.0Log11.3, Mr2.0
-
iii-Mr-21.7, 11.3Log11.7, Mr2.7
These selection criteria allow the investigation of the largest complete and unbiased samples of BGGs up to the specific magnitude gap. In addition, we reduce the uncertainties which arise from galaxy group detection by making a cut on the group richness. The FOF group finding algorithm links every galaxy to those neighbouring galaxies and their neighbours by defining a length scale as a maximum distance between the two galaxies (Huchra & Geller 1982). Although this method is widely used for identification of galaxy groups in local redshift surveys, the algorithm can not identify the physical state of the group. Therefore, spurious groups generated from the chance alignment of physically unrelated galaxies, or infalling galaxies in a structure which is not yet virialised, may be selected as true galaxy groups. We discuss this further in Section 6. We consider galaxy group samples with richness of N 2, 3, 4 and 5 throughout the paper. The N 2 selection allows the largest samples, and minimises biases with respect to magnitude gap, but a galaxy group with only two galaxy members that satisfy the magnitude cut used in this work may be a simple galaxy pair, rather than a galaxy group. In contrast, the higher N cuts allow us to study richer groups but at the cost of smaller sample statistics and potential small biases at larger magnitude gaps (since the Nth-ranked group member has to be brighter than the SDSS magnitude limit).
4 Luminosity gap and optical properties of BGGs
We first investigate the optical properties of the BGGs for different Mr systems to study whether there is any characteristic that i) changes with Mr and so ii) may affect the radio loudness results. We also compare our results for the optical properties of BGGs against results from a cosmological hydrodynamical simulation.
4.1 Results of observational data
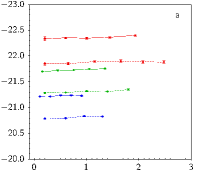
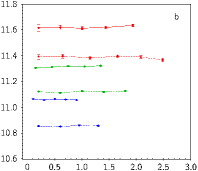
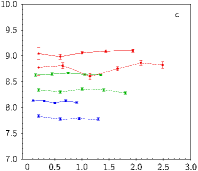
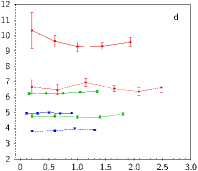
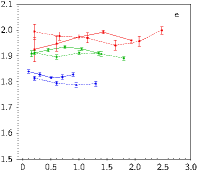
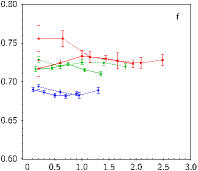
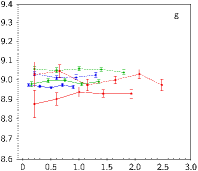
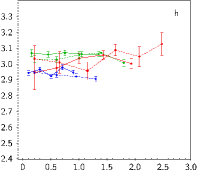
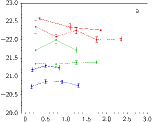
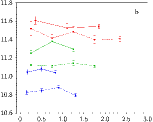
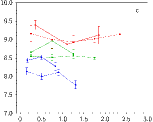
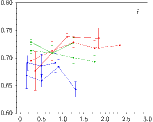
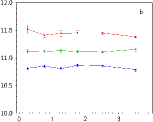
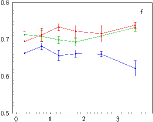
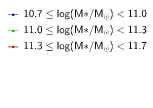
In Fig. 3 we show various optical properties of BGGs as a function of luminosity gap for galaxy group sub-samples discussed in Section 3 with N 2. The y-axis of each plot shows the mean value of each parameter, with the error bar given by the standard deviation of the mean. The solid line and dashed line represent galaxy group samples with -20 and -19 cuts respectively. Different colours show each sub-samples, i.e., the blue, green and red lines represent low mass, medium mass and massive galaxies respectively. We note that we only display luminosity gap bins which preserve the luminosity gap completeness and we applied the upper limit Mr cut to all sub-samples. The mean of the stellar mass and the r-band magnitude confirm that the sample is unbiased for each bin of magnitude gap. There are no significant changes in any of the other optical properties with respect to the Mr. The results for N 3, 4 and 5 are not shown but in all cases they confirm the N2 results.
These results show that, once selected at constant stellar mass, the optical properties of the BGG within a group do not display any dependencies upon the luminosity gap. This is consistent with the results of Trevisian et al. (2017), who find no correlation between the magnitude gap of the group and the optical properties of the BGG such as age, metallicity, [/Fe] and star formation history.
4.2 Results of hydrodynamical simulation


In order to compare our optical results, and to ensure that it is not the case that luminosity-gap dependencies only begin to appear at larger luminosity gaps than our observational sample is able to probe, we make use of the EAGLE simulation. EAGLE is a cosmological hydrodynamical simulation which tracks the evolution of baryonic and nonbaryonic matter from z=127 to z=0 (Schaye et al. 2015, Crain et al. 2015). McAlpine et al. (2016) provide a database for querying the halo and galaxy catalogues including FOF group members extracted from the simulation. We used version Ref-L100N1504 of the data release and snapshot 28, corresponding to z=0. The parameters from the simulation analagous to our observational data are as follows: the stellar mass, black hole mass, stellar age, projected half mass radius (projected physical radius enclosing half of the stellar mass averaged over three orthogonal projections), g-band and r-band magnitudes. The g-r colour is calculated from the g-band and r-band magnitudes with dust modelling presented in Trayford et al. (2015). We used a 30 pkpc (proper distance) aperture size for extracting the parameters to allow proper comparison with observations which extract physical parameters from aperture-based measurements. The data were extracted from Table B1-B5 of McAlpine et al. (2016) using the SQL query presented in the Appendix A of this paper.
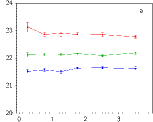
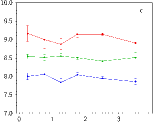
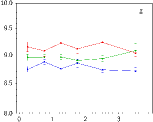
To investigate BGG properties, we extract all z=0 galaxies with stellar masses greater than 109 M⊙, since EAGLE galaxy properties become unreliable below this stellar mass (McAlpine et al. 2016; Schaye et al. 2015). The sample includes 6593 galaxies with 858 unique galaxy groups of 2 or more galaxy members. To make a direct comparison with the observational data, we applied the same r-band absolute magnitude cuts as we applied to the observational data in Section 3, namely -20 (or -19) r-band absolute magnitude cuts for group member definition, and -21.0 (20.5), -21.5 (-21.0) and -22.2 (-21.7) cuts for the BGGs, as well as the corresponding stellar mass cuts outlined in Section 3. This reduces the sample size but allows us to compare the simulation directly against the observational results. Our results are plotted in Fig. 4. All of the results agree well with the observations (Fig. 3) both in the lack of trend and in the normalisation. This gives us confidence in our observational samples.
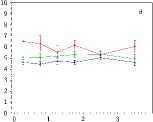
Next, we investigate whether our observational limitations are influencing our ability to detect any trends. To do this, we return to the 858 unique galaxy groups and instead apply no absolute magnitude cuts but only stellar mass cuts (defined to match those of the Mr-19 sub-samples). This larger EAGLE sample allows us to explore the luminosity gap up to higher Mr (up to Mr4). The results are displayed in Figure 5. This shows that the flat trends continue to the highest Mr probed in the simulations (although normalisations change due to the removal of the absolute magnitude limit), and that the lack of any trend in the observed data is thus not due to the limited parameter space of our observations.
5 Luminosity gap and radio properties of BGGs

The work in the previous section confirmed that there is no correlation between the optical properties of the BGGs and the luminosity gap in the subsamples that we have defined, which could drive a secondary dependence of the radio properties on luminosity gap. The next step is then to investigate the radio properties of the BGGs. We calculate the fraction of radio loud BGGs in each bin of luminosity gap for each galaxy group samples in the three different mass ranges. The 3mJy flux density limit of the NVSS has been used to calculate the detection limit for the samples with -19 and -20 cuts at the redshifts of 0.07 and 0.11 respectively. This corresponds to a 1.4 GHz luminosity of 31022 W Hz-1 for -19 cut and 91022 W Hz-1 for -20 cut samples. Therefore, the radio samples are complete to these limits up to the highest redshifts for each.
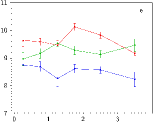
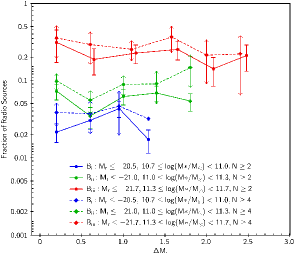
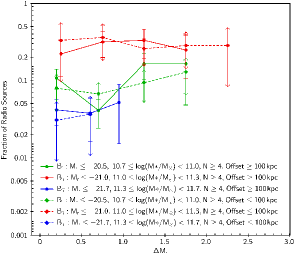
The ‘radio-loud fraction’ is simply the fraction of all the BGGs in a given bin of luminosity gap and mass which satisfy two conditions: (a) they have a radio luminosity greater than the completeness limit; and (b) they are labelled as radio-AGN based on the AGN/SFG separation in Best & Heckman (2012). We note that the Best & Heckman (2012) catalogue also includes the excitation index of the radio AGN, with each source classified as either a high excitation radio galaxy (HERG) or a low excitation radio galaxy (LERG). The BGG sample in this study is dominated by sources classified as LERGs with only few sources classified as HERGs (1), thus the results represent low-accretion-rate-mode AGN activity. The radio-loud fractions are illustrated in Fig. 6. The solid and dashed lines show the results for galaxy groups with richness N 2 (circle) and N 4 (diamond) respectively. Different colours are defined as in Fig. 3. The error bars are calculated using a Poissonian approach. There are no differences in the radio-loud fraction for different luminosity gap bins for any of the samples A-i to B-iii. The results for richness 2 and 4 are consistent with each other especially for massive BGGs where we have the largest magnitude gap bin. This shows that the results are not contaminated by the group finding uncertainties. We also note that the same results are obtained if we change the radio luminosity condition (a) to an order of magnitude higher value to select only very luminous radio AGN as the radio-loud AGN. Therefore, the result is independent of the radio luminosity limit we applied.
From the results presented in Fig. 6, we conclude that the radio loudness properties of the BGGs are much more strongly correlated with stellar mass than with luminosity gap, and, by implication, local environment, at least up to the magnitude gaps that we can investigate with the current sample.

6 BGG Offset from the center of groups
In this Section, we investigate the impact of BGG offset from the center of the group (hereafter the offset) on the fraction of radio AGN. Raouf et al. (2014; 2016) showed that BGG offset can be used as a proxy for halo relaxation; a system with a large offset is regarded as an unrelaxed system. A galaxy group with a small offset and large luminosity gap indicates a dynamically-relaxed, merger-free system; such systems are an ideal testbed for studies of the connection between galaxy interactions and AGN activity. Following the results obtained by Raouf et al., Khosroshahi et al. (2017) showed that the relaxed galaxy groups selected by this method are under luminous in radio compared to the unrelaxed groups. We wish to confirm that the results presented in Section 5 are not biased by these offsets.
We note that the FOF and other optically-based group finding algorithms can not characterize the dynamical status of groups to select virialized and relaxed systems. Therefore, additional constraints are frequently applied. Pearson et al. (2017) apply a limit on the richness and use a set of substructure tests to find relaxed groups. Their method is 80 percent reliable but dramatically filters out the FOF group sample. The success of the Raouf et al. method in finding relaxed groups is based on hydrodynamical simulations. In observational studies, high reliability in selecting virialised and relaxed groups can only be reached with the detection of X-ray emission of the hot halo gas, which will be available in future X-ray surveys.
In the absence of group X-ray data, we follow Khosroshahi et al. (2017) in defining the centre of the group as the luminosity-weighted centre. We use the N4 groups for this analysis to ensure enough group members to allow a sensible position estimate. Galaxy group samples (with both Mr-20 and Mr-19 cuts) are then divided into those cases where the BGG lies within 100 kpc of the group centre, and those where the offset is larger than 100 kpc. Within each subset, the fraction of radio AGN versus luminosity gap has been calculated and is presented in Fig 7. We find no correlation between luminosity gap and the fraction of sources that are radio-bright, for either small or large offset BGGs. This result holds for both the Mr-20 sample, where we have higher S/N at lower luminosity gaps and for the Mr-19 sample where we have lower S/N but can probe higher luminosity gaps. Note that the small decline in the highest mass bin (Mr2) for the Mr-20 sample is not statistically significant, and is not seen in the N2 and 3 samples. Here, the small sample sizes at large luminosity gap bins prevent us from examining whether the results hold if a higher radio luminosity limit is also applied, as we did in Section 5.
The result of this section for large luminosity gap systems (Mr1.7) is not consistent with that of Khosroshahi et al. (2017) which reports a lower radio luminosity for BGGs with small offset to the center of large luminosity gap groups than those with large offset to the center of small luminosity gap groups. Their results may be affected by redshift bias as there is a significant difference between the redshift distributions of the small and large luminosity gap groups in their study, and their study did not take account of the radio survey completeness limit. Since their study covered a relatively wide range of redshifts (0z0.3), using incomplete samples may affect the results significantly.
The -20 cut sample shows indications of a higher fraction of radio-loud BGG for the groups with small offset than those with large offset. The differences are significant in the stellar mass-magnitude gap bins which we have higher signal to noise ratio. Differences of 2 have been observed for the low mass BGGs at Mr0.1, middle mass BGGs at Mr0.8 and massive BGGs at Mr1.4 in the left-hand panel of Fig 7. This result is consistent with Best et al. (2007), who find a higher fraction of radio AGN for the galaxies within 0.2 in galaxy clusters. The difference is not seen for the -19 cut sample in which a lower radio luminosity cut has been used. This suggests that the very bright radio AGN can only be found in the group centre, where the accretion rates from hot gas halo are likely to be higher.
7 Summary and conclusions
We have investigated the radio and optical properties of a sample of galaxy groups from SDSS in order to study the effect of galaxy interactions on the AGN activity within galaxy groups using the group luminosity (or magnitude) gap. No variation has been detected for the fraction of radio loud BGGs or for any of the optical properties of the BGGs with respect to the magnitude gap up to Mr=2.7. We study the effect of BGG offset from the center of group on the AGN activity-magnitude gap results for the BGGs in a 100 kpc radius from the center and outside this radius and show that the radio-AGN fraction is higher for the BGGs located close to the group centre. However no sign of correlation with luminosity gap has been detected for either sample.
Construction of a large observational sample of systems with large Mr is not possible based on current optical and X-ray surveys. Instead, we investigate large Mr systems using the state-of-the-art EAGLE hydrodynamical simulations. The simulation data make it possible to explore the dependence of BGG properties on the magnitude gap up to Mr4. We replicate the observational results and find no change in the optical properties of the BGGs up to the highest Mr. This suggests that we aren’t constrained by the observational limits, although the radio result still needs more investigation at large Mr.
We conclude that the AGN activity, as traced by the radio emission, does not change as the magnitude gap in the group evolves up to Mr=2.7. The black hole power is more influenced by the BGG properties such as stellar mass than the group properties when the magnitude gap is considered. In a recent study, Sabater et al. 2019 also found that they were more dependent on stellar mass than on black hole mass and that therefore stellar mass appears to be the driving factor. Any conclusion above Mr=2.7 limit will need a significant increase in the sample size or deeper optical and radio observations.
Acknowledgments
This work has been supported financially by Research Institute for Astronomy & Astrophysics of Maragha (RIAAM) and Institute for Astronomy Royal Observatory Edinburgh via the visitor grant. HM would like to thank Dr Farhad Daei for his generous technical support. PNB and JS are grateful for support from the UK STFC via grant ST/R000972/1. RKC acknowledges funding from an STFC studentship and the John Harvard Distinguished Science Fellowship. We acknowledge the Virgo Consortium for making their simulation data available. The EAGLE simulations were performed using the DiRAC-2 facility at Durham, managed by the ICC, and the PRACE facility Curie based in France at TGCC, CEA, Bruyéresle-Châtel.
References
- Abazajian et al. (2009) Abazajian, K. N., Adelman-McCarthy, J. K., Agueros, M. A., et al. 2009, ApJS, 182, 543
- Argudo-Fernandez et al. (2016) Argudo-Fernández, M., Shen, S., Sabater, J., et al. 2016, A&A, 592, 30
- Baldwin et al. (1981) Baldwin, J. A., Phillips, M. M., & Terlevich, R. 1981, PASP, 93, 5
- Barisic et al. (2017) Barišić, I., van der Wel, A., Bezanson, R., et al. 2017, MNRAS, 847, 9
- Becker et al. (1995) Becker, R. H., White, R. L., & Helfand, D. J. 1995, ApJ, 450, 559
- Best & Heckman (2012) Best, P. N., & Heckman, T. M. 2012, MNRAS, 421, 1569
- (7) Best, P. N., Kauffmann, G., Heckman, T. M., & Ivezic, Z. 2005a, MNRAS, 362, 9
- (8) Best, P. N., Kauffmann, G., Heckman, T. M., et al. 2005b, MNRAS, 362, 25
- Best et al. (2014) Best, P. N., Ker, L. M., Simpson, C., Rigby, E. E. & Sabater, J., 2014, MNRAS, 445, 955
- Best et al. (2007) Best, P. N., von der Linden, A., Kauffmann, G., Heckman, T. M., & Kaiser C. R. 2007, MNRAS, 379, 894
- Bosch et al. (2007) van den Bosch, F. C., Yang, X., Mo H. J., et al. 2007, MNRAS, 376, 841
- Brown et al. (2011) Brown, M. J. I., Jannuzi, B. T., Floyd, D. J. E., & Mould, J. R., 2011, ApJL, 731, 5
- Chiaberge et al. (2015) Chiaberge, M., Gilli, R., Lotz, J. M., & Norman, C., 2015, ApJ, 806, 147
- Condon et al. (1998) Condon J. J., Cotton W. D., Greisen E. W., et al. 1998, AJ, 115, 1693
- Coziol et al. (2017) Coziol, R., Andernach, H., Torres-Papaqui, J. P., Ortega-Minakata, R. A., & Moreno, del Rio F., 2017, MNRAS, 466, 921
- Crain et al. (2015) Crain, R. A., Schaye J., Bower R. G., et al. 2015, MNRAS, 450, 1937
- Dariush et al. (2007) Dariush, A. A., Khosroshahi, H. G., Ponman, T. J., et al. 2007, MNRAS, 382, 433
- Davies et al. (2017) Davies, R. I., Hicks, E. K. S., Erwin, P., et al. 2017, MNRAS, 466, 4917
- Eke et al. (2004) Eke, V. R., Baugh, C. M., Cole, S., et al. 2004, MNRAS, 348, 866
- Ellison et al. (2015) Ellison, S. L., Patton, D. R., & Hickox, R. C., 2015, MNRASL, 451, 35
- Ellison et al. (2011) Ellison, S. L., Patton, D. R., Mendel, J. T., & Scudder, J. M., 2011, MNRAS, 418, 2043
- Ellison et al. (2008) Ellison, S., L., Patton, D. R., Simard, L., & McConnachie, A. W., 2008, AJ, 135, 1877
- (23) Garofalo, D., Evans, D. A., & Sambruna, R. M. 2010, MNRAS, 406, 975
- (24) Gürkan, G., Hardcastle, M. J., Smith, D. J. B., et al. 2018, MNRAS, 475, 3010
- (25) Hardcastle, M. J., Gürkan, G., van Weeren, R. J., et al. 2016, MNRAS, 462, 1910
- (26) Huchra, J. P., & Geller, M. J., 1982, ApJ, 257, 423
- (27) Ishibashi, W., Auger, M. W., Zhang, D., & Fabian, A. C., 2014, MNRAS, 443, 1339
- (28) Janssen, R. M. J., Röttgering, H. J. A., Best, P. N., & Brinchmann, J., 2012, A&A, 541, 62
- (29) Jiang, L., Fan, X., Ivezic, Z., et al. 2007, ApJ, 656, 680
- (30) Jiang, C. Y., Jing, Y. P., Faltenbacher, A., Lin, W. P., & Li, C., 2008, ApJ, 675, 1095
- (31) Khosroshahi, H. G., Raouf, M., Miraghaei, H., et al. 2017, ApJ, 842, 81
- (32) Kolwa, S., Jarvis, M. J., McAlpine, K., & Heywood, I., 2018, MNRAS, 482, 5156
- (33) Lacey, C., & Cole, S., 1993, MNRAS, 262, 627
- (34) McAlpine, S., Helly, J. C., Schaller, M., et al. 2016, A&C, 15, 72
- (35) McConnell, N. J., & Ma, C. P., 2013, ApJ, 764, 184
- (36) McNamara, B. R., Rohanizadegan, M., & Nulsen, P. E. J., 2011, ApJ, 727, 39
- (37) Miraghaei, H., 2017, AJ, 160, 227
- (38) Miraghaei, H., & Best, P. N., 2017, MNRAS, 466, 4346
- (39) Miraghaei, H., Khosroshahi, H. G., Klockner, H.-R., et al. 2014, MNRAS, 444, 651
- (40) Mittal, R., Hudson, D. S., Reiprich, T. H., & Clarke T., 2009, A&A, 501, 835
- (41) Mo, W., Gonzalez, A., Stern, D., et al. 2018, ApJ, 869, 131
- (42) Narayan, R., & Yi, I., 1995, ApJ, 444, 231
- (43) Novak, M., Smolcic, V., Schinnerer, E., et al. 2018, A&A, 614, 47
- (44) Padovani, P., Mainieri, V., Tozzi, P., et al. 2007, At the Edge of the Universe: Latest Results from the Deepest Astronomical Surveys ASP Conference Series, Vol. 380, p.205 proceedings of the conference held 9-13 October, 2006 at Sintra, Portugal. Edited by Jose Afonso, Henry C. Ferguson, Bahram Mobasher, and Ray Norris.
- (45) Padovani, P., 2011, MNRAS, 411, 1547
- (46) Pearson, R. J., Ponman, T. J., Norberg, P., et al. 2017, MNRAS, 469, 3489
- (47) Raouf, M., Khosroshahi H. G., & Dariush A., 2016, ApJ, 824, 140
- (48) Raouf, M., Khosroshahi, H. G., Ponman, T., J., et al. 2014, MNRAS, 442, 1578
- (49) Rees, G. A., Spitler, L. R., Norris, R. P., et al. 2016, MNRAS, 455, 2731
- (50) Robotham, A. S. G., Norberg, P., Driver, S. P., et al. 2011, MNRAS, 416, 2640
- (51) Sabater, J., Best, P. N., & Argudo-Fernandez, M., 2013, MNRAS, 430, 638
- (52) Sabater, J., Best, P. N., Hardcastle, M. J., et al. 2019, A&A, 622, 17
- (53) Sabater J., Best P. N., & Heckman T. M., 2015, MNRAS, 447, 110
- (54) Sabater, J., Leon, S., Verdes-Montenegro, L., et al. 2008, A&A, 486, 73
- (55) Sabater, J., Verdes-Montenegro, L., Leon, S., Best, P., & Sulentic, J., 2012, A&A, 545, 15
- (56) Satyapal, S., Ellison, S, L., McAlpine, W., et al. 2014, MNRAS, 441, 1297
- (57) Schaye, J., Crain, R. A., Bower, R. G., et al. 2015, MNRAS, 446, 521
- (58) Tago, E., Saar, E., Tempel, E., et al. A&A, 514, 102
- (59) Trayford, J. W., Theuns, T., Bower, R. G., et al. 2015, MNRAS, 452, 2879
- (60) van der Kruit, P. C., 1971, A&A, 15, 110
- (61) Von Der Linden A., Best P. N., Kauffmann G., & White S. D. M., 2007, MNRAS, 379, 867
- (62) Wen Y. H., Wen Z. L., Han J. L., & Hou L. G., 2012, A&A, 542, 25
- (63) York, D. G., Adelman, J., & Anderson, J. E., et al., 2000, AJ, 120, 1579
- (64) Yuan F., & Narayan R., 2014, ARA&A, 52, 529
Appendix A The EAGLE Data SQL query
SELECT
FoF.GroupID as groupid,
FoF.GroupMass as halomass,
AP_Star.Mass_Star as sm,
SH.BlackHoleMass as bhm,
SH.SubGroupNumber as groupno,
SH.SnapNum as snapshotno,
SH.InitialMassWeightedStellarAge as stellarage,
SH.HalfMassRad_Star as r50,
SH.HalfMassProjRad_Star as r50_proj,
AP_Star.SFR as sfr,
AP_Star.Mass_Gas as gasmass,
AP_Star.Mass_BH as apbhm,
magtable.g_nodust as gmag_nodust,
magtable.r_nodust as rmag_nodust,
dustmagtable.SDSS_r as rmag_dust_sdss,
dustmagtable.SDSS_g as gmag_dust_sdss,
dustmagtable.SDSS_r_e as rmag_dust_sdss_edgeon,
dustmagtable.SDSS_g_e as gmag_dust_sdss_edgeon,
dustmagtable.SDSS_r_f as rmag_dust_sdss_faceon,
dustmagtable.SDSS_g_f as gmag_dust_sdss_faceon,
SH.MassType_Star as SH_M_stellar,
SH.MassType_BH as SH_M_BH,
Size.R_halfmass30 as r50_30,
Size.R_halfmass30_projected as r50_30_pro
FROM
RefL0100N1504_Subhalo as SH,
RefL0100N1504_Aperture as AP_Star,
RefL0100N1504_FOF as FoF,
RefL0100N1504_Magnitudes as magtable,
RefL0100N1504_DustyMagnitudes as dustmagtable,
RefL0100N1504_Sizes as Size
WHERE
SH.SnapNum = 28
and SH.GalaxyID = AP_Star.GalaxyID
and SH.GalaxyID = magtable.GalaxyID
and SH.GalaxyID = dustmagtable.GalaxyID
and SH.GroupID = FoF.GroupID
and SH.GalaxyID = Size.GalaxyID
and AP_Star.ApertureSize = 30
and AP_Star.Mass_Star 1e9