LOFAR Detection of 110–188 MHz Emission and Frequency-Dependent Activity from FRB 20180916B
Abstract
FRB 20180916B is a well-studied repeating fast radio burst source. Its proximity ( Mpc), along with detailed studies of the bursts, have revealed many clues about its nature — including a 16.3-day periodicity in its activity. Here we report on the detection of 18 bursts using LOFAR at 110–188 MHz, by far the lowest-frequency detections of any FRB to date. Some bursts are seen down to the lowest-observed frequency of 110 MHz, suggesting that their spectra extend even lower. These observations provide an order-of-magnitude stronger constraint on the optical depth due to free-free absorption in the source’s local environment. The absence of circular polarization and nearly flat polarization angle curves are consistent with burst properties seen at MHz. Compared with higher frequencies, the larger burst widths ( ms at 150 MHz) and lower linear polarization fractions are likely due to scattering. We find rad m-2 variations in the Faraday rotation measure that may be correlated with the activity cycle of the source. We compare the LOFAR burst arrival times to those of 38 previously published and 22 newly detected bursts from the uGMRT ( MHz) and CHIME/FRB ( MHz). Simultaneous observations show 5 CHIME/FRB bursts when no emission is detected by LOFAR. We find that the burst activity is systematically delayed towards lower frequencies by about three days from 600 MHz to 150 MHz. We discuss these results in the context of a model in which FRB 20180916B is an interacting binary system featuring a neutron star and high-mass stellar companion.
1 Introduction
The discovery of radio pulsars (Hewish et al., 1968) using a low-frequency dipole array (81.5 MHz) established the existence of neutron stars, and demonstrated that short-duration, coherent radio pulses can be the sirens of extreme astrophysical environments and events. The prediction of coherent radio bursts from other extreme astrophysical settings and events (e.g., Colgate & Noerdlinger, 1971) inspired early searches for fast radio transients using archival pulsar survey data (e.g., Phinney & Taylor, 1979). The discovery of the “Lorimer Burst” (Lorimer et al., 2007), and other bursts with dispersion time delays that place them outside of our Galaxy (Thornton et al., 2013), in archival Parkes pulsar survey data led to the establishment of a population of fast radio bursts (FRBs).
FRBs are sub-second radio flashes that can be detected over extragalactic distances (see Petroff et al. 2019 and Cordes & Chatterjee 2019 for recent reviews). Their physical origin is as yet unclear, but dozens of models have been proposed (see Platts et al., 2019, for a catalog111https://frbtheorycat.org/ of theories). Both repeating (Spitler et al., 2016) and apparently non-repeating (Petroff et al., 2015; Shannon et al., 2018) FRBs have been detected, and could potentially be created by physically distinct sources or emission mechanisms (CHIME/FRB Collaboration et al., 2019a; Fonseca et al., 2020). Because of their short duration and high brightness temperature, many models have invoked compact objects as the source of FRBs. The recent discovery of an extremely luminous radio burst from the Galactic magnetar SGR J1935+2154 (CHIME/FRB Collaboration et al., 2020b; Bochenek et al., 2020) strengthens the case for FRB models that invoke a similar type of source. In any case, SGR J1935+2154 has demonstrated that neutron stars can produce millisecond-duration radio flashes spanning over seven orders-of-magnitude in apparent luminosity (Kirsten et al., 2020).
The lack of prompt optical, X-ray or gamma-ray counterparts to FRBs222Though note that the Galactic event from SGR 1935+2154 was accompanied by a hard X-ray burst (Mereghetti et al., 2020). (Scholz et al., 2017, 2020; Hardy et al., 2017) underscores the need to extract as many useful constraints as possible from the properties of the radio bursts themselves. Fortunately, detailed spectro-temporal and polarimetric studies of FRBs — using raw voltage data where possible — provide important insights into the emission mechanism and local environment (e.g., Farah et al., 2018; Cho et al., 2020; Day et al., 2020; Nimmo et al., 2020). These studies reveal, e.g, that viable emission mechanisms must account for a wide dynamic range of timescales within and between bursts: from a few microseconds up to several milliseconds (Nimmo et al., 2020). The frequency drifts of sub-bursts (i.e., the ‘sad trombone’ effect; Hessels et al., 2019) appear to be a common feature of repeaters (CHIME/FRB Collaboration et al., 2019b). While some repeating FRBs show remarkably similar polarimetric properties — e.g., FRB 20121102A and FRB 20180916B show flat polarization position angle within and between bursts (Michilli et al., 2018; Nimmo et al., 2020) — the repeating FRB 180301 shows diverse polarization angle swings between bursts (Luo et al., 2020). A larger sample is needed for confirmation, but these spectro-temporal and polarimetric characteristics may indicate a different physical origin or emission mechanism compared to apparent non-repeaters.
Along with FRB 20121102A, FRB 20180916B discovered by the Canadian Hydrogen Intensity Mapping Experiment FRB backend (CHIME/FRB; CHIME/FRB Collaboration et al., 2019a), is the best-characterized repeating FRB. It has recently been shown that the burst rate of FRB 20180916B varies with a period of days (CHIME/FRB Collaboration et al., 2020a, hereafter PR3). FRB 20121102A may also have a -day period to its activity (Rajwade et al., 2020; Cruces et al., 2021). These activity periods might reflect an orbital period (Ioka & Zhang, 2020; Lyutikov et al., 2020; Zhang & Gao, 2020; Popov, 2020), rotational period (Beniamini et al., 2020), or precession period (Levin et al., 2020; Sob’yanin, 2020; Yang & Zou, 2020; Zanazzi & Lai, 2020).
FRB 20180916B is located in a spiral galaxy at a luminosity distance of Mpc (Marcote et al., 2020). This distance makes FRB 20180916B by far the closest known FRB source with a precise localization; in fact, it is also the most precisely localized FRB to date. The 2.3-mas localization provided by the European Very-long-baseline interferometry Network (EVN; Marcote et al., 2020), coupled with -mas imaging from the Hubble Space Telescope (HST), demonstrates that FRB 20180916B is close to, but still offset by pc from the nearest knot of star formation in the host galaxy (Tendulkar et al., 2020). This suggests that FRB 20180916B may be too old (100 kyr10 Myr) to host an active magnetar. Rather, Tendulkar et al. (2020) argue that FRB 20180916B may be a high-mass X-ray binary (HMXB) where interaction between the companion wind and neutron-star magnetosphere produces FRBs.
To date, FRBs have been detected from radio frequencies of 300 MHz (Chawla et al., 2020; Pilia et al., 2020; Parent et al., 2020) up to 8 GHz (Gajjar et al., 2018). FRB 20180916B has thus far only been detected up to 1.7 GHz (Marcote et al., 2020), and Pearlman et al. (2020) demonstrate that it is either less active or fainter at higher frequencies ( GHz). In simultaneous Low-Frequency Array (LOFAR) and Green Bank Telescope (GBT) observations, Chawla et al. (2020) demonstrate burst detections at MHz, while no emission is seen contemporaneously at MHz. Likewise, Pearlman et al. (2020) use Deep Space Network 70-m dish observations to demonstrate that no emission is detected at 2.3 GHz or 8.4 GHz at the time of a bright burst seen by CHIME/FRB from MHz. Such narrow-band emission appears to be a characteristic of repeating FRBs (e.g., Kumar et al., 2021), and has also been well demonstrated for FRB 20121102A (Gourdji et al., 2019; Majid et al., 2020).
Fedorova & Rodin (2019a, b) present FRB candidates detected at 111 MHz with the Large Phased Antenna of the Lebedev Physical Institute. We consider it difficult to establish an unambiguous astrophysical origin for these signals due to the narrow receiver bandwidth used (2.5 MHz over 6 frequency channels; complicating the confirmation of dispersion delay proportional to ), the large number of trials in their blind search and the low S/N of the claimed events.
Detecting FRBs at very low radio frequencies ( MHz) is challenging: sky background temperature (), increase in the effect of scatter broadening in the intervening ionized medium, and uncorrected intra-channel dispersive smearing can all reduce the observed signal-to-noise ratio (S/N). Nonetheless, low-frequency searches can provide strong constraints on the emission mechanism and local environment of an FRB, e.g., by quantifying the influence of free-free absorption, where the optical depth scales roughly quadratically with radio frequency, . Low-frequency FRB searches are thus well motivated scientifically, despite the increased observational challenges. More than 50 years after the seminal discovery of radio pulsars, we are now using broad-band, low-frequency dipole arrays with state-of-the-art digital backends to search for extragalactic radio bursts at frequencies below 300 MHz.
And yet, to date no FRBs have been clearly detected below 300 MHz — despite both simultaneous, multi-frequency, targeted (Law et al., 2017; Sokolowski et al., 2018; Houben et al., 2019) and blind, wide-field (Coenen et al., 2014; Karastergiou et al., 2015; Tingay et al., 2015; Rowlinson et al., 2016; Sanidas et al., 2019) searches using the Low-Frequency Array (LOFAR), Murchison Wide-field Array (MWA) and Long-Wavelength Array (LWA).
Here we present LOFAR333Half of these LOFAR observations (56 hours out of a total 112 hours) are also reported on by an independent group in parallel (Pastor-Marazuela et al., 2020). high-band antenna (HBA; MHz), upgraded Giant Metre Wavelength Radio Telescope (uGMRT; MHz) and CHIME/FRB ( MHz) observations of FRB 20180916B. These observations achieve, by far, the lowest-frequency FRB detections to date, and provide an unprecedented data set to investigate whether the observed activity of the source systematically depends on radio frequency. We present the observations in §2 and §3, and discuss their implications for FRB source and emission models in §4. We conclude in §5.
2 Observations
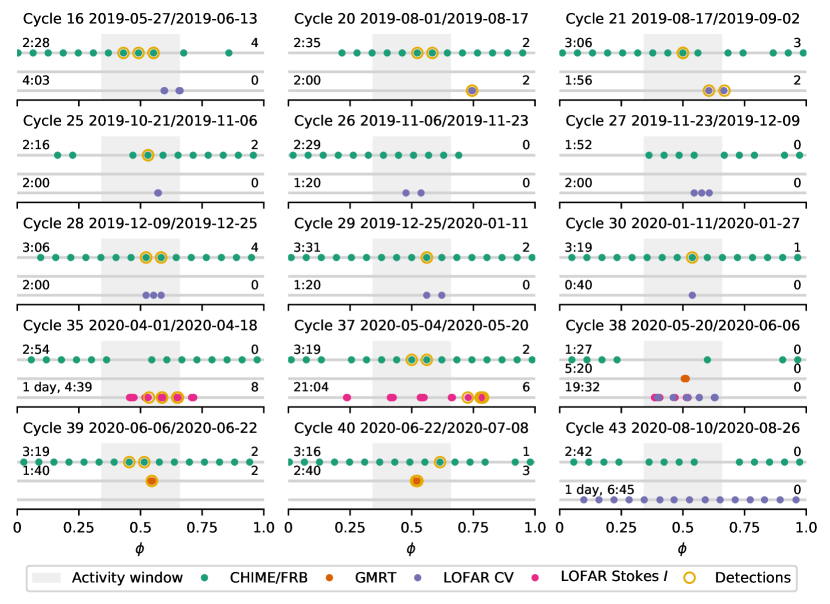
Figure 1 presents an overview of the LOFAR, uGMRT and CHIME/FRB observations taken in 15 different, and not necessarily contiguous, 16.3-day cycles of activity of FRB 20180916B (as determined from CHIME/FRB detections). Throughout this paper, a dispersion constant of MHz2 cm3 pc-1 s is used, following the pulsar convention (Manchester & Taylor 1972; see discussion in Kulkarni 2020).
2.1 LOFAR
FRB 20180916B was observed with LOFAR (van Haarlem et al., 2013) using its beam-formed modes (Stappers et al., 2011) for 112 hours on 128 occasions between 2019 June 6 and 2020 August 26. The Cobalt correlator and beamformer (Broekema et al., 2018) coherently combined signals from the HBA antennas of the LOFAR Core stations to create a tied-array beam pointing to the best-known position of FRB 20180916B. The best CHIME/FRB localization of , (estimated uncertainty of ; derived from baseband data) was used until 2019 August, while the much more precise position from the EVN localization, , (2.3-mas uncertainty), from Marcote et al. (2020) was used afterwards. The angular separation between the two positions is . As all observations used either the innermost 22 or 20 LOFAR Core stations, the FWHM of the tied-array beam was slightly offset from the actual celestial position of FRB 20180916B in the observations prior to 2019 August, which led to a factor lower sensitivity for those early observations. Observations were obtained with the source at altitudes ranging from 37° up to culmination at 77°, with 86% of the observations being obtained at altitudes of 60° or higher.
The earliest LOFAR observations (up to approximately source activity Cycle 26; see Figure 1) were scheduled in response to CHIME/FRB detections. After the identification of a 16.3-day activity period by CHIME/FRB, observations were scheduled close to the peak in the CHIME/FRB-derived activity window (Cycle 26 and later). The observations in Cycle 43 were intended to broadly cover the full range of activity phases.
For all observations, 400 subbands of 195.3125 kHz each were recorded, covering observing frequencies of 110 to 188 MHz for a total bandwidth of 78.125 MHz. For 56 hours of the observations, the Cobalt correlator and beamformer generated total-intensity Stokes filterbank data, with a frequency and time resolution of 3.05 kHz and 983.04 s, respectively. Nyquist-sampled, dual-polarization complex voltages (“CV” data, with 195.3125 kHz frequency resolution and 5.12 s time resolution) were recorded for the other 56 hours of observations. For the dispersion measure of FRB 20180916B pc cm-3 (Nimmo et al., 2020) the dispersion delay from infinite frequency to the top of the observed LOFAR band (188 MHz) is 40.9 s, and the delay within the band, from 188 MHz down to 110 MHz, is 78.7 s.
The CV data allow for coherent dedispersion, a technique that we are employing to search for FRBs and millisecond pulsars using LOFAR and our DRAGNET GPU cluster (Bassa et al., 2017a, b). In this paper, we apply coherent dedispersion for burst characterization (see §3), but given the large burst widths, and to allow for a homogeneous burst search of both the Stokes and the complex voltage datasets, we chose not to coherently dedisperse the CV data for the purposes of searching for signals. Instead, the complex voltage data were channelized, time averaged and the polarizations were squared and summed offline to form Stokes filterbanks with the same time and frequency resolution as the Stokes filterbanks (3.05 kHz and 983.04 s) generated by Cobalt in real time. To reduce their size, these filterbanks were first averaged in frequency by a factor of 16 with digifil (van Straten & Bailes, 2011), using incoherent dedispersion to pc cm-3. With this setup, dispersive smearing due to incoherent dedispersion at the DM of FRB 20180916B varies from 1.3 to 6.7 ms over the LOFAR band. This temporal smearing is negligible compared to the burst widths. Radio frequency interference (RFI) was identified using the rfifind tool from the Presto software (Ransom, 2001; Ransom et al., 2002) and replaced with random noise of the appropriate mean and standard deviation. Next, dedispersed time series were generated between DMs of 300 to 400 pc cm-3, with steps of 0.1 pc cm-3, using the GPU-accelerated Dedisp dedispersion library (Barsdell et al., 2012).
To maximize sensitivity towards possibly narrow-band radio bursts (motivated by Gourdji et al., 2019; Kumar et al., 2021), these time series were created for the full observing band (110–188 MHz), as well as three overlapping halves (110–149 MHz, 130–169 MHz and 149–188 MHz), and seven overlapping quarters of the band (110–129 MHz, 120–139 MHz, etc.). These time series were cross-correlated with top-hat functions with widths up to 150 ms, using a GPU-accelerated version of single_pulse_search.py from Presto to search for bursts. All candidate burst events with were visually inspected to distinguish bursts from residual RFI. For the 12 data sets with known bursts, we verified that the burst selection is complete by assessing the burst candidates using the FETCH deep-learning-based classifier (Agarwal et al., 2020). All the single pulses identified were grouped using Single-pulse Searcher (Michilli & Hessels, 2018), and redundant burst candidates were eliminated before putting them through the FETCH classifier.
2.2 uGMRT
The uGMRT (Gupta et al., 2017) observations of FRB 20180916B were carried out on three different days: 2020 May 29, 2020 June 15 and 2020 July 1. The observations were intentionally scheduled close to the peak of the CHIME/FRB-derived activity window, and the telescope was phased-up towards the EVN position of FRB 20180916B during all observations. On 2020 May 29, we used both Band 2 (180–280 MHz) and Band 3 (250–350 MHz) simultaneously with two phased-array beams employing two sub-arrays: one sub-array using 10 of the available 29 central-square antennas at Band 2 (180–280 MHz), and another sub-array at Band 3 (250–500 MHz) using the remaining 19 antennas. We used the uGMRT Wideband Backend (GWB; Reddy et al., 2017) to record coherently dedispersed total-intensity filterbank data with the passband split into 2,048 channels with 327.68 s sampling time in both phased-array beams. The observations were divided into eight 20-minute sessions with a provision to re-phase the sub-arrays in between the sessions to account for the temporal instrumental gain and ionospheric changes. We used the same setup on June 15 with five 20-minute sessions, but the Band 2 data were not usable due to strong RFI. On 2020 July 1, we observed only in Band 3 set to 250–450 MHz using 24 antennas in four 40-minute sessions. The coherently dedispersed filterbank data were recorded with 81.92-s time resolution and 2,048 frequency channels across the 200-MHz band. On all three days we have also recorded “ON” source and “OFF” source data on 3C48 for calibration purposes.
To prepare the data for searching, we identified and mitigated narrow-band RFI and broad-band time-domain RFI using gptool (Susobhanan et al., 2020). The single-pulse search was carried out using a machine-learning technique based on Zhang et al. (2018). We have trained our convolutional neural network model using archival uGMRT data and simulated CHIME/FRB-like FRBs with various burst morphologies. The details of our implementation will be published elsewhere. This particular search is tuned for 200 DM 500 pc cm-3 and is sensitive to pulse widths up to 256 ms. The dynamic spectra of candidates were visually examined to distinguish astrophysical signals from spurious RFI.
2.3 CHIME/FRB
CHIME/FRB searches intensity data from 1,024 stationary synthesized beams for dispersed transients over a 200 deg2 field-of-view in the 400–800 MHz octave in real time (CHIME/FRB Collaboration, 2018). The intensity data have a 0.98304-ms time resolution and 16,384 frequency channels.
The median daily exposure of the experiment to the sky position of FRB 20180916B is 746 s (i.e., the time spent by the source within the FWHM of the synthesized beams at 600 MHz). The transit time of the source through the primary beam of the instrument, however, is much longer (40 minutes), albeit with significant variation in sensitivity that is still in the process of being quantified outside of the FWHM of the synthesized beams.
| Burst | Barycentric arrival time (TDB) at | aaBurst width (FWHM), for a Gaussian function fitted to the time series. | S/NbbBand-averaged S/N. Four LOFAR-detected bursts were found in a search of the half- and quarter-bandwidth data segments. | Fluence | Peak flux density | ||||
| (UTC) | (MJD) | (ms) | (MHz) | (MHz) | (Jy ms) | (Jy) | |||
| LOFAR | |||||||||
| CV1 | 2019-08-13T03:26:33.454 | 58708.14344 | 0.74363 | 73(3) | 133.7 | 182.8 | 28.6 | 148(8) | 4.7(1) |
| CV2ccOnly detected in a sub-band search. | 2019-08-13T04:01:43.268 | 58708.16786 | 0.74512 | 119(35) | 109.8 | 139.0 | 3.9 | 26(9) | 1.51(9) |
| CV3 | 2019-08-27T04:53:30.828 | 58722.20383 | 0.60464 | 72(7) | 133.9 | 175.9 | 11.4 | 49(11) | 2.15(7) |
| CV4 | 2019-08-28T05:14:19.946 | 58723.21829 | 0.66677 | 158(7) | 109.8 | 135.6 | 25.5 | 196(22) | 3.6(2) |
| I01ccOnly detected in a sub-band search. | 2020-04-10T15:21:25.278 | 58949.63988 | 0.53214 | 43(10) | 146.5 | 188.0 | 5.1 | 27(10) | 2.06(8) |
| I02ccOnly detected in a sub-band search. | 2020-04-11T12:42:02.337 | 58950.52919 | 0.58660 | 42(8) | 131.3 | 188.0 | 6.3 | 38(9) | 1.85(9) |
| I03 | 2020-04-11T12:59:28.444 | 58950.54130 | 0.58734 | 87(8) | 151.5 | 188.0 | 11.8 | 86(10) | 3.0(2) |
| I04 | 2020-04-11T14:00:12.520 | 58950.58348 | 0.58993 | 66(6) | 148.9 | 188.0 | 13.2 | 68(11) | 2.75(8) |
| I05 | 2020-04-12T12:59:56.684 | 58951.54163 | 0.64860 | 80(4) | 124.8 | 185.7 | 21.5 | 140(9) | 3.75(7) |
| I06 | 2020-04-12T13:23:32.453 | 58951.55801 | 0.64960 | 58(2) | 135.2 | 188.0 | 27.8 | 145(13) | 5.4(1) |
| I07 | 2020-04-12T14:01:58.736 | 58951.58471 | 0.65124 | 69(4) | 123.5 | 188.0 | 20.0 | 103(9) | 3.9(1) |
| I08 | 2020-04-12T14:11:32.715 | 58951.59135 | 0.65164 | 41(4) | 138.6 | 188.0 | 11.5 | 65(10) | 2.9(1) |
| I09 | 2020-05-16T11:35:48.666 | 58985.48320 | 0.72708 | 50(5) | 128.2 | 188.0 | 12.7 | 97(39) | 3.4(6) |
| I10 | 2020-05-17T07:50:25.499 | 58986.32668 | 0.77873 | 63(7) | 134.7 | 188.0 | 10.5 | 59(10) | 2.7(1) |
| I11ccOnly detected in a sub-band search. | 2020-05-17T08:21:41.703 | 58986.34840 | 0.78006 | 93(14) | 109.8 | 152.5 | 7.5 | 43(9) | 1.65(5) |
| I12 | 2020-05-17T10:58:01.354 | 58986.45696 | 0.78671 | 65(8) | 129.7 | 188.0 | 10.0 | 53(9) | 2.4(1) |
| I13 | 2020-05-17T11:03:23.282 | 58986.46069 | 0.78694 | 51(5) | 126.1 | 188.0 | 12.8 | 66(7) | 3.64(5) |
| I14 | 2020-05-17T11:51:01.413 | 58986.49377 | 0.78896 | 57(2) | 116.9 | 188.0 | 38.5 | 308(10) | 10.57(7) |
| uGMRT | |||||||||
| G1 | 2020-06-15T04:25:47.176 | 59015.18457 | 0.54590 | 17(3) | 270ddEstimated by eye because baseline variations due to residual broad-band RFI prohibited fitting a model to the burst spectra. | 350ddEstimated by eye because baseline variations due to residual broad-band RFI prohibited fitting a model to the burst spectra. | 25.0 | 161(71) | 8(2) |
| G2 | 2020-06-15T04:32:28.540 | 59015.18922 | 0.54619 | 12(4) | 280ddEstimated by eye because baseline variations due to residual broad-band RFI prohibited fitting a model to the burst spectra. | 350ddEstimated by eye because baseline variations due to residual broad-band RFI prohibited fitting a model to the burst spectra. | 8.5 | 26(11) | 2.3(4) |
| G3 | 2020-07-01T01:16:03.761 | 59031.05282 | 0.51763 | 39(7) | 325ddEstimated by eye because baseline variations due to residual broad-band RFI prohibited fitting a model to the burst spectra. | 410ddEstimated by eye because baseline variations due to residual broad-band RFI prohibited fitting a model to the burst spectra. | 6.1 | 33(14) | 1.6(3) |
| G4 | 2020-07-01T03:03:41.718 | 59031.12757 | 0.52220 | 18(3) | 375ddEstimated by eye because baseline variations due to residual broad-band RFI prohibited fitting a model to the burst spectra. | 450ddEstimated by eye because baseline variations due to residual broad-band RFI prohibited fitting a model to the burst spectra. | 12.0 | 27(11) | 2.5(4) |
| G5 | 2020-07-01T03:17:40.549 | 59031.13727 | 0.52280 | 98(8) | 300ddEstimated by eye because baseline variations due to residual broad-band RFI prohibited fitting a model to the burst spectra. | 450ddEstimated by eye because baseline variations due to residual broad-band RFI prohibited fitting a model to the burst spectra. | 16.4 | 178(58) | 3.3(8) |
| CHIME/FRB | |||||||||
| CF39 | 2020-02-19T23:54:17.856 | 58898.99604 | 0.43087 | 4.8(6) | 418 | 520 | 8.8 | 1.8(4) | 0.4(2) |
| CF40 | 2020-02-20T00:10:50.592 | 58899.00753 | 0.43158 | 5.5(7) | 429 | 526 | 11.8 | 1.9(6) | 0.3(2) |
| CF41 | 2020-02-21T00:10:23.808 | 58900.00722 | 0.49279 | 2.6(2), 2.7(2) | 417 | 469 | 24.7 | 5(2) | 0.7(3) |
| CF42 | 2020-03-24T21:33:36.576 | 58932.89834 | 0.50694 | 3.1(3) | 403 | 460 | 13.0 | 1.6(6) | 0.4(2) |
| CF43 | 2020-04-23T19:35:03.264 | 58962.81601 | 0.33901 | 0.54(3) | 400 | 693 | 12.6 | 0.9(5) | 1.5(6) |
| CF44 | 2020-04-24T19:49:22.944 | 58963.82596 | 0.40085 | 1.0(1) | 545 | 674 | 9.2 | 2.0(5) | 0.8(3) |
| CF45 | 2020-05-12T18:33:52.128 | 58981.77352 | 0.49991 | 0.7(2), 2.9(1) | 690 | 800 | 22.7 | 12(3) | 1.7(6) |
| CF46 | 2020-05-13T18:26:35.808 | 58982.76847 | 0.56084 | 3.7(4) | 403 | 469 | 12.2 | 2.2(7) | 0.4(3) |
| CF47 | 2020-06-13T16:33:47.232 | 59013.69013 | 0.45439 | 2.7(2) | 400 | 479 | 19.3 | 4(1) | 0.9(4) |
| CF48 | 2020-06-14T16:22:57.504 | 59014.68261 | 0.51516 | 0.72(3), 2.6(4) | 539 | 639 | 15.4 | 14(4) | 3.0(8) |
| CF49 | 2020-07-02T15:22:45.120 | 59032.64080 | 0.61487 | 4.2(2) | 407 | 462 | 16.2 | 5(1) | 0.6(3) |
| CF50 | 2020-07-17T13:55:55.200 | 59047.58050 | 0.52973 | 3.7(2) | 400 | 432 | 17.7 | 4(1) | 0.6(2) |
| CF51 | 2020-07-17T14:04:18.048 | 59047.58632 | 0.53009 | 2.5(2) | 443 | 511 | 11.5 | 0.8(2) | 0.2(2) |
| CF52 | 2020-08-01T13:26:53.376 | 59062.56034 | 0.44705 | 2.7(4) | 428 | 462 | 8.3 | 0.9(3) | 0.3(2) |
| CF53 | 2020-09-03T11:12:54.720 | 59095.46730 | 0.46217 | 2.9(3) | 536 | 688 | 11.1 | 5(1) | 1.1(4) |
| CF54 | 2020-09-04T10:54:30.528 | 59096.45452 | 0.52263 | 1.19(9) | 707 | 800 | 15.8 | 2.5(6) | 1.2(4) |
| CF55 | 2020-09-19T09:48:59.328 | 59111.40902 | 0.43840 | 6.4(7) | 400 | 447 | 10.9 | 1.8(3) | 0.3(2) |
3 Results
All bursts presented here have been dedispersed to pc cm-3, as determined from aligning sub-structure in EVN voltage data at 1 s resolution (Nimmo et al., 2020). We decided against optimizing individual burst DMs, as DM and burst morphology are known to be covariant (especially for the majority of low S/N ‘smudgy’ bursts; Gourdji et al., 2019) and there is as-of-yet no evidence for DM evolution of FRB 20180916B (PR3).
3.1 LOFAR
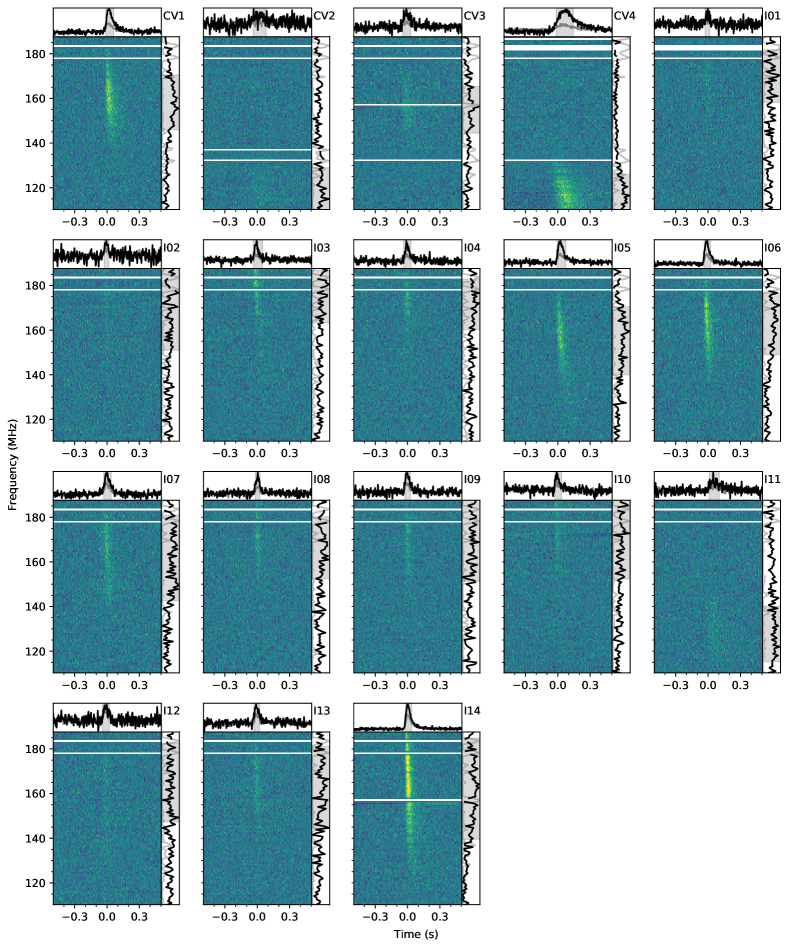
A total of 18 bursts were detected using LOFAR: 14 were found in the full-bandwidth data, and another 4 fainter bursts were identified in the time series generated from the half- and quarter-bandwidth data segments. The dynamic spectra of these bursts are presented in Figure 2. Four of the bursts occurred during complex voltage observations, and thus have available polarimetric information. These are labelled CV1 through CV4, while the bursts obtained in total-intensity Stokes data are labelled I01 through I14.
Bursts I01 through I08 correspond to the bursts L02 though L09 presented by Pastor-Marazuela et al. (2020). Our analysis did not recover their L01 burst due to periodic baseline variations affecting 2.6 hr of the LOFAR observations. These variations were the result of a rare temporary clock skew at one of the LOFAR stations where some network packets of this station arrived out of sync at the COBALT beamformer (Broekema et al., 2018) and were discarded. Hence, the number of stations added coherently in the tied-array beam varied at the s beamformer block size of COBALT. The resulting baseline variations increased the noise in the dedispersed timeseries of these observations, placing the signal-to-noise of this burst below our detection threshold.
FETCH positively identified the same set of 18 bursts found through visual inspection, including the four faint bursts found only in the sub-band search, using the full-bandwidth data. The 14 bursts identified by visual inspection in the full-bandwidth data were classified as astrophysical pulse candidates with probabilities greater than 83% by all 11 available models (labeled a to k) of FETCH. The 3 fainter bursts I01, I02 and I11 were positively identified by at least 9 of the 11 models with probabilities greater than 64%. The faintest burst CV2 could only be identified by FETCH models e and h, each with a probability more than 93%. No additional bursts were found in these data sets.
The LOFAR burst properties were determined by fitting Gaussian profiles to the time and frequency averages of the dynamic spectra to obtain their arrival times, temporal and spectral widths (FHWM) and emission frequencies (Table 1). All observed bursts are band-limited, with spectral widths (defined as FWHM) ranging from 20 to 50 MHz, and the majority of the bursts, 15 out of 18, peaking in brightness above 160 MHz. The temporal width of the bursts varies between 40 ms for bursts peaking in the top of the LOFAR band ( MHz) to 160 ms near the bottom of the LOFAR band ( MHz).
To calibrate the LOFAR detections we have subtracted the mean of an off-burst region in each frequency channel and divided by the standard deviation of the off-burst region. We then convert each channel from S/N to flux units using the radiometer equation:
| (1) |
where is the system temperature (receiver and sky), the gain, the number of summed polarizations, the channel bandwidth and the sampling time. For the calculation of and we take into account the number of Core stations used and we correct for the zenith-angle dependence, as described by Kondratiev et al. (2016). We calculate these values at the times of the burst detections. In the center of the band (149 MHz) K (note that FRB 20180916B is at a Galactic latitude of with K at 150 MHz) and K Jy-1, on average. We repeat this measurement using six different independent, but adjacent, -ms off-pulse regions in the same observation as the burst and quote the average (band-averaged) fluence and peak flux of the bursts, as well as the standard deviation across the six samples, in Table 1. Note that the systematic uncertainty in the flux measurements could be larger than reported in Table 1, due to unaccounted contributions from the ionosphere and the Galactic plane, or other bright sources in the primary beam of the HBAs. As the systematic errors likely underestimate system noise, the fluence measurements are likely also underestimated.
Even after dedispersion to the best-fit DM from Nimmo et al. (2020), the brightest LOFAR bursts show residual time delays towards lower observing frequencies, with one burst (CV4) broadening with decreasing frequency. Due to the absence of visible burst sub-structure, it is unclear if these effects are due to DM underestimation, multi-path scattering, or the frequency drifts of unresolved sub-bursts (i.e., the ‘sad trombone’ effect; Hessels et al., 2019). Deviations from the canonical dispersion relation are expected at low radio frequencies (see Hassall et al., 2012, and references therein), and it is also possible that the residual time delays in CV4 result from such deviations.
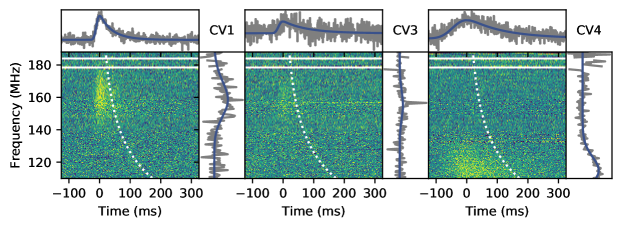
To measure a scattering timescale, we use a least-squares fitting routine, previously developed for CHIME/FRB bursts (e.g., Josephy et al., 2019; CHIME/FRB Collaboration et al., 2019a), to model the dynamic spectra of the LOFAR bursts. We analyze the three brightest bursts that can be coherently dedispersed: bursts CV1, CV3 and CV4, where dspsr (van Straten & Bailes, 2011) was used to generate coherently dedispersed single pulse profiles. We fixed pc cm-3 (Nimmo et al., 2020) and assumed that the bursts consist of only one component. We referenced the scattering timescale to 150 MHz and fixed the scattering index to . The results are provided in Table 2 and Figure 3. The measured scattering timescale for the two bursts with highest S/N (CV1 and CV4) is 50 ms at 150 MHz. The other measured timescale, for burst CV3, is more uncertain due to the low detection S/N and narrow bandwidth of the burst.
| Burst | Width | RM | RM | |
|---|---|---|---|---|
| (ms) | (ms) | (rad m-2) | (rad m-2) | |
| CV1 | 6.608(1) | 54.142(4) | 115.71(3) | 0.30(8) |
| CV3 | 8.313(4) | 94.55(2) | 114.78(9) | 0.34(4) |
| CV4 | 31.426(3) | 46.692(3) | 114.43(4) | 0.39(5) |
3.2 Polarization analysis
We recorded polarization, using LOFAR’s orthogonal linear feeds, for bursts CV1–4; three of these bursts are bright enough to perform polarimetric analyses. We corrected for azimuth and elevation-dependent gain using the LOFAR beam model, as implemented within the dreamBeam package.444https://github.com/2baOrNot2ba/dreamBeam No additional polarization calibration, beyond that already implemented to form the individual station and Core tied-array beams (Stappers et al., 2011), was performed and, thus, slight degradation of the polarization fraction (%) could arise, e.g., from the thermal expansion of the cables. The absence of an absolute polarization calibration also prevents us to compare the polarization angle (PA) between different bursts. In this analysis, the frequency resolution was increased to kHz (16 channels synthesized within each 195-kHz subband) to have an intra-channel depolarization smaller than 1% across the whole band at the value of rotation measure (RM) reported by CHIME/FRB Collaboration et al. (2019a). We measured the RM value of each burst by using RM synthesis555https://github.com/CIRADA-Tools/RM-Tools (Burn, 1966; Brentjens & de Bruyn, 2005) and a deconvolution algorithm (Heald, 2009); the Stokes parameters of each burst have been corrected for the resulting value.
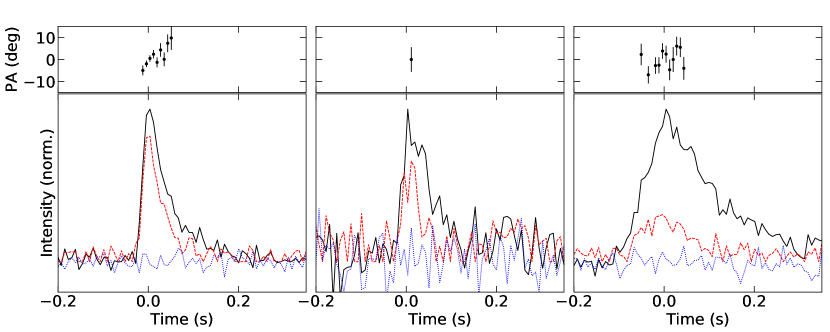
We report the polarization profiles for the three bursts in Figure 4, using the coherently dedispersed pulse profiles from § 3.1. The linear polarization fractions of CV1, CV3 and CV4 are roughly 70%, 60% and 30%, respectively — much lower than the 100% reported at higher frequencies of MHz (CHIME/FRB Collaboration et al., 2019a; Chawla et al., 2020; Nimmo et al., 2020). Noutsos et al. (2015) performed a long observation of PSR B2217+47 to study the depolarization fraction as a function of the hour angle (HA) for LOFAR. They found a depolarization fraction for hours and zenith angle . Our observations of FRB 20180916B are well within this range, with a maximum hour angle of hours and a maximum zenith angle of . Given also the absence of any visible artifacts in the Faraday dispersion function that could indicate the presence of signal leakage or uncorrected delay between the polarization channels (such as a peak at rad m-2 or symmetric peaks around rad m-2) we conclude that the observed depolarization towards lower radio frequencies is predominantly astrophysical in origin.
Part of the depolarization at lower frequencies could therefore be intrinsic to the source emission or be related to extrinsic propagation effects. In particular, CV4 is observed at the lowest frequencies and has the lowest linear polarization fraction, which is compatible with depolarization due to scattering, as observed in some pulsars (e.g., Noutsos et al., 2015; Xue et al., 2019). As at higher frequencies, the circular polarization fraction here is consistent with %. The PA curve is nearly flat at higher frequencies, though subtle variations are seen on short timescales (Nimmo et al., 2020). While the PA curve of CV4 is consistent with being flat (), the PA curve of the brightest burst, CV1, shows a hint of an increase at later times, with a with respect to a straight line. Day et al. (2020) similarly find evidence for a time-varying PA in the wide and potentially scatter-broadened FRB 190608.
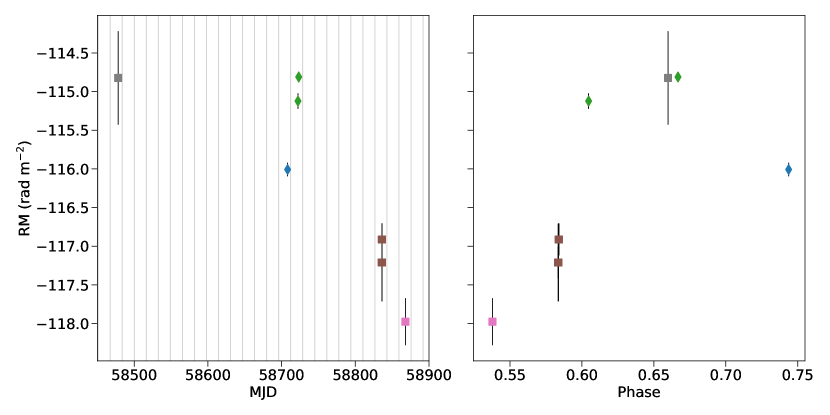
The lack of refined polarization calibration is not expected to affect the RM values measured by LOFAR (e.g., Sobey et al., 2019), which are reported in Table 2. We compare the new LOFAR RM values obtained here with other measurements presented by CHIME/FRB Collaboration et al. (2019a) and Chawla et al. (2020). The ionospheric contribution to the observed burst RMs was determined using ionFR666https://github.com/csobey/ionFR (Sotomayor-Beltran et al., 2013), which utilizes data from the International Geomagnetic Reference Field and IONosphere map EXchange (IONEX) global ionospheric maps. The resulting values are shown in Figure 5 as a function of date and source activity phase, as measured by PR3 and refined in §3.5. There is a hint of RM values changing systematically as a function of activity phase, as measured by different instruments in different activity cycles. However, the RM variations may simply be stochastic; more detections are needed to investigate this further.
3.3 uGMRT
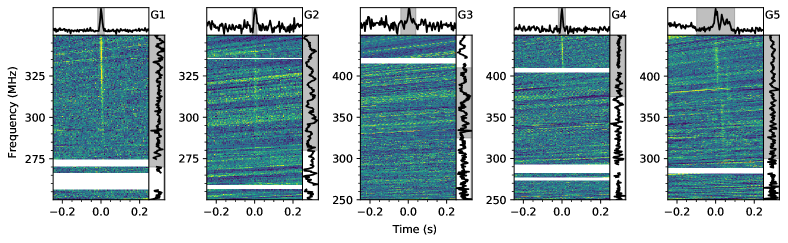
We detected five bursts in the uGMRT data. Two in the 250–350-MHz band on 2020 June 15 and three in the 250–450-MHz band on 2020 July 1. We did not detect any bursts on 2020 May 29. The burst dynamic spectra are presented in Figure 6. To calibrate the bursts we have used the counts per Jansky estimated for every clean frequency channel from the “ON” and “OFF” data of 3C48. The conversion factors are multiplied with the filterbank counts to get the calibrated data. The measured peak flux densities and fluences are presented in Table 1.
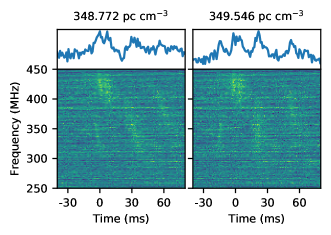
We caution the reader not to over-interpret the spectral structure of the uGMRT bursts, due to the baseline variations from residual broad-band RFI in the dynamic spectra. The four sub-bursts in burst G5, however, are likely of astrophysical origin: the dispersion delay (quadratic and 16 s from 450 to 250 MHz) and dispersion smearing within the frequency channels of these candidates are as expected for the DM of the source and we find no candidate bursts at other DMs with similar properties. Using DM_phase777https://github.com/danielemichilli/DM_phase (Seymour et al., 2019) we align the sub-bursts of G5 and find an optimum pc cm-3. In Figure 7 we show a comparison of the dynamic spectra of the bursts, dedispersed to the fiducial and optimum DM values.
3.4 CHIME/FRB
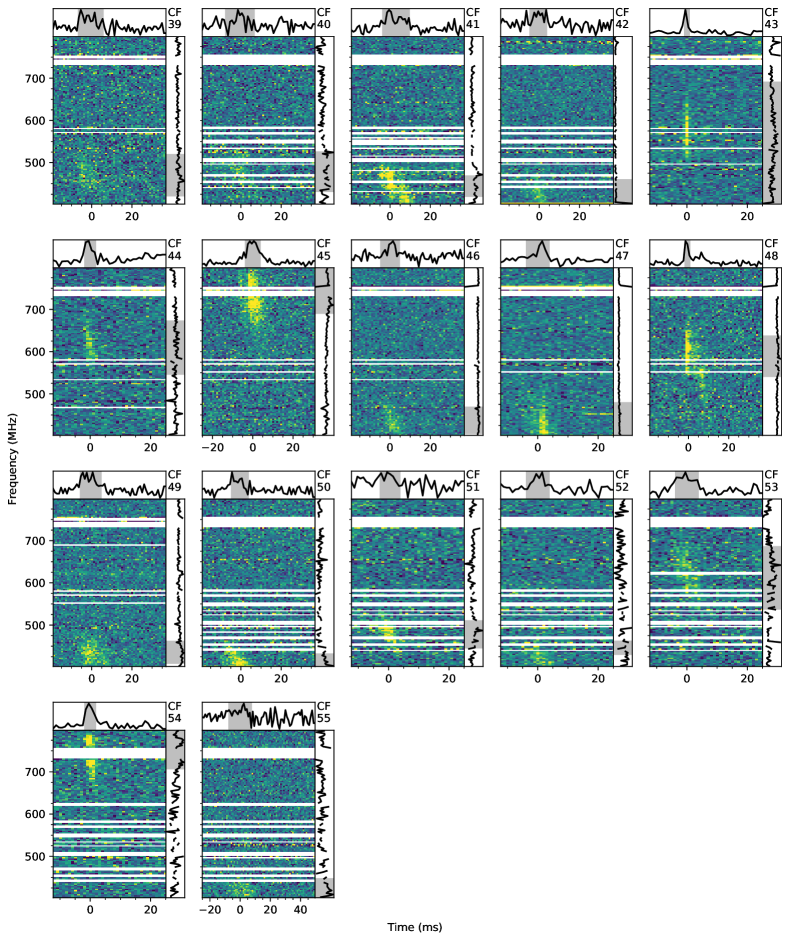
We present 17 new bursts detected by CHIME/FRB since PR3888Note that the burst arrival times were previously announced at https://www.chime-frb.ca/repeaters/180916.J0158+65.. The burst dynamic spectra are presented in Figure 8. The morphologies of the bursts are comparable to those previously detected by CHIME/FRB; they exhibit narrow (50–150 MHz) bandwidths and sometimes show downward-drifting sub-bursts (CHIME/FRB Collaboration et al., 2019a).
We construct burst models and measure peak fluxes and fluences as in CHIME/FRB Collaboration et al. (2020a). In summary, we fit single- or multi-component models of dynamic spectra to the 0.98304-ms total-intensity data for each burst using a least-squares algorithm. Data are flux calibrated using transits of steady sources and scaled by the beam response using the best known location of FRB 20180916B and a model for the synthesized beams. For bursts detected outside of the FWHM of the synthesized beams at 600 MHz, peak fluxes and fluences are lower limits.
3.5 Frequency dependence of periodic activity
We recalculate the activity period and burst rate of FRB 20180916B using the same methods as described in PR3. We measure the activity period to be days, with a 5.2-day window, based on the now reported 55 CHIME/FRB detections. We use reference MJD to put the average arrival time of the CHIME/FRB bursts at . We estimate the CHIME/FRB detection rate to be bursts per hour above a fluence threshold of 5.1 Jy ms for a -day interval around each cycle of activity (31 detections in 39.1 hours of exposure). In the activity window of 0.96 days around each cycle of activity, we estimate the detection rate to be bursts per hour (22 detections in 14.9 hours of exposure).
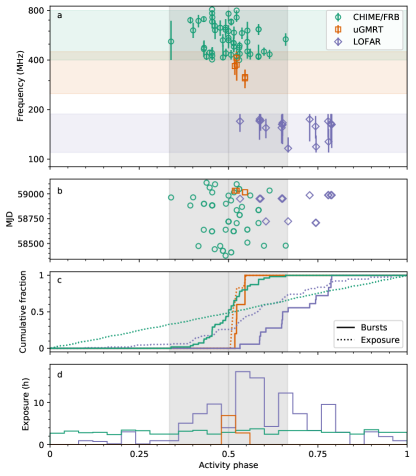
Both LOFAR and uGMRT predominantly observed FRB 20180916B during the 5.4-day activity window from PR3, though in later activity cycles LOFAR also targeted activity phases outside of the activity window (see Figure 1). Figure 9 shows the barycentred arrival times of the CHIME/FRB, uGMRT and LOFAR bursts folded on the activity period of days — as a function of observing frequency, MJD, as well as cumulative fractions and histograms of the exposure of each instrument. The bursts observed with LOFAR fall between activity phases of , corresponding to a range of 4.1 days within the 16.33-day activity period. This observed LOFAR activity window is nominally shorter than the 5.2-day activity window width observed from the CHIME/FRB bursts, but additional LOFAR observations may show the activity window to be wider. The average activity phase of the LOFAR bursts is , which is offset by 2.6 days from the average activity phase of FRB 20180916B determined from CHIME/FRB bursts (PR3). We note that the LOFAR burst detections as a function of activity phase are not just simply a reflection of the observing exposure. Through a two-sample Kolmogorov-Smirnov test we can reject the null hypothesis that the cumulative distribution functions of the LOFAR exposure and the LOFAR bursts shown in Figure 9 are drawn from the same distribution ().
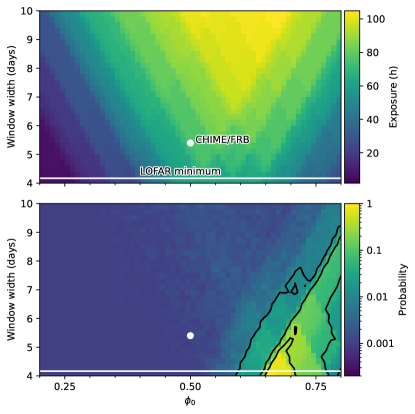
We performed numerical simulations to investigate the impact of the non-uniform exposure of the LOFAR observations as a function of activity phase (see Figure 9c and d) on the properties of the activity window at LOFAR frequencies. We define an activity window by its width and central phase , and compute the effective exposure of the LOFAR observations that fall within this activity window. The top panel of Figure 10 shows the LOFAR exposure given the properties of the activity window. As 18 bursts were observed with LOFAR, the exposure will provide the burst rate as a function of and . Given the activity window properties and the burst rate, we draw burst arrival times from a uniform distribution within the activity window for the activity cycles spanning the LOFAR observations (see Figure 1). For each and combination, we run mulitple simulations to obtain the fraction of simulations where the simulated bursts fall within both the LOFAR observations as well as the observed phase range of LOFAR bursts (). The bottom panel of Figure 10 shows this fraction, which we treat as the probability that all simulated bursts fall within the observed LOFAR activity phase range.
The simulations show that the observed activity window of the LOFAR bursts is delayed with respect to the activity window observed by CHIME/FRB. The best fit parameters for and are determined through a Markov-Chain Monte Carlo analysis using the emcee software (Foreman-Mackey et al., 2013) to sample and maximize the probability that all simulated bursts coincident with the LOFAR observations fall within the observed LOFAR activity range. Flat priors were used for both parameters, though the width was limited to the observed minimum range of days. The posterior distributions were obtained using 32 walkers for 20000 steps, well beyond 100 times the largest autocorrelation of the fitted parameters. After discarding a burn-in phase of 1000 steps, and thinning by 35 steps, we obtained and d. These values correspond to a LOFAR burst rate of hour-1 for a fluence limit of 26 Jy ms.
4 Discussion
4.1 Lowest-frequency emission
FRB 20180916B already held the record for the FRB with the lowest-frequency emission detected to date. Using the GBT and SRT, respectively, Chawla et al. (2020) and Pilia et al. (2020) previously presented a total of 10 burst detections at frequencies as low as 300 MHz. Here we present 18 bursts detected in the 110–188-MHz band.
Notably, the majority of these bursts are brighter in the top-half of the band, but burst CV4 clearly demonstrates that emission can be detected down to at least 110 MHz (Figure 2). Searches for FRB 20180916B emission at radio frequencies MHz are thus well motivated, and are underway using joint observations with LOFAR and NenuFAR (New Extension in Nançay Upgrading LOFAR; Bondonneau et al., 2020). These observations can better quantify whether the observed burst rate is systematically reduced at lower radio frequencies. While only three of the 18 bursts we have observed here are emitting predominantly in the lowest part of the LOFAR HBA band ( MHz), one must take observational biases like increased sky temperature () and larger pulse width into account (our detection metric scales as , where and are burst fluence and width, respectively). The current sample is too small to make robust statements about the burst rate declining towards the bottom of the LOFAR HBA band.
Similarly, the detection of FRB 20180916B at MHz provides renewed hope for detections in wide-field, low-frequency surveys (e.g., Sanidas et al., 2019).
The simple fact that FRB 20180916B is visible at 110 MHz sets new requirements on the emission mechanism and constraints on the effect of free-free absorption in the local medium. Based on the lack of free-free absorption at 300 MHz, Chawla et al. (2020) argued that FRB 20180916B is not associated with a hyper-compact Hii region or a young ( yr) supernova remnant. This is consistent with the lack of local H emission or a persistent radio counterpart, as shown by Tendulkar et al. (2020) and Marcote et al. (2020), respectively. Here we show that the circumburst environment is optically thin to free-free absorption at 110 MHz. Considering an ionized nebula of size L, and DM 70 pc cm-3 (Marcote et al., 2020), we use the following expression for the optical depth due to free-free absorption (Condon & Ransom, 2016):
| (2) | |||
where accounts for the volume-filling factor and the electron density fluctuation in the circum-burst medium. For , we find L 0.16 pc (T/ K)-1.35. The Crab nebula, for comparison, is about 1.7 pc in radius. Piro (2016) discusses how a surrounding supernova remnant can absorb bursts at low radio frequencies. In the context of that work (see their Figure 4), our detection of a burst down to 110 MHz implies a source age of at least yrs, for assumed ejecta masses between . Similarly, Marcote et al. (2020) discuss how the relatively low RM and lack of a persistent radio counterpart constrain the age of FRB 20180916B to be yrs, in the context of models that describe it as a young flaring magnetar in a dense nebula (Metzger et al., 2019).
Models that describe FRBs via synchrotron maser emission from decelerating relativistic blast waves predict that the intrinsic FRB fluence is lower at lower radio frequencies (Metzger et al., 2019). In contrast, at LOFAR frequencies of MHz we see higher fluences compared to bursts detected by CHIME/FRB at MHz (Table 1). Similarly, the detection of 110-MHz emission also places constraints on magnetospheric emission heights and models, e.g., the curvature radiation model (Kumar et al., 2017), where a particle density cm-3 is necessary to produce a typical FRB luminosity ( erg s-1) whereas the particle density can also not be much larger than this value for the emitting region to remain transparent to 100-MHz emission.
4.2 Spectro-temporal and polarimetric behaviour
The spectro-temporal properties of the 17 CHIME/FRB bursts presented here (Figure 8) are consistent with those of the 38 CHIME/FRB bursts previously presented in the literature. As such, we do not discuss their properties in detail.
The five new uGMRT bursts (detected at MHz) complement the 15 previously detected at MHz (Marthi et al., 2020). Of the new uGMRT bursts, G5 (Figures 6 and 7) has the most intriguing spectro-temporal properties, showing sub-structures that do not completely match the typical ‘sad trombone’ downward-drift features seen from repeaters (e.g., Hessels et al., 2019). A similar morphology has been observed in some bursts from FRB 20121102A (Caleb et al., 2020; Hilmarsson et al., 2020) and FRB 20180916B (Chawla et al., 2020). However, it is unclear whether these represent drifting sub-bursts within a single burst envelope, or a closely spaced set of separate bursts peaking at different frequencies, and then each individually drifting downwards in frequency. The short-timescale sub-structure of burst G5 also allows us to better investigate possible DM variations (as we discuss in the next sub-section).
The 18 LOFAR bursts constitute our first robust view of FRB emission below 300 MHz. These bursts have large widths (40 to 160 ms; Table 1) compared to other FRBs in general (e.g., Figure 13 in Petroff et al., 2019), and compared to FRB 20180916B at high frequency (Nimmo et al., 2020). This broadening is not due to dispersion smearing (see §2.1 and the coherently dedispersed waterfalls in Figure 3). For comparison, the typical burst width at 1.7 GHz is ms, and burst sub-structure has been detected on a wide range of timescales, down to s (Nimmo et al., 2020). It is not completely clear whether the larger burst widths at lower frequencies are simply due to scatter broadening (extrinsic multi-path propagation through the intervening material), or whether they reflect an intrinsic aspect of the emission process — like the ‘sad trombone’ effect seen from FRB 20180916B and other repeaters, where the sub-burst drift to later times increases towards lower frequencies (Hessels et al., 2019).
Previously, Marcote et al. (2020) estimated a scattering time of 2.7 s at 1.7 GHz, and Chawla et al. (2020) constrained the scattering time to be ms at 350 MHz (this is compatible with the higher-frequency measurement). For a scattering time that scales with frequency as , the effect is larger at 150 MHz compared to 350 MHz and larger at 110 MHz. Based on the measured scattering time of Marcote et al. (2020), we expect a scattering time of ms at 150 MHz, for a scaling. This matches well with the modeled scattering times of the high-S/N complex voltage data bursts CV1 and CV4 (Table 2). Regardless of modeling, bursts I14 and CV4 are the brightest detected bursts in the top- and bottom-half of the LOFAR HBA band, respectively, and both show clear asymmetric tails (as do other high-S/N bursts). Their measured widths of ms at 161 MHz (I14) and ms at 116 MHz (CV4) are also consistent with what one would predict by extrapolating from the scattering measurement of Marcote et al. (2020). However, the LOFAR bursts may be additionally broadened by a poorly resolved ‘sad trombone’ effect as well. The drift towards later times increases towards lower frequencies (Hessels et al., 2019; Josephy et al., 2019) and, based on FRB 20180916B observations in the CHIME/FRB band (PR3), could be ms per MHz at LOFAR frequencies. We also note that many bursts from FRB 20121102A show asymmetric burst profiles regardless of scattering (Hessels et al., 2019). Scatter-broadening can blend multiple intrinsic burst components (see also §4.3 of Day et al., 2020). Additional LOFAR observations spanning a wide range of epochs can constrain whether the scattering time varies, as is seen from the Crab pulsar (Driessen et al., 2019). Our burst detections spanning months show no obvious evidence for this, however.
The detection of FRB 20180916B, with DM pc cm-3, in the LOFAR HBA band contrasts with results from the LOFAR HBA ( MHz) census of slow and millisecond pulsars (Bilous et al., 2016; Kondratiev et al., 2016), as well as the new and known pulsars detected in the LOFAR Tied-Array All-Sky survey (LOTAAS; Sanidas et al. 2019). None of these observations detect Galactic pulsars with pc cm-3. The absence of LOFAR pulsar detections above this limit is consistent (Sanidas et al., 2019) with predictions from the Galactic scattering relations derived by Bhat et al. (2004) and Geyer et al. (2017). Indeed, extragalactic FRBs are often significantly less scattered than Galactic pulsars of comparable DM (see, e.g., Figure 16 of Cordes & Chatterjee, 2019, though note that FRB 20180916B has low Galactic latitude , towards Galactic longitude ).
In previous, simultaneous LOFAR HBA, GBT and CHIME/FRB observations, bursts were detected at MHz, but not at MHz (Chawla et al., 2020). Of the CHIME/FRB, uGMRT and LOFAR observations presented here, the arrival times of five CHIME/FRB bursts from CHIME/FRB Collaboration et al. (2020a) overlap with LOFAR observations, of which three have been presented in Chawla et al. (2020). None of these bursts have counterparts in the MHz band of LOFAR. Similarly, Pearlman et al. (2020) used simultaneous CHIME/FRB and Deep Space Network (DSN) 70-m dish observations to demonstrate a burst detection in the CHIME/FRB band, but none at 2.3 GHz or 8.4 GHz. Clearly, FRB 20180916B bursts have a low instantaneous bandwidth, as has been seen for FRB 20121102A (Gourdji et al., 2019; Majid et al., 2020) and beautifully demonstrated for FRB 20190711A (Kumar et al., 2021). The LOFAR HBA bursts we present here show bandwidths of MHz, and are consistent with an emerging picture in which repeating FRB bursts have typical fractional bandwidths () of % (e.g., CHIME/FRB Collaboration et al., 2019a; Gourdji et al., 2019). The large sample of FRB 20180916B bursts that are now available from MHz could also be stacked to determine an average spectral index — though that requires careful consideration of CHIME/FRB beam effects and other instrumental biases/selection effects, and is beyond the scope of this work.
Lastly, for three LOFAR HBA bursts with full polarimetric data available, we have measured the linear and circular polarization fractions (Figure 4). We find broad similarity to the polarimetric properties measured for FRB 20180916B bursts at 350 MHz (Chawla et al., 2020) and 1.7 GHz (Nimmo et al., 2020): i.e., the high linear polarization fraction, with flat polarization angle during the burst, and negligible circular polarization fraction, persists from MHz — almost four octaves in radio frequency. For the low-frequency Burst CV4, the lower linear polarization fraction is likely due to scattering, though investigations are ongoing to determine whether this could be the result of Faraday conversion (Gruzinov & Levin, 2019; Vedantham & Ravi, 2019). The remarkably similar polarimetric burst profiles across a wide range of radio frequencies is dissimilar to what is seen in some pulsars (Noutsos et al., 2015), and provides a novel constraint on FRB emission theory.
4.3 DM and RM variations
Despite the low frequencies of our LOFAR HBA burst detections, the large burst widths and likely presence of scattering make it difficult to precisely and accurately determine the burst DMs in order to investigate potential DM variability. For this reason, we have dedispersed all bursts in Figure 2 to a best-fit literature value of DM pc cm-3 (Nimmo et al., 2020). Previously, PR3 searched for DM variability, also as a function of FRB 20180916B’s activity phase. Using structure-optimized DMs (Hessels et al., 2019) from four bursts detected using the CHIME/FRB baseband capture system, they found no DM variations with magnitude pc cm-3.
Using three high-S/N bursts detected at MHz with uGMRT, and searching for a DM that maximizes burst sub-structure (Hessels et al., 2019), Marthi et al. (2020) also found no evidence for large DM variations. Their strongest constraint, DM pc cm-3 (for their burst 11), is also consistent with the DM pc cm-3 (Nimmo et al., 2020) value we use throughout this paper. Optimizing the sub-structure of burst G5 (Figure 7), we find pc cm-3. However, as we noted in the previous sub-section, there is some ambiguity in the interpretation of the burst structure of G5. Nevertheless, any DM variations are constrained to be pc cm-3.
The LOFAR HBA burst detections do provide precise RM values. Comparing with previous GBT and CHIME/FRB measurements (CHIME/FRB Collaboration et al., 2019a; Chawla et al., 2020), and correcting for the variable RM contribution from the Earth’s ionosphere, we find that FRB 20180916B shows significant variations at the level of rad m-2 (% fractional; though the variable component of the RM may be much lower than the total line-of-sight RM, in which case the fractional variations could be much larger). With only seven measurements in hand, it is not yet clear whether the observed RM is correlated with the activity phase of the source, or varies stochastically (Figure 5). Alternatively, the RM (and DM) could also depend on radio frequency, e.g., if there is a frequency dependence to the location of the emission region. Some pulsars are known to show variable apparent RM across their pulse profiles that indicates emission from multiple locations within the magnetosphere (e.g., Dai et al., 2015; Ilie et al., 2019). Similar effects might be seen in FRBs if their emission is magnetospheric in origin as well.
4.4 Observed activity
A revised analysis of the 38 previously published and 17 newly presented CHIME/FRB bursts — spanning two years, and thus 45 activity cycles, from 2018 September 16 until 2020 September 19 — provides a refined source activity period of days using the same methodology as in PR3. This is consistent with the previously published determination of days. The refined activity window is 5.2 days, as compared to the 5.4-day window that was measured using only 38 events.
Folding all bursts modulo , we see that the 18 LOFAR HBA bursts are systematically delayed in activity phase, by three days (0.2 cycles), compared to the 55 CHIME/FRB bursts (Figure 9). As we show in Figure 10, this effect is not simply a reflection of the observational exposure. LOFAR HBA bursts have been detected in four activity cycles, namely Cycles 20, 21, 35 and 37. Though the number of observations and bursts per cycle is low, these are consistent with the delayed activity being a time-invariant effect. Cycle 37 provides the best single-cycle observational coverage and burst sample between CHIME/FRB and LOFAR (Figure 1), and is also consistent with the overall picture one obtains by summing over all activity cycles. An ongoing campaign of NenuFAR, LOFAR HBA and Effelsberg observations will better characterize this frequency-dependent activity, and determine whether the low-frequency activity window has a larger duty cycle, or not. A larger burst sample can also, in principle, determine the functional form of the activity delay with frequency, e.g., whether the delay as a function of frequency is linear or quadratic.
Higher-frequency detections of FRB 20180916B at L-band seem to preferentially arrive at the start of the CHIME/FRB-derived activity window (PR3, Aggarwal et al. 2020). In follow-up observations of repeaters with periodic activity it thus seems wise to cover a broad window and not only the peak of activity derived at a different frequency.
4.5 A self-consistent model for FRB 20180916B
We now consider what models can naturally accommodate the wealth of observational facts available for FRB 20180916B.
Recently, Tendulkar et al. (2020) used Hubble Space Telescope and Gran Telescopio Canarias observations to demonstrate that FRB 20180916B is significantly offset with respect to nearby star-forming regions in its host galaxy. Assuming it is a neutron star formed in one of these regions, as opposed to in situ, it is more likely to be an old (100 kyr to 10 Myr) source. Coupled with the observed 16.3-day activity period, this led Tendulkar et al. (2020) to suggest that the system could be a high-mass X-ray binary (HMXB), where the bursts are possibly generated through an interaction between the companion wind and neutron star magnetosphere (sometimes called a “cosmic comb” model999In this putative process, the ram pressure of the companion wind would in places exceed the magnetic pressure of the magnetospheric field lines and create a sheath of plasma wherein magnetic reconnections are triggered that accelerate particles to relativistic speeds. These particles could produce the coherent radio emission., e.g., Zhang, 2017; Ioka & Zhang, 2020). Furthermore, the detection of a wide range (factor ) of emission timescales and microsecond structure in some FRB 20180916B bursts (Nimmo et al., 2020) is more naturally explained in terms of magnetospheric emission models, as opposed to those that invoke emission in a relativistic shock far from the neutron star.
HMXBs are relatively common: there are roughly 200 known in the Milky Way (Coleiro & Chaty, 2013; Walter et al., 2015). Furthermore, studies find that binary interaction dominates the evolution of massive stars (Sana et al., 2012), and hence highly magnetized neutron stars in such binaries should not be particularly rare. In fact, HMXBs are arguably too abundant to explain repeating FRBs, unless one invokes particular evolutionary stages, sporadic emission episodes, and/or viewing geometry to explain the lack of radio burst detections from Galactic HMXBs, as we discuss further below.
The detection of low-frequency bursts with no simultaneous high-frequency emission (Pearlman et al., 2020), strongly challenges models in which the 16.3-day observed periodicity is the result of absorption by the companion wind (Lyutikov et al., 2020). Rather, our LOFAR HBA detections and the lack of any observed DM variations, with DM pc cm-3 throughout the active window (PR3), suggest that we have a relatively clean line-of-sight to the burst source itself. Nonetheless, the observed RM variations of FRB 20180916B are atypical and not seen from isolated Galactic pulsars; they suggest that it is in a special local environment.
It is interesting to compare FRB 20180916B with known radio pulsar/OB-star binary systems. One example is the Small Magellanic Cloud (SMC) radio pulsar/B1V-companion binary system PSR J00457319. In this 51-day highly eccentric binary, at periastron and apastron, the pulsar approaches to within four and 34 B-star radii from the companion, respectively, probing very different regions of the stellar wind. Yet Kaspi et al. (1996) found an upper limit on DM variations pc cm-3, yielding a strong constraint on the stellar wind, M⊙ yr-1. Given the low metallicity of the SMC101010We note that the FRB 20180916B host galaxy has a similar oxygen abundance as that of H II regions in the SMC (Toribio San Cipriano et al., 2017; Tendulkar et al., 2020), a B-star with so weak a wind is not unexpected.
In a similar way, the lack of large observed DM variations (i.e., pc cm-3) from FRB 20180916B may not be problematic for a massive star binary model. Based on population synthesis arguments, Zhang & Gao (2020) argue that B-type stars would be the most likely companions to FRB binary sources. If the putative FRB 20180916B orbit is not very eccentric, the variation in pulsar/companion distance with orbital phase may not be large. This, together with a relatively weak companion wind, may make DM variations hard to observe. On the other hand, the Galactic eccentric radio pulsar/OB-star binary PSR J17403052 does show DM variations of order 2 pc cm-3 near periastron in its 231-day orbit; these imply a mass-loss rate on the order of M⊙ yr-1, still low for a Galactic O or early B star (Madsen et al., 2012). For similar strength wind, given the 16.3-day orbital period and hence closer pulsar/companion distance, the CHIME/FRB-active window would have to occur near apastron, or the orbit would have to be fairly circular to avoid detectable DM changes. Similarly, the Galactic highly eccentric 1237-day radio pulsar/Be-star binary PSR B125963 shows large DM, RM and scattering-time variations in the 50 days near periastron ( pc cm-3, rad m-2, and increased scattering such that 1.5-GHz pulse profiles become unobservable for this 48-ms pulsar), though these are likely due to the presence of a circumstellar disk through which the pulsar passes (Johnston et al., 1992, 1996, 2005). An emission-line star in the FRB 20180916B system seems implausible, because of the shorter orbital period, hence more compact orbit size and pulsar/star separation, together with the constraints on DM variations, absence of sizable RM variations, and given our new low-frequency detections which rule out large scattering times and which are offset in phase.
In the context of interacting binary models (Lyutikov et al., 2020; Ioka & Zhang, 2020; Popov, 2020; Du et al., 2021), the FRBs may be produced by a highly magnetized neutron star whose magnetosphere is ‘combed’ by the ionized wind of a massive companion star. Such interaction could lead to magnetic reconnection events, which have been proposed as a source of FRBs (Lyutikov & Popov, 2020). The bursts may only be visible within a funnel where the neutron star’s wind shields against the companion’s wind, which is otherwise opaque to induced Compton or Raman scattering for FRB emission (Ioka & Zhang, 2020, see their Figure 1). Windows of observable burst activity, lasting for days in the case of FRB 20180916B, then correspond to when this funnel, and the induced magnetic tail of the neutron star, are pointed towards Earth. This special viewing geometry could also, in principle, explain why Galactic HMXBs are not known to be prolific sources of bright radio bursts.
The funnel and magnetic tail can also be swept back by orbital motion. Wang et al. (2019) and Lyutikov (2020) discuss a radius-to-frequency mapping model to explain the ‘sad trombone’ effect seen from repeating FRBs on timescales of milliseconds (Hessels et al., 2019). If the radio emission frequency of bursts indeed scales with distance from the central source, where the magnetic field strength and plasma density are lower at larger distances, then this could plausibly also explain why the LOFAR HBA bursts we have observed are delayed in activity phase with respect to those seen at higher frequencies by CHIME/FRB. In such a toy model, the LOFAR bursts would originate at larger distances from the neutron star, in a swept-back magnetic tail.
While a model in which FRB 20180916B is a highly magnetized neutron star in an interacting HMXB system can plausibly explain all the observed phenomena to date, several authors have argued that the 16.3-day activity period of FRB 20180916B is the rotational period (Beniamini et al., 2020), or precession period (Levin et al., 2020; Sob’yanin, 2020; Yang & Zou, 2020; Zanazzi & Lai, 2020), of an isolated magnetar. Tendulkar et al. (2020) have argued against a young source, and the consistent polarization position angle between bursts (Nimmo et al., 2020) sets significant constraints on precession models. Nonetheless, in the context of these non-binary models, the frequency dependence of the observed activity could also be interpreted as a radius-to-frequency mapping effect in an emission cone that is slowly sweeping past the line of sight and is perhaps swept backwards at higher altitudes.
Lastly, we note that FRB 20180916B and FRB 20121102A, the two best-studied repeaters, share remarkably similar phenomenology (see §1) — despite the fact that FRB 20121102A is hosted in a much less massive dwarf galaxy and is coincident with a compact, persistent radio source. They are almost certainly of a similar physical origin, though FRB 20121102A may be in the vicinity of an accreting massive black hole (Michilli et al., 2018). Such a Galactic-center-like environment, may explain why — unlike FRB 20180916B — FRB 20121102A has only been detected once at radio frequencies GHz (Josephy et al., 2019). Their different Galactic latitudes ( for FRB 20180916B and for FRB 20121102A), might also play some role. Perhaps, in the context of an HMXB model, if the radio emission frequency is tied to the instantaneous altitude of the emission site, it is possible that the characteristic emission height is tied to the companion wind strength.
5 Conclusions
Using LOFAR observations in the -MHz band, we have detected 18 bursts from FRB 20180916B. Since some of the detected bursts are bright down to the lowest-observed frequency of 110 MHz, it is likely that FRB 20180916B emission extends to even lower frequencies — though scattering ( ms at 150 MHz) and sky background temperature will limit their detectability unless the fluences also increase and compensate for these effects. We are now actively searching for MHz emission using coordinated LOFAR and NenuFAR observations. The discovery of FRB emission in the -MHz band also gives new impetus to searches for additional sources in this band.
LOFAR polarimetric data demonstrate consistency with the properties previously presented at higher radio frequencies of MHz. The LOFAR bursts, combined with previous measurements, also show rad m-2 RM variations. One highly structured burst from the five new detections we presented from uGMRT ( MHz) leaves room for small but significant DM variations (1 pc cm-3) depending on the interpretation of its burst morphology.
Lastly, we also presented 17 new CHIME/FRB bursts detected at MHz. For five CHIME/FRB bursts with overlapping LOFAR observations, we detect no emission in the LOFAR -MHz band. This again emphasises the narrow-band nature of repeating FRB bursts, as previously discussed for a number of sources in the literature.
Using the full available sample of 55 CHIME/FRB bursts, spanning two years, we confirm that FRB 20180916B is periodically active, with a refined period of days over the 45 cycles observed to date. Comparing with the 55 CHIME/FRB bursts, we show that the LOFAR bursts arrive systematically later in the 16.33-day activity cycle of the source. We find a three day (0.2 cycle) shift across the two octaves in radio frequency from 600 MHz to 150 MHz.
We interpret these results in the context of the rich set of observational facts that are known about the FRB 20180916B burst properties and the local environment in its massive host galaxy. We discuss how a model in which FRB 20180916B is an interacting neutron-star HMXB system can account for all the observational results to date.
References
- Agarwal et al. (2020) Agarwal, D., Aggarwal, K., Burke-Spolaor, S., Lorimer, D. R., & Garver-Daniels, N. 2020, MNRAS, 497, 1661, doi: 10.1093/mnras/staa1856
- Aggarwal et al. (2020) Aggarwal, K., Law, C. J., Burke-Spolaor, S., et al. 2020, Research Notes of the American Astronomical Society, 4, 94, doi: 10.3847/2515-5172/ab9f33
- Astropy Collaboration et al. (2013) Astropy Collaboration, Robitaille, T. P., Tollerud, E. J., et al. 2013, A&A, 558, A33, doi: 10.1051/0004-6361/201322068
- Astropy Collaboration et al. (2018) Astropy Collaboration, Price-Whelan, A. M., Sipőcz, B. M., et al. 2018, AJ, 156, 123, doi: 10.3847/1538-3881/aabc4f
- Barsdell et al. (2012) Barsdell, B. R., Bailes, M., Barnes, D. G., & Fluke, C. J. 2012, MNRAS, 422, 379, doi: 10.1111/j.1365-2966.2012.20622.x
- Bassa et al. (2017a) Bassa, C. G., Pleunis, Z., & Hessels, J. W. T. 2017a, Astronomy and Computing, 18, 40, doi: 10.1016/j.ascom.2017.01.004
- Bassa et al. (2017b) Bassa, C. G., Pleunis, Z., Hessels, J. W. T., et al. 2017b, ApJ, 846, L20, doi: 10.3847/2041-8213/aa8400
- Beniamini et al. (2020) Beniamini, P., Wadiasingh, Z., & Metzger, B. D. 2020, MNRAS, 496, 3390, doi: 10.1093/mnras/staa1783
- Bhat et al. (2004) Bhat, N. D. R., Cordes, J. M., Camilo, F., Nice, D. J., & Lorimer, D. R. 2004, ApJ, 605, 759, doi: 10.1086/382680
- Bilous et al. (2016) Bilous, A. V., Kondratiev, V. I., Kramer, M., et al. 2016, A&A, 591, A134, doi: 10.1051/0004-6361/201527702
- Bochenek et al. (2020) Bochenek, C. D., Ravi, V., Belov, K. V., et al. 2020, Nature, 587, 59, doi: 10.1038/s41586-020-2872-x
- Bondonneau et al. (2020) Bondonneau, L., Grießmeier, J. M., Theureau, G., et al. 2020, arXiv e-prints, arXiv:2009.02076. https://arxiv.org/abs/2009.02076
- Brentjens & de Bruyn (2005) Brentjens, M. A., & de Bruyn, A. G. 2005, A&A, 441, 1217, doi: 10.1051/0004-6361:20052990
- Broekema et al. (2018) Broekema, P. C., Mol, J. J. D., Nijboer, R., et al. 2018, Astronomy and Computing, 23, 180, doi: 10.1016/j.ascom.2018.04.006
- Burn (1966) Burn, B. J. 1966, MNRAS, 133, 67, doi: 10.1093/mnras/133.1.67
- Caleb et al. (2020) Caleb, M., Stappers, B. W., Abbott, T. D., et al. 2020, MNRAS, 496, 4565, doi: 10.1093/mnras/staa1791
- Chawla et al. (2020) Chawla, P., Andersen, B. C., Bhardwaj, M., et al. 2020, ApJ, 896, L41, doi: 10.3847/2041-8213/ab96bf
- CHIME/FRB Collaboration (2018) CHIME/FRB Collaboration. 2018, ApJ, 863, 48, doi: 10.3847/1538-4357/aad188
- CHIME/FRB Collaboration et al. (2019a) CHIME/FRB Collaboration, Andersen, B. C., Bandura, K., et al. 2019a, ApJ, 885, L24, doi: 10.3847/2041-8213/ab4a80
- CHIME/FRB Collaboration et al. (2019b) CHIME/FRB Collaboration, Amiri, M., Bandura, K., et al. 2019b, Nature, 566, 235, doi: 10.1038/s41586-018-0864-x
- CHIME/FRB Collaboration et al. (2020a) CHIME/FRB Collaboration, Amiri, M., Andersen, B. C., et al. 2020a, Nature, 582, 351, doi: 10.1038/s41586-020-2398-2
- CHIME/FRB Collaboration et al. (2020b) CHIME/FRB Collaboration, Andersen, B. C., Bandura, K. M., Bhardwaj, M., et al. 2020b, Nature, 587, 54, doi: 10.1038/s41586-020-2863-y
- Cho et al. (2020) Cho, H., Macquart, J.-P., Shannon, R. M., et al. 2020, ApJ, 891, L38, doi: 10.3847/2041-8213/ab7824
- Coenen et al. (2014) Coenen, T., van Leeuwen, J., Hessels, J. W. T., et al. 2014, A&A, 570, A60, doi: 10.1051/0004-6361/201424495
- Coleiro & Chaty (2013) Coleiro, A., & Chaty, S. 2013, ApJ, 764, 185, doi: 10.1088/0004-637X/764/2/185
- Colgate & Noerdlinger (1971) Colgate, S. A., & Noerdlinger, P. D. 1971, ApJ, 165, 509, doi: 10.1086/150918
- Condon & Ransom (2016) Condon, J. J., & Ransom, S. M. 2016, Essential Radio Astronomy (Princeton University Press)
- Cordes & Chatterjee (2019) Cordes, J. M., & Chatterjee, S. 2019, ARA&A, 57, 417, doi: 10.1146/annurev-astro-091918-104501
- Cruces et al. (2021) Cruces, M., Spitler, L. G., Scholz, P., et al. 2021, MNRAS, 500, 448, doi: 10.1093/mnras/staa3223
- Dai et al. (2015) Dai, S., Hobbs, G., Manchester, R. N., et al. 2015, MNRAS, 449, 3223, doi: 10.1093/mnras/stv508
- Day et al. (2020) Day, C. K., Deller, A. T., Shannon, R. M., et al. 2020, MNRAS, 497, 3335, doi: 10.1093/mnras/staa2138
- Driessen et al. (2019) Driessen, L. N., Janssen, G. H., Bassa, C. G., Stappers, B. W., & Stinebring, D. R. 2019, MNRAS, 483, 1224, doi: 10.1093/mnras/sty3192
- Du et al. (2021) Du, S., Wang, W., Wu, X., & Xu, R. 2021, MNRAS, 500, 4678, doi: 10.1093/mnras/staa3527
- Farah et al. (2018) Farah, W., Flynn, C., Bailes, M., et al. 2018, MNRAS, 478, 1209, doi: 10.1093/mnras/sty1122
- Fedorova & Rodin (2019a) Fedorova, V. A., & Rodin, A. E. 2019a, Astronomy Reports, 63, 39, doi: 10.1134/S1063772919010037
- Fedorova & Rodin (2019b) —. 2019b, Astronomy Reports, 63, 877, doi: 10.1134/S1063772919110039
- Fonseca et al. (2020) Fonseca, E., Andersen, B. C., Bhardwaj, M., et al. 2020, ApJ, 891, L6, doi: 10.3847/2041-8213/ab7208
- Foreman-Mackey et al. (2013) Foreman-Mackey, D., Hogg, D. W., Lang, D., & Goodman, J. 2013, PASP, 125, 306, doi: 10.1086/670067
- Gajjar et al. (2018) Gajjar, V., Siemion, A. P. V., Price, D. C., et al. 2018, ApJ, 863, 2, doi: 10.3847/1538-4357/aad005
- Geyer et al. (2017) Geyer, M., Karastergiou, A., Kondratiev, V. I., et al. 2017, MNRAS, 470, 2659, doi: 10.1093/mnras/stx1151
- Gourdji et al. (2019) Gourdji, K., Michilli, D., Spitler, L. G., et al. 2019, ApJ, 877, L19, doi: 10.3847/2041-8213/ab1f8a
- Gruzinov & Levin (2019) Gruzinov, A., & Levin, Y. 2019, ApJ, 876, 74, doi: 10.3847/1538-4357/ab0fa3
- Gupta et al. (2017) Gupta, Y., Ajithkumar, B., Kale, H. S., et al. 2017, Current Science, 113, 707
- Hardy et al. (2017) Hardy, L. K., Dhillon, V. S., Spitler, L. G., et al. 2017, MNRAS, 472, 2800, doi: 10.1093/mnras/stx2153
- Harris et al. (2020) Harris, C. R., Millman, K. J., van der Walt, S. J., et al. 2020, Nature, 585, 357, doi: 10.1038/s41586-020-2649-2
- Hassall et al. (2012) Hassall, T. E., Stappers, B. W., Hessels, J. W. T., et al. 2012, A&A, 543, A66, doi: 10.1051/0004-6361/201218970
- Heald (2009) Heald, G. 2009, in IAU Symposium, Vol. 259, Cosmic Magnetic Fields: From Planets, to Stars and Galaxies, ed. K. G. Strassmeier, A. G. Kosovichev, & J. E. Beckman, 591–602, doi: 10.1017/S1743921309031421
- Hessels et al. (2019) Hessels, J. W. T., Spitler, L. G., Seymour, A. D., et al. 2019, ApJ, 876, L23, doi: 10.3847/2041-8213/ab13ae
- Hewish et al. (1968) Hewish, A., Bell, S. J., Pilkington, J. D. H., Scott, P. F., & Collins, R. A. 1968, Nature, 217, 709, doi: 10.1038/217709a0
- Hilmarsson et al. (2020) Hilmarsson, G. H., Michilli, D., Spitler, L. G., et al. 2020, arXiv e-prints, arXiv:2009.12135. https://arxiv.org/abs/2009.12135
- Hotan et al. (2004) Hotan, A. W., van Straten, W., & Manchester, R. N. 2004, PASA, 21, 302, doi: 10.1071/AS04022
- Houben et al. (2019) Houben, L. J. M., Spitler, L. G., ter Veen, S., et al. 2019, A&A, 623, A42, doi: 10.1051/0004-6361/201833875
- Hunter (2007) Hunter, J. D. 2007, Computing in Science & Engineering, 9, 90, doi: 10.1109/MCSE.2007.55
- Ilie et al. (2019) Ilie, C. D., Johnston, S., & Weltevrede, P. 2019, MNRAS, 483, 2778, doi: 10.1093/mnras/sty3315
- Ioka & Zhang (2020) Ioka, K., & Zhang, B. 2020, ApJ, 893, L26, doi: 10.3847/2041-8213/ab83fb
- Johnston et al. (2005) Johnston, S., Ball, L., Wang, N., & Manchester, R. N. 2005, MNRAS, 358, 1069, doi: 10.1111/j.1365-2966.2005.08854.x
- Johnston et al. (1992) Johnston, S., Manchester, R. N., Lyne, A. G., et al. 1992, ApJ, 387, L37, doi: 10.1086/186300
- Johnston et al. (1996) —. 1996, MNRAS, 279, 1026, doi: 10.1093/mnras/279.3.1026
- Josephy et al. (2019) Josephy, A., Chawla, P., Fonseca, E., et al. 2019, ApJ, 882, L18, doi: 10.3847/2041-8213/ab2c00
- Karastergiou et al. (2015) Karastergiou, A., Chennamangalam, J., Armour, W., et al. 2015, MNRAS, 452, 1254, doi: 10.1093/mnras/stv1306
- Kaspi et al. (1996) Kaspi, V. M., Tauris, T. M., & Manchester, R. N. 1996, ApJ, 459, 717, doi: 10.1086/176936
- Kirsten et al. (2020) Kirsten, F., Snelders, M. P., Jenkins, M., et al. 2020, Nature Astronomy, doi: 10.1038/s41550-020-01246-3
- Kondratiev et al. (2016) Kondratiev, V. I., Verbiest, J. P. W., Hessels, J. W. T., et al. 2016, A&A, 585, A128, doi: 10.1051/0004-6361/201527178
- Kulkarni (2020) Kulkarni, S. R. 2020, arXiv e-prints, arXiv:2007.02886. https://arxiv.org/abs/2007.02886
- Kumar et al. (2017) Kumar, P., Lu, W., & Bhattacharya, M. 2017, MNRAS, 468, 2726, doi: 10.1093/mnras/stx665
- Kumar et al. (2021) Kumar, P., Shannon, R. M., Flynn, C., et al. 2021, MNRAS, 500, 2525, doi: 10.1093/mnras/staa3436
- Law et al. (2017) Law, C. J., Abruzzo, M. W., Bassa, C. G., et al. 2017, ApJ, 850, 76, doi: 10.3847/1538-4357/aa9700
- Levin et al. (2020) Levin, Y., Beloborodov, A. M., & Bransgrove, A. 2020, ApJ, 895, L30, doi: 10.3847/2041-8213/ab8c4c
- Lorimer et al. (2007) Lorimer, D. R., Bailes, M., McLaughlin, M. A., Narkevic, D. J., & Crawford, F. 2007, Science, 318, 777, doi: 10.1126/science.1147532
- Luo et al. (2020) Luo, R., Wang, B. J., Men, Y. P., et al. 2020, Nature, 586, 693, doi: 10.1038/s41586-020-2827-2
- Lyutikov (2020) Lyutikov, M. 2020, ApJ, 889, 135, doi: 10.3847/1538-4357/ab55de
- Lyutikov et al. (2020) Lyutikov, M., Barkov, M. V., & Giannios, D. 2020, ApJ, 893, L39, doi: 10.3847/2041-8213/ab87a4
- Lyutikov & Popov (2020) Lyutikov, M., & Popov, S. 2020, arXiv e-prints, arXiv:2005.05093. https://arxiv.org/abs/2005.05093
- Madsen et al. (2012) Madsen, E. C., Stairs, I. H., Kramer, M., et al. 2012, MNRAS, 425, 2378, doi: 10.1111/j.1365-2966.2012.21691.x
- Majid et al. (2020) Majid, W. A., Pearlman, A. B., Nimmo, K., et al. 2020, ApJ, 897, L4, doi: 10.3847/2041-8213/ab9a4a
- Manchester & Taylor (1972) Manchester, R. N., & Taylor, J. H. 1972, Astrophys. Lett., 10, 67
- Marcote et al. (2020) Marcote, B., Nimmo, K., Hessels, J. W. T., et al. 2020, Nature, 577, 190, doi: 10.1038/s41586-019-1866-z
- Marthi et al. (2020) Marthi, V. R., Gautam, T., Li, D. Z., et al. 2020, MNRAS, 499, L16, doi: 10.1093/mnrasl/slaa148
- Mereghetti et al. (2020) Mereghetti, S., Savchenko, V., Ferrigno, C., et al. 2020, ApJ, 898, L29, doi: 10.3847/2041-8213/aba2cf
- Metzger et al. (2019) Metzger, B. D., Margalit, B., & Sironi, L. 2019, MNRAS, 485, 4091, doi: 10.1093/mnras/stz700
- Michilli & Hessels (2018) Michilli, D., & Hessels, J. W. T. 2018, SpS: Single-pulse Searcher. http://ascl.net/1806.013
- Michilli et al. (2018) Michilli, D., Seymour, A., Hessels, J. W. T., et al. 2018, Nature, 553, 182, doi: 10.1038/nature25149
- Nimmo et al. (2020) Nimmo, K., Hessels, J. W. T., Keimpema, A., et al. 2020, arXiv e-prints, arXiv:2010.05800. https://arxiv.org/abs/2010.05800
- Noutsos et al. (2015) Noutsos, A., Sobey, C., Kondratiev, V. I., et al. 2015, A&A, 576, A62, doi: 10.1051/0004-6361/201425186
- Parent et al. (2020) Parent, E., Chawla, P., Kaspi, V. M., et al. 2020, ApJ, 904, 92, doi: 10.3847/1538-4357/abbdf6
- Pastor-Marazuela et al. (2020) Pastor-Marazuela, I., Connor, L., van Leeuwen, J., et al. 2020, submitted
- Pearlman et al. (2020) Pearlman, A. B., Majid, W. A., Prince, T. A., et al. 2020, ApJ, 905, L27, doi: 10.3847/2041-8213/abca31
- Petroff et al. (2019) Petroff, E., Hessels, J. W. T., & Lorimer, D. R. 2019, A&A Rev., 27, 4, doi: 10.1007/s00159-019-0116-6
- Petroff et al. (2015) Petroff, E., Johnston, S., Keane, E. F., et al. 2015, MNRAS, 454, 457, doi: 10.1093/mnras/stv1953
- Phinney & Taylor (1979) Phinney, S., & Taylor, J. H. 1979, Nature, 277, 117, doi: 10.1038/277117a0
- Pilia et al. (2020) Pilia, M., Burgay, M., Possenti, A., et al. 2020, ApJ, 896, L40, doi: 10.3847/2041-8213/ab96c0
- Piro (2016) Piro, A. L. 2016, ApJ, 824, L32, doi: 10.3847/2041-8205/824/2/L32
- Platts et al. (2019) Platts, E., Weltman, A., Walters, A., et al. 2019, Phys. Rep., 821, 1, doi: 10.1016/j.physrep.2019.06.003
- Popov (2020) Popov, S. B. 2020, Research Notes of the American Astronomical Society, 4, 98, doi: 10.3847/2515-5172/aba0af
- Purcell et al. (2020) Purcell, C. R., Van Eck, C. L., West, J., Sun, X. H., & Gaensler, B. M. 2020, RM-Tools: Rotation measure (RM) synthesis and Stokes QU-fitting. http://ascl.net/2005.003
- Rajwade et al. (2020) Rajwade, K. M., Mickaliger, M. B., Stappers, B. W., et al. 2020, MNRAS, 495, 3551, doi: 10.1093/mnras/staa1237
- Ransom (2001) Ransom, S. M. 2001, PhD thesis, Harvard University
- Ransom et al. (2002) Ransom, S. M., Eikenberry, S. S., & Middleditch, J. 2002, AJ, 124, 1788, doi: 10.1086/342285
- Reddy et al. (2017) Reddy, S. H., Kudale, S., Gokhale, U., et al. 2017, Journal of Astronomical Instrumentation, 6, 1641011, doi: 10.1142/S2251171716410117
- Rowlinson et al. (2016) Rowlinson, A., Bell, M. E., Murphy, T., et al. 2016, MNRAS, 458, 3506, doi: 10.1093/mnras/stw451
- Sana et al. (2012) Sana, H., de Mink, S. E., de Koter, A., et al. 2012, Science, 337, 444, doi: 10.1126/science.1223344
- Sanidas et al. (2019) Sanidas, S., Cooper, S., Bassa, C. G., et al. 2019, A&A, 626, A104, doi: 10.1051/0004-6361/201935609
- Scholz et al. (2017) Scholz, P., Bogdanov, S., Hessels, J. W. T., et al. 2017, ApJ, 846, 80, doi: 10.3847/1538-4357/aa8456
- Scholz et al. (2020) Scholz, P., Cook, A., Cruces, M., et al. 2020, ApJ, 901, 165, doi: 10.3847/1538-4357/abb1a8
- Seymour et al. (2019) Seymour, A., Michilli, D., & Pleunis, Z. 2019, DM_phase: Algorithm for correcting dispersion of radio signals. http://ascl.net/1910.004
- Shannon et al. (2018) Shannon, R. M., Macquart, J. P., Bannister, K. W., et al. 2018, Nature, 562, 386, doi: 10.1038/s41586-018-0588-y
- Sobey et al. (2019) Sobey, C., Bilous, A. V., Grießmeier, J. M., et al. 2019, MNRAS, 484, 3646, doi: 10.1093/mnras/stz214
- Sob’yanin (2020) Sob’yanin, D. N. 2020, MNRAS, 497, 1001, doi: 10.1093/mnras/staa1976
- Sokolowski et al. (2018) Sokolowski, M., Bhat, N. D. R., Macquart, J. P., et al. 2018, ApJ, 867, L12, doi: 10.3847/2041-8213/aae58d
- Sotomayor-Beltran et al. (2013) Sotomayor-Beltran, C., Sobey, C., Hessels, J. W. T., et al. 2013, A&A, 552, A58, doi: 10.1051/0004-6361/201220728
- Spitler et al. (2016) Spitler, L. G., Scholz, P., Hessels, J. W. T., et al. 2016, Nature, 531, 202, doi: 10.1038/nature17168
- Stappers et al. (2011) Stappers, B. W., Hessels, J. W. T., Alexov, A., et al. 2011, A&A, 530, A80, doi: 10.1051/0004-6361/201116681
- Susobhanan et al. (2020) Susobhanan, A., Maan, Y., Joshi, B. C., et al. 2020, arXiv e-prints, arXiv:2007.02930. https://arxiv.org/abs/2007.02930
- Tendulkar et al. (2020) Tendulkar, S. P., Gil de Paz, A., Kirichenko, A. Y., et al. 2020, arXiv e-prints, arXiv:2011.03257. https://arxiv.org/abs/2011.03257
- Thornton et al. (2013) Thornton, D., Stappers, B., Bailes, M., et al. 2013, Science, 341, 53, doi: 10.1126/science.1236789
- Tingay et al. (2015) Tingay, S. J., Trott, C. M., Wayth, R. B., et al. 2015, AJ, 150, 199, doi: 10.1088/0004-6256/150/6/199
- Toribio San Cipriano et al. (2017) Toribio San Cipriano, L., Domínguez-Guzmán, G., Esteban, C., et al. 2017, MNRAS, 467, 3759, doi: 10.1093/mnras/stx328
- van Haarlem et al. (2013) van Haarlem, M. P., Wise, M. W., Gunst, A. W., et al. 2013, A&A, 556, A2, doi: 10.1051/0004-6361/201220873
- van Straten & Bailes (2011) van Straten, W., & Bailes, M. 2011, PASA, 28, 1, doi: 10.1071/AS10021
- Vedantham & Ravi (2019) Vedantham, H. K., & Ravi, V. 2019, MNRAS, 485, L78, doi: 10.1093/mnrasl/slz038
- Virtanen et al. (2020) Virtanen, P., Gommers, R., Oliphant, T. E., et al. 2020, Nature Methods, 17, 261, doi: 10.1038/s41592-019-0686-2
- Walter et al. (2015) Walter, R., Lutovinov, A. A., Bozzo, E., & Tsygankov, S. S. 2015, A&A Rev., 23, 2, doi: 10.1007/s00159-015-0082-6
- Wang et al. (2019) Wang, W., Zhang, B., Chen, X., & Xu, R. 2019, ApJ, 876, L15, doi: 10.3847/2041-8213/ab1aab
- Xue et al. (2019) Xue, M., Ord, S. M., Tremblay, S. E., et al. 2019, PASA, 36, e025, doi: 10.1017/pasa.2019.19
- Yang & Zou (2020) Yang, H., & Zou, Y.-C. 2020, ApJ, 893, L31, doi: 10.3847/2041-8213/ab800f
- Zanazzi & Lai (2020) Zanazzi, J. J., & Lai, D. 2020, ApJ, 892, L15, doi: 10.3847/2041-8213/ab7cdd
- Zhang (2017) Zhang, B. 2017, ApJ, 836, L32, doi: 10.3847/2041-8213/aa5ded
- Zhang & Gao (2020) Zhang, X., & Gao, H. 2020, MNRAS, 498, L1, doi: 10.1093/mnrasl/slaa116
- Zhang et al. (2018) Zhang, Y. G., Gajjar, V., Foster, G., et al. 2018, ApJ, 866, 149, doi: 10.3847/1538-4357/aadf31