The Annual Review of Astronomy and Astrophysics is online at astro.annualreviews.org \jyear2020
Observations of the Lyman- Universe
Abstract
Hydrogen Lyman- (Ly) emission has been one of the major observational probes for the high redshift universe, since the first discoveries of high- Ly emitting galaxies in the late 1990s. Due to the strong Ly emission originated by resonant scattering and recombination of the most-abundant element, Ly observations witness not only Hii regions of star formation and AGN but also diffuse Hi gas in the circum-galactic medium (CGM) and the inter-galactic medium (IGM). Here we review Ly sources, and present theoretical interpretations reached to date. We conclude that: 1) A typical Ly emitter (LAE) at with a Ly luminosity is a high- counterpart of a local dwarf galaxy, a compact metal-poor star-forming galaxy (SFG) with an approximate stellar (halo) mass and star-formation rate of () and yr-1, respectively; 2) High- SFGs ubiquitously have a diffuse Ly emitting halo in the CGM extending to the halo virial radius and beyond; 3) Remaining neutral hydrogen at the epoch of reionization makes a strong dimming of Ly emission for galaxies at that suggest the late reionization history. The next generation large telescope projects will combine Ly emission data with Hi Ly absorptions and 21cm radio data that map out the majority of hydrogen (HiHii) gas, uncovering the exchanges of i) matter by outflow/inflow and ii) radiation, relevant to cosmic reionization, between galaxies and the CGM/IGM.
doi:
10.1146/annurev-astro-032620-021859keywords:
Ly emission, galaxy formation, cosmic reionization, cosmology1 Introduction
Hydrogen Ly emission is a critical probe for understanding the high-redshift universe. Due to the abundant hydrogen and the atomic electron transition between the lowest energy levels, from the state to the ground () state, Ly is one of the strongest emission lines produced in the universe. Although Ly has a physical nature of resonance line 111 Because a chance of electron’s staying at the ground state is very high, due to a short-time scale required for ground-state transitions, Ly photons are resonantly scattered by hydrogen. whose photons have more chances of dust attenuation in gaseous nebulae in the process of resonant scattering, the short wavelength (Å) of Ly emission allows us to pinpoint faint high- objects by optical and near-infrared (NIR) observations very efficiently. Ly is used as an excellent probe of high- objects near the observational redshift frontier.
Historically, Partridge & Peebles (1967) first predict an importance of a high- galaxy that emits a strong Ly line. Partridge & Peebles (1967) argue that an early galaxy produces strong Ly emission by the recombination process in the inter-stellar medium (ISM) heated by young massive stars, and that up to 6-7% of the total galaxy luminosity can be converted to a Ly luminosity that is as bright as erg s-1 at . Moreover, Partridge & Peebles (1967) claim a possibility of strong free-electron scattering in ionized gas of the inter-galactic medium (IGM) that smears radiation from young galaxies. Although recent studies do not agree with the extremely bright Ly luminosity and the notable smearing of the radiation in the ionized IGM, Partridge & Peebles (1967) is an excellent imaginative theory paper (published more than a half century ago) suggesting that strong Ly emission of high- galaxies is physically related to early galaxies and the ionization state of the IGM that are two major topics discussed today with strong Ly emission, namely galaxy formation and cosmic reionization.
After the theoretical predictions of Partridge & Peebles (1967), a number of programs searched for high- galaxies with strong Ly emission by observations. However, no such objects were found until the mid-1990s, due to the limited sensitivities of the available telescopes. Finally, by the operation starts of large (8-10m class) ground-based telescopes and Hubble Space Telescope (HST), a few high- galaxies with strong Ly emission were successfully identified by narrowband (NB) imaging 222 Ly is redshifted to the NB transmission, showing a NB photometry excess. and spectroscopy on the sky around QSO BR2237-0607 at (Hu & McMahon 1996) and a radio galaxy 53W002 at (Pascarelle et al. 1996) as well as in the blank field (Cowie & Hu 1998). Subsequently, a number of deep observation programs have been conducted for Ly emitting objects at , including the Hawaii Survey (Cowie & Hu 1998), the Large Area Lyman Alpha Survey (Rhoads et al. 2000), the Subaru surveys (Ouchi et al. 2003), and the Multiwavelength Survey by Yale-Chile (Gawiser et al. 2007), the Hobby-Eberly Telescope Dark Energy Experiment (HETDEX) Pilot Survey (Adams et al. 2011), and Very Large Telescope (VLT) /Multi Unit Spectroscopic Explorer (MUSE) survey (Bacon et al. 2017). Moreover, Ly emitting objects in the local and low- universe are investigated by space-based UV observations such by the HST program of Lyman-Alpha Reference Sample (Östlin et al. 2014) and the Galaxy Evolution Explorer (GALEX) grism programs (Deharveng et al. 2008; Cowie et al. 2011). Ly emitting galaxies with no AGN, thus found, have a Ly luminosity of erg s-1, more than an order of magnitude fainter than the one predicted by Partridge & Peebles (1967).
Ly emitting objects are called Ly emitters (LAEs). Conventionally, LAEs are defined as objects with a rest-frame Ly equivalent width (EW) of
| (1) |
This Ly limit corresponds to that of the samples made by classical observations for LAEs with a NB whose wavelength transmission width is a % of the central wavelength.333Note that some of the recent studies refer to objects with weak Ly of as LAEs. It is known that LAEs are young star-forming galaxies (SFGs) or AGNs (Section 3). Figure 1 444 We use abbreviations of cMpc, pMpc, and pkpc for comoving megaparsec, physical megaparsec, and physical kiloparsec, respectively. is an illustration of a conceptual LAE with spectroscopic properties that are detailed in Section 2.
[] \entrycMpccomoving megaparsec \entrypMpcphysical megaparsec \entrypkpcphysical kiloparsec
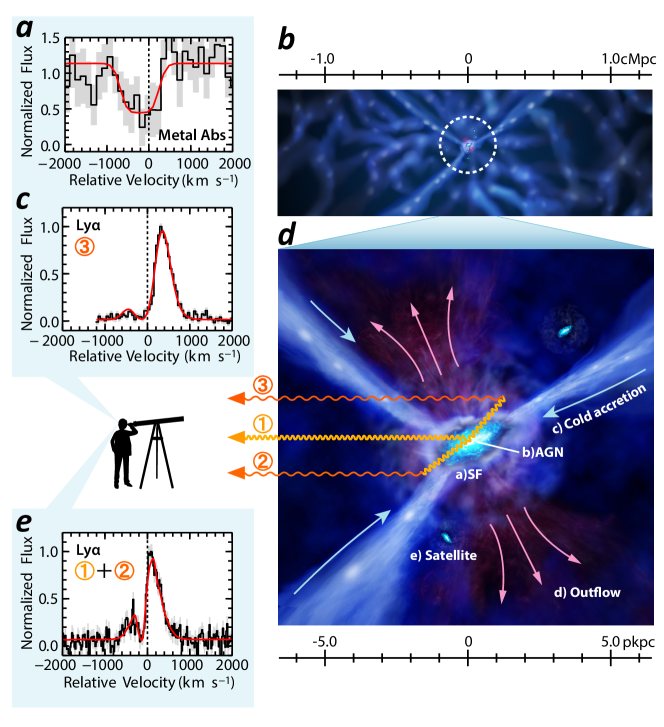
Because Ly photons are resonantly scattered by neutral hydrogen Hi, Ly is unfortunately thought to be a poor probe of galaxy dynamics or the ionizing photon budget. However, the distribution and dynamics of Hi gas are encoded to Ly emission via the resonant scattering. The resonantly scattered Ly photons allow us to investigate Hi gas in and around high- objects that is generally hard to be probed by observations. The circum-galactic medium (CGM) of high- SFGs are characterized by diffuse Ly emission extending over physical kpc (pkpc) even to the large scale reaching the IGM (Kakuma et al. 2019; Section 7). Interestingly, such diffuse Ly emission of high- galaxies cover the entire sky in any observational lines of sight (Wisotzki et al. 2018). Figure 1 illustrate Ly emission traveling in the CGM and the IGM. Theoretical models predict that some fractions of Ly photons are produced by cold accretion, outflow, and unresolved faint satellites (Section 2) especially in the CGM and the IGM. At the epoch of reionization (EoR), the ionized fraction and distribution of Hi in the IGM are imprinted in the observed Ly emission (Section 9). Ly is an important probe for gas of the CGM and the IGM for characterizing galaxies and cosmic reionization.
2 Physical Picture of LAEs
2.1 Origins of Ly emission
Ly emission from galaxies have five major origins. In the ISM near the central region of a galaxy, Ly emission can be originated from recombinations of hydrogen atoms that are ionized mainly by two sources: 1) young massive stars (star formation) and 2) an AGN if any. In the CGM and the outer region, Ly can be emitted from three origins: 3) outflow that can collisionally excite Hi atoms (shock heating),555In the case of collisional excitation, the Ly to H flux ratio can be higher than that of the case B recombination (Figure 7 of Dijkstra 2017). 4) infalling gas (cold accretion), which is predicted to release a significant amount of its gravitational energy in Ly through collisional excitation (gravitational cooling), and 5) fluorescence from hydrogen in the CGM and IGM photoionized by UV background radiation powered by energetic sources such as QSOs. In addition, star formation in unresolved faint satellite galaxies can also contribute. Note that no Ly sources dominated by gravitational cooling have been definitively identified so far (Sections 6 and 7).
Another important physical process for Ly emisssion is resonant scattering, since Hi gas in typical galaxies is optically thick to Ly. The cross section of Ly for a collection of moving atoms can be obtained by convolving the single atom cross section with their velocity distribution. Assuming a Maxwellian velocity distribution and introducing the dimensionless frequency variable , where is the line center frequency and is the Doppler width, the average cross section is666A detailed derivation of this equation is given in Section 6.4 of Dijkstra (2017).
| (2) |
where is the Ly wavelength, is the Voigt parameter, and is the Voigt function,
| (3) |
The transition between the core and wing happens at around . Based on these equations, Hi gas is optically thick to Ly at the line center (hereafter referred to as “optically thick”) when the Hi column density is higher than cm-2, which is much lower than those of typical galaxies. Although this resonance nature of Ly makes it difficult to pinpoint the original Ly source position, it enables investigations of the distribution and the kinematics of Hi gas via theoretical modeling.
2.2 Modeling Ly Emission
One of the key issues to modeling Ly emission from galaxies is its complicated radiative transfer due to the resonance nature of Ly 777 In other words, Ly photons scatter multiple times in the optically thick line core before diffusing into the wings, where they finally escape. . Analytical solutions have been obtained only in very limited cases. In the simple case of an optically thick dust-free static slab with a central plane source emitting Ly, the emergent Ly line profile is given by Harrington (1973) 888See also Equation 3.51 and the footnote on p.29 of Laursen (2010) as
| (4) |
where is the optical depth at the line center from the center to the boundary of the slab. The spectral shape is symmetric around and double peaked at . The peaks are more separated with higher , because Ly photons need to shift their velocities more into the wings to escape.
For more general cases, there are some theoretical models, such as the expanding shell (ES) model (Ahn 2004; Verhamme et al. 2006), that adopt the Monte Carlo radiative transfer technique, which successfully explain the diversity of observed Ly profiles with a relatively small number of physical parameters. The ES model assumes a simple geometry where a Ly source is located at the center of a spherically symmetric expanding shell of homogeneous and isothermal Hi gas, modeling a galaxy-scale supershell made by multiple supernovae in star-forming regions 999Such galaxy-scale expanding supershells are found in nearby starbursts (Marlowe et al. 1995). (Figure 1).
To explain the basic idea of the ES model, Figure 1 shows the predictions of observed Ly emission line profiles for three different light paths (). Ly photons along the light path (\scriptsize1⃝) directely come from the central Ly source penetrating the shell. Along the light path (), Ly photons escape from the shell approaching the observer via scattering, although some of them are absorbed by Hi in the shell, resulting in a red component escaping the red wing of Ly absorption in the blueshifted shell and a small blue component escaping the blue wing of the Ly absorption. Figure 1 shows the Ly spectrum that is dominated by these two components (). The velocity shift of the red component relative to the systemic redshift is small, because a small number of Ly photons escape from the far side of the shell blowing away by scattering that is referred to as backscattering. Ly photons tracking the light path () experience the backscattering at the shell. In this case, the Ly spectrum can have a peak at , where is the radial expansion velocity or the outflow velocity (see Figure 1). The shift of the peak is given by an effect similar to that of a reflection in a moving mirror; the Ly photons enter the shell experiencing a Doppler shift by and are then backscattered to the observer being further Doppler shifted by . This simple model has successfully reproduced observed Ly profiles of LAEs as well as of Lyman break galaxies (LBGs) at both low and high redshifts (Section 6).
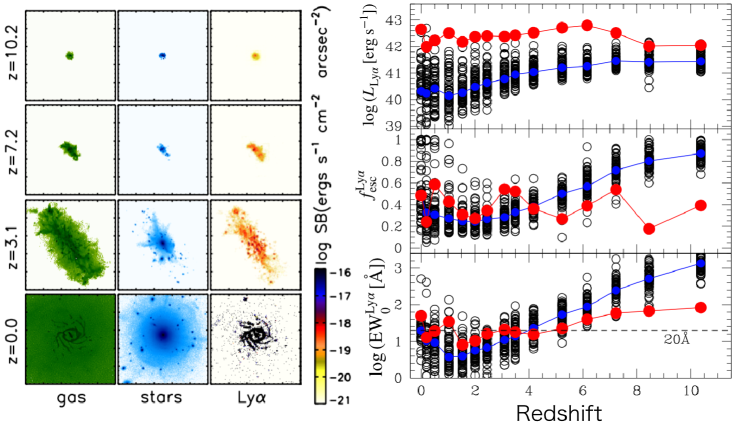
Combining with Monte Carlo radiative transfer calculations, some theoretical studies have conducted cosmological hydrodynamic simulations including dust attenuation effects to investigate possible descendants of high- LAEs as well as their physical properties. Yajima et al. (2012) have found that progenitors of a present-day Milky Way (MW) like galaxy with a halo mass show bright Ly emission at high redshifts comparable to Ly () of LAEs at . The left panel of Figure 2 shows the distributions of gas and stars of the most massive progenitor of a MW-like galaxy as well as the Ly surface brightness (SB) at different redshifts. The right panel of Figure 2 represents the evolution of Ly properties of the most massive progenitors. As shown in the bottom right panel of Figure 2, most of the galaxies at high redshifts are classified as LAEs, and some of them are bright enough to be detected in previous observations (top right panel). The escape fractions of Ly photons over whole solid angle are also presented in the middle right panel of Figure 2. The median value of the Ly escape fraction is about % at , which is consistent with those obtained in observational studies (Section 3). Note that at low redshifts of , the Ly escape fraction has a relatively large dispersion due to the diversities in their physical properties. These results suggest that some of the typical observed LAEs at would evolve into present-day MW-like galaxies, which is consistent with the results from the clustering analyses (Gawiser et al. 2007; Ouchi et al. 2010).
3 Ly Emitter Observations
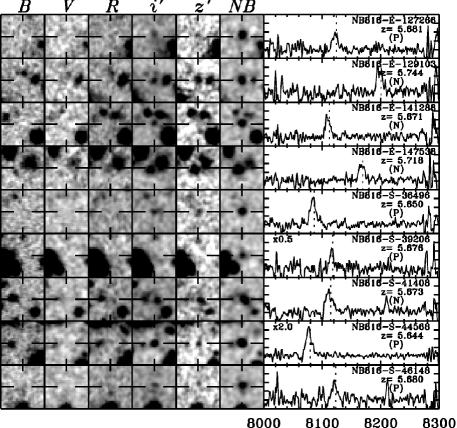
As introduced in Section 1, LAEs have been identified by many observational studies. The successful classical technique to find LAEs is NB imaging. In this technique, LAEs are selected based on their NB excesses compared to broadbands (Figure 3). Imaging surveys with wide-field cameras such as Subaru Suprime-Cam have constructed large samples of LAEs and their follow-up spectroscopic campaigns have confirmed the validity of the NB imaging technique with low fractions of contaminants. The recent advent of new wide-field cameras including Hyper Suprime-Cam (HSC) now allows LAE surveys over cosmological volumes ( comoving Gpc2; Ouchi et al. 2018).
Another successful technique is blind spectroscopy. In particular, the integral field spectrograph of VLT/MUSE has recently yielded complementary results to those of the NB imaging. Thanks to the wider wavelength coverage and higher spectral resolution, MUSE is suitable to search for LAEs over a wide redshift range down to a flux limit fainter than the NB observations (Drake et al. 2017), although the field-of-view of MUSE is small. Another remarkable effort is made by a wide-field fiber spectrograph survey, HETDEX (Hill et al. 2008), to cover a deg2 sky via a blind search for relatively bright LAEs.
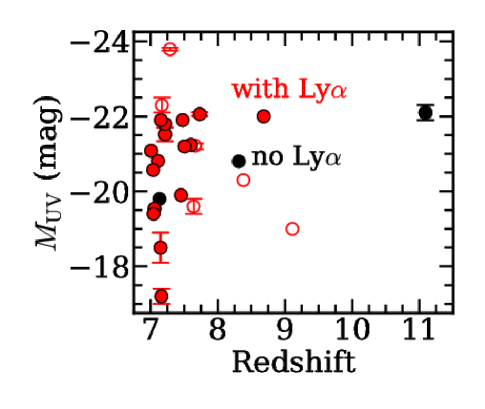
Because strong Ly emission from high- galaxies is redshifted in a wavelength range of optical and NIR where deep spectroscopic data can be obtained, Ly emission has been detected in many galaxies by spectroscopy at the high-redshift frontier. Table 1 presents the list of galaxies identified, to date, at a spectroscopic redshift . Some high- galaxies are found only with the Ly continuum break (Oesch et al. 2016) or [Oiii]m emission (Tamura et al. 2019). Previously it was thought that Ly photons cannot escape from galaxies especially at the early EoR due to the resonant scattering effect in the neutral IGM. However, as summarized in Figure 4, a majority of galaxies, found to date, show Ly in emission even at , beyond the heart of reionization, suggesting a patchy nature of reionization where relatively luminous ionizing sources such as the spectroscopically confirmed galaxies are located in large ionized bubbles in the IGM, which allow Ly photons to escape from the neutral IGM.
| ID | R.A. | Decl. | Ly | Probe | Other | Reference | ||
| (J2000) | (J2000) | (mag) | (Å) | Lines | ||||
| (1) | (2) | (3) | (4) | (5) | (6) | (7) | (8) | (9) |
| GN-z11 | 12:36:25.46 | 62:14:31.4 | 11.09 | — | Lyman break | — | O16 | |
| MACS1149-JD | 11:49:33.59 | 22:24:45.80 | 9.1096 | [Oiii]m | Ly | H18, Ho18 | ||
| EGSY-2008532660 | 14:20:08.50 | 52:53:26.60 | 8.683 | Ly | — | Z15 | ||
| A2744-YD4 | 00:14:24.9 | 30:22:56.1 | 8.382 | [Oiii]m | Ly | L17 | ||
| MACS0416-Y1 | 04:16:09.40 | 24:05:35.5 | 8.3118 | — | [Oiii]m | — | T19 | |
| EGS-zs8-1 | 14:20:34.89 | 53:00:15.4 | 7.7302 | Ly | Ciii]1908 | O15, S17 | ||
| z7-GSD-3811 | 03:32:32.03 | 27:45:37.1 | 7.6637 | Ly | — | S16 | ||
| MACS1423-z7p64 | 14:23:46.18 | 24:04:10.76 | 7.640 | Ly | — | H17 | ||
| z7-GND-16863 | 12:37:19.94 | 62:15:26.05 | 7.599 | Ly | — | J19 | ||
| z8-GND-5296 | 12:36:37.90 | 62:18:08.5 | 7.506 | Ly | Ciii]1908 | F13, J19, Hu19 | ||
| EGS-zs8-2 | 14:20:12.09 | 53:00:26.97 | 7.4770 | Ly | — | RB16, S17 | ||
| GS2-1406 | 03:33:09.14 | 27:51:55.47 | 7.452 | Ly | — | L18 | ||
| SDF-NB1006-2 | 13:24:35.418 | 27:27:27.81 | 7.288 | Ly | — | S12 | ||
| SXDF-NB1006-2 | 02:18:56.523 | 05:19:58.79 | 7.215 | Ly | [Oiii]m | S12, I16 | ||
| GN-108036 | 12:36:22.68 | 62:08:07 | 7.213 | Ly | — | O12 |
Note: (1) Object ID. (2) Right ascension. (3) Declination. (4) Spectroscopic redshift. (5) Intrinsic UV absolute magnitude. (6) Ly EW in the rest-frame. (7) Emission lines used for spectroscopic redshift determination. (8) Other detected emission lines. (9) Reference: F13 = Finkelstein et al. (2013), H18 = Hashimoto et al. (2018), Ho17 = Hoag et al. (2017), Ho18 = Hoag et al. (2018), Hu19 = Hu et al. (2019), I16 = Inoue et al. (2016), J19 = Jung et al. (2019), L17 = Laporte et al. (2017), L18 = Larson et al. (2018), O12 = Ono et al. (2012), O15 = Oesch et al. (2015), O16 = Oesch et al. (2016), RB16 = Roberts-Borsani et al. (2016), S12 = Shibuya et al. (2012), S16 = Song et al. (2016), S17 = Stark et al. (2017), T19 = Tamura et al. (2019), and Z15 = Zitrin et al. (2015).
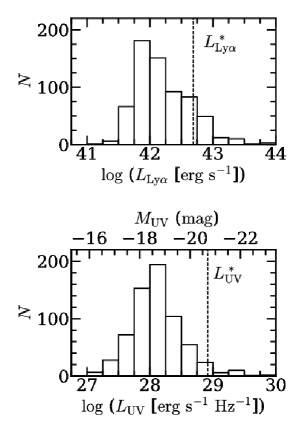
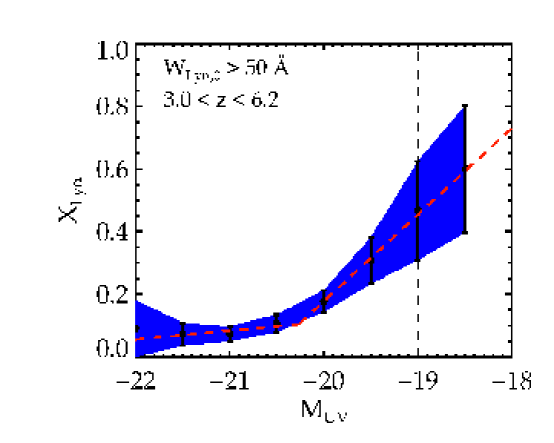
In total, thanks to the successful selection techniques and intensive spectroscopic follow-up campaigns, until now 1,000 (20,000) LAEs have been spectroscopically identified (photometrically selected) in the literature (e.g., Drake et al. 2017; Sobral et al. 2018; Shibuya et al. 2019). As shown in the bottom right panel of Figure 3, LAEs tend to have faint sub () luminosities, UV-continuum 101010 Throughout this review, the UV continuum indicates the continuum emission at the rest-frame Å. No extinction corrections are applied unless otherwise specified. luminosities fainter than the characteristic luminosity of SFGs (Reddy & Steidel 2009) at similar redshifts by about an order of magnitude. The numerous LAEs with faint UV continua can be understood by the observational fact that a UV-continuum faint SFG has a Ly emitting galaxy fraction higher than the one of a UV-continuum bright SFG (Figure 5), which is known as the Ando effect (Ando et al. 2006).
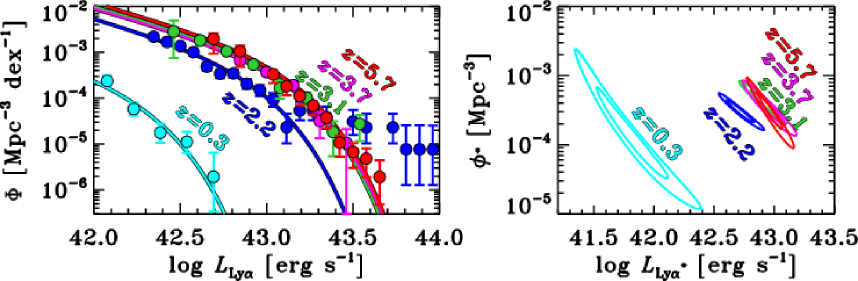
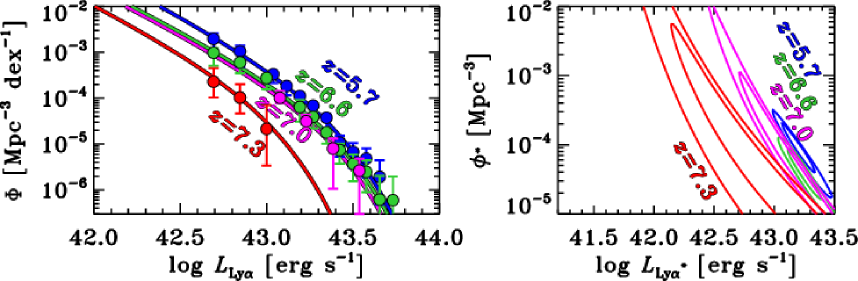
One of the most fundamental observational quantities to characterize galaxy properties is the luminosity function (LF). The left panels of Figure 6 compile Ly LF measurements for LAEs over a wide redshift range of . The Ly LF is often parameterized with a Schechter function (Schechter 1976),
| (5) |
where is the observed Ly luminosity, is the characteristic Ly luminosity, is the normalization, and is the faint-end slope. A Schechter function is also expressed with a Ly luminosity in the logarithmic form,
| (6) |
The best-fit Schechter functions derived in the literature are also plotted in the left panels of Figure 6 and their best-fit Schechter parameters are summarized in Table 2. The right panels of Figure 6 show the and confidence intervals for the combinations of the Schechter parameters of and , where the values are fixed at fiducial values of for low redshifts (top) and for high redshifts (bottom).
| redshift | Reference | |||
| ( erg s-1) | ( Mpc-3) | |||
| 0.3 | (fixed) | Cowie et al. (2010), Konno et al. (2016) | ||
| 2.2 | (fixed) | Konno et al. (2016) | ||
| 3.1 | (fixed) | Ouchi et al. (2008), Konno et al. (2016) | ||
| 3.7 | (fixed) | Ouchi et al. (2008), Konno et al. (2016) | ||
| 5.7 | (fixed) | Ouchi et al. (2008), Konno et al. (2016) | ||
| 5.7 | Konno et al. (2018) | |||
| 6.6 | Konno et al. (2018) | |||
| 7.0 | (fixed) | Itoh et al. (2018) | ||
| 7.3 | (fixed) | Konno et al. (2014), Itoh et al. (2018) |
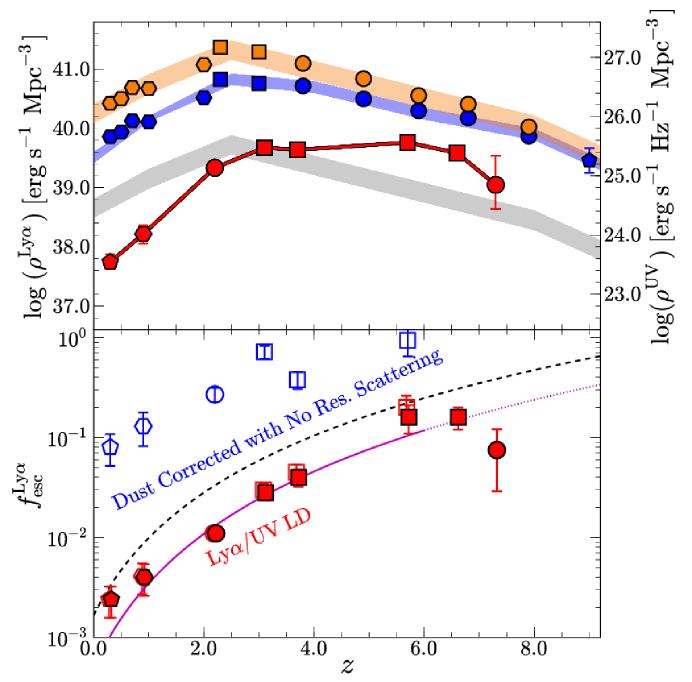
Ly LFs show three evolutionary trends: a monotonic increase from to , no evolution from to , and a rapid drop beyond . First, at , the Ly LFs show a strong increase with increasing redshift (Deharveng et al. 2008; Cowie et al. 2010). The rise of Ly LFs is much larger than that of UV-continuum LFs based on the comparisons of Ly luminosity densities (LDs), i.e.,
| (7) |
where is the limiting Ly luminosity, and the UV-continuum LDs,
| (8) |
where , , and are the UV-continuum LF, the UV-continuum luminosity, and the limiting UV-continuum luminosity, respectively. The top panel of Figure 7 (Konno et al. 2016) presents the comparison of the Ly and UV-continuum LD evolution, and indicates that the rise of the Ly LD is larger than the one of the UV LD from to . Second, from to , the Ly LFs show no significant evolution (Ouchi et al. 2008), while the UV LFs decrease strongly in the volume number density at mag by a factor of about (Bouwens et al. 2015). These differences of the evolutionary trends can be explained by the fact that the escape fraction of Ly photons and/or the ionizing photon production rate from galaxies increase with increasing redshift from to (Hayes et al. 2011; see Section 6 for more details). The Ly escape fraction is defined as
| (9) |
where is the intrinsic Ly luminosity that can be estimated from a star-formation rate (SFR), [erg s-1] [ yr-1], under the assumption of the case B recombination (Footnote 11 of Henry et al. 2015) and the relation between the H luminosity and SFR (i.e., a constant ionizing photon production rate; Kennicutt 1998). The bottom panel of Figure 7 presents evolution of the cosmic average values that are estimated with the Ly and UV LDs via eq. (9). The cosmic average monotonically increases by two orders of magnitude with increasing redshift from to . Lastly, the Ly LD appears to drop faster than the UV LD from to a higher redshift (Figure 7). Because this evolutional trend at is closely related to cosmic reionoization, we discuss this evolutional trend thoroughly in Section 9.
Another notable feature in Ly LFs is the shape of the bright end. At , the significant bright-end LF excesses beyond the Schechter functions are found and explained by AGNs by the multiwavelength analysis (Konno et al. 2016) and spectroscopy (Sobral et al. 2018). At redshifts higher than , such bright-end LF excess features are not clearly found, probably because the number densities of AGNs decrease with increasing redshift. Interestingly, at the EoR , some studies have reported possible bright-end LF excess detections, arguing that bright LAEs are presumably surrounded by large ionized bubbles (Matthee et al. 2015; Zheng et al. 2017). However, with the great statistical accuracy, the Subaru HSC survey has recently claimed that the Ly LF at can be explained by the Schechter functional form with no significant bright-end LF excess but with a steep slope of (Konno et al. 2018; Itoh et al. 2018). The shape of the bright-end LF is under debate (Hu et al. 2019).
Although the previous studies have successfully characterized the overall evolution of Ly LFs, there is still a fundamental but important open question: What is the lowest mass of dark matter halos of SFGs that can emit Ly? The previous observations are not deep enough to detect very faint LAEs. In fact, as can be seen in Table 2, most of the previous studies do not obtain good constraints on the faint end slope and thus have fixed at a fiducial value in the Schechter function fitting. From the theoretical point of view, the LF is expected to have a turnover at a faint luminosity, because it is difficult for very low-mass halos to host SFGs due to inefficiency of gas cooling (Liu et al. 2016).
4 Morphological Properties
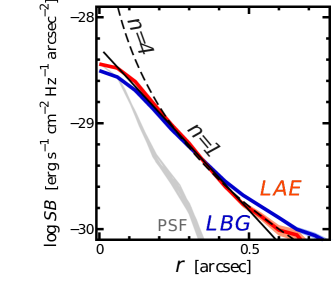
A compact nature of LAEs has been known by HST observations since the early discoveries of LAEs (Pascarelle et al. 1996). Deep HST extra-galactic legacy data have indicated that LAEs have half light radii of pkpc on average in the rest-frame UV and optical stellar continua (Malhotra et al. 2012; Paulino-Afonso et al. 2018; Shibuya et al. 2019). Although sub-structures are found in some cases, the main stellar components of LAEs basically have a disk-like radial SB profile with a Sérsic index of (Gronwall et al. 2011; Taniguchi et al. 2009) similar to LBGs (left panel of Figure 8). This typical radial SB profile of LAEs is not largely changed over cosmic time similar to other SFG populations (Paulino-Afonso et al. 2018; Shibuya et al. 2019).
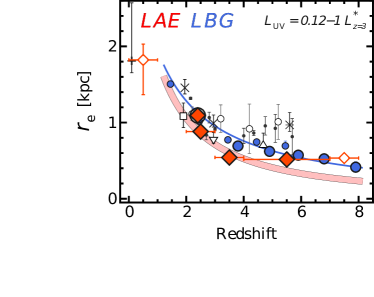
Early HST studies have reported that the UV morphology of LAEs shows the nearly no evolution over cosmic time (Malhotra et al. 2012; Paulino-Afonso et al. 2018). However, it is claimed that the no evolution results may be obtained by the bias raised by heterogeneous LAE samples in luminosity over the redshift range (Shibuya et al. 2019). Note that the UV continuum morphology of LAEs follows the -luminosity relation similar to the one of LBGs. The -luminosity relation indicates that faint continuum LAEs have a small (Leclercq et al. 2017; Shibuya et al. 2019). If sample selections at different redshifts are not well controlled, observers identify many faint LAEs at low that has a small , which diminishes a trend of evolution. Comparing bias-controlled and uncontrolled samples, Shibuya et al. (2019) find that the no evolution of LAEs is mistakenly concluded, due to the existence of the -luminosity relation and the sample bias. With the bias-controlled samples, the median values of LAEs monotonically evolve as similar to those of SFGs and LBGs at a given UV-continuum luminosity (Shibuya et al. 2019; right panel of Figure 8).
The spatial offset between Ly and stellar continuum emission peaks, referred to as the Ly spatial offset or , is an important clue to physical properties of LAEs (Ouchi et al. 2013; Jiang et al. 2013). Statistical studies suggest that LAEs with a low Ly typically have a large value (Shibuya et al. 2014b; Hoag et al. 2019). This Ly anti-correlation implies that Ly photons are selectively attenuated by dust, due to the long mean-free path of Ly photons by resonant scattering in abundant Hi gas of low-Ly galaxies that makes large values.
In summary, the disk-like radial SB profile and the values indicate that LAEs have stellar components similar to that of LBGs at a given UV continuum luminosity. This morphological similarity suggests that the Ly escape is not strongly related to the morphology of stellar components, but instead, is governed by the column density, geometry, kinematics, and/or ionization states of the ISM and CGM. This interpretation is also supported by the measurements. This physical picture is explained by the theoretical models of the viewing angle effect where Ly photons easily escape in the direction of disk face-on (Zheng & Wallace 2014; Verhamme et al. 2012). Of course, the morphology of LAEs may not be a simple disk, but a disk-like shape with sub-structures on pkpc scales that are poorly understood. Clumpy structures are identified in various high- galaxies including some LAEs (Shibuya et al. 2016; Cornachione et al. 2018; Ritondale et al. 2019). Further studies are needed to test the viewing angle effect of the Ly escape.
5 Stellar Population
Studying the stellar population of LAEs is important to understand their physical nature and to reveal the relationship between LAEs and other high- galaxies at similar redshifts. Stellar populations of galaxies are characterized with physical properties such as stellar mass and stellar age, and can be investigated from comparisons between their observed spectral energy distributions (SEDs) with those of stellar population synthesis models. Since LAEs are typically faint in the continuum, it is not easy to derive their SEDs on an individual basis, and thus many studies have performed stacking analyses of low spectral-resolution broadband photometry to obtain their typical SEDs with a high signal-to-noise ratio.111111There are two major stacking methods, i.e., average and median, and each method has its pros and cons. In general, average stacking can consider all objects in a sample yielding a good representative value, unless the sample includes outliers such as very bright AGN and/or low- emission line galaxy contaminants. Median stacking is less likely to be affected by such contaminants, although it does not take into account the fluxes of all objects in a sample. Thus, one should check the consistency of the results with these two methods. Note that, although these two stacking methods mostly give reasonable results for typical values, no stacking method can identify the large dispersion of properties in a sample if any (Vargas et al. 2014). Early studies have demonstrated that the rest-frame UV to optical SEDs of high- LAEs can be obtained from the combination of deep optical data with NIR images such taken with the Spitzer Space Telescope (Gawiser et al. 2007; Lai et al. 2008) .
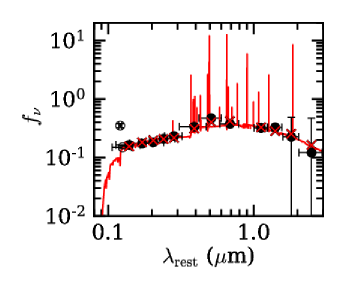
Since typical LAEs host star formation, their SEDs of broadband photometry are expected to be characterized with not only stellar emission but also nebular emission from their star-forming regions. In fact, deep NIR spectroscopy results targeting LAEs have revealed the presence of strong nebular emission lines in the rest-frame optical wavelength such as H and [Oiii]5007 (Guaita et al. 2013; Nakajima et al. 2013). A study of local LAEs indicates that a majority of LAEs have H of Å (Cowie et al. 2010). To include the influence of nebular emission on the determination of stellar population parameters, Ono et al. (2010b) have fitted stellar population synthesis models with and without nebular emission to averaged SEDs of LAEs by adopting the prescription for nebular emission suggested by Schaerer & de Barros (2009). Ono et al. (2010b) have shown that the best-fit parameters in these two cases are extremely different for the LAEs, mainly because strong nebular lines mimic a substantial Balmer break feature. 121212 It is confirmed that flux ratios of [Oiii]/H in best-fit SED+nebular emission models are consistent with those directly obtained by spectroscopy (Figure 9 of Harikane et al. 2018). For example, the best-fit stellar mass (age) in the case of considering nebular emission is about an order (two orders) of magnitude smaller than that without nebular emission, which is more serious than the case of the continuum-bright LBGs (Schaerer & de Barros 2009). It is critical for including the effect of nebular emission in stellar population analyses of LAEs.
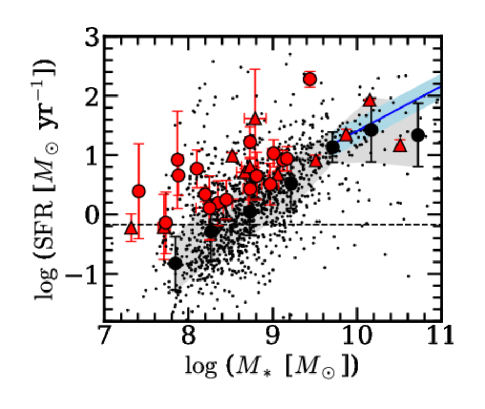
Subsequent results including the effect of nebular emission have led to a general consensus that typical LAEs are low-mass (stellar mass ), young stellar age ( Myr) 131313 This young stellar age can be found, probably due to intermittent star formation. SFGs with a SFR of yr-1 (Figure 9; Nakajima et al. 2012; see also Hagen et al. 2014), suggesting that typical LAEs are high- counterparts of local dwarf galaxies, i.e. high- analogs of local dwarf galaxies. The right panel of Figure 9 shows compilations of stellar mass and SFR estimates for LAEs at (Hagen et al. 2016) as well as photo- selected SFGs at similar redshifts (Santini et al. 2017). At fixed stellar masses of , where the completeness for the NB-selected LAEs is high enough for fair comparisons of LAEs and SFGs, LAEs have higher SFRs than the average values of the SFGs, indicating that LAEs have higher specific SFRs than typical SFGs due to the young stellar ages of LAEs.
6 Inter-Stellar Medium (ISM)
In this section, we review four topics of the ISM of LAEs.
In the first three topics, we introduce three ISM properties of LAEs: gas kinematics and neutral hydrogen column density, dust extinction, and metallicity. All of these properties are explained by the nature of LAEs that have a Ly escape fraction higher than the other galaxy population, which are detailed in the fourth topic. In the fourth topic, we present that LAEs are sources of ionizing photons with distinguished ISM features,
i.e.
a high ionization state.
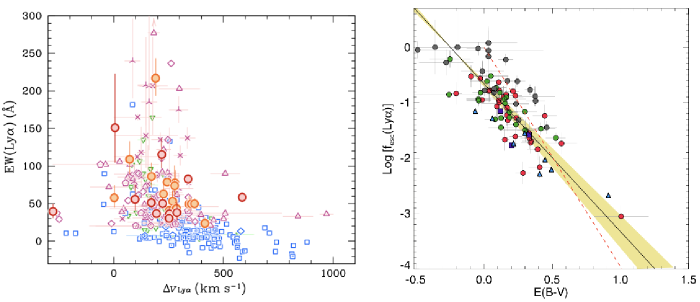
Gas Kinematics and Neutral Hydrogen Column Density — Analyses of emission and absorption lines suggest that LAEs show a strong gas outflow and a low neutral hydrogen column density . The gas kinematics is evaluated from the velocity offset of the low-ionization interstellar (LIS) UV metal absorption lines with respect to the systemic redshift . Deep NIR spectroscopic observations have found that the LIS UV metal absorption lines are typically blueshifted from by km s-1 for LAEs (Hashimoto et al. 2013; Shibuya et al. 2014a; Figure 1), suggesting that there exists a notable gas outflow with an outflow velocity of km s-1 in LAEs that is similar to LBGs, majority of which are SFGs with weak/no Ly emission (Steidel et al. 2010). Another important tool characterizing the gas kinematics is a Ly emission line. Observations of Ly emission find various shapes of Ly profiles, a Ly emission velocity offset (redshift) from the systemic velocity and double Ly emission line peaks. Several studies have measured the Ly velocity offset for LAEs (McLinden et al. 2011; Guaita et al. 2013), and have identified an anti-correlation between Ly and (Hashimoto et al. 2013; Shibuya et al. 2014a; Erb et al. 2014). As shown in the left panel of Figure 10, LAEs have a Ly velocity offset of km s-1 (see a typical spectrum in Figure 1), which is systematically smaller than km s-1 of LBGs (Steidel et al. 2010; see a typical spectrum in Figure 1c). According to the observational results, LAEs have, on average, a Ly velocity offset comparable with the outflow velocity, km s-1, while LBGs show km s-1.
If the ES model (Section 2.2) is applicable to LAEs and LBGs, various profiles of the observed Ly emission lines including the Ly velocity offsets and double peaks can be beautifully explained. The ES models best-fit to the observational data are presented with red lines in Figure 1. Moreover, the Ly anti-correlation can be interpreted by the difference in between LAEs and LBGs. In the ES model, the relation of is obtained, if the backscattered Ly emission is weak due to the small Hi column density of the shell, cm-2. In contrast, is reproduced, if the amount of Ly back scattering is large in the case of a high Hi column density in the shell, cm-2. The interpretation based on the ES model suggests that LAEs have a Hi column density of the shell lower than those of LBGs, which are quantitatively concluded by ES model fitting results (Hashimoto et al. 2015). This difference in would produce the Ly anti-correlation.
The low Hi column density for LAEs is also explained with measurements of the covering fraction, , of LIS gas estimated from the depth of LIS metal absorption lines. Medium-high resolution spectroscopy find a possible anti-correlation between Ly and (Jones et al. 2013; Shibuya et al. 2014a).
Because positively correlates with the Hi gas density on average, the Ly anti-correlation supports the idea that a large (i.e. a large Ly escape) is given by the low gas clouds.
Dust extinction — LAEs are known as dust poor galaxies. The stellar and nebular extinction values are estimated to be for majority of LAEs by stellar-population synthesis model fitting and Balmer decrement analyses, respectively (Ono et al. 2010a; Kojima et al. 2017). The dust-poor nature of LAEs is confirmed with measurements of the UV-continuum spectral slope that is defined by the power-law approximation of the UV-continuum flux, . LAEs have typically a blue UV-continuum spectrum of that is systematically smaller than those of LBGs in the same UV magnitude range (Stark et al. 2010), supporting the fact that LAEs are dust poor.
The dust extinction law of a galaxy can be evaluated by combining and the ratio,
| (10) |
where and are the total infrared and UV luminosities, respectively. Recent studies using Spitzer and Herschel have revealed that LAEs at have typically low values at a given value similar to that of the Small Magellanic Cloud (SMC)
or even below those of Calzetti’s local starbursts (Wardlow et al. 2014; Kusakabe et al. 2015). This low values are consistent with results that LAEs at have faint far-infrared (FIR) continua at the observed-frame mm band found by Atacama Large Millimeter/sub-millimeter Array (ALMA) observations
(Knudsen et al. 2016).
These and FIR studies also confirm that LAEs have the low dust extinction.
Metallicity — LAEs have a gas-phase metallicity lower than SFGs with a low Ly EW on the basis of deep spectroscopy and two kinds of metallicity estimates, strong line and direct electron temperature methods. The strong line method using, e.g., H, H, [O iii]5007,4959, is widely applied to LAEs at . Observational studies have estimated the typical gas-phase metallicity to be for LAEs at with the N2 and R23 indices (Finkelstein et al. 2011; Nakajima et al. 2012). These metallicity measurements are comparable to or lower than those of the galaxy mass metallicity relation at (Finkelstein et al. 2011), and consistent with the SFR-mass metallicity relation (Nakajima et al. 2012). Similarly low metal abundances, , are obtained for LAEs by the methods with the successful detections of faint -sensitive emission lines, [Oiii]4363 (Trainor et al. 2016) and O iii]1661,1666 (Kojima et al. 2017). These studies of strong line and direct methods indicate that the gas-phase metallicity of typical LAEs falls in a range of that is similar to or slightly lower than the typical metallicity of LBGs with the same UV-continuum luminosity (Steidel et al. 2014).
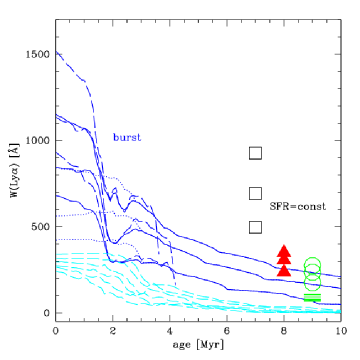
LAEs with a large Ly are thought to be candidates of metal-free, i.e. pop III, galaxies. A large Ly of Å cannot be reproduced by recombination processes in a normal SFG with the solar metallicity and a Salpeter initial mass function
(IMF; Malhotra & Rhoads 2002).
The left panel of Figure 11 presents theoretical predictions for Ly of young galaxies including pop III galaxies.
The large Ly can be accomplished by
a young extremely metal poor galaxy with
a top heavy IMF that efficiently produces ionizing photons for strong Ly via recombination
(Schaerer 2003).
Large-area imaging and deep spectroscopic observations have identified a large number of large-Ly EW sources (Hashimoto et al. 2017; Shibuya et al. 2018b).
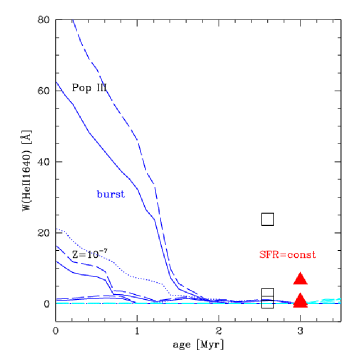
A strong Heii1640 emission line is another useful tool to distinguish pop III galaxies from pop II SFGs, because a production of Heii line requires metal-poor massive stars emitting high-energy ( eV) photons that ionize He+.
The right panel of Figure 11 shows Heii1640 as a function of stellar age for models of young galaxies including pop III galaxies, and indicates that a moderately strong Heii1640 (Å) line can be observed in a young extremely metal poor galaxy with a top heavy IMF. Although Heii1640 emission can be also found in AGNs and SFGs with a notable amount of Wolf-Rayet stars, such objects, except type 2 AGNs and high-mass X-ray binaries, can be removed by a presence of their broad line (Å) component of Heii emission.
There are several reports of detecting such strong and narrow Heii1640 emission in large-Ly EW sources (Prescott et al. 2009; Sobral et al. 2015). However, subsequent spectroscopy and multi-wavelength studies suggest that these objects are not pop III galaxies,
due to the detections of metal lines or the lack of evidence on the strong Heii1640 emission (Prescott et al. 2015; Shibuya et al. 2018a; Bowler et al. 2017; See Section 4.3 of Ouchi 2019 for a summary).
So far, no promising candidates of pop III galaxies have remained.
Ly Escape Fraction — As described above, LAEs have the ISM with , , and lower than those of other types of galaxies with a low Ly EW at the similar redshift. These characteristics of the ISM are plausibly related to the high Ly escape fraction (; Section 3) of LAEs. The low and allow Ly photons to easily escape from the ISM of LAEs due to a small number of the Ly resonant scattering and absorption. Here, the low is necessary for the low .
The connection between and the ISM properties has been understood on the individual and statistical bases. The Ly escape fraction has been estimated individually for LAEs at (Atek et al. 2014; Blanc et al. 2011). The right panel of Figure 10 presents that anti-correlates with , indicating that Ly photons are heavily absorbed in a dusty galaxy. On the other hand, as discussed (shown) in Section 3 (Figure 7), the cosmic average values increase monotonically from to by two orders of magnitude (Hayes et al. 2010; Konno et al. 2016). The strong (two orders of magnitude) increase in is explained neither by 1) IGM absorption, 2) stellar population, 3) outflow velocity, 4) clumpy ISM, nor 5) dust extinction of a simple screen dust model (Konno et al. 2016).
Historically, it was often discussed that the large found in SFGs at high redshift was explained by the scenario of selective dust attenuation for Ly and UV-continuum in the clumpy ISM (a.k.a. Neufeld’s effect; Neufeld 1991). In the clumpy ISM, Ly photons are resonantly scattered on the surface of clumpy gas clouds with a negligible dust absorption (see Figure 1 of Neufeld 1991). By the resonance scattering, the total number of Ly photons is conserved. On the other hand, UV-continuum photons penetrate multiple clumpy gas clouds in the foreground whose centers have dusty molecular gas, being heavily absorbed by the dust. The difference of Ly and UV-continuum extinction produces a high Ly . The validity of the Neufeld’s effect had not been tested in realistic ISM conditions, but only in a simple case of the static and very clumpy/dusty ISM since the publication of Neufeld (1991). Recent radiative transfer simulations have conducted extensive calculations with various physical parameters, and found that the Neufeld’s effect exists, but emerges only under special physical conditions, a low outflow velocity, very high extinction, and an extremely clumpy gas distribution (most gas is locked up in clumps), many of which do not agree with the observed properties of LAEs (Laursen et al. 2013; Duval et al. 2014). The clumpy ISM scenario is probably not the reason of the high values at high redshift.
Although the physical origin of the strong increase in has not been definitively concluded,
the rise in is probably caused by another scenario,
6) the decrease of Hi column density towards high- that reduces the resonant scattering and thus dust attenuation of Ly.
This scenario can explain
the increase of by two orders of magnitude (Konno et al. 2016).
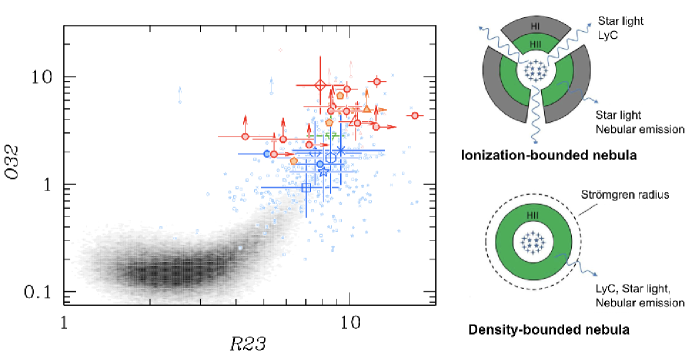
Ionization State — Recent optical and NIR spectroscopy find that LAEs have ionizing states significantly different from those of other galaxy populations. The left panel of Figure 12 shows that the ratio 141414 In this review, we use the definition, , including Figure 12. Note that some studies use , and that the the ratio of to is 3, a constant value determined by atomic physics (Storey & Zeippen 2000). , the line flux ratio of [Oiii]5007 to [Oii]3727, of LAEs is times higher than those of local galaxies and even higher than those of LBGs at the similar redshifts (Nakajima & Ouchi 2014). Based on comparisons with photoionization models in the vs. 151515 . diagram, the high ratios of LAEs indicate high ionization parameters, cm s-1. Detections of high ionization lines of Ciii]1907,1909 and Civ1548 also indicate that the ionization state of LAEs is very high (Stark et al. 2014). On the other hand, recent ALMA studies have suggested that the [Cii]158m emission of LAEs are systematically fainter than the local SFR- relation (Ouchi et al. 2013; Harikane et al. 2018, cf. Carniani et al. 2018). Although a faint [Cii]158m luminosity for a given SFR could be explained by a presence of AGN or the collisional de-excitation of C+, LAEs show neither AGN activity nor gas density high enough for the collisional de-excitation.
The two properties of the high and weak [Cii]158m emission may be consistently explained by the ISM of density-bounded nebula (Nakajima & Ouchi 2014). The right panel of Figure 12 shows a conceptual diagram of density-bounded and ionization-bounded nebulae.
In the density-bounded (ionization-bounded) nebula, the size of ionized regions are determined by the amount of gas around ionizing sources (the number of ionizing photons).
In contrast with the ionization-bounded nebula, the density-bounded nebula has a small outer shell of ionized gas emitting low-ionization lines including [Oii]3727, while the density-bounded nebula has a well-developed inner core of highly ionized gas producing high-ionization lines (e.g., Ciii]1907,1909, [Oiii]5007,4959, and [Oiii]88m). In this case, [Cii]158m-emitting photo-dissociation region (PDR) does not exist.
More realistically, a non-zero % covering fraction of PDR can explain both small [Cii]158m/SFR and large [Oiii]88m/SFR ratios found in high- SFGs, a majority of which are LAEs (Harikane et al. 2019a).
Moreover, the density-bounded nebula would help ionizing photons escape from the ISM of LAEs, contributing to the cosmic reionization (Nakajima & Ouchi 2014; Jaskot & Oey 2014; see Section 9).
There are many open questions about the ISM of LAEs. Although the density-bounded nebula is an interesting scenario, no direct evidence of density-bounded nebulae has been obtained. Another problem of the ISM is that some LAEs have an extremely low value for a given UV slope even below the SMC’s dust extinction curve (Capak et al. 2015). It is unclear how such a low value is reproduced, because realistic dust sizes cannot make the flat - relation. Besides these detailed physical questions, one should push high Ly EW LAE searches 161616 See the text of the metallicity topic in this Section. for a promising candidate of pop III galaxy whose identification is key for understanding the first stage of galaxy formation.
7 Circum-Galactic Medium (CGM) and the Large-Scale Structures Traced by Diffuse Ly
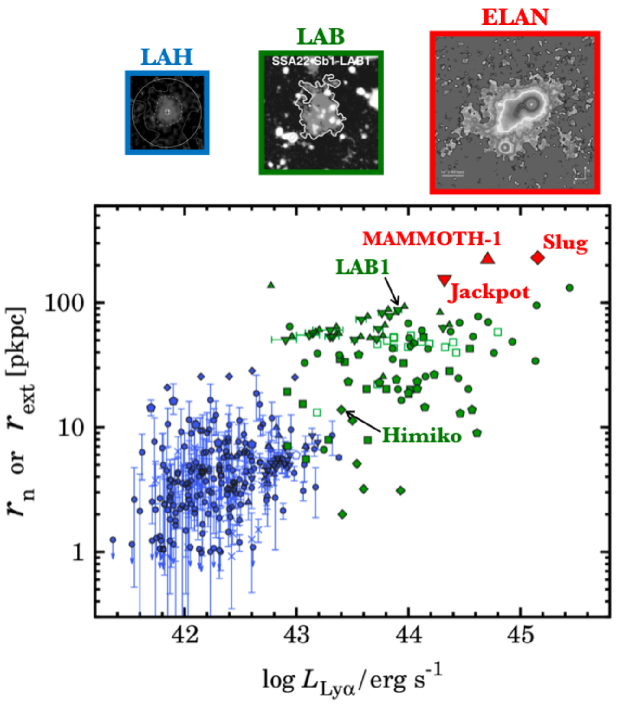
This section presents the diffuse and spatially extended Ly emission around SFGs from a small scale to a large scale that are known as Ly halos (LAHs), Ly blobs (LABs), enormous Ly nebulae (ELANe), and the large-scale Ly emission in the IGM. The extended Ly emission has a large diversity in size, ranging from pkpc to pkpc,
which are summarized in Figure 13. Note that LAHs, LABs, and ELANe are not clearly defined by physical quantities, but roughly classified by the Ly luminosity and size.
Although the physical origins of the extended Ly emission are poorly understood, there are six scenarios for the extended Ly emission: 1) resonant scattering of Ly emission from central star-forming regions and/or AGNs, 2) photoionization/recombination in unresolved dwarf satellite galaxies, 3) outflowing gas, 4) infalling gas, 5) fluorescence, and 6) galaxy mergers. In the following paragraphs, we review properties and possible physical origins of the extended Ly emission.
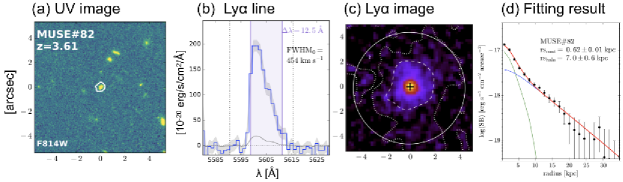
— Ly halos (LAHs) are the pkpc-scale extended Ly emission found around SFGs at (top panels of Figure 14). Although the Ly luminosity and size of LAHs depend on physical properties of hosting SFGs, most of high- SFGs ubiquitously have LAHs. The diffuse Ly emission of LAHs have been identified by image stacking analyses on the statistical basis (Hayashino et al. 2004; Steidel et al. 2011; Matsuda et al. 2012) and deep spectroscopic observations on the individual basis (Wisotzki et al. 2016; Leclercq et al. 2017). The Ly radial SB profile is approximated with an exponential function,
| (11) |
where , , and are the Ly SB, the radius from the galaxy center, and the normalization factor, respectively
171717
Although the exponential profile is an empirical model, a Ly radial SB profile
similar to the exponential profile can be derived on the basis of a physical picture of Ly resonant scattering in a gaseous halo with a simple power-law distribution of Hi gas, , where is a power-law index (Steidel et al. 2011).
.
The parameter of is the Ly halo scale length, quantifying the extent of LAHs. Several studies find that correlates with physical properties of LAEs, providing useful hints for physical origins of LAHs.
In SFGs,
the Ly halo scale length
decreases with increasing the Ly luminosity of the central part of the SFGs at pkpc
(; Momose et al. 2016),
indicating that a large Ly halo is found in -faint galaxies.
(In other words, Ly halos are small in LAEs whose central pkpc part of Ly luminosity is bright.)
The -faint galaxies may be explained by strong Ly resonant scattering (scenario 1) in the thick Hi clouds near the galaxy center, which eventually produce a largely extended Ly halo.
On the other hand, radiative transfer and hydrodynamical simulations suggest that the Ly resonant scattering effect (scenario 1) cannot reproduce the largely-extended Ly SB profiles of LAHs, while the cooling radiation (scenario 4) may be needed to explain Ly emission at the outer part of LAHs (Lake et al. 2015). In contrast with the Ly emission, UV-continuum emission is not spatially extended in observational data (Momose et al. 2014; Leclercq et al. 2017). This compact UV-continuum emission would rule out a significant contribution from unresolved dwarf satellite galaxies (scenario 2). Recently, stacked ALMA data reveal that SFGs at have a 10 pkpc-scale extended carbon [Cii]m emission whose SB profile shape is very similar to the one of the Ly emission (Fujimoto et al. 2019). The existence of the extended emission of [Cii] similar to Ly might suggest that LAHs are originated from the neutral gas expelled by outflows that are carbon enriched (scenario 3).
Deep observations identify that the value is almost constant over the redshift range of ,
perhaps suggesting no significant redshift evolution of physical properties of LAHs
at
(Momose et al. 2014; Leclercq et al. 2017). There is a hint of an increase of towards the reionization epoch of , but the increase is found only at the level (Momose et al. 2014).
— Ly blobs (LABs) are spatially extended Ly nebulae with a physical scale of pkpc and a Ly luminosity of erg s-1 (Steidel et al. 2000; Matsuda et al. 2004; Shibuya et al. 2018b). Such extended Ly emission has been found around various types of sources: e.g., SFGs (Steidel et al. 2000; Ouchi et al. 2009), radio-loud galaxies (McCarthy et al. 1987; van Ojik et al. 1997), and radio-quiet QSOs (Borisova et al. 2016).
Physical properties of LABs have been investigated by multi-wavelength observational and theoretical studies. Deep X-ray observations find that a majority of LABs show no clear AGN activity, while % of LABs host an AGN (Basu-Zych & Scharf 2004; Geach et al. 2009). Similarly, % of LABs are detected at radio wavelengths (Ao et al. 2017). These X-ray and radio results would indicate that AGNs contribute to the extended Ly emission in some LABs via Ly resonant scattering and/or fluoscence (scenarios 1 and 5). A tangential polarization signal up to % is detected in the Ly emission around an LAB (Hayes et al. 2011), which might suggest that LABs are produced by Ly resonant scattering (scenario 1; Dijkstra & Loeb 2008; cf. Trebitsch et al. 2016). According to theoretical studies (Fardal et al. 2001; Dijkstra & Loeb 2009; Goerdt et al. 2010), the extended Ly emission of LABs can be reproduced by the cooling radiation (scenario 4). However, LABs have a moderately large Ly velocity offset from the systemic velocity, several hundreds km s-1 (Yang et al. 2014),
that may be evidence for strong outflow (scenario 3). HST observations reveal that some high- LABs have multiple stellar components (Ouchi et al. 2013; Sobral et al. 2015), which
suggests
that starbursts caused by galaxy mergers (scenario 6) create the extended Ly emission. The galaxy merger scenario might be supported by the fact that LABs reside in galaxy overdense regions (Matsuda et al. 2004; Yang et al. 2010; Kikuta et al. 2019).
— Enormous Ly nebulae (ELANe) are extended Ly emission harboring QSOs (Cantalupo et al. 2014; Hennawi et al. 2015; Cai et al. 2016). The Ly emission of ELANe extends to a scale of several hundreds pkpc ( pkpc for some ELANe) that is larger than a virial radius of a dark-matter halo hosting the QSOs. The existences of energetic QSOs suggest that ELANe are fluorescently illuminated (scenario 5). However, very high density clumps are needed to produce the observed high Ly SB of erg s-1 cm-2 arcsec-2 (Cantalupo et al. 2014). Alternatively, the Ly resonant scattering may be also important in ELANe (scenario 1). Distinguishing the two scenarios of 1) and 5), one should observe non-resonant hydrogen recombination lines such as H in ELANe as demonstrated by Leibler et al. (2018).
NB imaging observations and the Keck/Palomar Cosmic Web Imagers (KCWI/PCWI) spectroscopy find that ELANe tend to reside in galaxy overdense regions (Cai et al. 2017, 2018). The environments of ELANe indicate that ELANe would exist in progenitors of massive galaxy clusters.
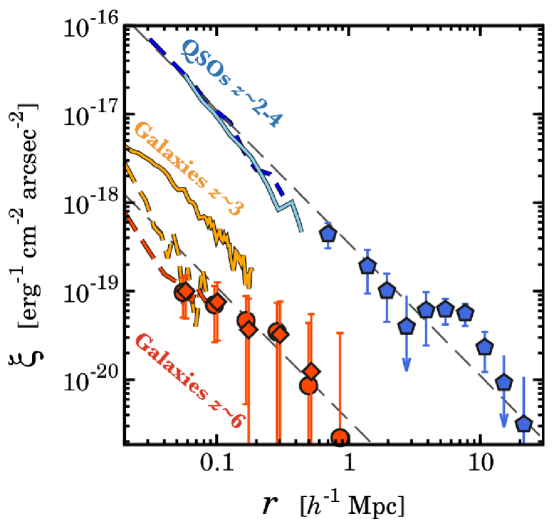
— The large-scale Ly emission extending to comoving Mpc (cMpc) is identified by the cross-correlation Ly intensity mapping technique (bottom panel of Figure 14). The cross-correlation Ly intensity mapping technique is to obtain the spatial cross correlation between objects with known redshifts (e.g. galaxies and QSOs) and faint Ly emission below a detection limit of imaging/spectroscopic data, and to detect the faint Ly emission, where the spatial cross correlation analysis systematically removes signals unrelated to the objects.
Croft et al. (2018) report the detection of a very faint Ly emission around QSOs at a large scale of cMpc by Ly intensity mapping of cross correlation between SDSS BOSS QSOs at and Ly emission in a large number of SDSS spectra (with no Ly detections on individual basis).
The radial SB profile of these large-scale Ly emission is smoothly connected to the one of ELANe at cMpc (bottom panel of Figure 14). The connection with ELANe indicates that the large-scale Ly emission may be produced by the fluorescent radiation from QSOs (scenario 5). In addition to QSOs, Kakuma et al. (2019) conduct Ly intensity mapping of cross correlation between LAEs at and Ly emission in NB image pixels, and identify extremely faint Ly emission around LAEs at a spatial scale beyond a virial radius of the LAE hosting dark-matter halo ( cMpc) up to cMpc.
This cross-correlation signals of LAEs are consistent with the extrapolation of Ly radial SB profiles of LAHs (Leclercq et al. 2017; bottom panel of Figure 14). Comparisons with numerical simulations suggest that the large-scale Ly emission is not fully explained by the combination of resonant scattering (scenario 1) and unresolved dwarf satellite galaxies (scenario 2), but contributed by Ly emission created by other mechanisms that possibly includes the cold accretion.
Due to the diverse physical properties, it is still under debate how the extended Ly emission is produced in LAHs, LABs, and ELANe. It is also unclear whether the possible increase in to the epoch of reionization truly exists (see the topic of LAHs), which is thought to be an indicator of the IGM neutral hydrogen fraction increase (Jeeson-Daniel et al. 2012).
8 Clustering of LAEs
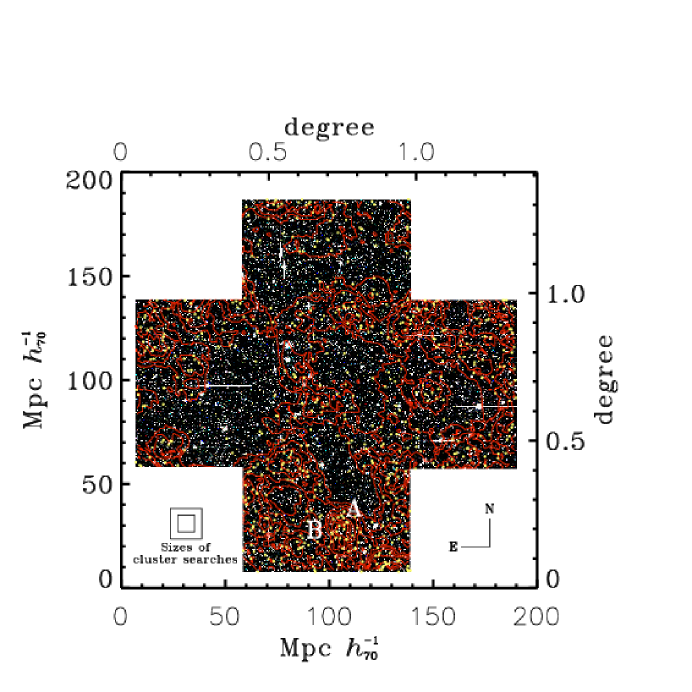
Distant cosmic structures including primeval large-scale structures and progenitors of galaxy clusters (a.k.a. protoclusters) are investigated with LAEs. LAEs are advantageous to map out the spatial distribution of high- galaxies efficiently by NB imaging and spectroscopic surveys (Ouchi et al. 2005a; Yamada et al. 2012b). Figure 15 is the map of LAEs at over the scale of deg2 corresponding to cMpc, showing primeval galaxy clusters, filaments, and voids.
The systematic large-scale structure survey is being conducted by HETDEX (Section 3). HETDEX is a cosmology survey investigating cosmic structures at , measuring the baryon acoustic oscillation on the scale of cMpc for understanding the equation state of dark energy.
| Name | Sample | Ref. | ||||
|---|---|---|---|---|---|---|
| (1) | (2) | (3) | (4) | (5) | (6) | (7) |
| z66OD | 6.59 | 12 | LAE | H19 | ||
| HSC-z7PCC26 | 6.54 | 14 | LAE | C17,19,Hi19 | ||
| SDF | 6.01 | 10 | LBG | To14 | ||
| z57OD | 5.69 | 44 | LAE | O05,J18,H19 | ||
| SPT2349-56 | 4.31 | 14 | SMG | M18 | ||
| TNJ1338-1942 | 4.11 | 37 | LAE/LBG | V07,M04,Z05,Ov08 | ||
| DRC-protocluster | 4.00 | 10 | SMG | O18 | ||
| PC217.96+32.3 | 3.79 | 65 | LAE | Lee14,D16,S19 | ||
| D4GD01 | 3.67 | 11 | LBG | To16 | ||
| ClJ0227-0421 | 3.29 | 19 | Spec | Lem14 | ||
| TNJ2009-3040 | 3.16 | LAE | V07 | |||
| MRC0316-257 | 3.13 | 31 | LAE | V07 | ||
| SSA22FLD | 3.09 | LBG/LAE/SMG | S00,M05,Y12,U18 |
Note: Spectroscopically-confirmed protoclusters having galaxies with spectroscopic redshifts. The protoclusters are listed in order of redshift. This table is the abstract of Table 3 of Harikane et al. (2019b). (1) Protocluster name. (2) Redshift. (3) Number of member galaxies confirmed by spectroscopy. (4) Galaxy overdensity. Note that the length scales of the overdensity measurements differ. (5) Types of member galaxies so far identified. (6) Total (expected) mass of the overdensity at the redshift () in units of solar masses. (7) Reference: ( C17,19: Chanchaiworawit et al. 2017, 2019, D16: Dey et al. 2016, Hi19: Higuchi et al. 2019, H19: Harikane et al. 2019b, J18: Jiang et al. 2018 Lee et al. 2014, Lee et al. 2014, Lem14: Lemaux et al. 2014, M04: Miley et al. 2004, M05: Matsuda et al. 2005, M18: Miller et al. 2018, O05: Ouchi et al. 2005b, Ov08: Overzier et al. 2008, O18: Oteo et al. 2018, S00: Steidel et al. 2000, S19: Shi et al. 2019, To14,16: Toshikawa et al. 2014, 2016 U18: Umehata et al. 2018 V07: Venemans et al. 2007, Y12: Yamada et al. 2012a Z05: Zirm et al. 2005 )

In the scale of galaxy clusters, LAEs are tracers of the galaxy distribution, which is the concept same as the one of the HETDEX cosmology survey. The overdensity is defined as
| (12) |
where () is the (average) number density of LAEs in a volume or an area. Because LAEs are low-mass galaxies (Section 5), LAEs show overdensity regions whose values are smaller than those of LBG and submillimeter-galaxy (SMG) overdensity regions. However, overdensity regions of mass distribution are pinpointed with an LAE sample, if the LAE sample is large enough to provide measurements with a high statistical accuracy distinguishing the overdensity regions from the field.
Theoretical models suggest that LAE overdensities with large values are progenitors of clusters, i.e. protoclusters (Chiang et al. 2013). Protoclusters of LAE overdensities are identified at by blank-field surveys such as large-area NB observations (Ouchi et al. 2005a; Yamada et al. 2012b; Harikane et al. 2019b). Table 3 summarizes the spectroscopically-confirmed protoclusters identified by the LAE blank-field surveys, and compares protoclusters identified with the other types of galaxies such as LBGs and SMGs.
Clustering properties of LAEs are quantified with correlation functions in two or three-dimensional space. The top left panel of Figure 16 presents the two-dimensional space correlation functions , i.e. the angular correlation functions (ACFs), of LAEs at and (Ouchi et al. 2018). Clearly, the ACFs of the LAEs are stronger than those of underlying dark matter predicted by the linear theory of the CDM model (top left panel of Figure 16). In the CDM framework, the excess of above is evaluated by the bias that is defined as
| (13) |
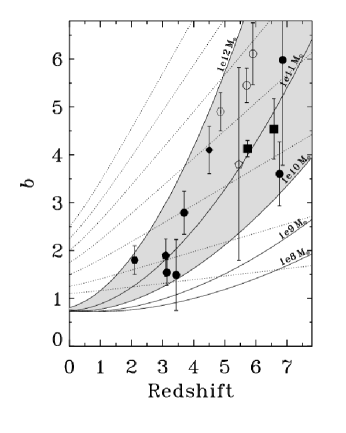
The definition of the bias is also given by , where and are the same as and , respectively, but for the three-dimensional space (spatial) correlation functions at the scale of . The bottom left panel of Figure 16 shows bias of the LAEs as a function of angular distance. The bias of the LAEs evolves by redshift, and increases towards high- (right panel of Figure 16). The average bias of LAEs is at and at (Ouchi et al. 2018). This increase of bias towards high is explained by the physical picture that a galaxy forms only at a rare peak of density fluctuations, where dark-matter halos are made, at the early stage of the cosmic structure formation (Bardeen et al. 1986). Based on the average bias evolution of Figure 16, the low bias values indicate that LAEs at may be progenitors of today’s Milky-Way like galaxies (Gawiser et al. 2007), while the high bias values suggest that LAEs at are progenitors of present-day massive elliptical galaxies (Ouchi et al. 2010).
There are large scatters in the bias measurements of LAEs obtained to date (see the right panel of Figure 16). The scatters would be larger than the statistical uncertainties. It is suggested that the large scatters are made by the sample variance, a.k.a. cosmic variance, originated by the small survey volumes (Kusakabe et al. 2018). Although the survey volumes of LAEs are generally small, cMpc3 or less, on-going Subaru HSC and HETDEX observations are providing the measurements of bias with negligibly small cosmic variance effects.
The correlation function is modeled by the power law or the halo occupation distribution (HOD) model. The power law is the empirical relation that has been used since the early measurements of local galaxy correlation functions were obtained (Totsuji & Kihara 1969). The HOD model is the parameterized model providing the relation between observed galaxies and hosting dark-matter halos of the CDM structure formation (Cooray & Sheth 2002). The parameters of the HOD model define the occupation of galaxies in a dark-matter halo as a function of mass, including the dark-matter halo mass limit for hosting a galaxy and the power-law slope (and the scatter) of the occupation number depending on dark-matter halo mass. Once the occupation of galaxies in a dark-matter halo is determined, a correlation function and abundance of galaxies can be predicted with the HOD model. The correlation function consists of two components, 1-halo and 2-halo terms in small ( comoving Mpc; cMpc) and large ( cMpc) scales, respectively (top left panel of Figure 16). The 1-halo term signal is originated from clustering of galaxies within one dark-matter halo, while the 2-halo term signal is made by clustering of galaxies hosted by different dark-matter halos. The correlation function and the abundance of galaxies, thus predicted, are compared with those of observational results, which determine the HOD model best-fit parameters. The HOD model with the best-fit parameters reveals properties of dark-matter halos hosting LAEs, and indicates that the average mass of dark-matter halos are moderately small, for the LAEs (top left panel of Figure 16; Ouchi et al. 2018). Because this is the average value of the dark-matter halo masses, there should exist more LAEs with masses higher and lower than the average mass in overdensity (i.e. proto-cluster) and underdensity regions, respectively.
Once the mass of the hosting dark-matter halos is constrained by HOD modeling, the number density of the hosting dark-matter halos can be estimated with the CDM model. The value can be compared with the number density of the observed LAEs . The Ly duty cycle of LAEs, is defined as the ratio of to ,
| (14) |
is the fraction of the Ly emitting galaxies to the dark-matter halos for a given mass. In the physical picture of LAEs, the Ly duty cycle is determined by two effects, the intermittent star-formation activity and time-dependent Ly escape. Observational results suggest that is about % (Gawiser et al. 2007; Ouchi et al. 2010) that is comparable with the predictions of the numerical simulations, % (Nagamine et al. 2010). As detailed in this section, clustering measurements of LAEs are not only useful to probe the cosmic structures, but also to understand the physical properties of LAEs, hosting dark-matter halos and Ly duty cycles.
9 Cosmic Reionization and Ly
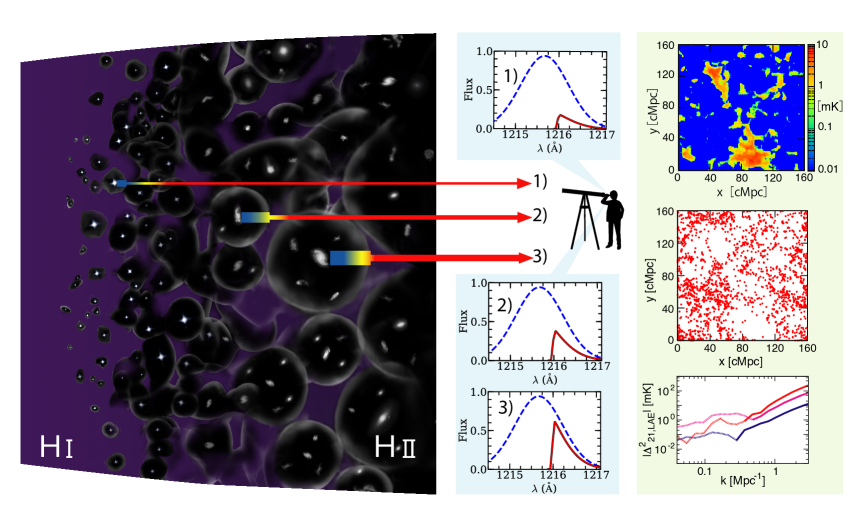
Deep observations for galaxies have reached the EoR at , when the neutral hydrogen of the IGM is ionized (Fan et al. 2006; left panel of Figure 17).
Ly photons from a galaxy are scattered by the partly neutral hydrogen at the EoR. Ly lines are redshifted from the systemic velocity of a galaxy by km s-1 on average (Section 6), avoiding the extremely strong resonant scattering at the rest-frame Å in the partly neutral IGM. However, the redshifted Ly is still scattered by the neutral hydrogen of the IGM via the Ly damping wing (DW). Ly DW is a Ly profile of the long wavelength tail given by the natural broadening (originated by the quantum effect).
There is another important mechanism of Ly scattering in the neutral IGM at the EoR that is illustrated in Figure 17. Theoretical models of reionization predict that UV radiation of a galaxy make an ionized bubble around the galaxy in the neutral IGM, and that the galaxy resides within the ionized bubble (left panel of Figure 17). In this theoretical picture, Ly photons can escape from the partly neutral IGM via the ionized bubble. At the back of the bubble on the border between the ionized and neutral hydrogen IGM, the neutral hydrogen gas is redshifted from the galaxy by the Hubble flow, which help Ly photons of the galaxy escape from the partly neutral IGM to the observer (center column panels of Figure 17).
Constraining the amount of the Ly scattering in the IGM by observations, various studies have estimated the neutral hydrogen fraction or the ionized fraction ,
| (15) | |||||
| (16) |
where and are the densities of neutral and ionized hydrogen, respectively. A volume-averaged (or ) is derived by Ly studies.
Recent observational studies have identified signatures of Ly photons scattered by Ly DW of the neutral hydrogen gas at the EoR. Bright continuum objects, Gamma-ray bursts (GRBs) and QSOs, at the EoR are good probes of Ly DW absorption with an intrinsic continuum spectrum modeled with a power law and an average spectrum of low- QSOs, respectively (Totani et al. 2016; Bañados et al. 2018). However, the small numbers of GRBs and quasars can probe the neutral hydrogen of the IGM on the small number of sight lines. For example, a theoretical model suggests that a single-object estimate of GRB gives a systematic bias at the moderately high level of , due to the patchy distribution of the neutral hydrogen at the EoR (McQuinn et al. 2008). Moreover, there is a well-known systematics of the ionization state of the IGM around a QSO (i.e. proximity effect Bajtlik et al. 1988). Here, observations of LAEs can complement the one with the bright continuum objects, GRBs and QSOs. Although there are a variety of Ly emission spectral shapes in LAEs, one can investigate a large number of LAEs distributed from high to low density regions. The large statistics of LAEs allows us to understand the evolution of the average neutral hydrogen fraction with negligible bias raised by the diversity of Ly emission spectral shapes (Weinberger et al. 2019).
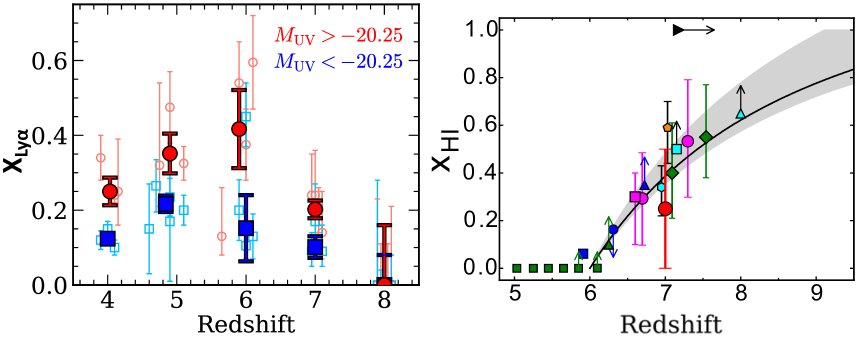
There are two popular techniques that study the average amount of Ly damping wing absorption in the IGM with LAEs. One technique is the Ly LF via the comparison with the UV-continuum LF (Malhotra & Rhoads 2004; Kashikawa et al. 2011; Itoh et al. 2018). Ly and UV-continuum LDs are derived with the LFs. Note that the redshift evolution of the Ly LD is determined by galaxy evolution and Ly opacity of the IGM. Because the UV-continuum LD is a tracer of SFR and the dust extinction in the ISM, the Ly LD decrease faster than the UV-continuum LD evolution suggests an increase of Ly opacity of the IGM, which is shown in the top panel of Figure 7 (see Figure 11 of Itoh et al. 2018 for statistically significant results). Ly LD rapidly drops from to , while the evolution of the UV-continuum LD is milder than the one of the Ly LD. This evolutional difference allows us to estimate the Ly opacity via the comparisons with analytical and numerical models of cosmic reionization (Furlanetto et al. 2006; McQuinn et al. 2007). Another technique is to investigate a fraction of Ly emitting galaxies to all of the UV continuum-selected galaxies (Stark et al. 2011; Pentericci et al. 2011; Ono et al. 2012). The left panel of Figure 18 and Table 4 summarize the measurements of the Ly emitting galaxy fractions for galaxies with the two different limits of the UV-continuum magnitudes. In Figure 18 and Table 4, we show the average Ly emitting galaxy fractions with standard errors that are estimated from the compilation of the data so far obtained by various observational studies (Arrabal Haro et al. 2018; Caruana et al. 2018; Cassata et al. 2015; Curtis-Lake et al. 2012; De Barros et al. 2017; Kusakabe et al. 2020; Mallery et al. 2012; Mason et al. 2019; Ono et al. 2012; Pentericci et al. 2018; Schenker et al. 2014; Stark et al. 2011; Tilvi et al. 2014; Treu et al. 2013). The Ly emitting galaxy fraction is increasing from to , while this fraction clearly decreases from to , indicating that the Ly opacity is increasing from to . The decrease of the Ly emitting galaxy fraction is modeled, providing estimates of the cosmic average . The estimates, thus obtained, are summarized in the right panel of Figure 18 indicating the cosmic reionization history. The neutral hydrogen gas fraction increases from towards high-, and the mid-point of cosmic reionization, %, is estimated to be .
| Sample | Magnitude | Redshift | |
|---|---|---|---|
| Bright | 4.0 | ||
| 4.8 | |||
| 6.0 | |||
| 7.0 | |||
| 8.0 | |||
| Faint | 4.0 | ||
| 4.9 | |||
| 5.9 | |||
| 7.0 | |||
| 8.0 |
Ly emission is the strongest line found in the optical wavelength for majority of objects at . Although this characteristics of Ly emission is very advantageous for studies of high- objects, this advantage may not be true for sources at the middle or early EoR. This is because a chance of a detection of Ly emitting galaxy decreases towards high- (left panel of Figure 18), due to the fact that Ly photons from galaxies are scattered by the neutral hydrogen of the IGM at the EoR . If LAEs and the IGM are static and uniformly distributed, no Ly photons can escape from the neutral universe. However, in reality, Ly photons come out of the highly neutral IGM with the help of the Ly velocity shifts (from the neutral IGM) given by the peculiar motions of galaxies as well as the ionized bubbles around clustered galaxies. Theoretical models indicate that about 10% of Ly fluxes can escape from the highly neutral IGM by the help of these physical effects (Gnedin & Prada 2004). There is an open question whether a redshift limit of a Ly detection exists and what redshift is the limit, if it exists. A future accurate measurement of the Ly observability at the early EoR () will allow us to understand the physical properties of the LAE dynamics and the ionized bubbles.
Theoretical studies predict that LAEs are key sources for identifying signals of the Hi 21cm emission originated from neutral hydrogen at the EoR (Lidz et al. 2009; Sobacchi & Mesinger 2015; Hutter et al. 2018). Although there are several high-sensitiviy radio telescopes targeting the EoR 21cm emission (e.g. LOw Frequency ARray, LOFAR; Jelić et al. 2014), no signals of the EoR 21cm emission have been detected so far, mainly due to the bright foreground emission of the Earth’s ionosphere. Here, LAEs can be used as signposts for the EoR 21cm emission detections. The large sample of LAEs with known positions and redshifts allows us to conduct cross-correlation analysis with EoR 21cm data (Lidz et al. 2009), and to identify a signal of the EoR 21cm emission, removing the problematic foreground emission. The bottom right panel of Figure 17 presents the LAE-21cm cross-power spectra predicted by numerical simulations (Kubota et al. 2018). These cross-power spectra are calculated with the simulation data of the 21cm brightness temperature (LAE distribution) map shown in the top (middle) right panel of Figure 17. The cross-power spectrum consists of two components at small and large scales. The large-scale component is the negative signal (i.e. anti-correlation) representing ionizing sources (LAEs) that make ionized bubbles (i.e. no neutral hydrogen around LAEs), while the small-scale component is the positive signal indicating that LAEs form in an overdensity of neutral hydrogen. There exists a transition between the negative and positive signals, due to the ionized bubbles around LAEs. A detection of the negative and positive signals will confirm an existence of ionized bubbles at the EoR. In summary, the LAE-21cm cross correlation analysis will help the detection of the EoR 21cm signal, and characterize the cosmic reionization process via the ionized bubble topology.
LAEs are young SFGs that have abundant massive stars producing ionizing photons contributing to cosmic reionization. For faint SFGs with , the number fraction of LAEs reaches % of the faint SFGs at the redshift of the EoR 181818 Although the fraction of LAEs decreases from towards high-, this decrease is just made by a low observability given by the external effect of the neutral IGM that scatters Ly photons. (left panel of Figure 18), indicating that LAEs are dominant population of SFGs that supply ionizing photons for cosmic reionization. In fact, the UV-continuum luminosity function of LAEs is comparable to the one of LBGs at , while those of LAEs fall below those of LBGs by an order of magnitude at (See Figure 22 of Ouchi et al. 2008).
With the ionizing photon production rate that is defined by the number of ionizing photons per volume and time, the budget of ionizing photons in cosmic reionization is modeled in the one zone model of the ionization equation (Madau et al. 1999; Robertson et al. 2015). Here the derivative of ionized fraction (eq. 16) with respect to time is written as
| (17) |
where and are the average hydrogen number density and the recombination time, respectively, defined by
| (18) | |||||
| (19) |
The parameters, , , and () are the mass of the hydrogen atom, the critical density, and the primordial mass fraction of hydrogen (helium), respectively. In eq. (19), the parameters of and represent the clumping factor and the case B hydrogen recombination coefficient for the IGM temperature at a mean density, respectively. All of these parameters are determined by physics and cosmology, except for and . The parameter of is closely related to galaxy formation, and estimated by
| (20) | |||||
| (21) |
where and are the ionizing photon escape fraction 191919 Note that this parameter of is different from the escape fraction of Ly photons (eq. 9). and the ionizing photon production efficiency, respectively. The values of , , are the UV-continuum luminosity, the UV-continuum LF, and the UV-continuum LD, respectively (Section 3). The equation (21) assumes no luminosity dependence in the parameters of and .
There are three major parameters for ; i) , ii) , and iii) . i) The LAEs’ contribution to is large at high redshift. As discussed in Section 3, the fraction of LAEs to all galaxies in increases from the local universe towards the EoR . This increase indicates that LAEs’ contribution to cosmic SFRDs increases (Ouchi et al. 2008; Ciardullo et al. 2012). The fraction of the Ly emitting galaxies reaches nearly 50% at (Stark et al. 2011). Because LAEs are abundant and major galaxies at the EoR, ionizing photon emission properties of LAEs are critical to understand sources of cosmic reionization. ii) For the photon production, it is recently claimed that the LAEs’ is higher than other high- galaxy populations. The typical ionizing photon production efficiency of LAEs is , significantly higher than those of LBGs at a given UV magnitude (Harikane et al. 2018). iii) It is suggested that the average ionizing photon escape fraction is also high for LAEs. Deep spectroscopy and NB imaging observations reveal that the average value is % for LAEs at (Shapley et al. 2006; see also Vanzella et al. 2016; de Barros et al. 2016). In other words, a positive correlation between and Ly is suggested (Iwata et al. 2009; Nestor et al. 2013) 202020 Because Ly emission is produced by recombination in hydrogen gas of the ISM that absorbs ionizing photons, strong Ly emission should not be found in galaxies emitting ionizing photons. However, even under this physical picture, model calculations suggest that there is a positive correlation between and Ly in the regime of the moderately low Ly values (Nakajima & Ouchi 2014). . Deep NIR spectroscopy studies find that the line flux ratios of [Oiii]5007 to [Oii]3727, , of LAEs at are large, (Nakajima et al. 2013). Because such galaxies with large values show a high ionizing photon escape fraction, % (Izotov et al. 2016; Vanzella et al. 2016), LAEs are thought to be major emitters of ionizing photons at high redshift. For the physical origin of ionizing photon emission of LAEs, various scenarios including density-bounded nebula are suggested (Nakajima & Ouchi 2014). However, the physical reason of escaping ionizing photons is still under debate.
10 Open Questions and Future Prospects
In observational studies of Ly emission, there are five major questions 212121 In addition to these five major questions, various observational measurements should be refined and revisited. One example is the determination of Ly LFs, where the flux contributions of extended Ly halos are not included in many of previous studies (Herenz et al. 2019). that are listed below.
-
1.
What are dominant sources of Ly photons in LAEs including ELANe, LABs, and LAHs? Are the majority of Ly photons produced in Hii regions of star formation and/or AGN? Are there any major contributions of Ly photons from gravitational cooling? (Section 2)
-
2.
How faint LAEs exist? What is the dark-matter low-mass limit of SFGs that emit Ly? What is the faint-end slope of the Ly LF? (Section 3)
- 3.
-
4.
What are the ionization state of the ISM and CGM of LAEs? Is the density-bounded picture possible in the ISM? Do regular LAEs (that do not include ELANe with an active AGN) have the CGM gas mainly consisting of neutral hydrogen? What makes the observational trend of the high fraction of Lyman-continuum leaking for LAEs that is important for sources of reionization? (Sections 6-7 and 9)
-
5.
Do pop III LAEs exist, as originally predicted by Partridge & Peebles (1967)? If pop III LAEs exist, are they observable at the post EoR (late epoch) and/or the EoR (early epoch) that may or may not have a mechanism allowing the Ly escape from the partly neutral universe? Does the Ly escape from the partly neutral universe depend on reionization topology? (Sections 6 and 9)
There are a number of on-going and next generation instrument projects that are critical for resolving these five questions. Such instruments include those for statistical studies, Subaru/HSC, Prime-Focus Spectrograph (PFS), and HETDEX, high sensitivity observations, VLT/MUSE, and Keck/KCWI (Morrissey et al. 2018), and submm/mm wavelength observations, ALMA. Ly emission studies will be boosted with the next generation large telescopes, James Webb Space Telescope (JWST) and extremely large telescopes (ELTs) by the great sensitivities. Moreover, the Hi 21cm observations with Hydrogen Epoch of Reionization Array (HERA) and Square Kilometre Array (SKA) will complement the Ly emission studies at the EoR (Section 9). Because the future imaging and spectroscopic data such taken with HSC, PFS, and HETDEX are too large to be analyzed by visual inspections for quality assessments, one will need new analysis technique of artificial intelligence that includes machine learning.
In the past two decades, observations have targeted SFGs emitting Ly that are easily detected. Recent studies change the observational targets to diffuse Ly emission around galaxies and fillaments of the large-scale structures that are new observational frontiers. Although Ly emission traces both Hii and Hi gas with a great sensitivity, the origins of the Ly emission cannot be clearly distinguished between, e.g. recombination and resonant scattering. The future observing programs should combine the Ly emission results with the complementary non-resonant hydrogen emission (H and H) and Hi absorption observations (Lee et al. 2014), exploiting the high sensitivity instruments and the next generation large telescopes. Including the 21cm observations at the EoR, future observations will reveal the Hi and Hii gas distribution in the universe in the scales from star-forming regions to the large-scale structures.
11 Summary and Final Thoughts
Since the first discoveries of strong Ly emitting high- galaxies in the late 1990s, Ly emission has been one of the major probes for the high redshift universe. Defining LAEs as galaxies with Ly Å, more than 1,000 (20,000) LAEs are spectroscopically (photometrically) identified to date. Observations suggest that LAEs emerge at high redshift, and the fraction of LAEs to the other galaxies increases (for a given UV-continuum luminosity) towards high redshift up to the EoR (Section 3). LAEs are galaxies of a major population at high redshift. This emergence of LAEs are understood by the increase of Ly escape fraction for high- SFGs.
At high redshift (), a majority of LAEs with a Ly luminosity are low-mass ( and ) galaxies with a star-forming activity ( yr-1; Figure 9). Such typical LAEs are high- analogs of dwarf galaxies having a young dust-poor stellar population with a sub-solar metallicity in the ISM gas, showing a compact disky morphology () with an effective radius of pkpc (Sections 4-6). These physical properties of LAEs can be explained by the nature of the faint continuum (sub ; Section 3). In fact, LAEs follow the size-mass relation and the SFR-mass metallicity relation. LAEs are probably SFGs similar to those of dropout galaxies or LBGs with weak or no Ly emission. In this case, the difference of LAEs from the other galaxies is characterized by the Ly emission duty cycle of % (Section 8) caused by the combination of intermittent star formation and time-dependent Ly escape.
Ly emission is not only observed at the ionized hydrogen clouds by recombination, but also at the neutral hydrogen clouds by resonant scattering. The resonance nature of Ly allows us to probe diffuse gas in the ISM/CGM of a galaxy as well as the IGM. For the ISM, the skewed profiles of galaxy Ly emission suggest the existence of neutral hydrogen gas outflowing from Ly sources (such as star-forming regions) that is explained by the ES model (Sections 2 and 6). For the CGM (Section 7), diffuse Ly emission around an SFG, i.e. LAH, is ubiquitas. Although it is not understood whether the LAH is made by the recombination process of the ionized clouds or the resonant scattering of the neutral clouds, the CGM includes metal at least up to pkpc such identified by the extended carbon emission with a radial profile similar to those of LAHs, indicative that the CGM is metal-enriched by outflow. The LAH extends beyond the virial radius of a galaxy dark-matter halo up to cMpc or more, perhaps originating from filaments in the large-scale structures.
Strong Ly emission is easily detected by observations, being used as a signpost of high- objects. Reports of Ly-emission detection have been made for galaxies up to , to date. The redshift frontier of galaxy observations has entered into the EoR, where Ly is scattered by the partly neutral hydrogen IGM. Large statistics of galaxy Ly emission provides the average amount of Ly scattered by the neutral IGM at the EoR, having revealed the cosmic reionization history, so far, up to the middle point of reionization % at (Section 9). The Ly escape from the partly neutral hydrogen IGM is not only a probe of cosmic reionization, but also a signal of the galaxies and ionized-bubble relation (determined by galaxy clustering, star-formation duty cycle, and galaxy peculiar motions). One critical question about Ly sources is how early epoch, e.g. or , Ly emission can escape (Section 10).
Throughout this review, we have devoted some pages to explain the observational differences of LAEs from the other SFGs emitting weak/no Ly, discussing possible physical origins of the high Ly emissivity of LAEs such characterized by the large Ly and the high . Although the major physical origin of the Ly emissivity difference is an open question as raised in the item 3 of Section 10, we have a physical picture that a column density of Hi gas towards a Ly source (such as star-forming regions) is a key physical quantity that controls the Ly emissivity. For LAEs, the Ly offset velocities are comparable with outflow velocities ( km s-1), and this kinematic property of LAEs can be explained by a small Hi column density producing no significant backscattered Ly photons (Section 6). The high ratios and the existence of the strong high ionization lines suggest that the ISM of LAEs are highly ionized, and this photoionization property of LAEs indicates a small fraction of Hi gas in LAEs (Section 6). There is an anti-correlation between Ly and the Ly spatial offset on the sky, and this Ly morphological property can be explained by the long mean-free path (less resonant scattering) of Ly photons for LAEs with a small Hi column density towards the observer (Section 4). This explanation for the Ly - anti-correlation is consistent with the fact that the Ly halos are small for LAEs whose central part ( pkpc) of Ly luminosity is bright (Section 7). In this way, all of the independent observational properties of kinematics, photoionization, and morphology consistently support the physical picture that a column density of Hi gas is a key physical quantity for the Ly emissivity, and that LAEs are different from the other SFGs emitting weak/no Ly due to the small Hi column density of LAEs. In this physical picture, we would witness SFGs at the galaxy evolutionary phase of the highly-ionized Hi poor state as LAEs, when the SFGs are free from dusty and gaseous starbursts such triggered by gas rich mergers. Because the cosmic average of (i.e. average Ly emissivity) increases from to by two orders of magnitudes (Section 6), in galaxy formation a number of early young galaxies should experience the highly-ionized Hi poor (LAE) phase.
As reviewed in this article, observations of Ly emission have driven various studies of the high-redshift universe for more than two decades. Ly observations have been pioneering the redshift frontier and investigating low-mass high- galaxies. Moreover, recently, Ly observations have attracted attention for studying cosmic structures traced by diffuse neutral and ionized hydrogen gas of the CGM and the IGM, serving as a new observational role. Because the studies of the CGM and the IGM have been (will be) conducted by hydrogen and metal absorption observations (radio low-frequency 21cm observations), forthcoming studies combining these absorption (radio) observations with Ly emission from neutral and ionized hydrogen will open up a new territory of study, cosmic structures and its connection to galaxy formation that are uncovered to date.
ACKNOWLEDGMENTS
We thank Hakim Atek, Sebastiano Cantalupo, Mark Dijikstra, Alex Hagen, Takuya Hashimoto, Ryohei Itoh, Akira Konno, Kirsten Kraiberg Knudsen, Kenji Kubota, Floriane Leclercq, Yuichi Matsuda, Kimihiko Nakajima, Paola Santini, Daniel Schaerer, Dan Stark, Yuma Sugahara, Anne Verhamme, Hidenobu Yajima, and Erik Zackrisson for sharing their data and figures and giving us helpful comments. This publication is based upon work supported by World Premier International Research Center Initiative (WPI Initiative), MEXT, Japan, and KAKENHI (15H02064, 15K17602, 17H01110, 17H01114, and 19K14752) Grant-in-Aid for Scientific Research (A), Young Scientists (B) and Early-Career Scientists through Japan Society for the Promotion of Science.
References
- Adams et al. (2011) Adams JJ, Blanc GA, Hill GJ, Gebhardt K, Drory N, et al. 2011. ApJS 192:5
- Ahn (2004) Ahn SH. 2004. ApJ 601:L25–L28
- Ando et al. (2006) Ando M, Ohta K, Iwata I, Akiyama M, Aoki K, Tamura N. 2006. ApJ 645:L9–L12
- Ao et al. (2017) Ao Y, Matsuda Y, Henkel C, Iono D, Alexand er DM, et al. 2017. The Astrophysical Journal 850:178
- Arrabal Haro et al. (2018) Arrabal Haro P, Rodríguez Espinosa JM, Muñoz-Tuñón C, Pérez-González PG, Dannerbauer H, et al. 2018. MNRAS 478:3740–3755
- Atek et al. (2014) Atek H, Kunth D, Schaerer D, Mas-Hesse JM, Hayes M, et al. 2014. Astronomy and Astrophysics 561:A89
- Bañados et al. (2018) Bañados E, Venemans BP, Mazzucchelli C, Farina EP, Walter F, et al. 2018. Nature 553:473–476
- Bacon et al. (2017) Bacon R, Conseil S, Mary D, Brinchmann J, Shepherd M, et al. 2017. A&A 608:A1
- Bajtlik et al. (1988) Bajtlik S, Duncan RC, Ostriker JP. 1988. ApJ 327:570
- Bardeen et al. (1986) Bardeen JM, Bond JR, Kaiser N, Szalay AS. 1986. ApJ 304:15
- Basu-Zych & Scharf (2004) Basu-Zych A, Scharf C. 2004. ApJ 615:L85–L88
- Blanc et al. (2011) Blanc GA, Adams JJ, Gebhardt K, Hill GJ, Drory N, et al. 2011. ApJ 736:31
- Borisova et al. (2016) Borisova E, Cantalupo S, Lilly SJ, Marino RA, Gallego SG, et al. 2016. ApJ 831:39
- Bouwens et al. (2015) Bouwens RJ, Illingworth GD, Oesch PA, Trenti M, Labbé I, et al. 2015. ApJ 803:34
- Bowler et al. (2017) Bowler RAA, McLure RJ, Dunlop JS, McLeod DJ, Stanway ER, et al. 2017. Monthly Notices of the Royal Astronomical Society 469:448–458
- Cai et al. (2016) Cai Z, Fan X, Peirani S, Bian F, Frye B, et al. 2016. ApJ 833:135
- Cai et al. (2017) Cai Z, Fan X, Yang Y, Bian F, Prochaska JX, et al. 2017. ApJ 837:71
- Cai et al. (2018) Cai Z, Hamden E, Matuszewski M, Prochaska JX, Li Q, et al. 2018. ApJ 861:L3
- Cantalupo et al. (2014) Cantalupo S, Arrigoni-Battaia F, Prochaska JX, Hennawi JF, Madau P. 2014. Nature 506:63–66
- Capak et al. (2015) Capak PL, Carilli C, Jones G, Casey CM, Riechers D, et al. 2015. Nature 522:455–458
- Carniani et al. (2018) Carniani S, Maiolino R, Smit R, Amorín R. 2018. ApJ 854:L7
- Caruana et al. (2018) Caruana J, Wisotzki L, Herenz EC, Kerutt J, Urrutia T, et al. 2018. MNRAS 473:30–37
- Cassata et al. (2015) Cassata P, Tasca LAM, Le Fèvre O, Lemaux BC, Garilli B, et al. 2015. A&A 573:A24
- Chanchaiworawit et al. (2017) Chanchaiworawit K, Guzm¥’an R, Rodr¥’¥iguez Espinosa JM, Castro-Rodr¥’¥iguez N, Salvador-Sol¥’e E, et al. 2017. ¥mnras 469:2646–2661
- Chanchaiworawit et al. (2019) Chanchaiworawit K, Guzm¥’an R, Salvador-Sol¥’e E, Rodr¥’¥iguez Espinosa JM, Calvi R, et al. 2019. ¥apj 877:51
- Chiang et al. (2013) Chiang YK, Overzier R, Gebhardt K. 2013. ApJ 779:127
- Ciardullo et al. (2012) Ciardullo R, Gronwall C, Wolf C, McCathran E, Bond NA, et al. 2012. ApJ 744:110
- Cooray & Sheth (2002) Cooray A, Sheth R. 2002. Phys. Rep. 372:1–129
- Cornachione et al. (2018) Cornachione MA, Bolton AS, Shu Y, Zheng Z, Montero-Dorta AD, et al. 2018. ApJ 853:148
- Cowie et al. (2010) Cowie LL, Barger AJ, Hu EM. 2010. ApJ 711:928–958
- Cowie et al. (2011) Cowie LL, Barger AJ, Hu EM. 2011. ApJ 738:136
- Cowie & Hu (1998) Cowie LL, Hu EM. 1998. AJ 115:1319–1328
- Croft et al. (2018) Croft RAC, Miralda-Escudé J, Zheng Z, Blomqvist M, Pieri M. 2018. MNRAS 481:1320–1336
- Curtis-Lake et al. (2012) Curtis-Lake E, McLure RJ, Pearce HJ, Dunlop JS, Cirasuolo M, et al. 2012. MNRAS 422:1425–1435
- De Barros et al. (2017) De Barros S, Pentericci L, Vanzella E, Castellano M, Fontana A, et al. 2017. A&A 608:A123
- de Barros et al. (2016) de Barros S, Vanzella E, Amorín R, Castellano M, Siana B, et al. 2016. A&A 585:A51
- Deharveng et al. (2008) Deharveng JM, Small T, Barlow TA, Péroux C, Milliard B, et al. 2008. ApJ 680:1072–1082
- Dey et al. (2016) Dey A, Lee KS, Reddy N, Cooper M, Inami H, et al. 2016. ¥apj 823:11
- Dijkstra (2017) Dijkstra M. 2017. arXiv e-prints :arXiv:1704.03416
- Dijkstra et al. (2007) Dijkstra M, Lidz A, Wyithe JSB. 2007. MNRAS 377:1175–1186
- Dijkstra & Loeb (2008) Dijkstra M, Loeb A. 2008. MNRAS 386:492–504
- Dijkstra & Loeb (2009) Dijkstra M, Loeb A. 2009. MNRAS 400:1109–1120
- Drake et al. (2017) Drake AB, Garel T, Wisotzki L, Leclercq F, Hashimoto T, et al. 2017. A&A 608:A6
- Duval et al. (2014) Duval F, Schaerer D, Östlin G, Laursen P. 2014. A&A 562:A52
- Erb et al. (2014) Erb DK, Steidel CC, Trainor RF, Bogosavljević M, Shapley AE, et al. 2014. ApJ 795:33
- Fan et al. (2006) Fan X, Strauss MA, Becker RH, White RL, Gunn JE, et al. 2006. AJ 132:117–136
- Fardal et al. (2001) Fardal MA, Katz N, Gardner JP, Hernquist L, Weinberg DH, Davé R. 2001. ApJ 562:605–617
- Finkelstein et al. (2011) Finkelstein SL, Hill GJ, Gebhardt K, Adams J, Blanc GA, et al. 2011. ApJ 729:140
- Finkelstein et al. (2013) Finkelstein SL, Papovich C, Dickinson M, Song M, Tilvi V, et al. 2013. Nature 502:524–527
- Fujimoto et al. (2019) Fujimoto S, Ouchi M, Ferrara A, Pallottini A, Ivison RJ, et al. 2019. arXiv e-prints :arXiv:1902.06760
- Furlanetto et al. (2006) Furlanetto SR, Zaldarriaga M, Hernquist L. 2006. MNRAS 365:1012–1020
- Gawiser et al. (2007) Gawiser E, Francke H, Lai K, Schawinski K, Gronwall C, et al. 2007. ApJ 671:278–284
- Geach et al. (2009) Geach JE, Alexander DM, Lehmer BD, Smail I, Matsuda Y, et al. 2009. ApJ 700:1–9
- Gnedin & Prada (2004) Gnedin NY, Prada F. 2004. ApJ 608:L77–L80
- Goerdt et al. (2010) Goerdt T, Dekel A, Sternberg A, Ceverino D, Teyssier R, Primack JR. 2010. MNRAS 407:613–631
- Gronwall et al. (2011) Gronwall C, Bond NA, Ciardullo R, Gawiser E, Altmann M, et al. 2011. ApJ 743:9
- Guaita et al. (2013) Guaita L, Francke H, Gawiser E, Bauer FE, Hayes M, et al. 2013. A&A 551:A93
- Hagen et al. (2014) Hagen A, Ciardullo R, Gronwall C, Acquaviva V, Bridge J, et al. 2014. ApJ 786:59
- Hagen et al. (2016) Hagen A, Zeimann GR, Behrens C, Ciardullo R, Grasshorn Gebhardt HS, et al. 2016. ApJ 817:79
- Harikane et al. (2019a) Harikane Y, Ouchi M, Inoue AK, Matsuoka Y, Tamura Y, et al. 2019a. arXiv e-prints :arXiv:1910.10927
- Harikane et al. (2019b) Harikane Y, Ouchi M, Ono Y, Fujimoto S, Donevski D, et al. 2019b. arXiv e-prints :arXiv:1902.09555
- Harikane et al. (2018) Harikane Y, Ouchi M, Shibuya T, Kojima T, Zhang H, et al. 2018. ApJ 859:84
- Harrington (1973) Harrington JP. 1973. MNRAS 162:43
- Hashimoto et al. (2017) Hashimoto T, Garel T, Guiderdoni B, Drake AB, Bacon R, et al. 2017. A&A 608:A10
- Hashimoto et al. (2018) Hashimoto T, Laporte N, Mawatari K, Ellis RS, Inoue AK, et al. 2018. Nature 557:392–395
- Hashimoto et al. (2013) Hashimoto T, Ouchi M, Shimasaku K, Ono Y, Nakajima K, et al. 2013. ApJ 765:70
- Hashimoto et al. (2015) Hashimoto T, Verhamme A, Ouchi M, Shimasaku K, Schaerer D, et al. 2015. ApJ 812:157
- Hayashino et al. (2004) Hayashino T, Matsuda Y, Tamura H, Yamauchi R, Yamada T, et al. 2004. AJ 128:2073–2079
- Hayes et al. (2010) Hayes M, Östlin G, Schaerer D, Mas-Hesse JM, Leitherer C, et al. 2010. Nature 464:562–565
- Hayes et al. (2011) Hayes M, Schaerer D, Östlin G, Mas-Hesse JM, Atek H, Kunth D. 2011. ApJ 730:8
- Hennawi et al. (2015) Hennawi JF, Prochaska JX, Cantalupo S, Arrigoni-Battaia F. 2015. Science 348:779–783
- Henry et al. (2015) Henry A, Scarlata C, Martin CL, Erb D. 2015. ApJ 809:19
- Herenz et al. (2019) Herenz EC, Wisotzki L, Saust R, Kerutt J, Urrutia T, et al. 2019. A&A 621:A107
- Higuchi et al. (2019) Higuchi R, Ouchi M, Ono Y, Shibuya T, Toshikawa J, et al. 2019. ApJ 879:28
- Hill et al. (2008) Hill GJ, Gebhardt K, Komatsu E, Drory N, MacQueen PJ, et al. 2008. The Hobby-Eberly Telescope Dark Energy Experiment (HETDEX): Description and Early Pilot Survey Results. In Panoramic Views of Galaxy Formation and Evolution, eds. T Kodama, T Yamada, K Aoki, vol. 399 of Astronomical Society of the Pacific Conference Series
- Hoag et al. (2018) Hoag A, Bradač M, Brammer G, Huang KH, Treu T, et al. 2018. ApJ 854:39
- Hoag et al. (2017) Hoag A, Bradač M, Trenti M, Treu T, Schmidt KB, et al. 2017. Nature Astronomy 1:0091
- Hoag et al. (2019) Hoag A, Bradač M, Huang K, Mason C, Treu T, et al. 2019. ApJ 878:12
- Hu & McMahon (1996) Hu EM, McMahon RG. 1996. Nature 382:231–233
- Hu et al. (2019) Hu W, Wang J, Zheng ZY, Malhotra S, Rhoads JE, et al. 2019. arXiv e-prints :arXiv:1903.09046
- Hutter et al. (2018) Hutter A, Trott CM, Dayal P. 2018. MNRAS 479:L129–L133
- Inoue et al. (2016) Inoue AK, Tamura Y, Matsuo H, Mawatari K, Shimizu I, et al. 2016. Science 352:1559–1562
- Ishigaki et al. (2018) Ishigaki M, Kawamata R, Ouchi M, Oguri M, Shimasaku K, Ono Y. 2018. ApJ 854:73
- Itoh et al. (2018) Itoh R, Ouchi M, Zhang H, Inoue AK, Mawatari K, et al. 2018. ApJ 867:46
- Iwata et al. (2009) Iwata I, Inoue AK, Matsuda Y, Furusawa H, Hayashino T, et al. 2009. ApJ 692:1287–1293
- Izotov et al. (2016) Izotov YI, Schaerer D, Thuan TX, Worseck G, Guseva NG, et al. 2016. MNRAS 461:3683–3701
- Jaskot & Oey (2014) Jaskot AE, Oey MS. 2014. The Astrophysical Journal 791:L19
- Jeeson-Daniel et al. (2012) Jeeson-Daniel A, Ciardi B, Maio U, Pierleoni M, Dijkstra M, Maselli A. 2012. MNRAS 424:2193–2212
- Jelić et al. (2014) Jelić V, de Bruyn AG, Mevius M, Abdalla FB, Asad KMB, et al. 2014. A&A 568:A101
- Jiang et al. (2013) Jiang L, Egami E, Fan X, Windhorst RA, Cohen SH, et al. 2013. ApJ 773:153
- Jiang et al. (2018) Jiang L, Wu J, Bian F, Chiang YK, Ho LC, et al. 2018. Nature Astronomy 2:962–966
- Jones et al. (2013) Jones TA, Ellis RS, Schenker MA, Stark DP. 2013. ApJ 779:52
- Jung et al. (2019) Jung I, Finkelstein SL, Dickinson M, Hutchison TA, Larson RL, et al. 2019. ApJ 877:146
- Kakuma et al. (2019) Kakuma R, Ouchi M, Harikane Y, Inoue AK, Komiyama Y, et al. 2019. arXiv e-prints :arXiv:1906.00173
- Kashikawa et al. (2011) Kashikawa N, Shimasaku K, Matsuda Y, Egami E, Jiang L, et al. 2011. ApJ 734:119
- Kennicutt (1998) Kennicutt Robert C. J. 1998. ARA&A 36:189–232
- Kikuta et al. (2019) Kikuta S, Matsuda Y, Cen R, Steidel CC, Yagi M, et al. 2019. PASJ 71:L2
- Knudsen et al. (2016) Knudsen KK, Richard J, Kneib JP, Jauzac M, Clément B, et al. 2016. MNRAS 462:L6–L10
- Kojima et al. (2017) Kojima T, Ouchi M, Nakajima K, Shibuya T, Harikane Y, Ono Y. 2017. PASJ 69:44
- Konno et al. (2016) Konno A, Ouchi M, Nakajima K, Duval F, Kusakabe H, et al. 2016. ApJ 823:20
- Konno et al. (2014) Konno A, Ouchi M, Ono Y, Shimasaku K, Shibuya T, et al. 2014. ApJ 797:16
- Konno et al. (2018) Konno A, Ouchi M, Shibuya T, Ono Y, Shimasaku K, et al. 2018. PASJ 70:S16
- Kubota et al. (2018) Kubota K, Yoshiura S, Takahashi K, Hasegawa K, Yajima H, et al. 2018. MNRAS 479:2754–2766
- Kusakabe et al. (2020) Kusakabe H, Blaizot J, Garel T, Verhamme A, Bacon R, et al. 2020. A&A 638:A12
- Kusakabe et al. (2015) Kusakabe H, Shimasaku K, Nakajima K, Ouchi M. 2015. ApJ 800:L29
- Kusakabe et al. (2018) Kusakabe H, Shimasaku K, Ouchi M, Nakajima K, Goto R, et al. 2018. PASJ 70:4
- Lai et al. (2008) Lai K, Huang JS, Fazio G, Gawiser E, Ciardullo R, et al. 2008. ApJ 674:70–74
- Lake et al. (2015) Lake E, Zheng Z, Cen R, Sadoun R, Momose R, Ouchi M. 2015. ApJ 806:46
- Laporte et al. (2017) Laporte N, Ellis RS, Boone F, Bauer FE, Quénard D, et al. 2017. ApJ 837:L21
- Larson et al. (2018) Larson RL, Finkelstein SL, Pirzkal N, Ryan R, Tilvi V, et al. 2018. ApJ 858:94
- Laursen (2010) Laursen P. 2010. Interpreting Lyman radiation from young, dusty galaxies. Ph.D. thesis, Dark Cosmology Centre, Niels Bohr Institute Faculty of Science, University of Copenhagen
- Laursen et al. (2013) Laursen P, Duval F, Östlin G. 2013. ApJ 766:124
- Leclercq et al. (2017) Leclercq F, Bacon R, Wisotzki L, Mitchell P, Garel T, et al. 2017. A&A 608:A8
- Lee et al. (2014) Lee KG, Hennawi JF, Stark C, Prochaska JX, White M, et al. 2014. ApJ 795:L12
- Leibler et al. (2018) Leibler CN, Cantalupo S, Holden BP, Madau P. 2018. MNRAS 480:2094–2108
- Lemaux et al. (2014) Lemaux BC, Cucciati O, Tasca LAM, Le F¥‘evre O, Zamorani G, et al. 2014. ¥aap 572:A41
- Lidz et al. (2009) Lidz A, Zahn O, Furlanetto SR, McQuinn M, Hernquist L, Zaldarriaga M. 2009. ApJ 690:252–266
- Liu et al. (2016) Liu C, Mutch SJ, Angel PW, Duffy AR, Geil PM, et al. 2016. MNRAS 462:235–249
- Madau et al. (1999) Madau P, Haardt F, Rees MJ. 1999. ApJ 514:648–659
- Malhotra & Rhoads (2002) Malhotra S, Rhoads JE. 2002. The Astrophysical Journal 565:L71–L74
- Malhotra & Rhoads (2004) Malhotra S, Rhoads JE. 2004. ApJ 617:L5–L8
- Malhotra et al. (2012) Malhotra S, Rhoads JE, Finkelstein SL, Hathi N, Nilsson K, et al. 2012. ApJ 750:L36
- Mallery et al. (2012) Mallery RP, Mobasher B, Capak P, Kakazu Y, Masters D, et al. 2012. ApJ 760:128
- Marlowe et al. (1995) Marlowe AT, Heckman TM, Wyse RFG, Schommer R. 1995. ApJ 438:563
- Mason et al. (2019) Mason CA, Fontana A, Treu T, Schmidt KB, Hoag A, et al. 2019. MNRAS 485:3947–3969
- Matsuda et al. (2004) Matsuda Y, Yamada T, Hayashino T, Tamura H, Yamauchi R, et al. 2004. AJ 128:569–584
- Matsuda et al. (2005) Matsuda Y, Yamada T, Hayashino T, Tamura H, Yamauchi R, et al. 2005. ¥apjl 634:L125–L128
- Matsuda et al. (2011) Matsuda Y, Yamada T, Hayashino T, Yamauchi R, Nakamura Y, et al. 2011. MNRAS 410:L13–L17
- Matsuda et al. (2012) Matsuda Y, Yamada T, Hayashino T, Yamauchi R, Nakamura Y, et al. 2012. MNRAS 425:878–883
- Matthee et al. (2015) Matthee J, Sobral D, Santos S, Röttgering H, Darvish B, Mobasher B. 2015. MNRAS 451:400–417
- McCarthy et al. (1987) McCarthy PJ, Spinrad H, Djorgovski S, Strauss MA, van Breugel W, Liebert J. 1987. ApJ 319:L39
- McLinden et al. (2011) McLinden EM, Finkelstein SL, Rhoads JE, Malhotra S, Hibon P, et al. 2011. ApJ 730:136
- McQuinn et al. (2007) McQuinn M, Hernquist L, Zaldarriaga M, Dutta S. 2007. MNRAS 381:75–96
- McQuinn et al. (2008) McQuinn M, Lidz A, Zaldarriaga M, Hernquist L, Dutta S. 2008. MNRAS 388:1101–1110
- Miley et al. (2004) Miley GK, Overzier RA, Tsvetanov ZI, Bouwens RJ, Ben¥’¥itez N, et al. 2004. ¥nat 427:47–50
- Miller et al. (2018) Miller TB, Chapman SC, Aravena M, Ashby MLN, Hayward CC, et al. 2018. ¥nat 556:469–472
- Momose et al. (2014) Momose R, Ouchi M, Nakajima K, Ono Y, Shibuya T, et al. 2014. MNRAS 442:110–120
- Momose et al. (2016) Momose R, Ouchi M, Nakajima K, Ono Y, Shibuya T, et al. 2016. MNRAS 457:2318–2330
- Morrissey et al. (2018) Morrissey P, Matuszewski M, Martin DC, Neill JD, Epps H, et al. 2018. ApJ 864:93
- Nagamine et al. (2010) Nagamine K, Ouchi M, Springel V, Hernquist L. 2010. PASJ 62:1455
- Nakajima et al. (2016) Nakajima K, Ellis RS, Iwata I, Inoue AK, Kusakabe H, et al. 2016. ApJ 831:L9
- Nakajima et al. (2018) Nakajima K, Fletcher T, Ellis RS, Robertson BE, Iwata I. 2018. MNRAS 477:2098–2111
- Nakajima & Ouchi (2014) Nakajima K, Ouchi M. 2014. MNRAS 442:900–916
- Nakajima et al. (2013) Nakajima K, Ouchi M, Shimasaku K, Hashimoto T, Ono Y, Lee JC. 2013. ApJ 769:3
- Nakajima et al. (2012) Nakajima K, Ouchi M, Shimasaku K, Ono Y, Lee JC, et al. 2012. ApJ 745:12
- Nestor et al. (2013) Nestor DB, Shapley AE, Kornei KA, Steidel CC, Siana B. 2013. ApJ 765:47
- Neufeld (1991) Neufeld DA. 1991. ApJ 370:L85
- Oesch et al. (2016) Oesch PA, Brammer G, van Dokkum PG, Illingworth GD, Bouwens RJ, et al. 2016. ApJ 819:129
- Oesch et al. (2015) Oesch PA, van Dokkum PG, Illingworth GD, Bouwens RJ, Momcheva I, et al. 2015. ApJ 804:L30
- Ono et al. (2012) Ono Y, Ouchi M, Mobasher B, Dickinson M, Penner K, et al. 2012. ApJ 744:83
- Ono et al. (2010a) Ono Y, Ouchi M, Shimasaku K, Akiyama M, Dunlop J, et al. 2010a. MNRAS 402:1580–1598
- Ono et al. (2010b) Ono Y, Ouchi M, Shimasaku K, Dunlop J, Farrah D, et al. 2010b. ApJ 724:1524–1535
- Östlin et al. (2014) Östlin G, Hayes M, Duval F, Sand berg A, Rivera-Thorsen T, et al. 2014. ApJ 797:11
- Oteo et al. (2018) Oteo I, Ivison RJ, Dunne L, Manilla-Robles A, Maddox S, et al. 2018. ¥apj 856:72
- Ouchi (2019) Ouchi M. 2019. Saas-Fee Advanced Course 46:189
- Ouchi et al. (2013) Ouchi M, Ellis R, Ono Y, Nakanishi K, Kohno K, et al. 2013. ApJ 778:102
- Ouchi et al. (2018) Ouchi M, Harikane Y, Shibuya T, Shimasaku K, Taniguchi Y, et al. 2018. PASJ 70:S13
- Ouchi et al. (2009) Ouchi M, Ono Y, Egami E, Saito T, Oguri M, et al. 2009. ApJ 696:1164–1175
- Ouchi et al. (2005a) Ouchi M, Shimasaku K, Akiyama M, Sekiguchi K, Furusawa H, et al. 2005a. ApJ 620:L1–L4
- Ouchi et al. (2005b) Ouchi M, Shimasaku K, Akiyama M, Sekiguchi K, Furusawa H, et al. 2005b. ApJ 620:L1–L4
- Ouchi et al. (2008) Ouchi M, Shimasaku K, Akiyama M, Simpson C, Saito T, et al. 2008. ApJS 176:301–330
- Ouchi et al. (2003) Ouchi M, Shimasaku K, Furusawa H, Miyazaki M, Doi M, et al. 2003. ApJ 582:60–68
- Ouchi et al. (2010) Ouchi M, Shimasaku K, Furusawa H, Saito T, Yoshida M, et al. 2010. ApJ 723:869–894
- Overzier et al. (2008) Overzier RA, Bouwens RJ, Cross NJG, Venemans BP, Miley GK, et al. 2008. ¥apj 673:143–162
- Partridge & Peebles (1967) Partridge RB, Peebles PJE. 1967. ApJ 147:868
- Pascarelle et al. (1996) Pascarelle SM, Windhorst RA, Keel WC, Odewahn SC. 1996. Nature 383:45–50
- Paulino-Afonso et al. (2018) Paulino-Afonso A, Sobral D, Ribeiro B, Matthee J, Santos S, et al. 2018. MNRAS 476:5479–5501
- Pentericci et al. (2011) Pentericci L, Fontana A, Vanzella E, Castellano M, Grazian A, et al. 2011. ApJ 743:132
- Pentericci et al. (2018) Pentericci L, Vanzella E, Castellano M, Fontana A, De Barros S, et al. 2018. A&A 619:A147
- Prescott et al. (2009) Prescott MKM, Dey A, Jannuzi BT. 2009. ApJ 702:554–566
- Prescott et al. (2015) Prescott MKM, Martin CL, Dey A. 2015. ApJ 799:62
- Reddy & Steidel (2009) Reddy NA, Steidel CC. 2009. ApJ 692:778–803
- Rhoads et al. (2000) Rhoads JE, Malhotra S, Dey A, Stern D, Spinrad H, Jannuzi BT. 2000. ApJ 545:L85–L88
- Ritondale et al. (2019) Ritondale E, Auger MW, Vegetti S, McKean JP. 2019. MNRAS 482:4744–4762
- Roberts-Borsani et al. (2016) Roberts-Borsani GW, Bouwens RJ, Oesch PA, Labbe I, Smit R, et al. 2016. ApJ 823:143
- Robertson et al. (2015) Robertson BE, Ellis RS, Furlanetto SR, Dunlop JS. 2015. ApJ 802:L19
- Santini et al. (2017) Santini P, Fontana A, Castellano M, Di Criscienzo M, Merlin E, et al. 2017. ApJ 847:76
- Schaerer (2003) Schaerer D. 2003. A&A 397:527–538
- Schaerer & de Barros (2009) Schaerer D, de Barros S. 2009. A&A 502:423–426
- Schechter (1976) Schechter P. 1976. ApJ 203:297–306
- Schenker et al. (2014) Schenker MA, Ellis RS, Konidaris NP, Stark DP. 2014. ApJ 795:20
- Shapley et al. (2006) Shapley AE, Steidel CC, Pettini M, Adelberger KL, Erb DK. 2006. ApJ 651:688–703
- Shi et al. (2019) Shi K, Huang Y, Lee KS, Toshikawa J, Bowen KN, et al. 2019. ¥apj 879:9
- Shibuya et al. (2012) Shibuya T, Kashikawa N, Ota K, Iye M, Ouchi M, et al. 2012. ApJ 752:114
- Shibuya et al. (2015) Shibuya T, Ouchi M, Harikane Y. 2015. ApJS 219:15
- Shibuya et al. (2019) Shibuya T, Ouchi M, Harikane Y, Nakajima K. 2019. ApJ 871:164
- Shibuya et al. (2018a) Shibuya T, Ouchi M, Harikane Y, Rauch M, Ono Y, et al. 2018a. PASJ 70:S15
- Shibuya et al. (2018b) Shibuya T, Ouchi M, Konno A, Higuchi R, Harikane Y, et al. 2018b. PASJ 70:S14
- Shibuya et al. (2016) Shibuya T, Ouchi M, Kubo M, Harikane Y. 2016. ApJ 821:72
- Shibuya et al. (2014a) Shibuya T, Ouchi M, Nakajima K, Hashimoto T, Ono Y, et al. 2014a. ApJ 788:74
- Shibuya et al. (2014b) Shibuya T, Ouchi M, Nakajima K, Yuma S, Hashimoto T, et al. 2014b. ApJ 785:64
- Sobacchi & Mesinger (2015) Sobacchi E, Mesinger A. 2015. MNRAS 453:1843–1854
- Sobral et al. (2015) Sobral D, Matthee J, Darvish B, Schaerer D, Mobasher B, et al. 2015. ApJ 808:139
- Sobral et al. (2018) Sobral D, Santos S, Matthee J, Paulino-Afonso A, Ribeiro B, et al. 2018. MNRAS 476:4725–4752
- Song et al. (2016) Song M, Finkelstein SL, Livermore RC, Capak PL, Dickinson M, Fontana A. 2016. ApJ 826:113
- Speagle et al. (2014) Speagle JS, Steinhardt CL, Capak PL, Silverman JD. 2014. ApJS 214:15
- Stark et al. (2017) Stark DP, Ellis RS, Charlot S, Chevallard J, Tang M, et al. 2017. MNRAS 464:469–479
- Stark et al. (2010) Stark DP, Ellis RS, Chiu K, Ouchi M, Bunker A. 2010. MNRAS 408:1628–1648
- Stark et al. (2011) Stark DP, Ellis RS, Ouchi M. 2011. ApJ 728:L2
- Stark et al. (2014) Stark DP, Richard J, Siana B, Charlot S, Freeman WR, et al. 2014. Monthly Notices of the Royal Astronomical Society 445:3200–3220
- Steidel et al. (1999) Steidel CC, Adelberger KL, Giavalisco M, Dickinson M, Pettini M. 1999. ApJ 519:1–17
- Steidel et al. (2000) Steidel CC, Adelberger KL, Shapley AE, Pettini M, Dickinson M, Giavalisco M. 2000. ¥apj 532:170–182
- Steidel et al. (2011) Steidel CC, Bogosavljević M, Shapley AE, Kollmeier JA, Reddy NA, et al. 2011. ApJ 736:160
- Steidel et al. (2010) Steidel CC, Erb DK, Shapley AE, Pettini M, Reddy N, et al. 2010. ApJ 717:289–322
- Steidel et al. (2014) Steidel CC, Rudie GC, Strom AL, Pettini M, Reddy NA, et al. 2014. The Astrophysical Journal 795:165
- Storey & Zeippen (2000) Storey PJ, Zeippen CJ. 2000. MNRAS 312:813–816
- Sugahara et al. (2019) Sugahara Y, Ouchi M, Harikane Y, Bouché N, Mitchell PD, Blaizot J. 2019. arXiv e-prints :arXiv:1904.03106
- Tamura et al. (2019) Tamura Y, Mawatari K, Hashimoto T, Inoue AK, Zackrisson E, et al. 2019. ApJ 874:27
- Taniguchi et al. (2009) Taniguchi Y, Murayama T, Scoville NZ, Sasaki SS, Nagao T, et al. 2009. ApJ 701:915–944
- Tilvi et al. (2014) Tilvi V, Papovich C, Finkelstein SL, Long J, Song M, et al. 2014. ApJ 794:5
- Toshikawa et al. (2016) Toshikawa J, Kashikawa N, Overzier R, Malkan MA, Furusawa H, et al. 2016. ¥apj 826:114
- Toshikawa et al. (2014) Toshikawa J, Kashikawa N, Overzier R, Shibuya T, Ishikawa S, et al. 2014. ¥apj 792:15
- Totani et al. (2016) Totani T, Aoki K, Hattori T, Kawai N. 2016. PASJ 68:15
- Totsuji & Kihara (1969) Totsuji H, Kihara T. 1969. PASJ 21:221
- Trainor et al. (2016) Trainor RF, Strom AL, Steidel CC, Rudie GC. 2016. ApJ 832:171
- Trebitsch et al. (2016) Trebitsch M, Verhamme A, Blaizot J, Rosdahl J. 2016. A&A 593:A122
- Treu et al. (2013) Treu T, Schmidt KB, Trenti M, Bradley LD, Stiavelli M. 2013. ApJ 775:L29
- Umehata et al. (2018) Umehata H, Hatsukade B, Smail I, Alexand er DM, Ivison RJ, et al. 2018. ¥pasj 70:65
- van Ojik et al. (1997) van Ojik R, Roettgering HJA, Miley GK, Hunstead RW. 1997. A&A 317:358–384
- Vanzella et al. (2016) Vanzella E, de Barros S, Vasei K, Alavi A, Giavalisco M, et al. 2016. ApJ 825:41
- Vargas et al. (2014) Vargas CJ, Bish H, Acquaviva V, Gawiser E, Finkelstein SL, et al. 2014. ApJ 783:26
- Venemans et al. (2007) Venemans BP, R¥”ottgering HJA, Miley GK, van Breugel WJM, de Breuck C, et al. 2007. ¥aap 461:823–845
- Verhamme et al. (2012) Verhamme A, Dubois Y, Blaizot J, Garel T, Bacon R, et al. 2012. A&A 546:A111
- Verhamme et al. (2006) Verhamme A, Schaerer D, Maselli A. 2006. A&A 460:397–413
- Wardlow et al. (2014) Wardlow JL, Malhotra S, Zheng Z, Finkelstein S, Bock J, et al. 2014. ApJ 787:9
- Weinberger et al. (2019) Weinberger LH, Haehnelt MG, Kulkarni G. 2019. MNRAS 485:1350–1366
- Wisotzki et al. (2016) Wisotzki L, Bacon R, Blaizot J, Brinchmann J, Herenz EC, et al. 2016. A&A 587:A98
- Wisotzki et al. (2018) Wisotzki L, Bacon R, Brinchmann J, Cantalupo S, Richter P, et al. 2018. Nature 562:229–232
- Xue et al. (2017) Xue R, Lee KS, Dey A, Reddy N, Hong S, et al. 2017. ApJ 837:172
- Yajima et al. (2012) Yajima H, Li Y, Zhu Q, Abel T, Gronwall C, Ciardullo R. 2012. ApJ 754:118
- Yamada et al. (2012a) Yamada T, Matsuda Y, Kousai K, Hayashino T, Morimoto N, Umemura M. 2012a. ¥apj 751:29
- Yamada et al. (2012b) Yamada T, Nakamura Y, Matsuda Y, Hayashino T, Yamauchi R, et al. 2012b. AJ 143:79
- Yang et al. (2010) Yang Y, Zabludoff A, Eisenstein D, Davé R. 2010. ApJ 719:1654–1671
- Yang et al. (2014) Yang Y, Zabludoff A, Jahnke K, Davé R. 2014. The Astrophysical Journal 793:114
- Zackrisson et al. (2013) Zackrisson E, Inoue AK, Jensen H. 2013. ApJ 777:39
- Zhang et al. (2019) Zhang H, Ouchi M, Itoh R, Shibuya T, Ono Y, et al. 2019. arXiv e-prints :arXiv:1905.09841
- Zheng & Wallace (2014) Zheng Z, Wallace J. 2014. ApJ 794:116
- Zheng et al. (2017) Zheng ZY, Wang J, Rhoads J, Infante L, Malhotra S, et al. 2017. ApJ 842:L22
- Zirm et al. (2005) Zirm AW, Overzier RA, Miley GK, Blakeslee JP, Clampin M, et al. 2005. ¥apj 630:68–81
- Zitrin et al. (2015) Zitrin A, Labbé I, Belli S, Bouwens R, Ellis RS, et al. 2015. ApJ 810:L12