The First Extensive Exploration of UV-bright Stars in the Globular Cluster NGC 2808
Abstract
In this study, we identified and characterized the hot and luminous UV-bright stars in the globular cluster NGC 2808. We combined data from the Ultra Violet Imaging Telescope (UVIT) on-board the Indian space satellite, AstroSat, with the Hubble Space Telescope UV Globular Cluster Survey (HUGS) data for the central region (within ) and Gaia and ground-based optical photometry for the outer parts of the cluster. We constructed the UV and UV-optical color-magnitude diagrams, compared the horizontal branch (HB) members with the theoretical zero-age HB and terminal-age HB models and identified 34 UV-bright stars. The spectral energy distributions of the UV-bright stars were fitted with theoretical models to estimate their effective temperatures (12500 K - 100,000 K), radii (0.13 to 2.2 ), and luminosities ( to ) for the first time. These stars were then placed on the H-R diagram, along with theoretical post-HB (pHB) evolutionary tracks to assess their evolutionary status. The models suggest that most of these stars are in the AGB-manqué phase and all, except three, have evolutionary masses 0.53 . We also calculated the theoretically expected number of hot post-(early)-AGB (p(e)AGB) stars in this cluster and found the range to match our observations. Seven UV-bright stars located in the outer region of the cluster, identified from the AstroSat/UVIT images, are ideal candidates for detailed follow-up spectroscopic studies.
1 Introduction
Globular clusters (GCs) are ideal astrophysical laboratories to test the theories of stellar evolution, especially the late evolutionary stages of low mass stars. According to canonical stellar evolution models, the post-helium-core-burning (pHeCB) or post-horizontal branch (pHB) evolution of a star depends strongly on its envelope mass (Dorman et al., 1993, 1995). After the depletion of helium (He) in the core, horizontal branch (HB) stars with the highest envelope masses enter the asymptotic giant branch (AGB) phase, undergo thermal pulsations, and end up losing their envelopes to become extremely hot stars with constant luminosity. Known as post-AGB (pAGB) stars, these are short-lived (lifetime years) with luminosity, . The HB stars with slightly lower envelope masses ( ) ascend the AGB but do not undergo thermal pulsations in this phase. They eventually lose their envelopes and evolve towards higher temperatures with slightly lower luminosities ( 2.65 to 3.1) than the pAGB stars. These are known as post-early-AGB (peAGB) stars (Brocato et al., 1990) and have a lifetime of years. After core-He exhaustion, HB stars with the lowest envelope masses cannot ascend the AGB and hence directly evolve towards the white dwarf cooling curve with a slight enhancement in luminosity and are referred to as AGB-manqué stars (Greggio & Renzini, 1990). The range of their luminosities is 1.8 to 2.65, with lifetimes of 20 to 40 Myr (Moehler et al., 2019). These late phases of low-mass stellar evolution are the least understood owing to uncertainties in the C/O core size (Charpinet et al., 2011; Constantino et al., 2015) and stellar winds in the red giant branch (RGB) phase which determine the envelope mass of HB stars (McDonald & Zijlstra, 2015; Salaris et al., 2016). Due to the lack of detections of stars in these quickly evolving stages, the existing pHB models have not been tested extensively and have scope for improvement.
A few pHeCB stars in various evolutionary stages are found in the ultraviolet (UV) images of GCs as highly prominent, luminous stars. Referred to as UV-bright stars (Zinn et al., 1972), these are observed to be brighter than the horizontal branch (HB) stars by one magnitude or more in the Far-UV (FUV) with FUVNear UV (NUV) color 0.7 mag (Schiavon et al., 2012). Originally, these were defined as stars brighter than the HB and bluer than the RGB. They were looked for as stars whose U-band magnitudes were brighter than that of any other star in the GC (e.g., Zinn et al. (1972)). Since these searches were based on optical observations, they were biased towards the most luminous pAGB stars and were unable to detect the less luminous peAGB and AGB-manqué stars (Moehler, 2001). Moreover, most of the stars detected were cooler than 30,000 K although there were theoretical predictions of even hotter pAGB stars. The crowded cores of GCs posed yet another difficulty for ground-based optical observations.
The space missions, with capability to obtain images in the UV, opened a whole new arena for the study of hot stars in GCs. The cooler stellar populations such as main sequence (MS) and RGB stars are suppressed in the UV wavelengths, which helps to produce images with reduced stellar crowding in the central regions. UV-bright stars along with the hot extreme HB (EHB) stars contribute significantly to the UV luminosity of old stellar systems like GCs (Greggio & Renzini, 1990, 1999; O’Connell, 1999). Hence, these stars are speculated to be the reason for the UV-upturn phenomenon in elliptical galaxies (Greggio & Renzini, 1990, 1999; Dorman et al., 1995; Brown et al., 1997, 2000). UV study rather than optical is thus critical to perform an accurate evaluation of the contribution of hot stars in late evolutionary stages to the UV luminosity of old systems. For a detailed review of hot stars in GCs, see Moehler (2001, 2010). Schiavon et al. (2012) presented a catalog of candidate pAGB, peAGB and AGB-manqué stars in 44 Galactic GCs, including NGC 2808, using Galaxy Evolution Explorer (GALEX) FUV and NUV observations. However, this study was limited by the spatial resolution ( ) of GALEX. Also, the membership information for these stars were not available then.
Moehler et al. (2019) combined photometric observations from various missions such as Ultraviolet Imaging Telescope (UIT), GALEX, Swift Ultraviolet-Optical Telescope (UVOT) and Hubble Space Telescope (HST) to obtain the census of UV-bright stars in 78 GCs. The atmospheric parameters of the brightest pHB stars in the sample (including 3 stars from NGC 2808), derived from optical spectroscopic observations, were used to assess their evolutionary status. The number of theoretically predicted and observed hot pAGB stars for 17 GCs (excluding NGC 2808) were found to be comparable, though affected by poor statistics. The catalog of such stars in their list of clusters is yet to be published. Several optical spectroscopic studies of previously identified bright pHB stars have been performed to shed light on their chemistry and evolutionary status (Thompson et al., 2007; Chayer et al., 2015; Dixon et al., 2017, 2019).
Jain et al. (2019) studied NGC 2808 using the data obtained from the Ultraviolet Imaging Telescope (UVIT). They reported the detection of hot stars belonging to different classes such as EHB, blue HB (BHB), red HB (RHB), blue hook (BHk), pAGB, and blue straggler stars (BSSs), from UV color-magnitude diagrams (CMDs), albeit without membership analysis. They focused on the photometric gaps in the UV color-magnitude diagrams (CMDs) and the multiple stellar populations in the cluster.
In this work, we study the unexplored UV-bright member stars in NGC 2808. This is one of the massive and dense GCs with an age = Gyrs (Massari et al., 2016), [Fe/H] = 1.14 dex and located at a distance of 9.6 kpc (Harris, 1996, 2010 edition, H96). We combine the archival UV data from the UVIT with the UV-optical observations from the HST (Brown et al., 2001; Nardiello et al., 2018; Piotto et al., 2015), optical observations from Gaia (Gaia Collaboration et al., 2018) and ground-based telescopes (Stetson et al., 2019). The member stars in the inner (central region within , covered by HST WFC3/UVIS) and outer regions (the region outside HST field of view (FOV)) of the cluster are identified utilizing the proper motion-based membership information from the HST and Gaia catalogs, respectively. We present the catalog of UV-bright member stars in this cluster (from inner to outer regions) for the first time along with their surface parameters derived through the analysis of their spectral energy distributions (SEDs). We also investigate the evolutionary status of these UV-bright stars and compare the observed number of hot p(e)AGB 111We use the notation p(e)AGB to indicate either pAGB or peAGB star. stars with the expected number derived from theoretical estimations. Though Jain et al. (2019) used the UVIT data to study the HB population, here we aim to focus on the UV-bright members of the cluster and parameterize them to throw light on the short-lived late evolutionary phases of low mass stars.
The layout of the paper is as follows. Section 2 gives an account of the observations and the adopted data reduction procedure. The cross-match of the different datasets and the UV-optical CMDs are presented in Section 3. Sections 4, 5, 6 describe the observed UV-bright stars, their SEDs and evolutionary phases, respectively. The results are discussed in Section 7 and a summary is presented in Section 8.
2 Observations and Data Reduction
This work utilizes data from the UVIT on-board AstroSat, India’s first multiwavelength space observatory. The UVIT consists of twin telescopes, each of 38cm diameter, one dedicated for FUV ( Å), and the other for NUV ( Å) and VIS ( Å) pass bands. The VIS data is used for drift-correcting the images. The UVIT has a circular FOV of diameter and consists of multiple filters in each pass band. The FUV and NUV detectors operate in photon-counting mode and the VIS detector in integration mode. Further details regarding the instrument and calibration can be found in Tandon et al. (2017).
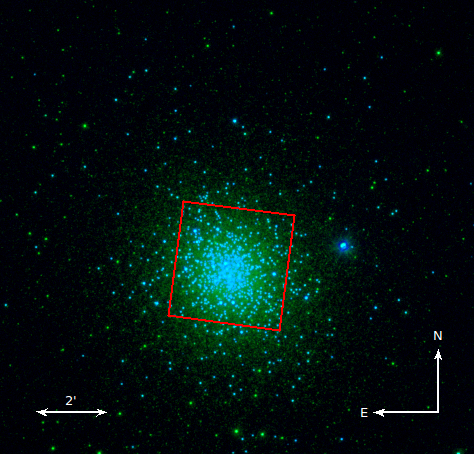
We used the archival UVIT data for NGC 2808, in two FUV (F154W and F169M) and four NUV filters (N242W, N245M, N263M and N279N). The images were created using the CCDLAB software package (Postma & Leahy, 2017) by correcting for the spacecraft drift, geometrical distortions and flat-fielding. The images created for each orbit were then aligned and merged to create the final science-ready image in each filter. The final exposure times for the science ready image in various filters are tabulated in Table 1. The UVIT image of NGC 2808 is shown in Figure 1 with blue corresponding to F154W detections and green to those in N242W.
2.1 Photometry
Crowded-field photometry was performed on the UVIT images using DAOPHOT software package of IRAF/NOAO (Stetson, 1987) through the following steps. Stars in the images were located using the DAOFIND task, and their aperture photometry magnitudes were computed using the PHOT task. The model point spread function (PSF) was generated using a few bright isolated stars in the image. It was then fitted to all the detected stars, and the PSF-fitted magnitudes were obtained using the ALLSTAR task. The curve-of-growth technique was used to calculate the aperture correction value, which was then applied to the magnitudes. To get the final magnitudes in each filter, saturation correction was applied according to the method described in Tandon et al. (2017). The number of detected stars in various filters is presented in Table 1. The plots of magnitude versus PSF-fit error for different filters are shown in Figure 2.
The magnitudes in all filters were corrected for extinction by adopting a reddening value, = 0.22 mag (H96) and the ratio of total to selective extinction, = 3.1. The corresponding extinction coefficient in the V band is, = 0.682 mag. The extinction coefficients presented in Table 1 were calculated using the reddening law of Cardelli et al. (1989).
\topruleFilter Zero point Exp. time No. of stars FWHM of Model PSF (Å) (Å) (mag) (s) () (mag) F154W 1541 380 17.77 4987.34 2692 1.47 1.79 F169M 1608 290 17.45 4220.36 3996 1.45 1.75 N242W 2418 785 19.81 1040.99 5056 1.41 1.70 N245M 2447 280 18.50 886.42 2686 1.64 1.65 N263M 2632 275 18.18 354.46 1309 1.58 1.43 N279N 2792 90 16.50 2629.94 2868 1.42 1.32 \toprule

3 UV-optical and UV CMDs
3.1 Cross-match of the UVIT data with the HST data
In order to identify various stars detected in the UVIT images, we cross-matched them with the HST UV Globular Cluster Survey (HUGS) catalog (Nardiello et al., 2018; Piotto et al., 2015) in the inner region of the cluster (within ). The HUGS astro-photometric catalog consists of data in the WFC3/UVIS F275W (NUV), F336W (U) and F438W (B) filters along with ACS/WFC F606W (V) and F814W (I) filters. The catalog also provides cluster membership probabilities estimated based on stellar proper-motions. We selected stars with membership probability greater than as cluster members. As we are interested in the UV-bright population of this cluster, we chose stars which are expected to be bright in the UV, such as the pHB, HB and BSSs from the HST CMD and identified their unique counterparts in the UVIT images as explained below.
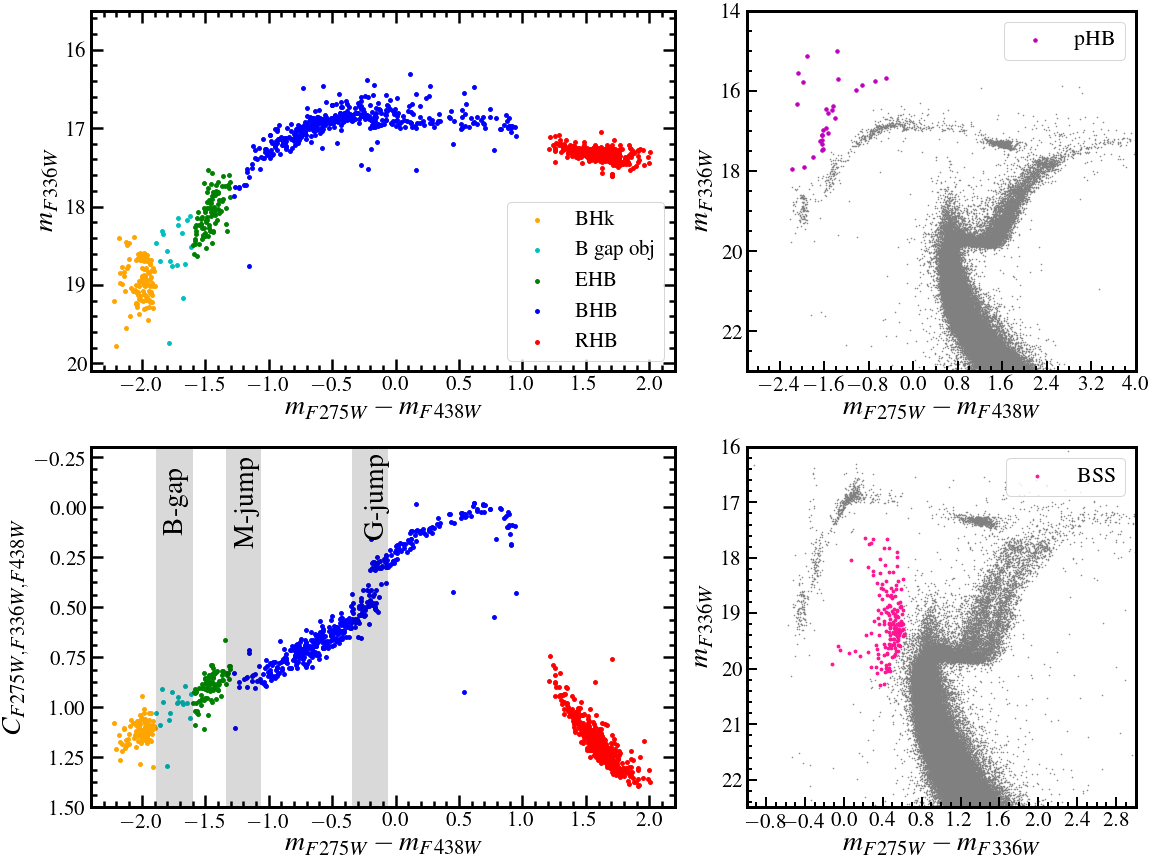
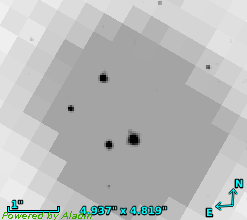
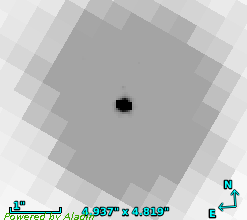
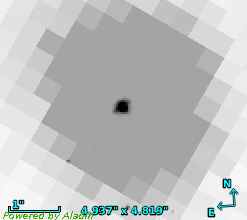
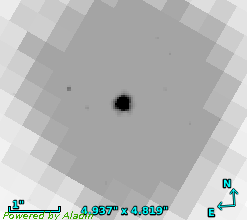
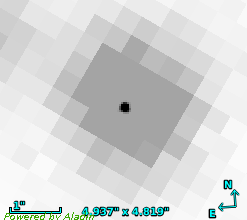
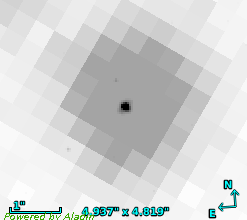
The CMDs and color-color plane (CCP) using the HST data for the inner region of the cluster are shown in Figure 3 where the stars are color-coded according to their classification. The top right panel shows the 28 identified pHB member stars. The bottom right panel shows the 176 identified BSS members as per the procedure described in Raso et al. (2017). The division of HB into RHB, BHB, EHB, B gap objects and BHk was done using the vs. plane (Brown et al., 2016), as shown in the left panels. The classification adopted here is similar to that of Brown et al. (2016). The RR Lyrae stars were identified by cross-matching with the data from Kunder et al. (2013). Since the HST images have a much better spatial resolution, a simple cross-match with the UVIT data may yield wrong identifications due to crowding in the innermost region of the cluster. A case of multiple HST stars for a single UVIT detection is demonstrated in Figure 4, where we have overlaid the HST F275W image and the UVIT F154W image. The gray patch is the UVIT detection, whereas in black are the stars are from HST in a region of about . In order to avoid such wrong/multiple identifications, we used a python code which returns only those HST stars among the pHB, HB and BSS stars, which have no neighbors within radius (maximum UVIT PSF) from them. As the crowding is maximum near the cluster center, no HST-UVIT cross-match was performed for the innermost region (radius ). Finally, 491 stars were selected from the HST catalog, and these were then cross-matched with the UVIT detected stars with a maximum match radius of . All the cross-matched stars were found to have a photometric error 0.2 mag in all the UVIT filters.
3.2 Cross-match of the UVIT data with the Gaia and ground-based optical data
The UVIT FOV is much larger than the HST FOV, and it covers the outer region of the cluster as well. In order to effectively use the stars detected by UVIT in the outer region, the UVIT data were combined with other data for their identification and membership, as explained below. The list of possible member stars of the cluster in the outer region was obtained from the Gaia DR2 paper, Gaia Collaboration et al. (2018), and their UBVRI photometry from Stetson et al. (2019). These datasets were cross-matched first to get the cluster members and their optical photometry. The resultant set was then cross-matched with the UVIT data, with a maximum match radius of . Then, only those stars with UVIT magnitude error 0.2 mag were included in the analysis. The cross-matched stars were visually checked for wrong/multiple identifications. Further, the , , and Johnson-Cousins magnitudes of all these stars were transformed into the equivalent HST filter magnitudes (WFC3/UVIS F438W, ACS/WFC F606W and ACS/WFC F814W), using the transformation equations of Harris (2018) and Sirianni et al. (2005) so that stars in the inner and outer regions could be shown in the same color and magnitude plane.
3.3 Color-magnitude diagrams
We constructed the UV-optical and UV CMDs for the inner and outer regions with the cross-matched members. The updated BaSTI (a Bag of Stellar Tracks and Isochrones) theoretical zero-age HB (ZAHB) and terminal-age HB (TAHB; end of He burning phase) models from Hidalgo et al. (2018) were fitted to the HB sequence of the cluster CMD. These models were generated in the UVIT, HST/WFC3 and HST/ACS filters by choosing metallicity [Fe/H] = 0.9 dex, He abundance = 0.249, solar scaled [/Fe] = 0.0, and no convective overshoot. These models take into account the effects due to atomic diffusion at the hotter end of the HB as is evident from the close match with the CMDs.
Figure 5 shows the CMD of the cluster for the inner region using the HST data. Stars which are used for the cross-match with the UVIT data are shown along with the ZAHB and TAHB models. The gray dots represent stars with more than 90% membership probability.
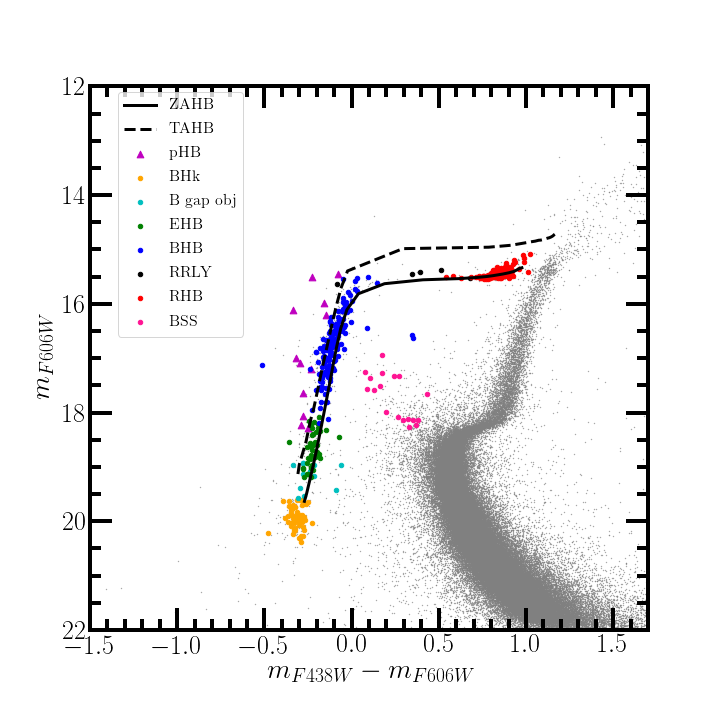
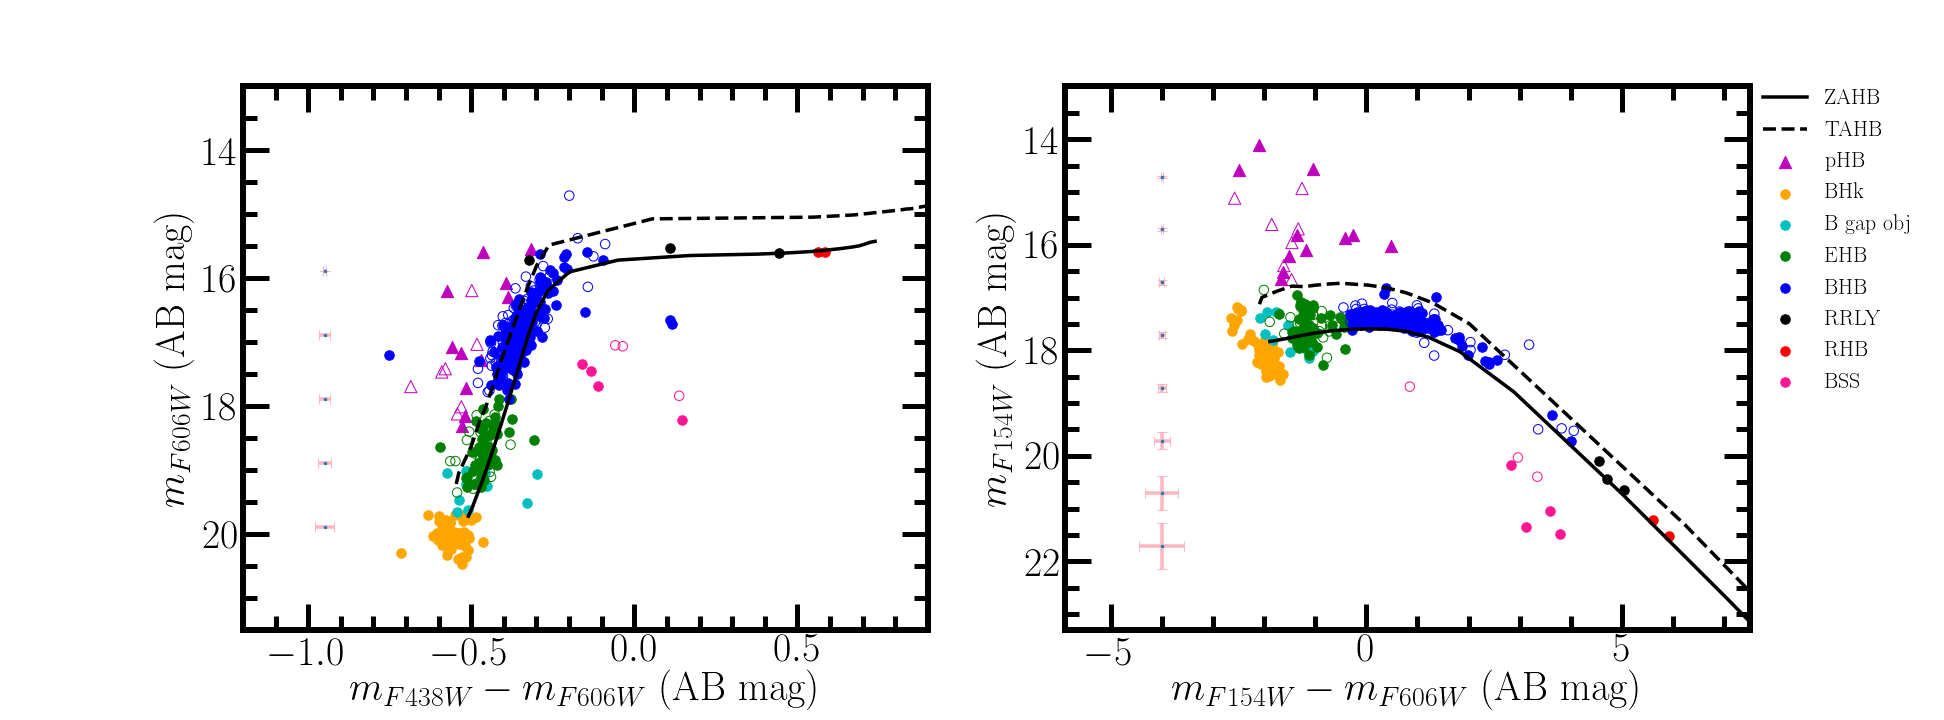
Figure 6 shows the optical and FUV-optical CMDs for all the members detected in the F154W UVIT filter. To plot these CMDs, we converted the F438W and F606W magnitudes from the VEGA system to the AB system.222We used the conversion factors from http://waps.cfa.harvard.edu/MIST/BC_tables/zeropoints.txt. The filled and unfilled symbols represent the stars located in the inner and outer regions of the cluster, respectively. In FUV, we have mainly detected the hotter part of the HB (BHB and EHB), BHk, pHB and a few BSSs. Three RR Lyrae variables are also identified. In the vs. plot (shown in the right panel), the BHB stars have a relatively tight distribution in magnitude, whereas the EHB, B gap and BHk stars show a spread in the magnitude, and with respect to the ZAHB track. Many of them are also found to be fainter than the ZAHB model. One of the detected BSSs, located in the outer region, is very bright in F154W filter. The RHB stars are hardly detected as they are not hot enough to emit in FUV wavelengths. The detected pHB stars are found to be brighter than the TAHB with a spread of about 2 magnitudes in F154W filter and 4 magnitudes in the FUV-optical color. We discuss these UV-bright stars in detail in the next section.
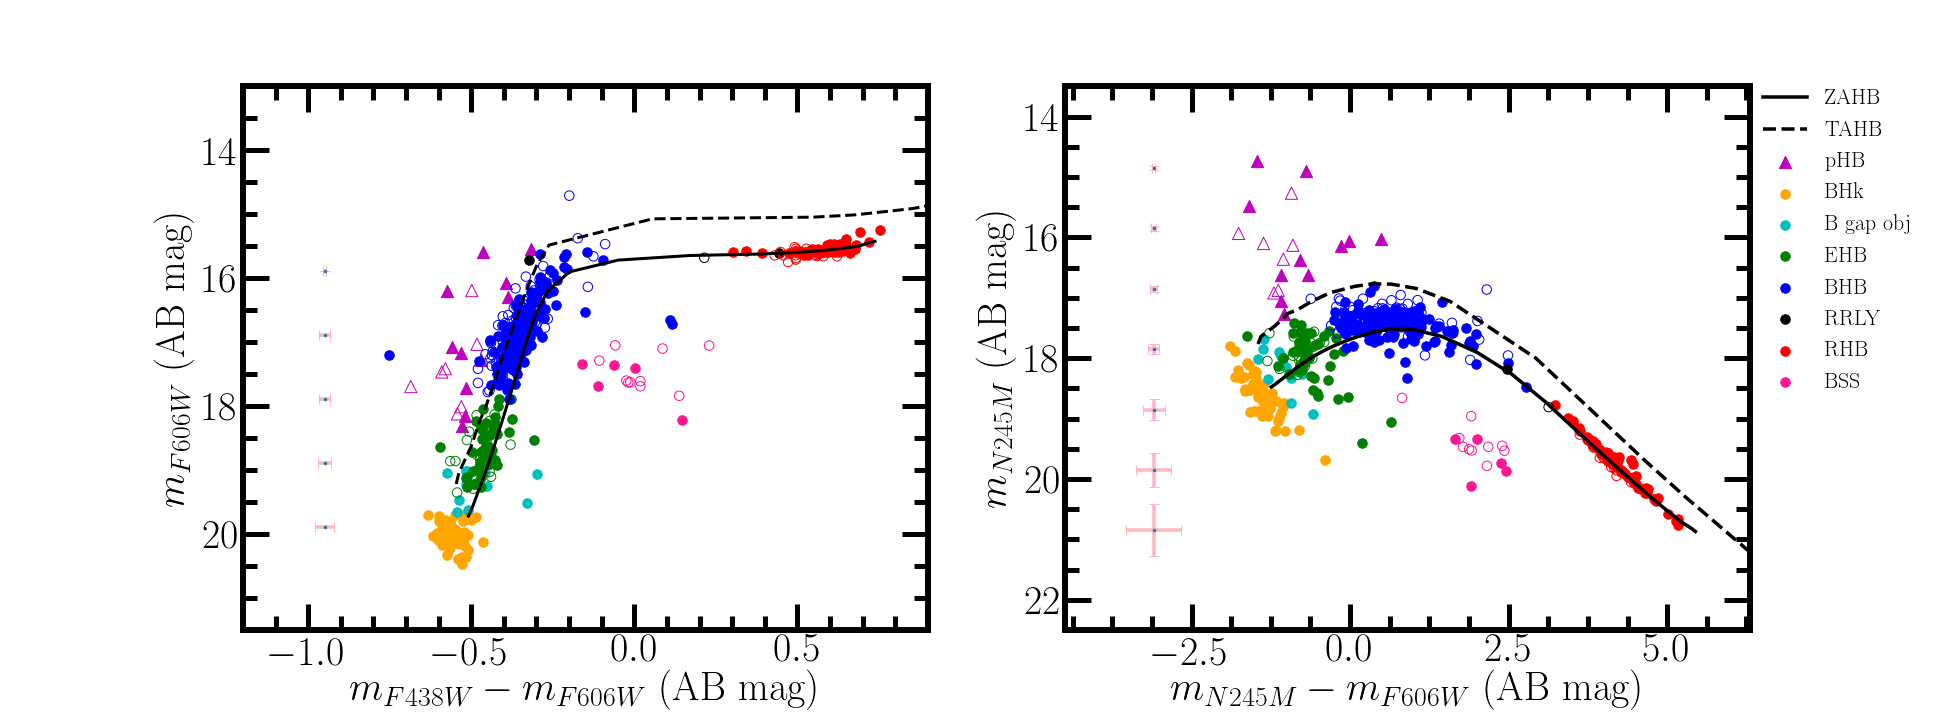
Similarly, Figure 7 shows the optical and NUV-optical CMDs for stars detected in the N245M UVIT filter. In the N245M filter, apart from the above-mentioned sequences, we have detected the cooler RHB population as well. The RHB stars form a tight sequence when compared to the rest of the HB sequence, and are located close to the ZAHB track. On the other hand, the other HB phases show a large spread, with many of them located above and below the ZAHB track. The BHk sequence has the largest statistically significant spread in the N245M magnitude, as is evident from the vs. CMD (right panel). The bright BSS is found to be located slightly fainter than the faintest BHB star.
The UV CMDs for all the stars common in the UVIT filters F154W and N245M are shown in Figure 8. In the vs CMD (left panel), the HB stars show a progressive reduction in the N245M magnitude as a function of color. In the case of the vs CMD, the HB stars with color 0.0 mag, have a horizontal sequence. The hot BHB, EHB, B gap and BHk stars get mixed up in these CMDs. The bright BSS is found slightly fainter than the BHB stars, with color 0.0 mag.

Table 2 tabulates the number of stars belonging to different categories, detected in each UVIT filter. In the outer region, since cluster members were selected based on Gaia data with an approximate limiting magnitude of 20.5 mag, we have zero stars belonging to the optically faint B gap and BHk categories. We plan to perform a separate detailed study of the HB stars and BSSs presented in this section, in the near future.
\topruleFilter F154W 11(7) 53(0) 12(0) 48(21) 147(65) 3(0) 2(0) 4(3) F169M 11(7) 52(0) 12(0) 49(21) 146(64) 2(1) 1(0) 3(1) N242W 11(7) 49(0) 11(0) 45(21) 146(66) 4(1) 119(124) 9(28) N245M 11(7) 48(0) 12(0) 45(20) 146(66) 2(1) 65(23) 5(10) N263M 11(7) 23(0) 8(0) 29(17) 140(66) 3(1) 38(4) 4(1) N279N 11(7) 40(0) 10(0) 40(17) 147(64) 5(1) 103(49) 8(2) \toprule
4 OBSERVED UV-bright stars
The main aim of this study was to identify and characterize the pHB stars in the inner and outer regions of the cluster. Among the UVIT detected stars in the outer regions, some bright stars were found to be non-members as per the list of possible members from Gaia Collaboration et al. (2018). We re-assessed the membership of these stars in the outer region, using methods presented in Singh et al. (2020) which also uses the Gaia DR2 data. Two stars were found to have a membership probability of 90%. One star was found to have 40% membership probability and this was studied by Moehler et al. (2019) using optical spectroscopy. We included these 3 stars along with the other pHB stars, for further study.
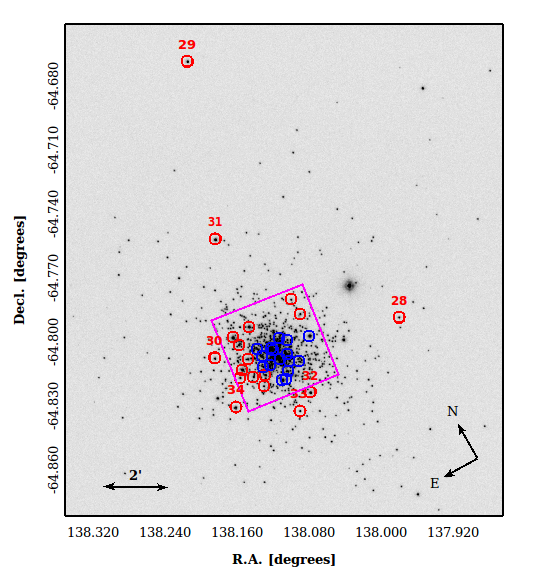
From our analysis, we find a total of 34 UV-bright member stars in this cluster, which could be classified as pHB stars. Of these, 18 stars have FUV, NUV flux measurements from the UVIT and are marked with purple triangles in the UV-optical and UV CMDs in Figures 6, 7 and 8. All these stars satisfy the observational criteria for them to be classified as UV-bright stars, as laid out in Schiavon et al. (2012), i.e., they are brighter than the ZAHB by more than 1 mag in FUV and the FUVNUV color is less than 0.7 mag. The UVIT magnitudes and magnitude errors for these stars are presented in the appendix (Table 7). Figure 9 shows the spatial locations of all the 34 observed UV-bright stars marked over the UVIT F154W image. Here, 11 out of the 18 UVIT detected pHB stars (shown in red circles) lie in the HST FOV and they have been uniquely cross-matched. This can be seen in Figure 10, where we have overlaid the HST F275W and the UVIT F154W images for these stars. We also note that similar unique cross-matches are achieved for all the stars shown in the CMDs. The remaining 16 UV-bright stars (marked in blue circles in Figure 9) are located in the crowded innermost region of the cluster and hence, could not be resolved by the UVIT. Among these, only 4 stars have FUV, NUV photometric measurements from the HST Space Telescope Imaging Spectrograph (STIS) instrument (Brown et al., 2001), whereas all the 16 have the NUV-optical data from HUGS catalog.
These multi-wavelength photometric data for the UV-bright stars were used to determine their evolutionary status by estimating various parameters.


5 Spectral energy distributions
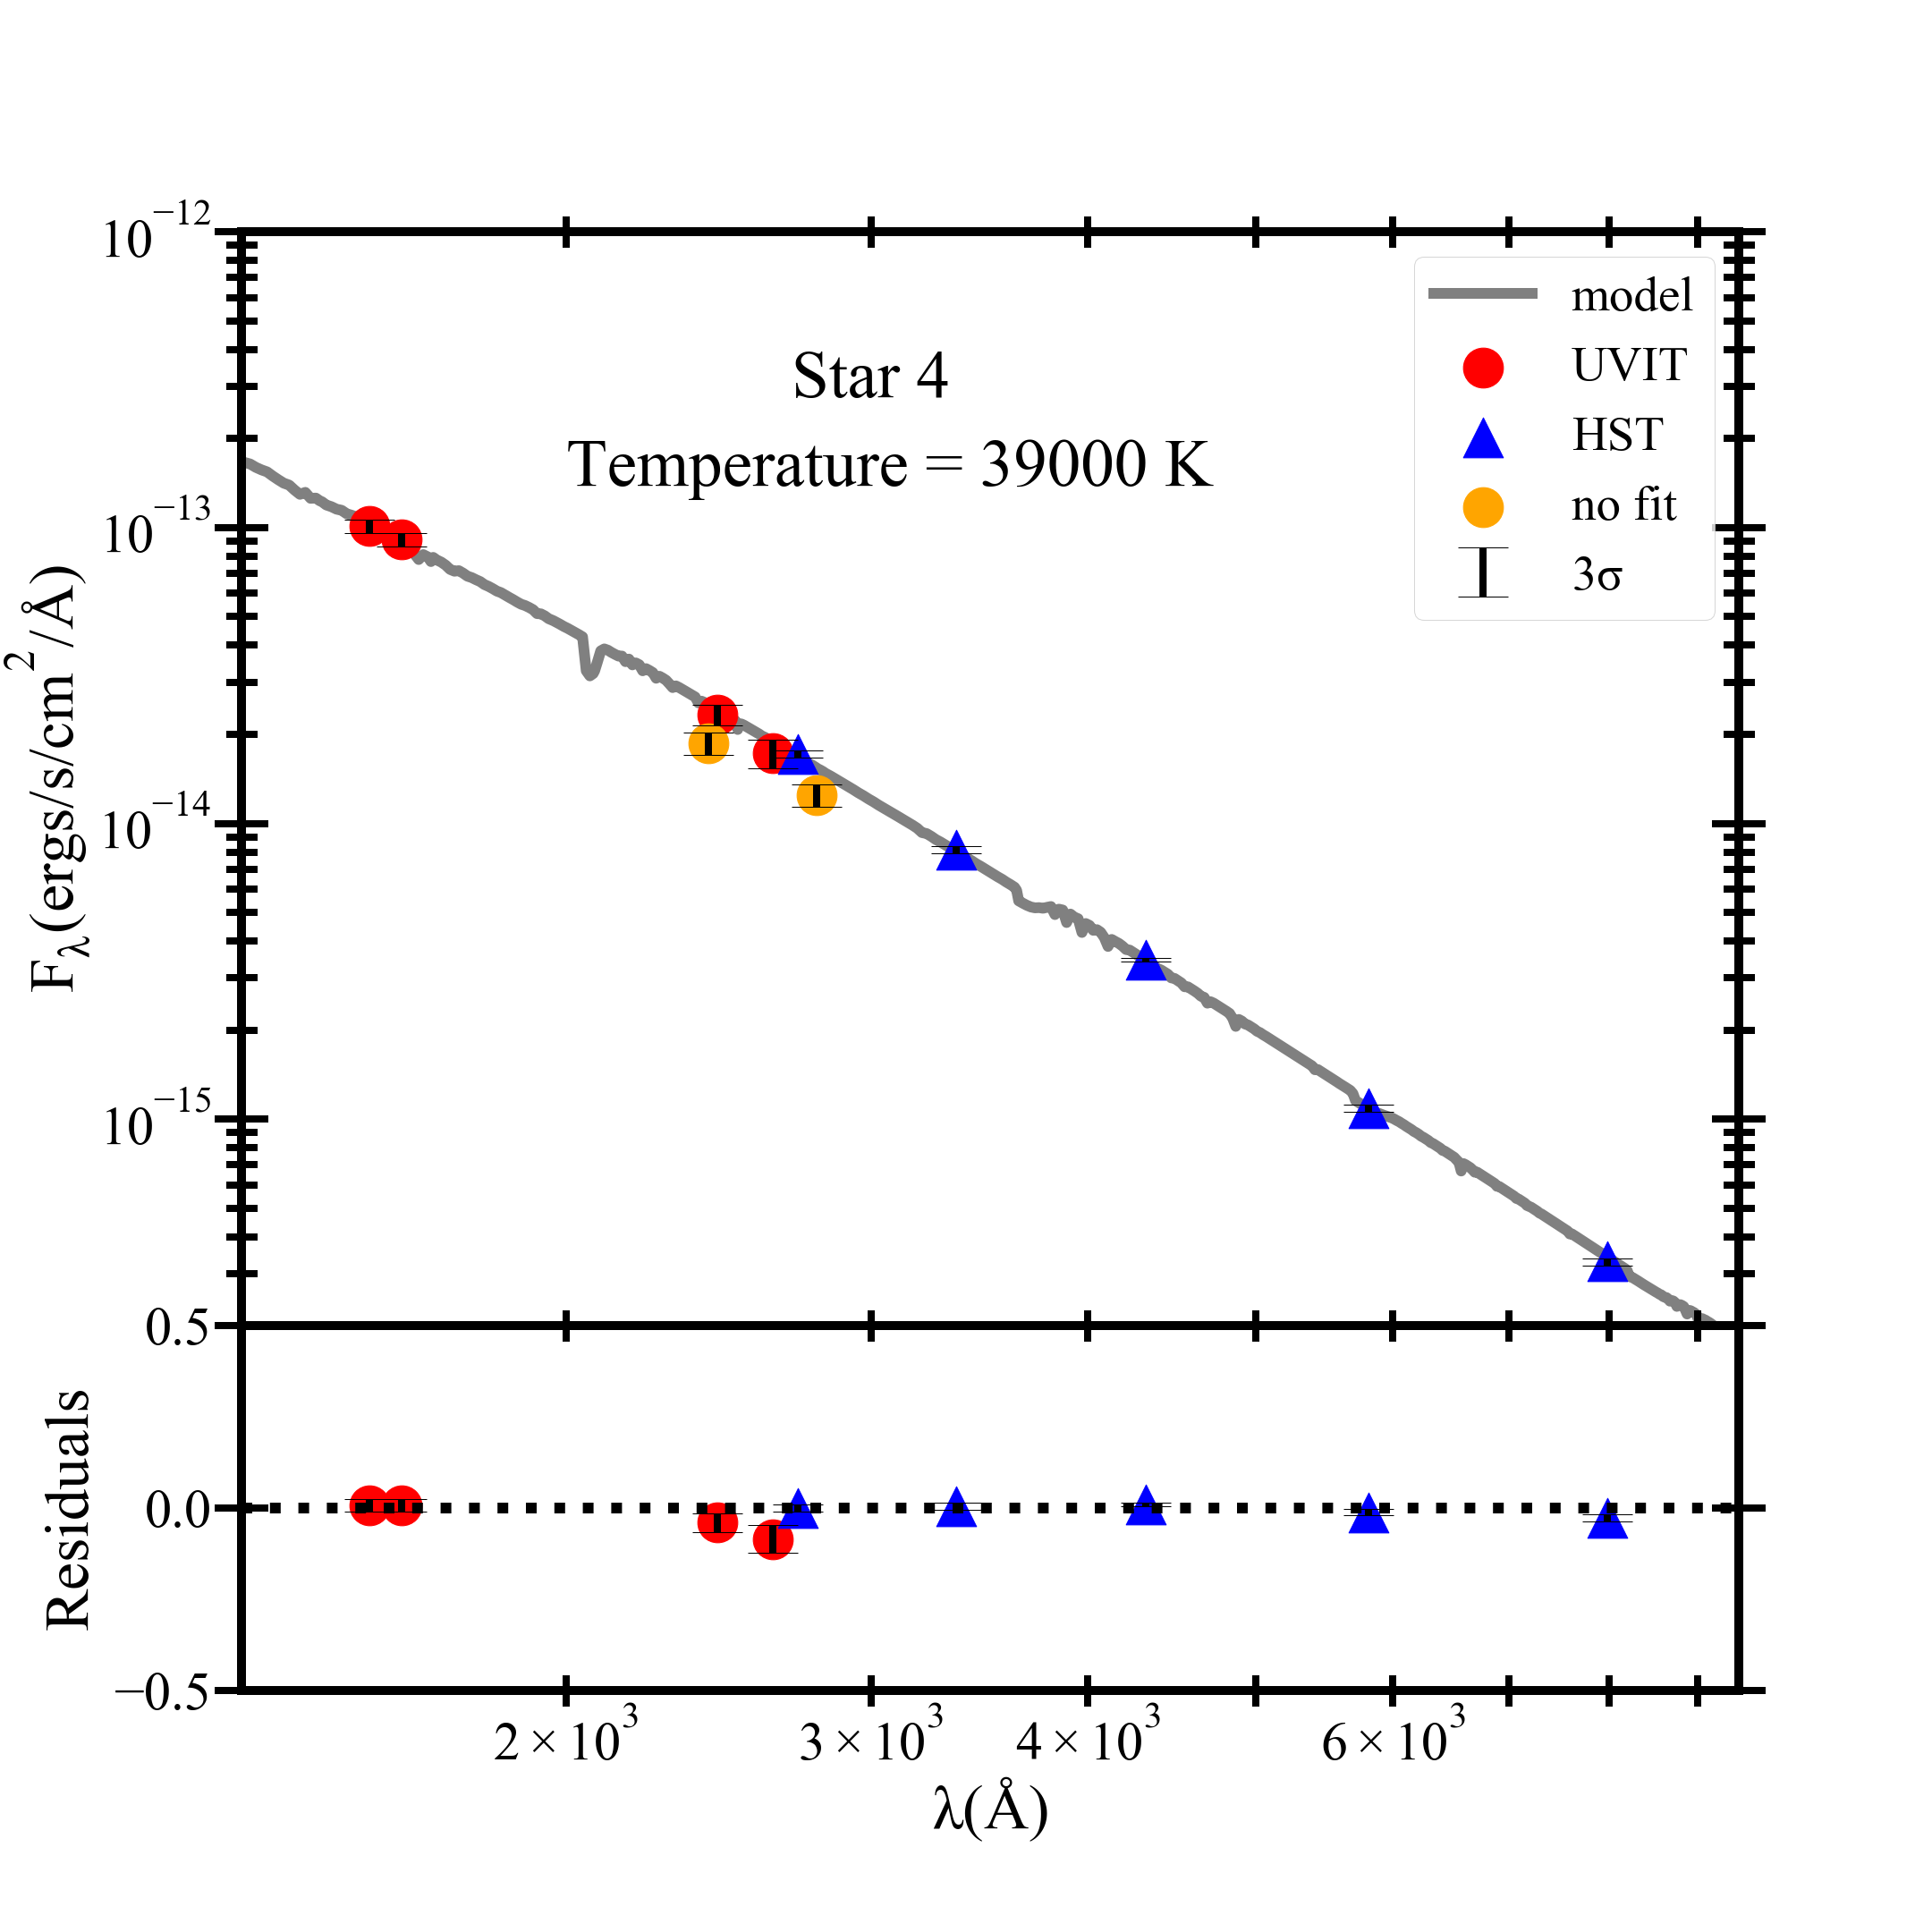
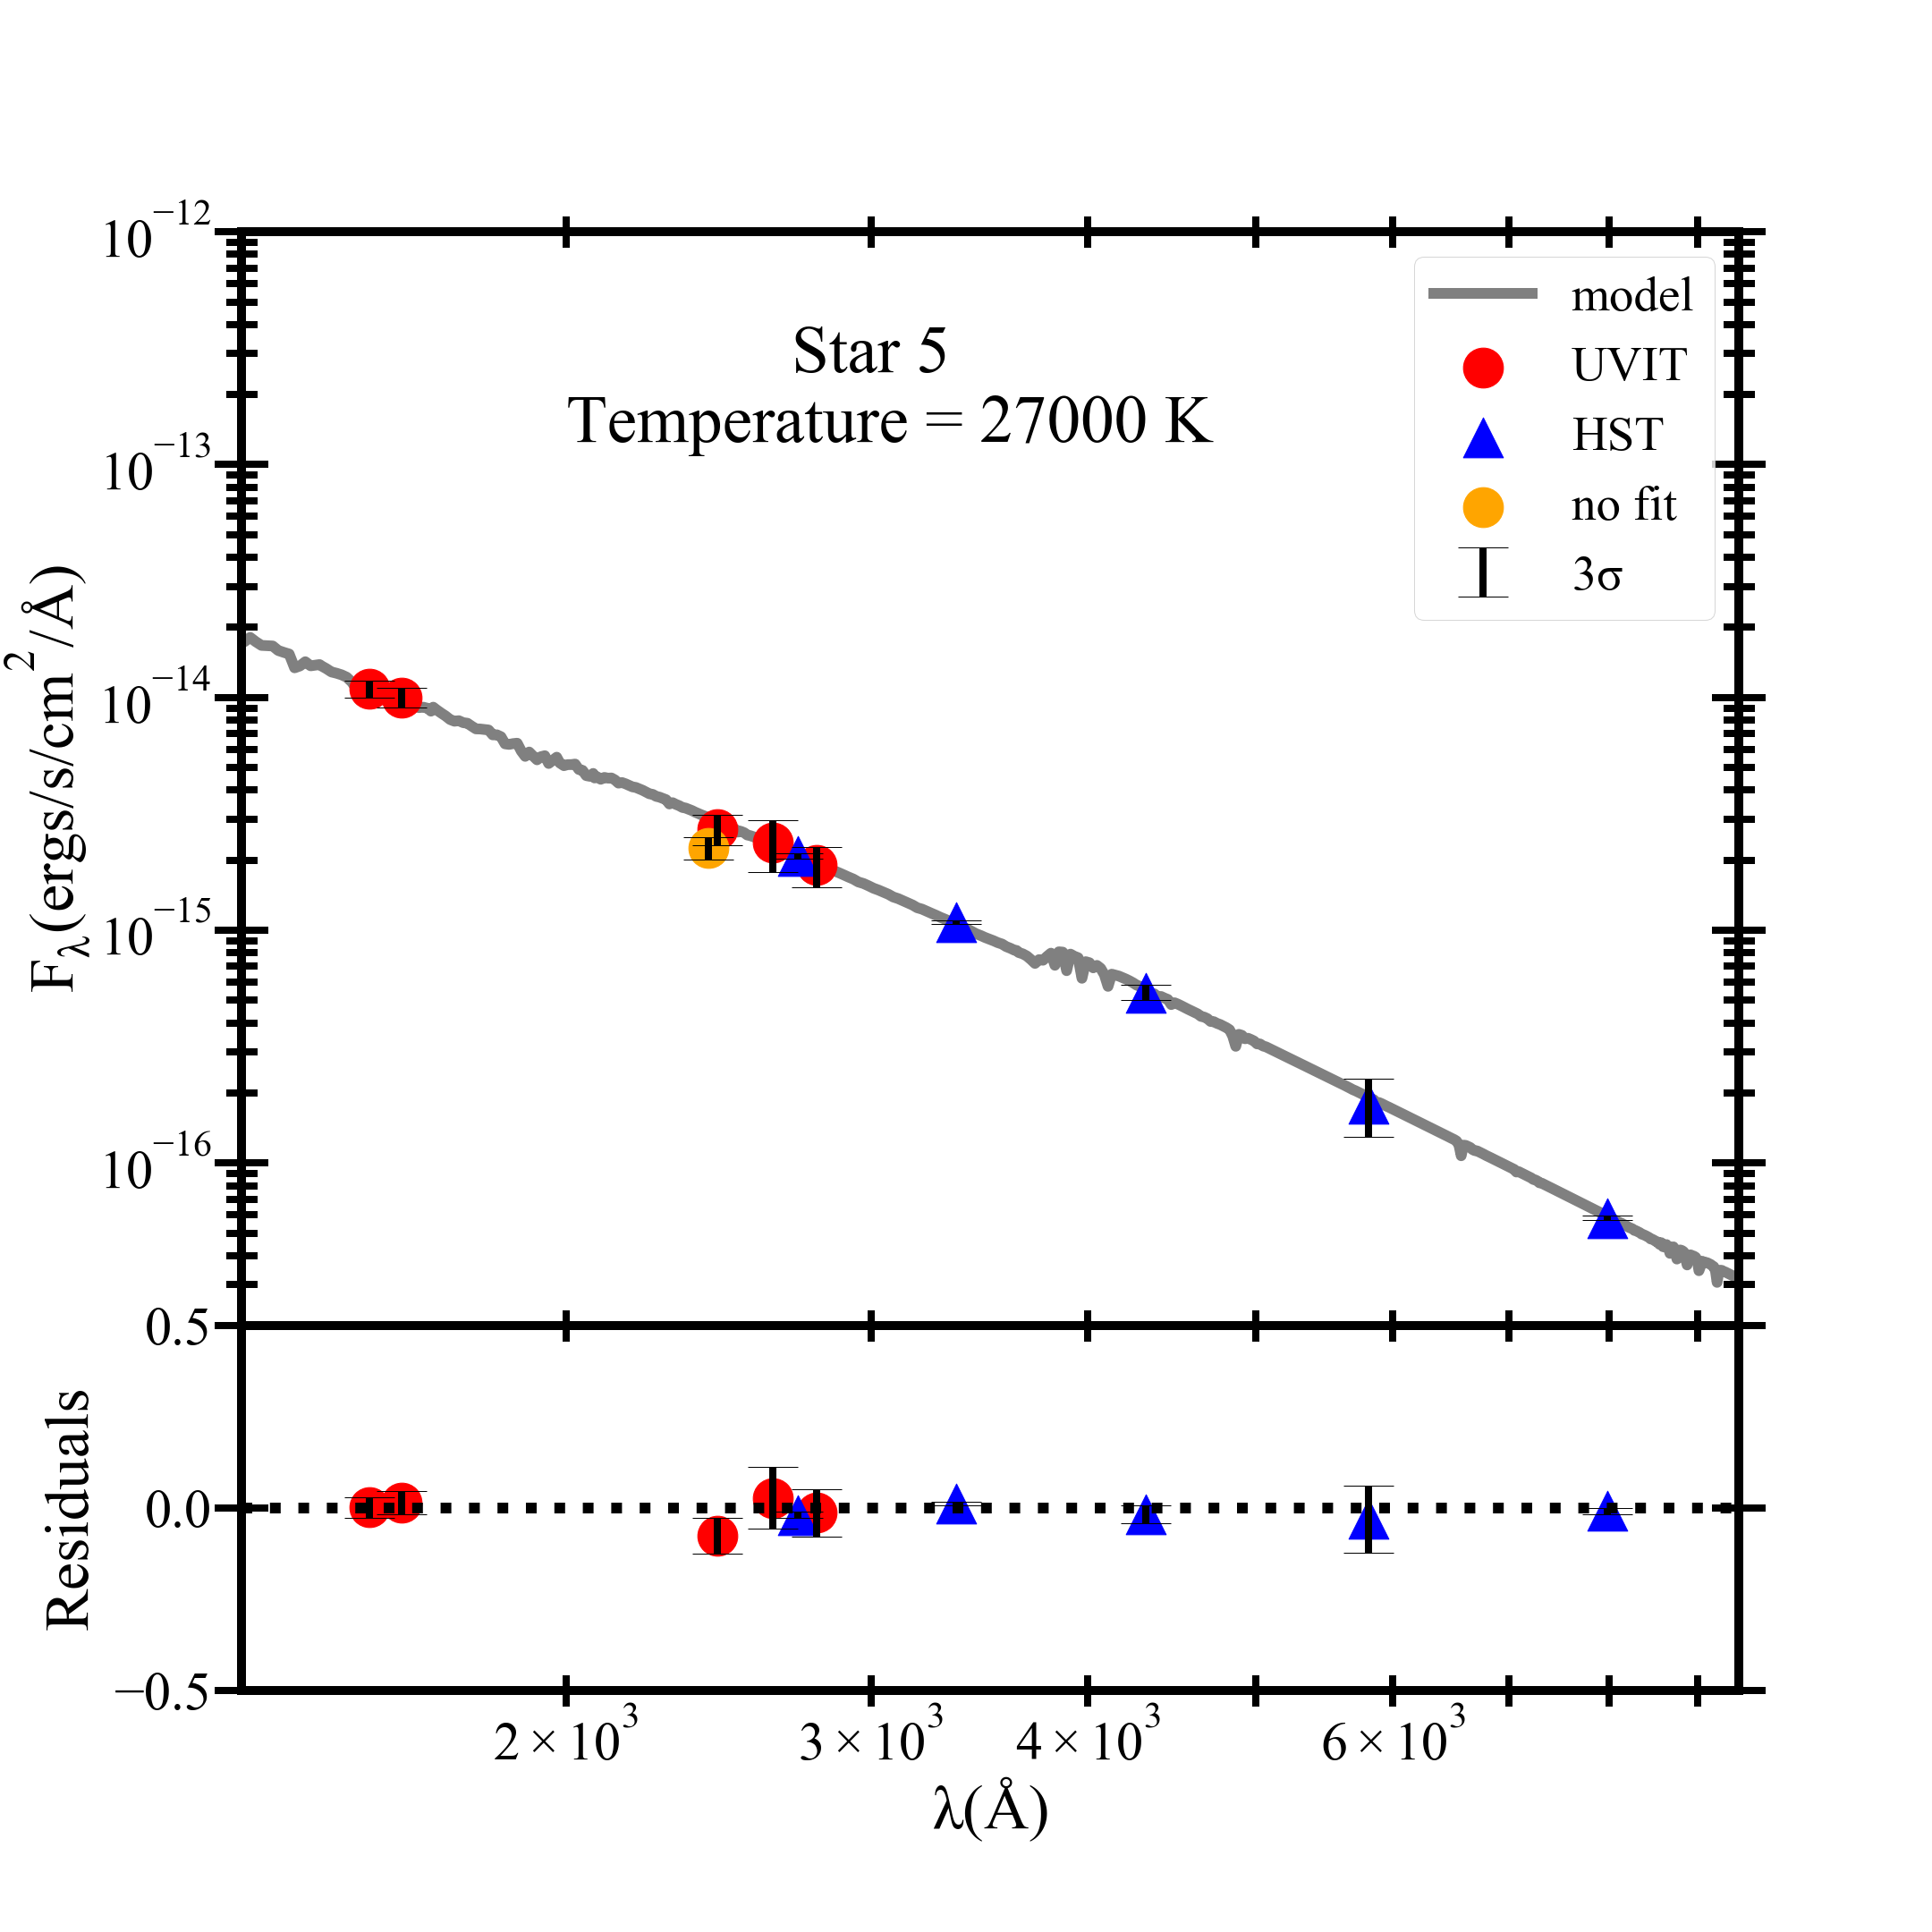
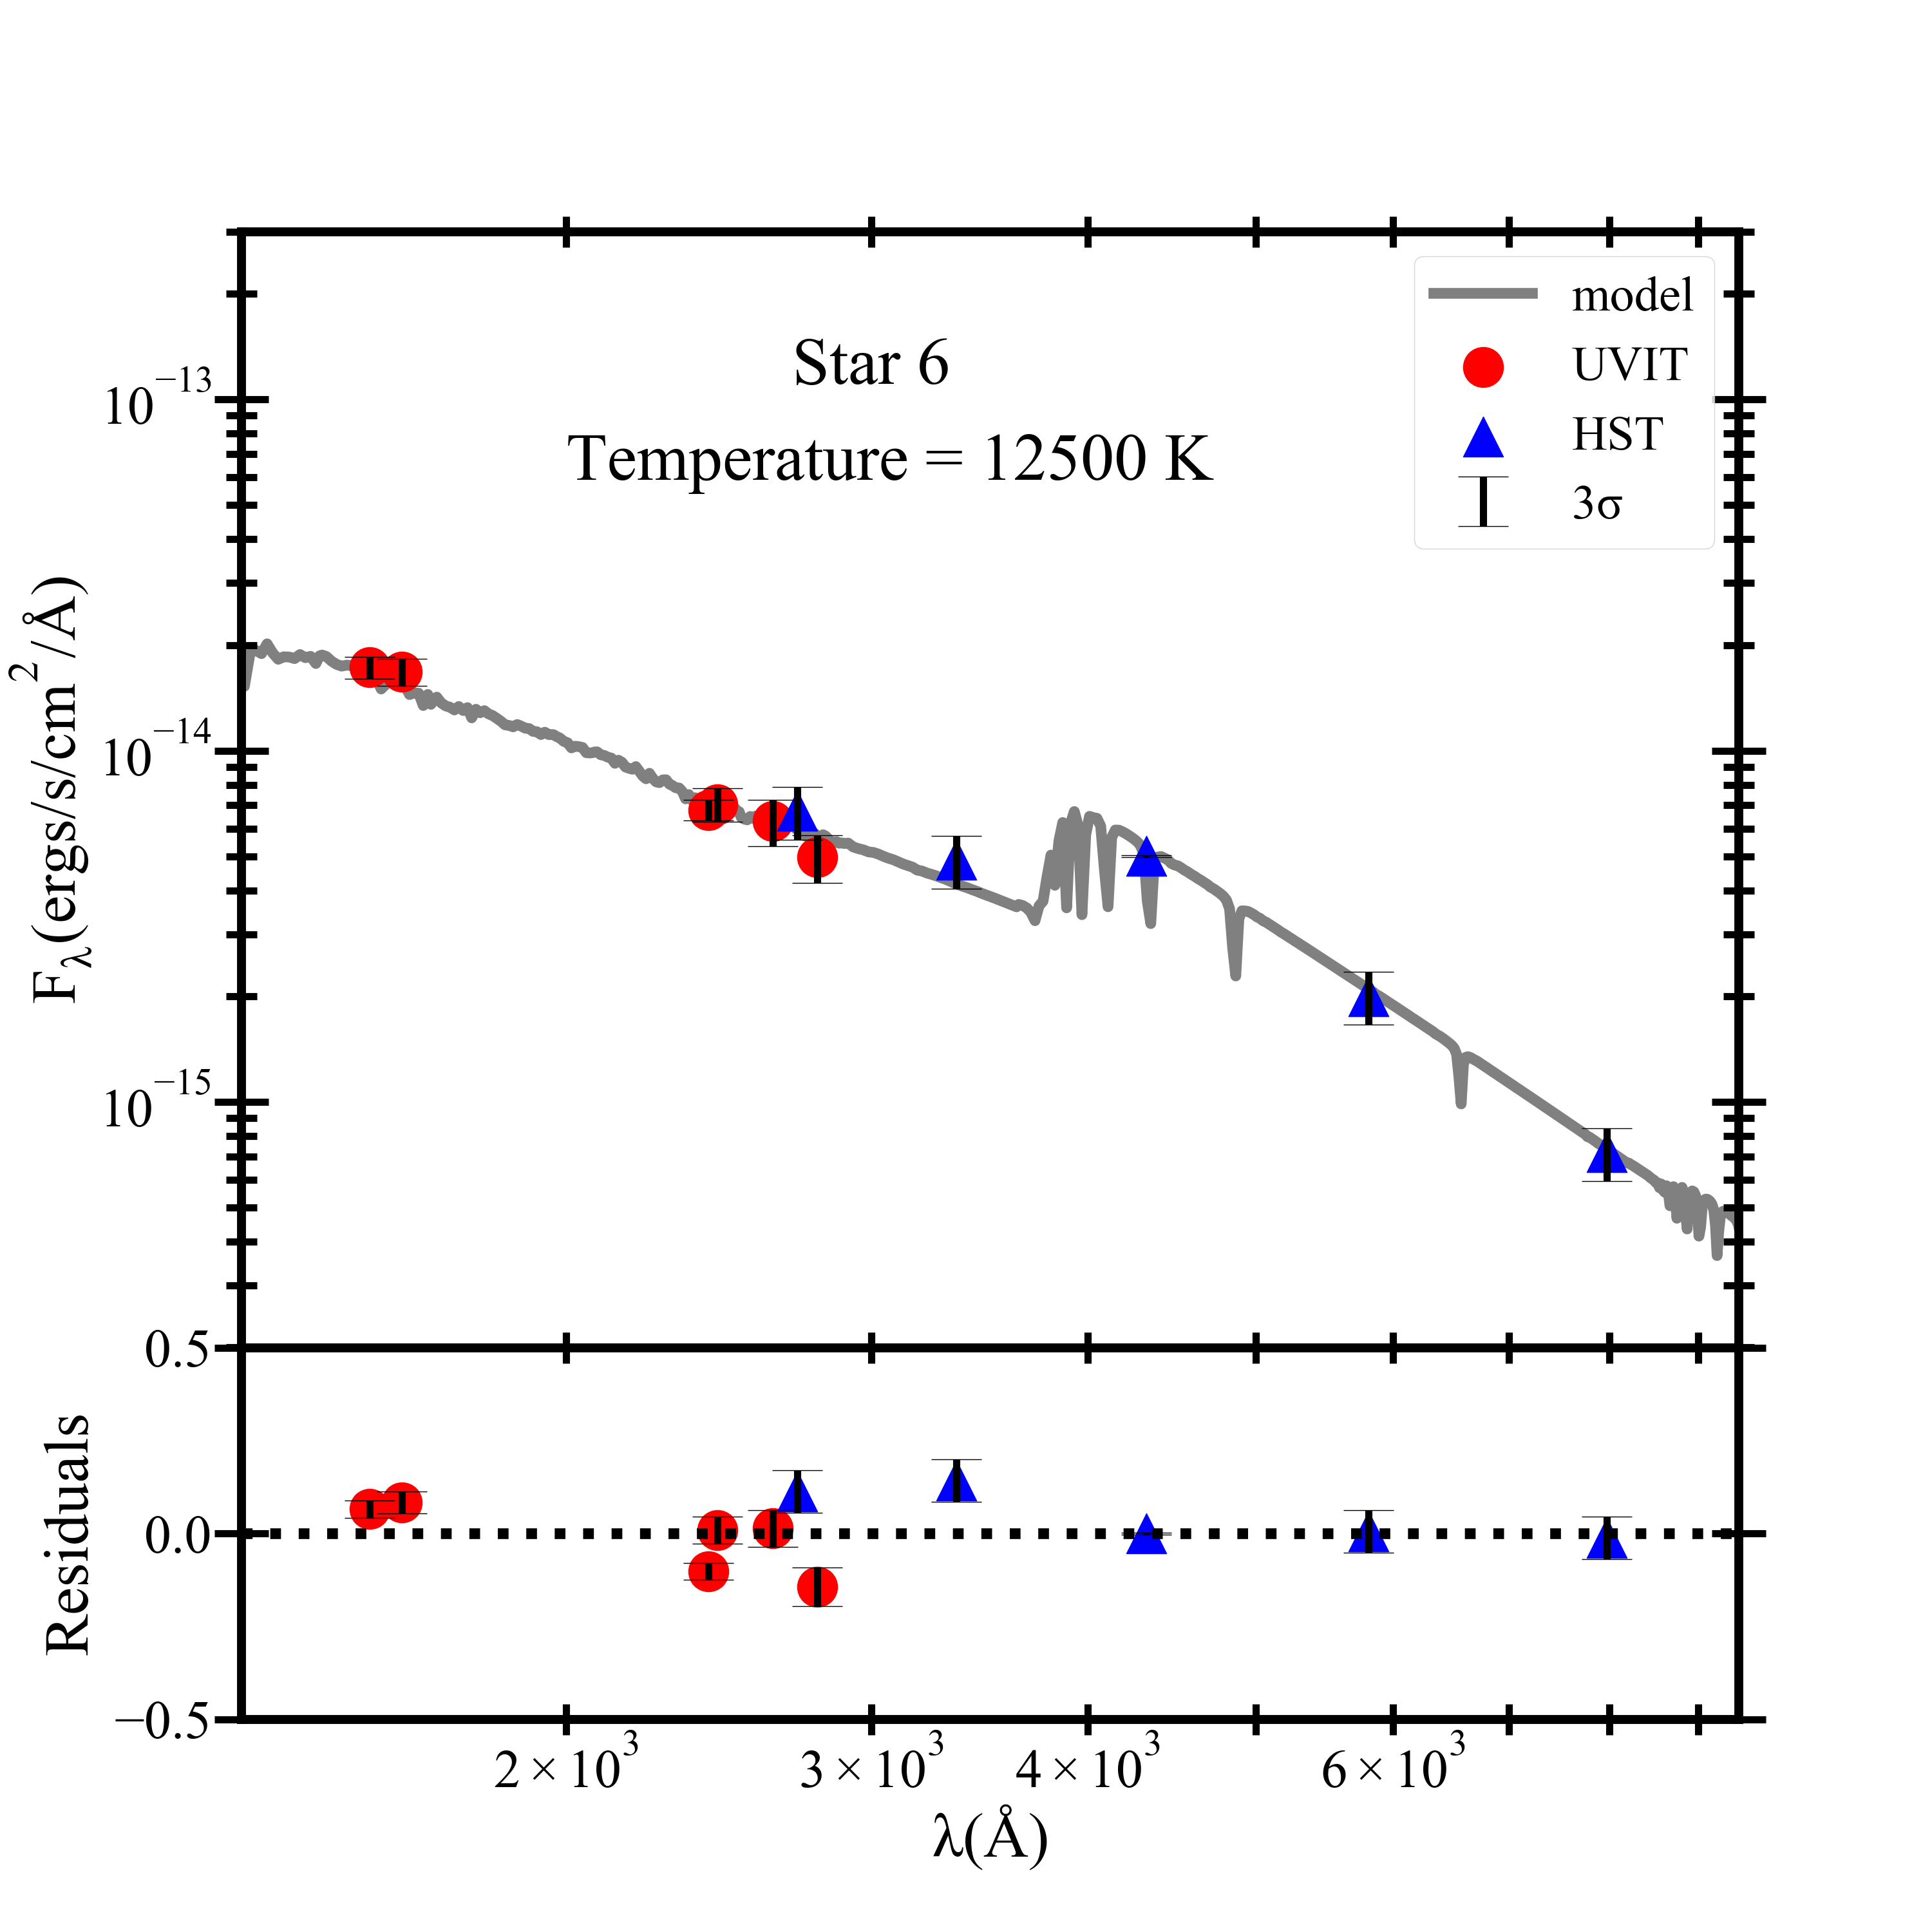
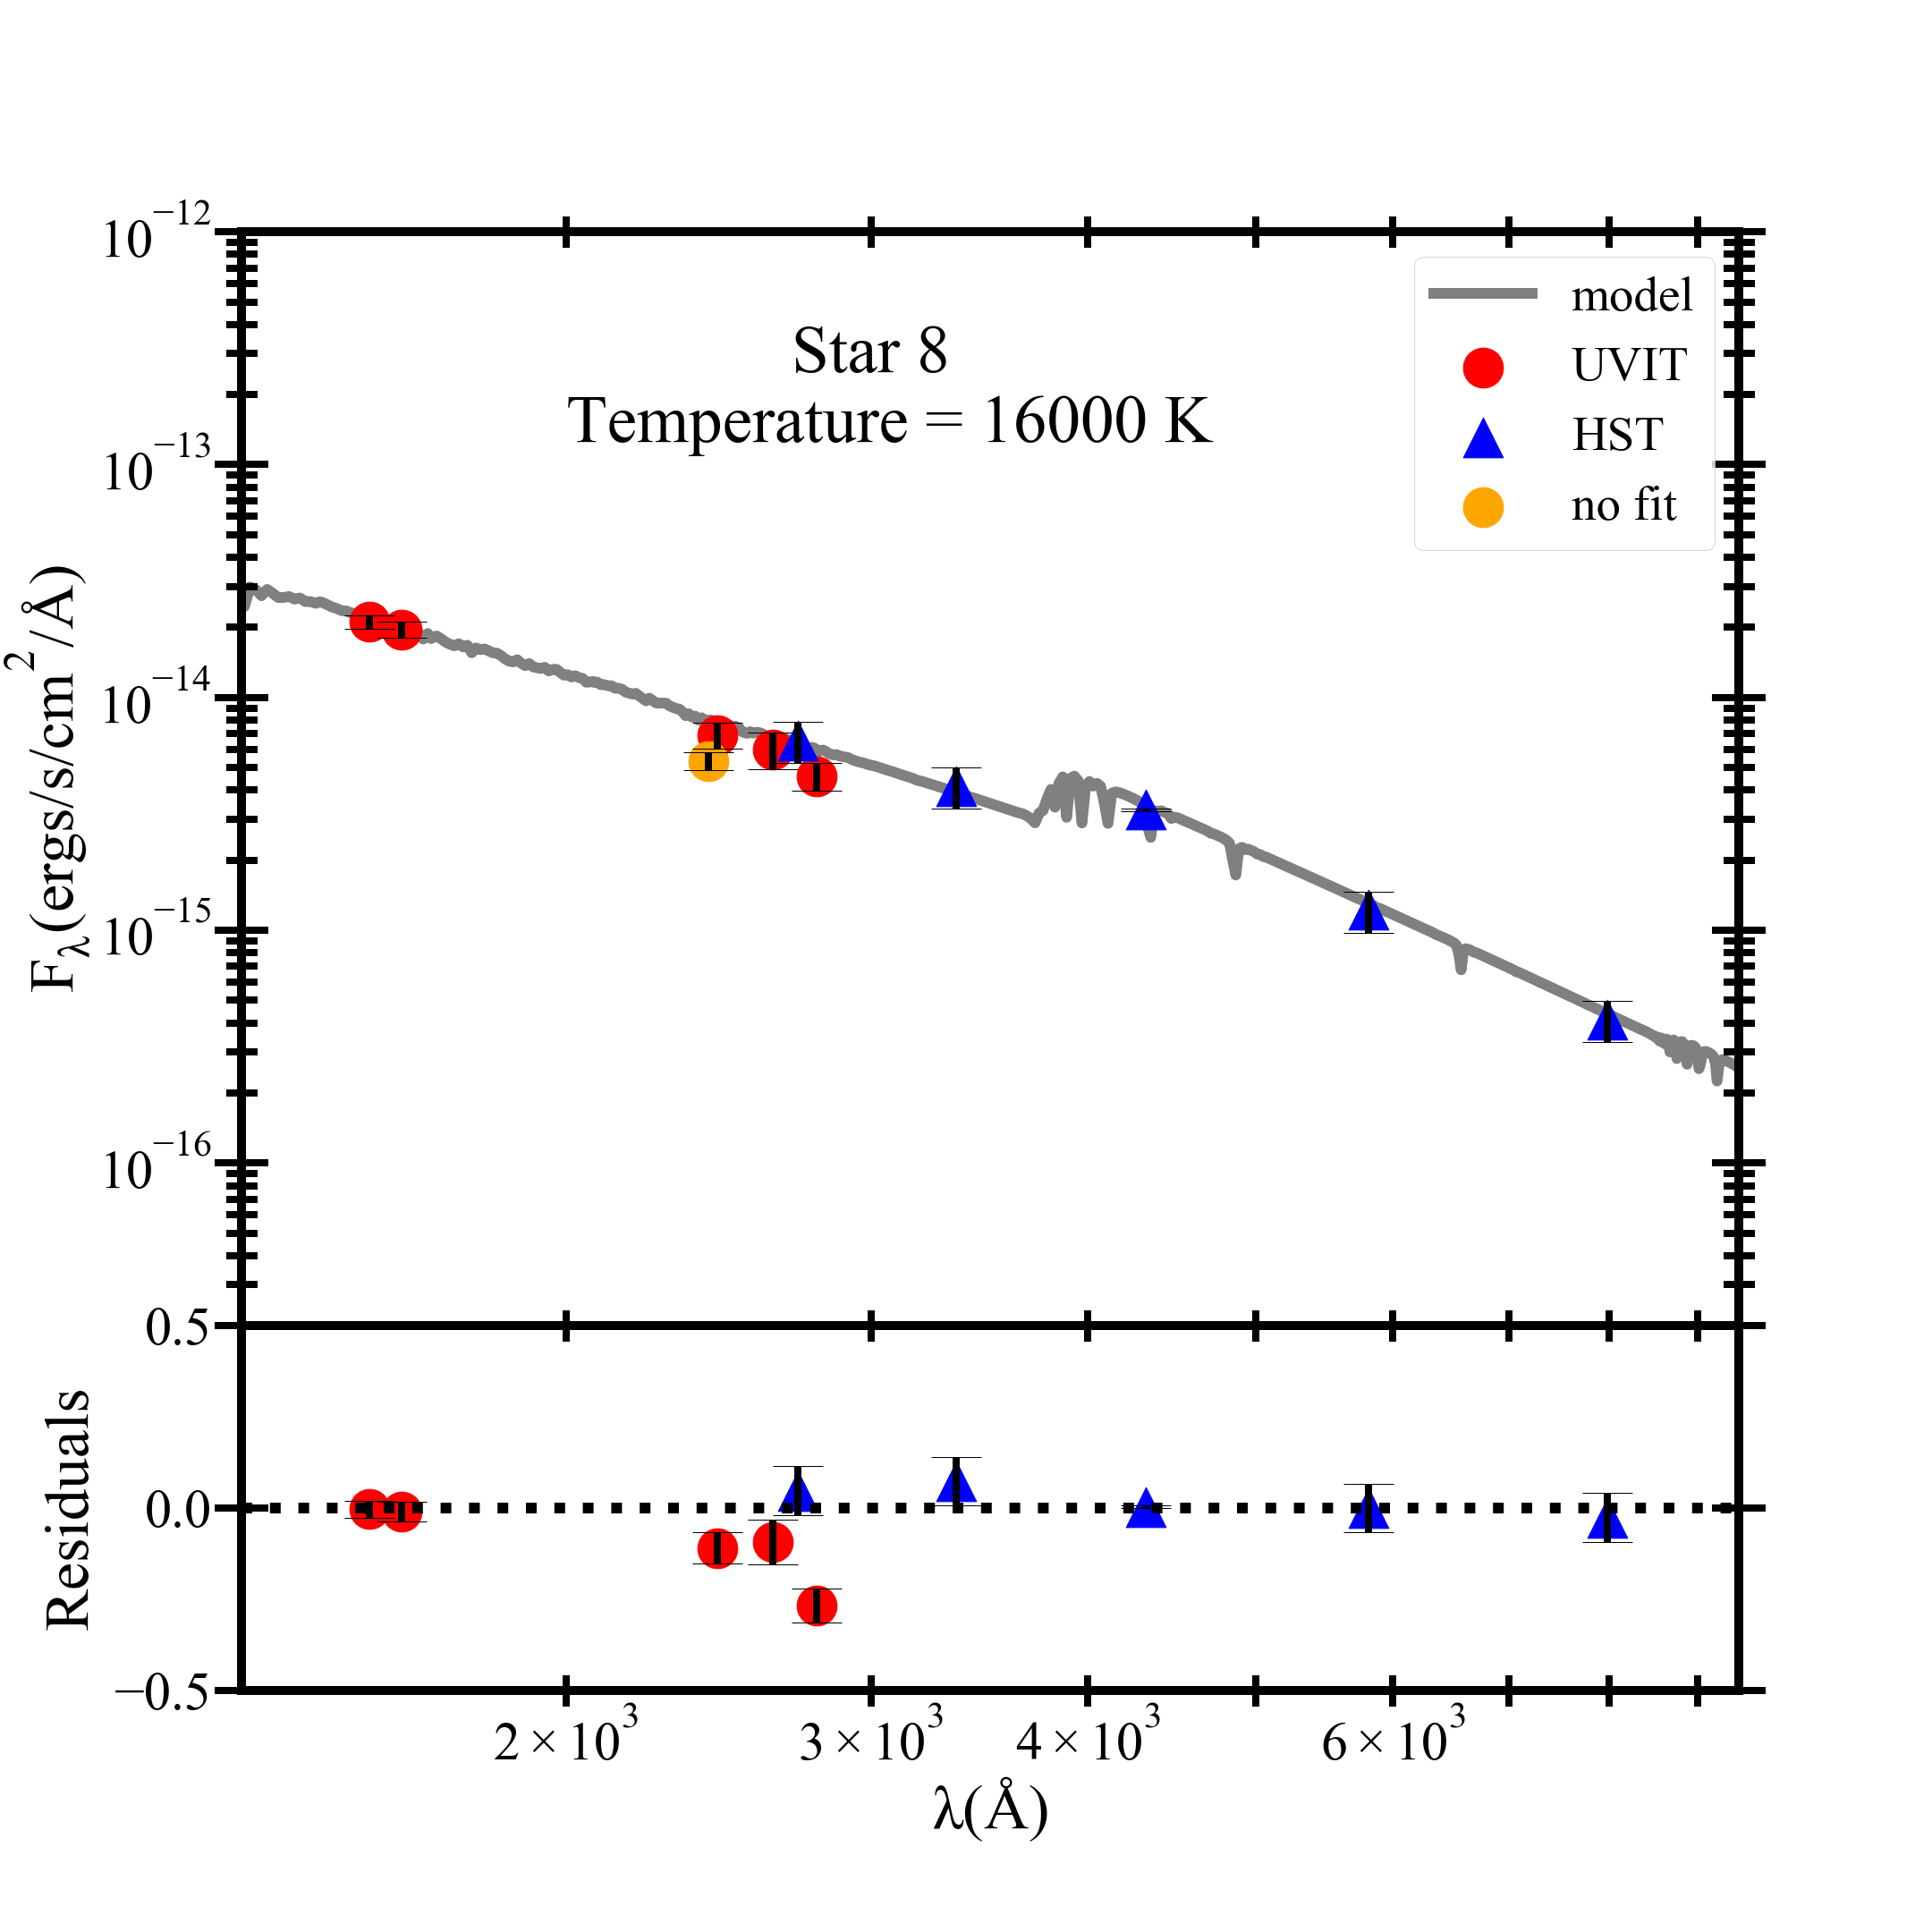
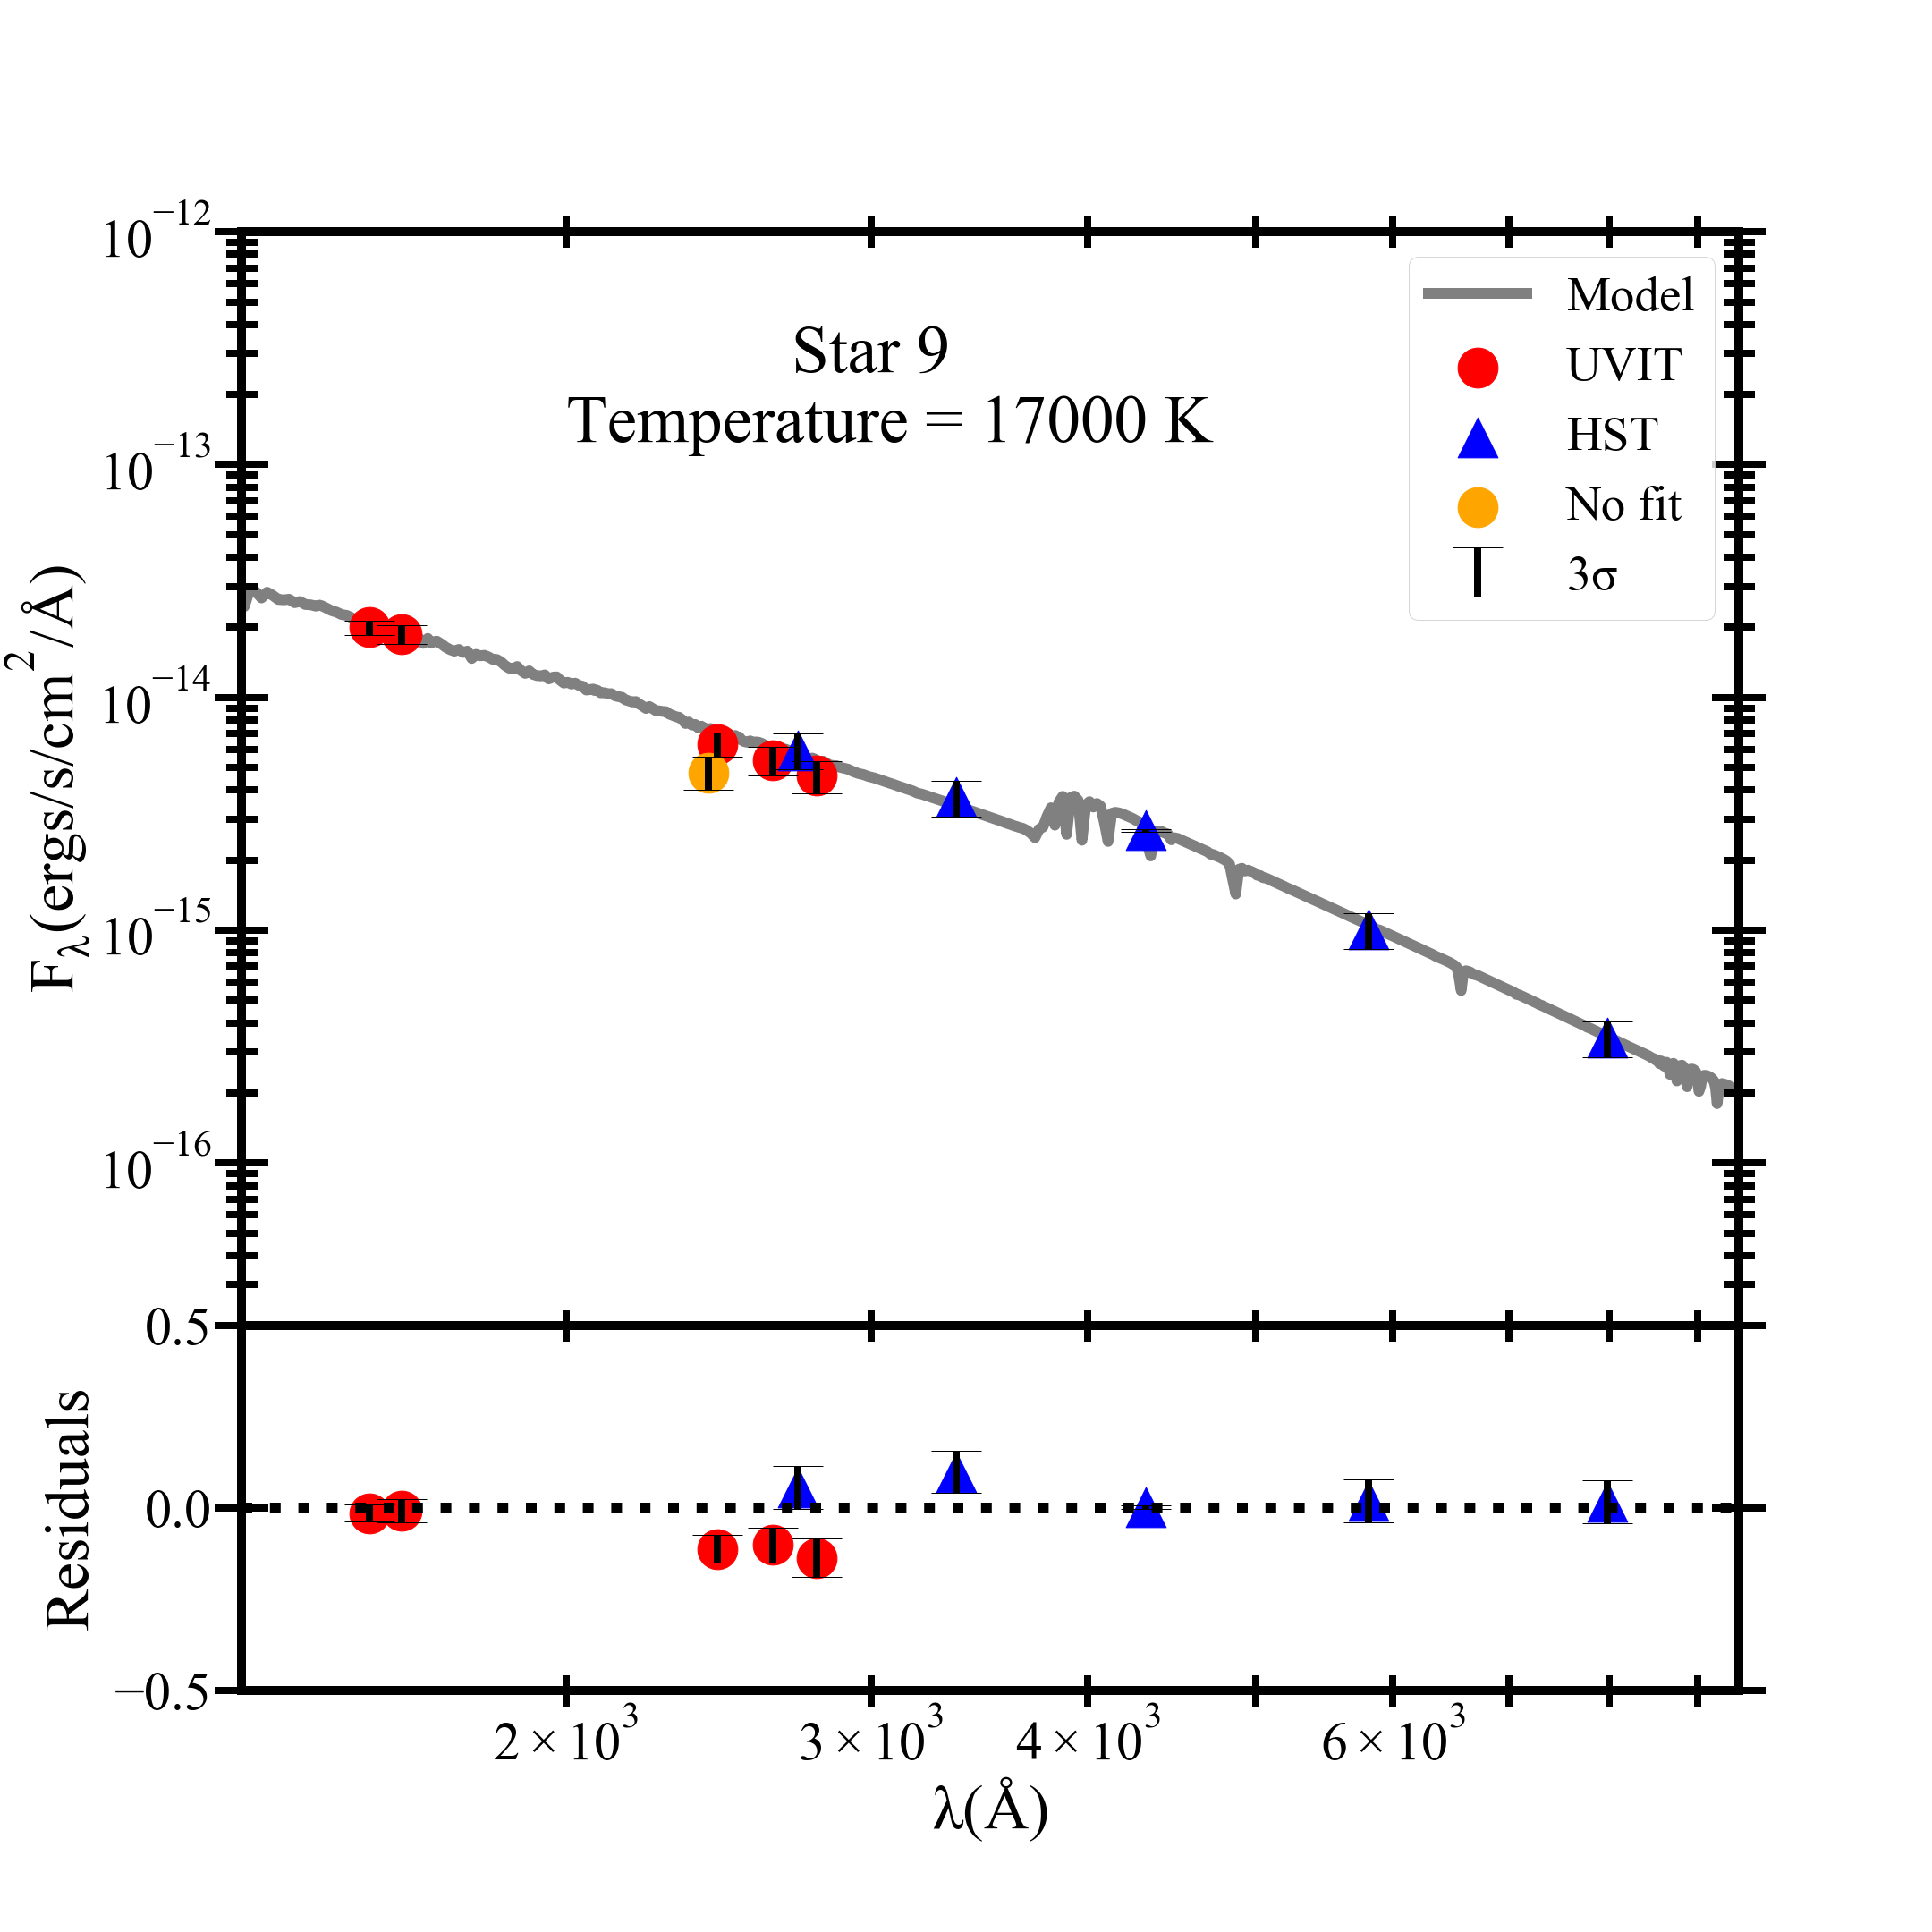
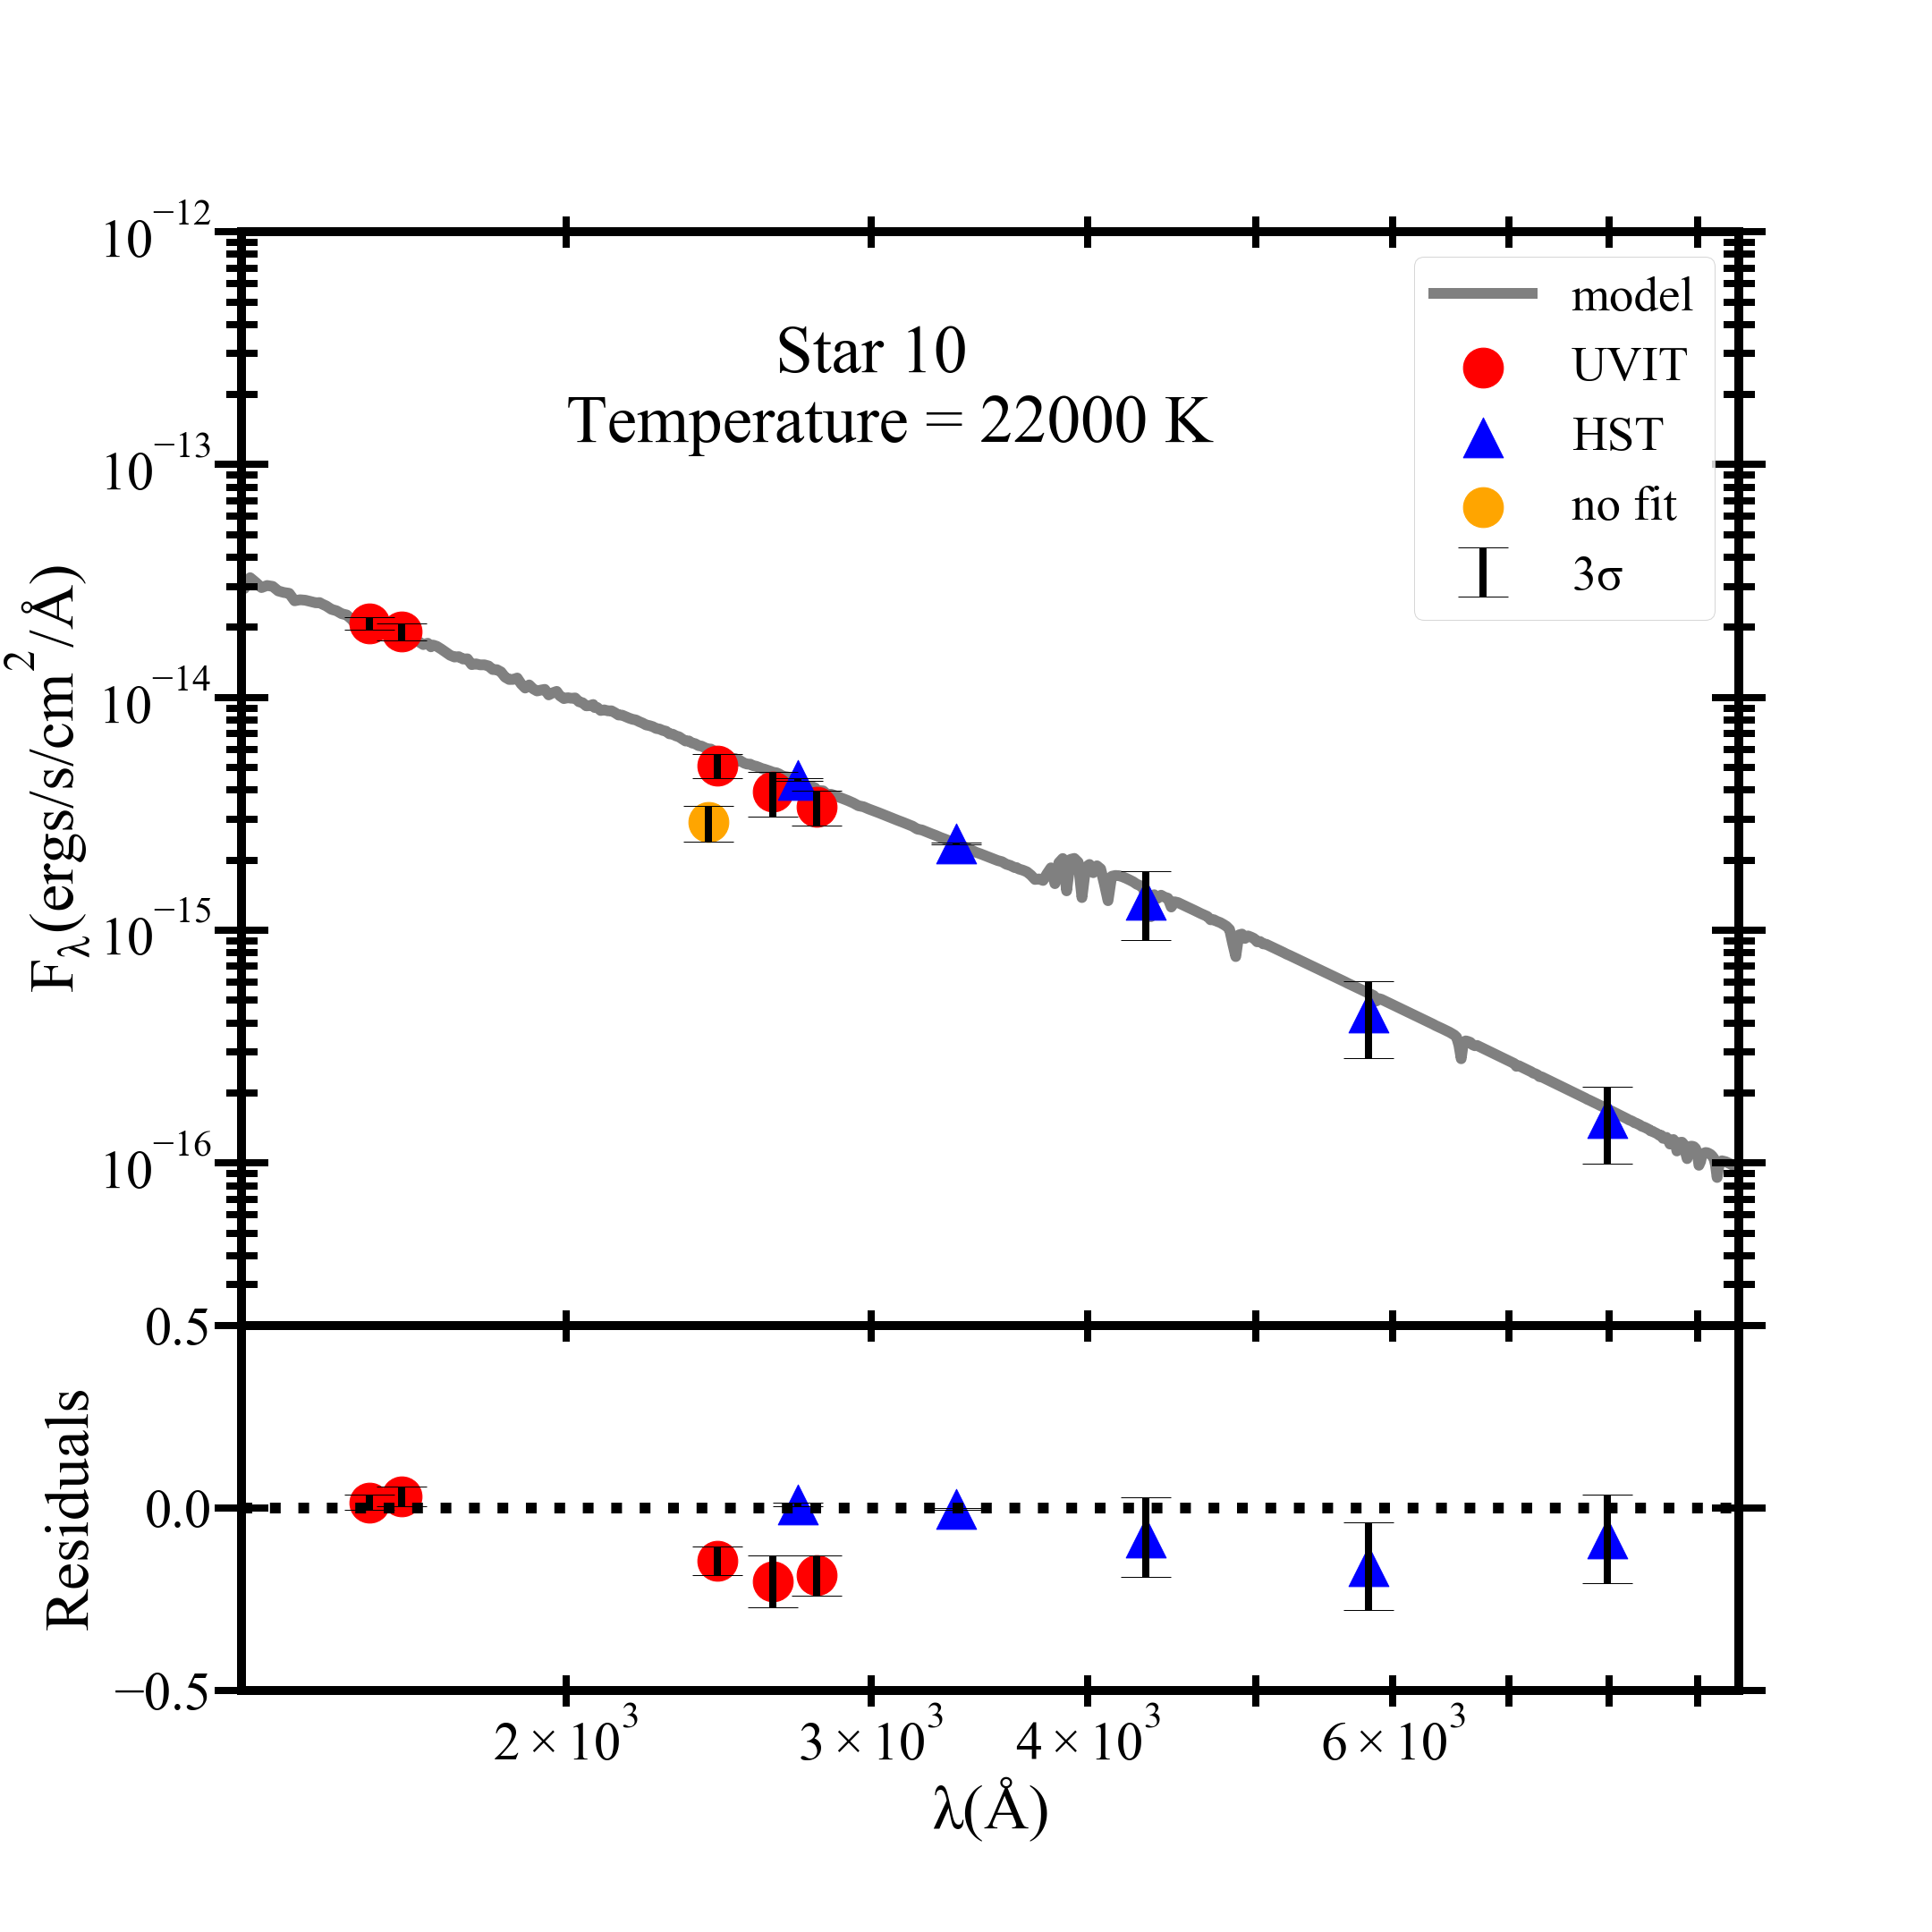
In order to estimate the parameters such as effective temperature (), luminosity (), and radius () of the UV-bright stars, their SEDs were constructed with the available photometric data points. For this purpose, a virtual observatory functionality, VOSA (VO SED Analyser; Bayo et al. 2008) was used. VOSA generates synthetic photometry for the chosen theoretical models using the transmission curves of the required photometric filters. The best-fit parameters of the SEDs were estimated by comparing the observed and synthetic photometric points using a minimization method. The value is calculated using the relation,
| (1) |
where N is the number of photometric points, is the number of fitted parameters for the model, is the observed flux, is the theoretical flux predicted by the model, is the multiplicative dilution factor (where is the radius of the star and D is the distance to the star) and is the error in the observed flux. We assumed a distance of D = 9.6 kpc and = 0.22 mag (H96), for all the stars in the cluster. VOSA uses the Fitzpatrick reddening relation (Fitzpatrick, 1999) to account for the extinction in the observed photometric points.
For all the UV-bright stars except two, we used the Kurucz stellar atmospheric models (Castelli et al., 1997; Castelli & Kurucz, 2003) and log g, [Fe/H] and are the possible free parameters for fitting the SED. In these models, the range of admissible values for the free parameters are 0.0 to 5.0 for log g, 2.5 to 0.5 for [Fe/H] and 3500 to 50000 K for . For the remaining two stars, i.e., Star 3 and Star 32 in Table 3, the Tübingen NLTE Model Atmosphere Package (TMAP Tübingen; Werner & Dreizler (1999); Werner et al. (2003); Rauch & Deetjen (2003)) was used as the Kurucz model parameter space was inadequate to fit the SEDs of these stars. The free parameters in these models include with range 30000 to 1000000 K, log g ranging from 3.8 to 9, and H, He mass fractions in the range 0 to 1.
To fit SEDs using Kurucz models, we fixed the [Fe/H] value at 1.0 dex, close to the value for the cluster. Additionally, we constrained the log g to range from 3 to 5 for Kurucz models and 3.8 to 6 for the TMAP models. This is the observed range of log g values for stars in pHB evolutionary phases from previous studies (Moehler et al., 2019). The important parameters obtained from SED analysis are tabulated in Table 3. For the two stars fitted with TMAP models, the best-fit values of H, He mass fractions, respectively, are : 0.7383, 0.2495 for Star 3 and 0.8, 0.2 for Star 32. However, we note that SED fitting is not the optimal method to estimate the above parameters. We do not quote the log g values obtained from the SED fits as the SED fitting technique does not provide accurate values of this parameter.
\topruleID R.A. Decl. Model Phot. used (deg) (deg) (K) (K) \topruleStar 1 137.96181 -64.84165 Kurucz 27000 500 50.80 0.27 0.33 0.01 7.58 11 FUV, NUV, opt. Star 2 138.02575 -64.84307 Kurucz 21000 500 352.95 1.53 1.42 0.07 8.21 10 FUV, NUV, opt. Star 3 138.06046 -64.86146 TMAP 80000 3750 2857.45 0.88 0.28 0.03 3.31 8 FUV, NUV, opt. Star 4 138.05040 -64.84379 Kurucz 39000 500 781.10 0.95 0.61 0.02 4.51 9 FUV, NUV, opt. Star 5 138.04719 -64.87492 Kurucz 27000 500 59.54 0.25 0.35 0.01 2.34 10 FUV, NUV, opt. Star 6 138.06813 -64.86459 Kurucz 12500 125 108.50 1.11 2.20 0.04 6.86 11 FUV, NUV, opt. Star 7 138.05264 -64.86779 Kurucz 22000 500 85.73 0.44 0.64 0.03 3.36 9 FUV, NUV, opt. Star 8 138.04842 -64.84887 Kurucz 16000 500 117.20 0.96 1.41 0.09 6.44 10 FUV, NUV, opt. Star 9 138.04760 -64.85790 Kurucz 17000 500 109.80 0.78 1.21 0.07 3.50 10 FUV, NUV, opt. Star 10 138.03820 -64.87028 Kurucz 22000 500 106.20 0.62 0.71 0.03 5.78 10 FUV, NUV, opt. Star 11 137.96088 -64.85092 Kurucz 26000 500 79.93 0.32 0.44 0.02 3.94 9 FUV, NUV, opt. Star 12 138.02716 -64.86694 Kurucz 25000 500 102.60 0.87 0.54 0.02 0.10 7 FUV, NUV, opt. Star 13 138.01470 -64.85891 Kurucz 15000 500 128.83 2.02 1.68 0.11 0.09 7 FUV, NUV, opt. Star 14 138.01349 -64.86046 Kurucz 27000 500 86.65 0.09 0.42 0.02 4.86 7 FUV, NUV, opt. Star 15 138.01173 -64.86674 Kurucz 26000 500 131.15 0.22 0.56 0.02 1.59 7 FUV, NUV, opt. Star 16 138.03578 -64.86580 Kurucz 23000 500 54.90 0.04 0.47 0.02 1.39 5 NUV, opt. Star 17 138.03122 -64.85554 Kurucz 25000 500 41.40 0.02 0.34 0.01 8.76 5 NUV, opt. Star 18 138.03010 -64.86050 Kurucz 22000 500 211.00 0.07 1.00 0.05 6.01 5 NUV, opt. Star 19 138.02244 -64.87728 Kurucz 45000 500 633.00 0.10 0.41 0.01 1.33 5 NUV, opt. Star 20 138.01776 -64.87794 Kurucz 27000 500 72.00 0.03 0.39 0.01 1.98 5 NUV, opt. Star 21 138.01103 -64.87463 Kurucz 24000 500 49.30 0.08 0.41 0.02 3.75 5 NUV, opt. Star 22 138.00244 -64.87014 Kurucz 22000 500 102.00 0.69 0.69 0.03 0.02 5 NUV, opt. Star 23 138.00133 -64.86623 Kurucz 50000 500 113.00 0.02 0.14 0.00 4.61 5 NUV, opt. Star 24 137.99932 -64.85673 Kurucz 50000 500 97.80 0.13 0.13 0.00 3.77 5 NUV, opt. Star 25 137.99187 -64.87307 Kurucz 35000 500 56.10 0.18 0.20 0.01 0.33 5 NUV, opt. Star 26 137.99182 -64.85956 Kurucz 27000 500 67.70 0.32 0.38 0.01 0.11 5 NUV, opt. Star 27 137.96443 -64.86377 Kurucz 50000 500 988.00 1.22 0.42 0.01 0.26 5 NUV, opt. Star 28 137.85352 -64.87929 Kurucz 26000 500 65.36 0.97 0.39 0.02 2.58 15 FUV, NUV, opt. Star 29 137.92453 -64.70158 Kurucz 32000 500 145.80 1.09 0.39 0.01 2.66 15 FUV, NUV, opt. Star 30 138.08369 -64.84865 Kurucz 25000 500 98.59 1.03 0.52 0.02 2.89 13 FUV, NUV, opt. Star 31 138.00728 -64.79293 Kurucz 23000 500 251.00 2.12 0.99 0.04 4.49 14 FUV, NUV, opt. Star 32 137.99974 -64.89071 TMAP 100000 5000 3010.25 1.20 0.18 0.02 9.06 12 FUV, NUV, opt. Star 33 138.02306 -64.89646 Kurucz 26000 500 53.26 0.51 0.36 0.01 2.39 11 FUV, NUV, opt. Star 34 138.09187 -64.87727 Kurucz 24000 500 119.91 0.75 0.63 0.03 4.40 11 FUV, NUV, opt. \toprule
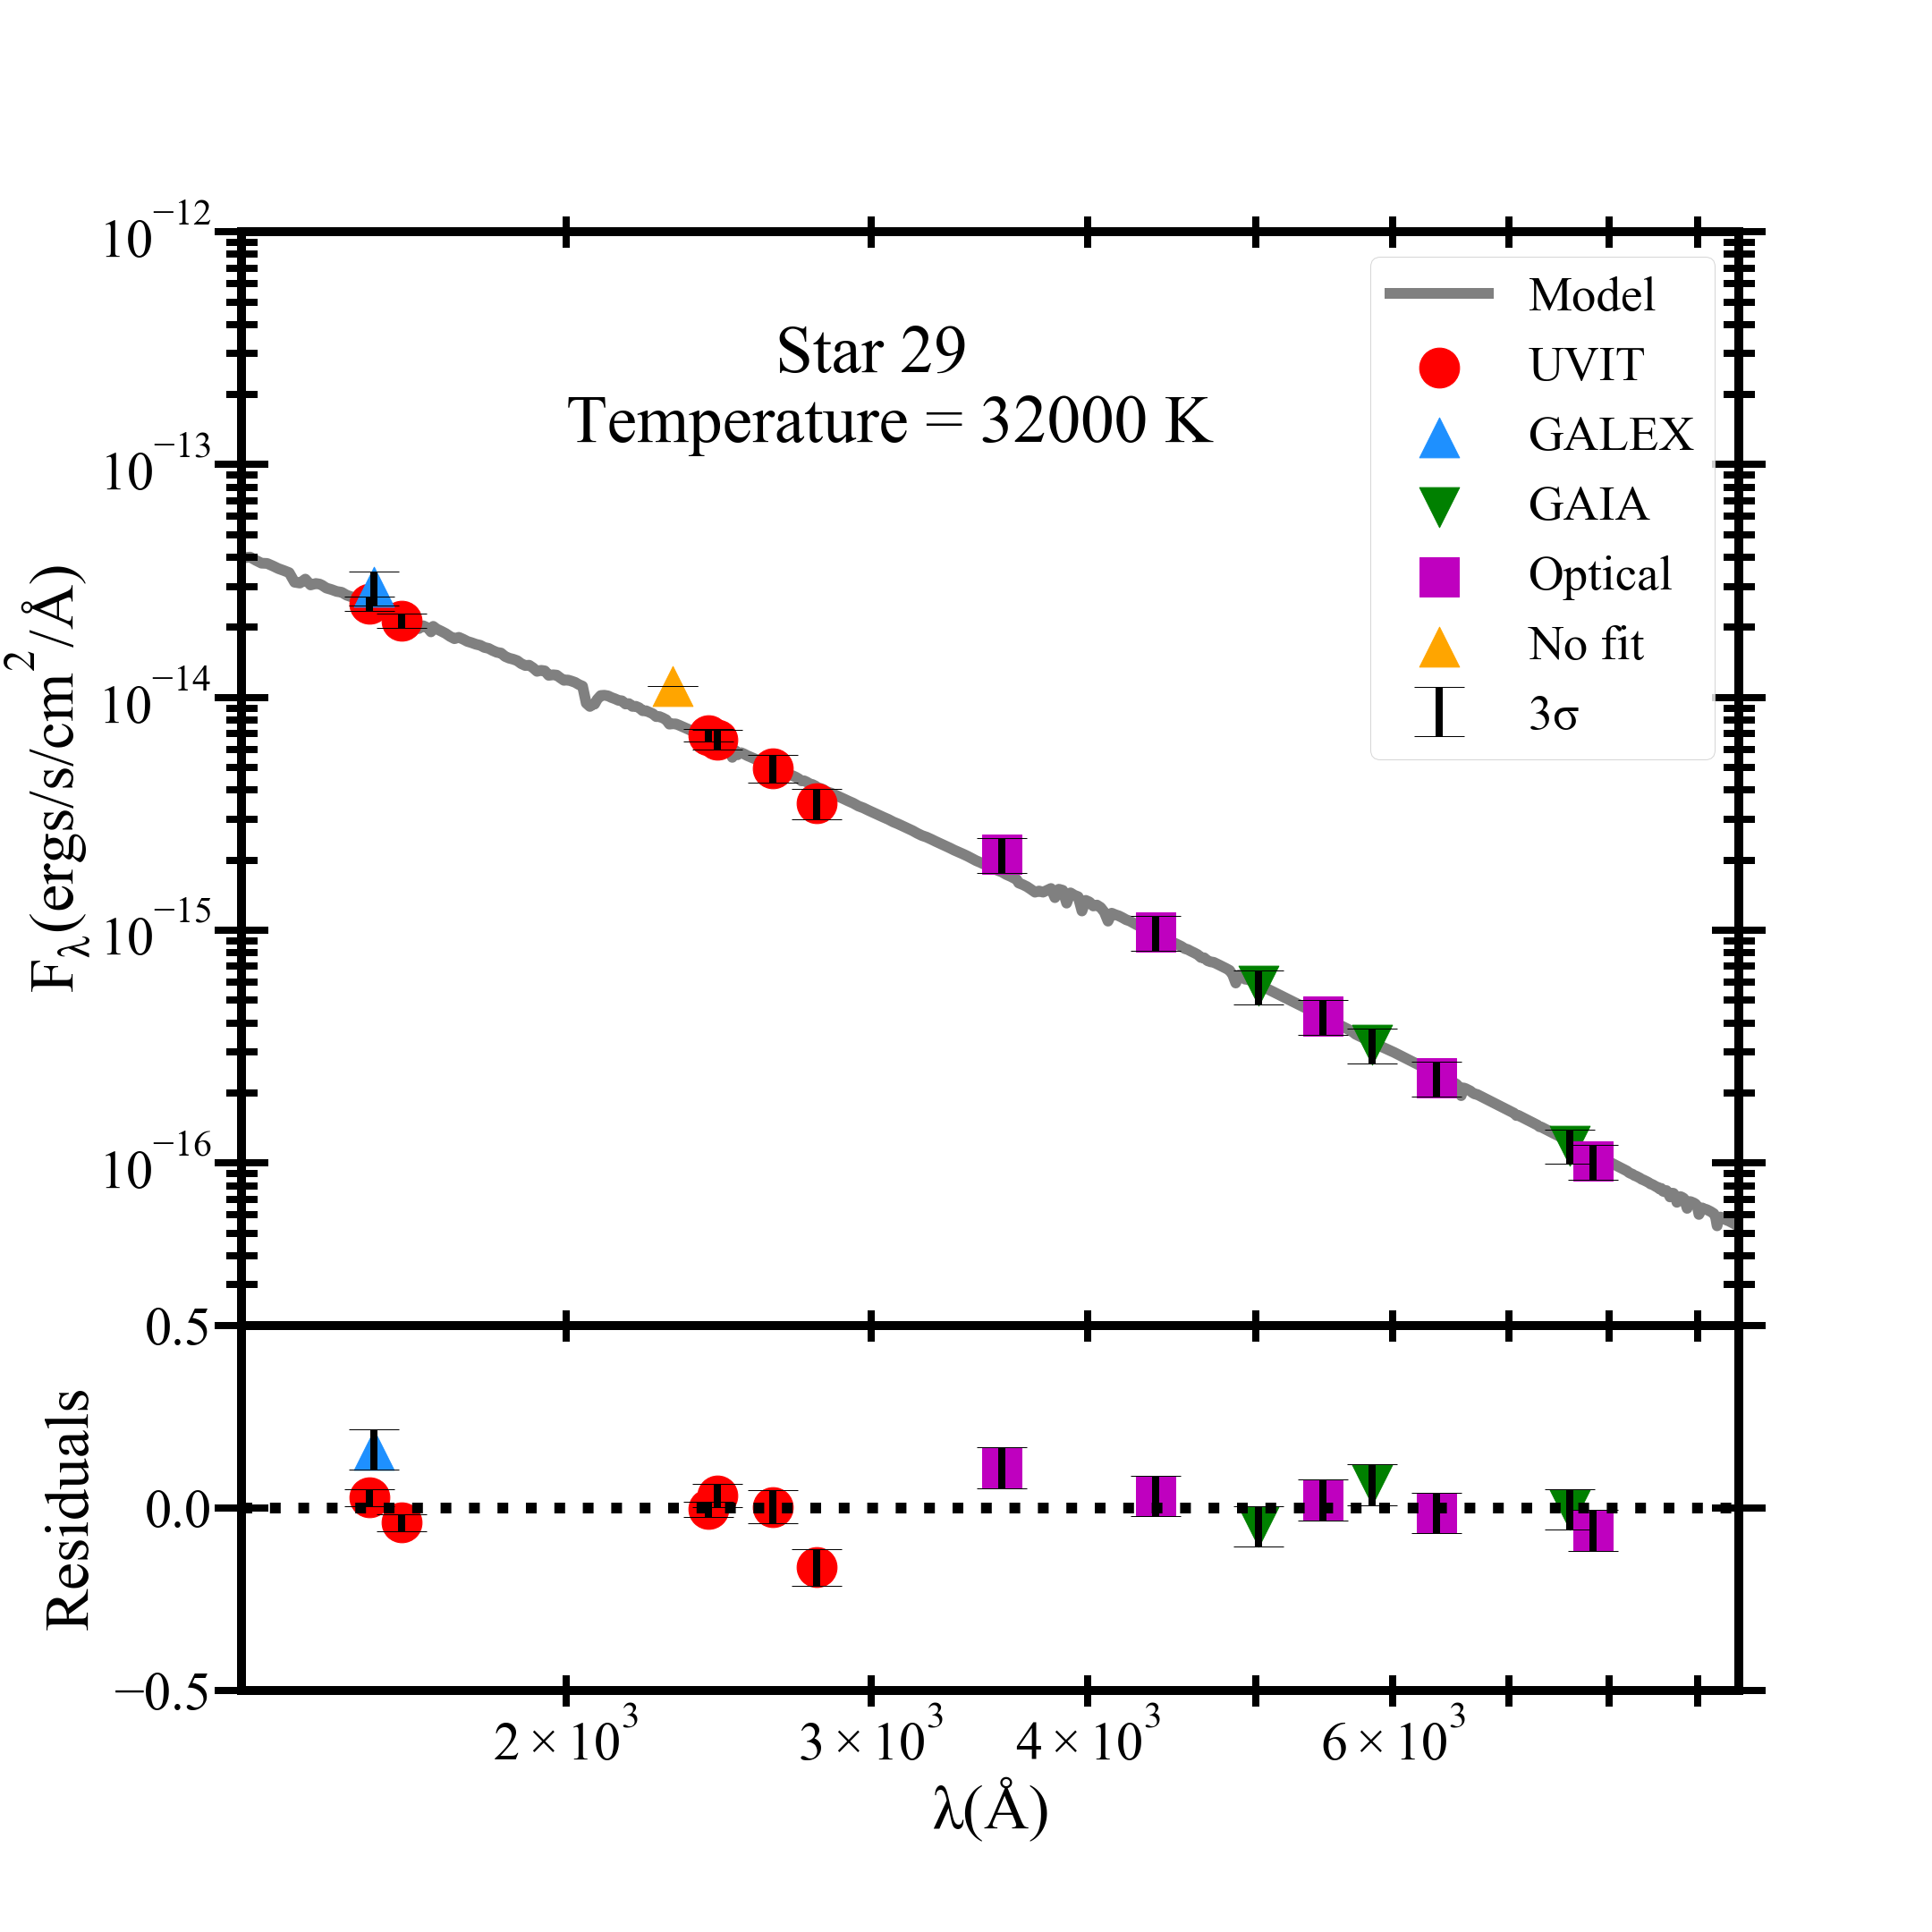
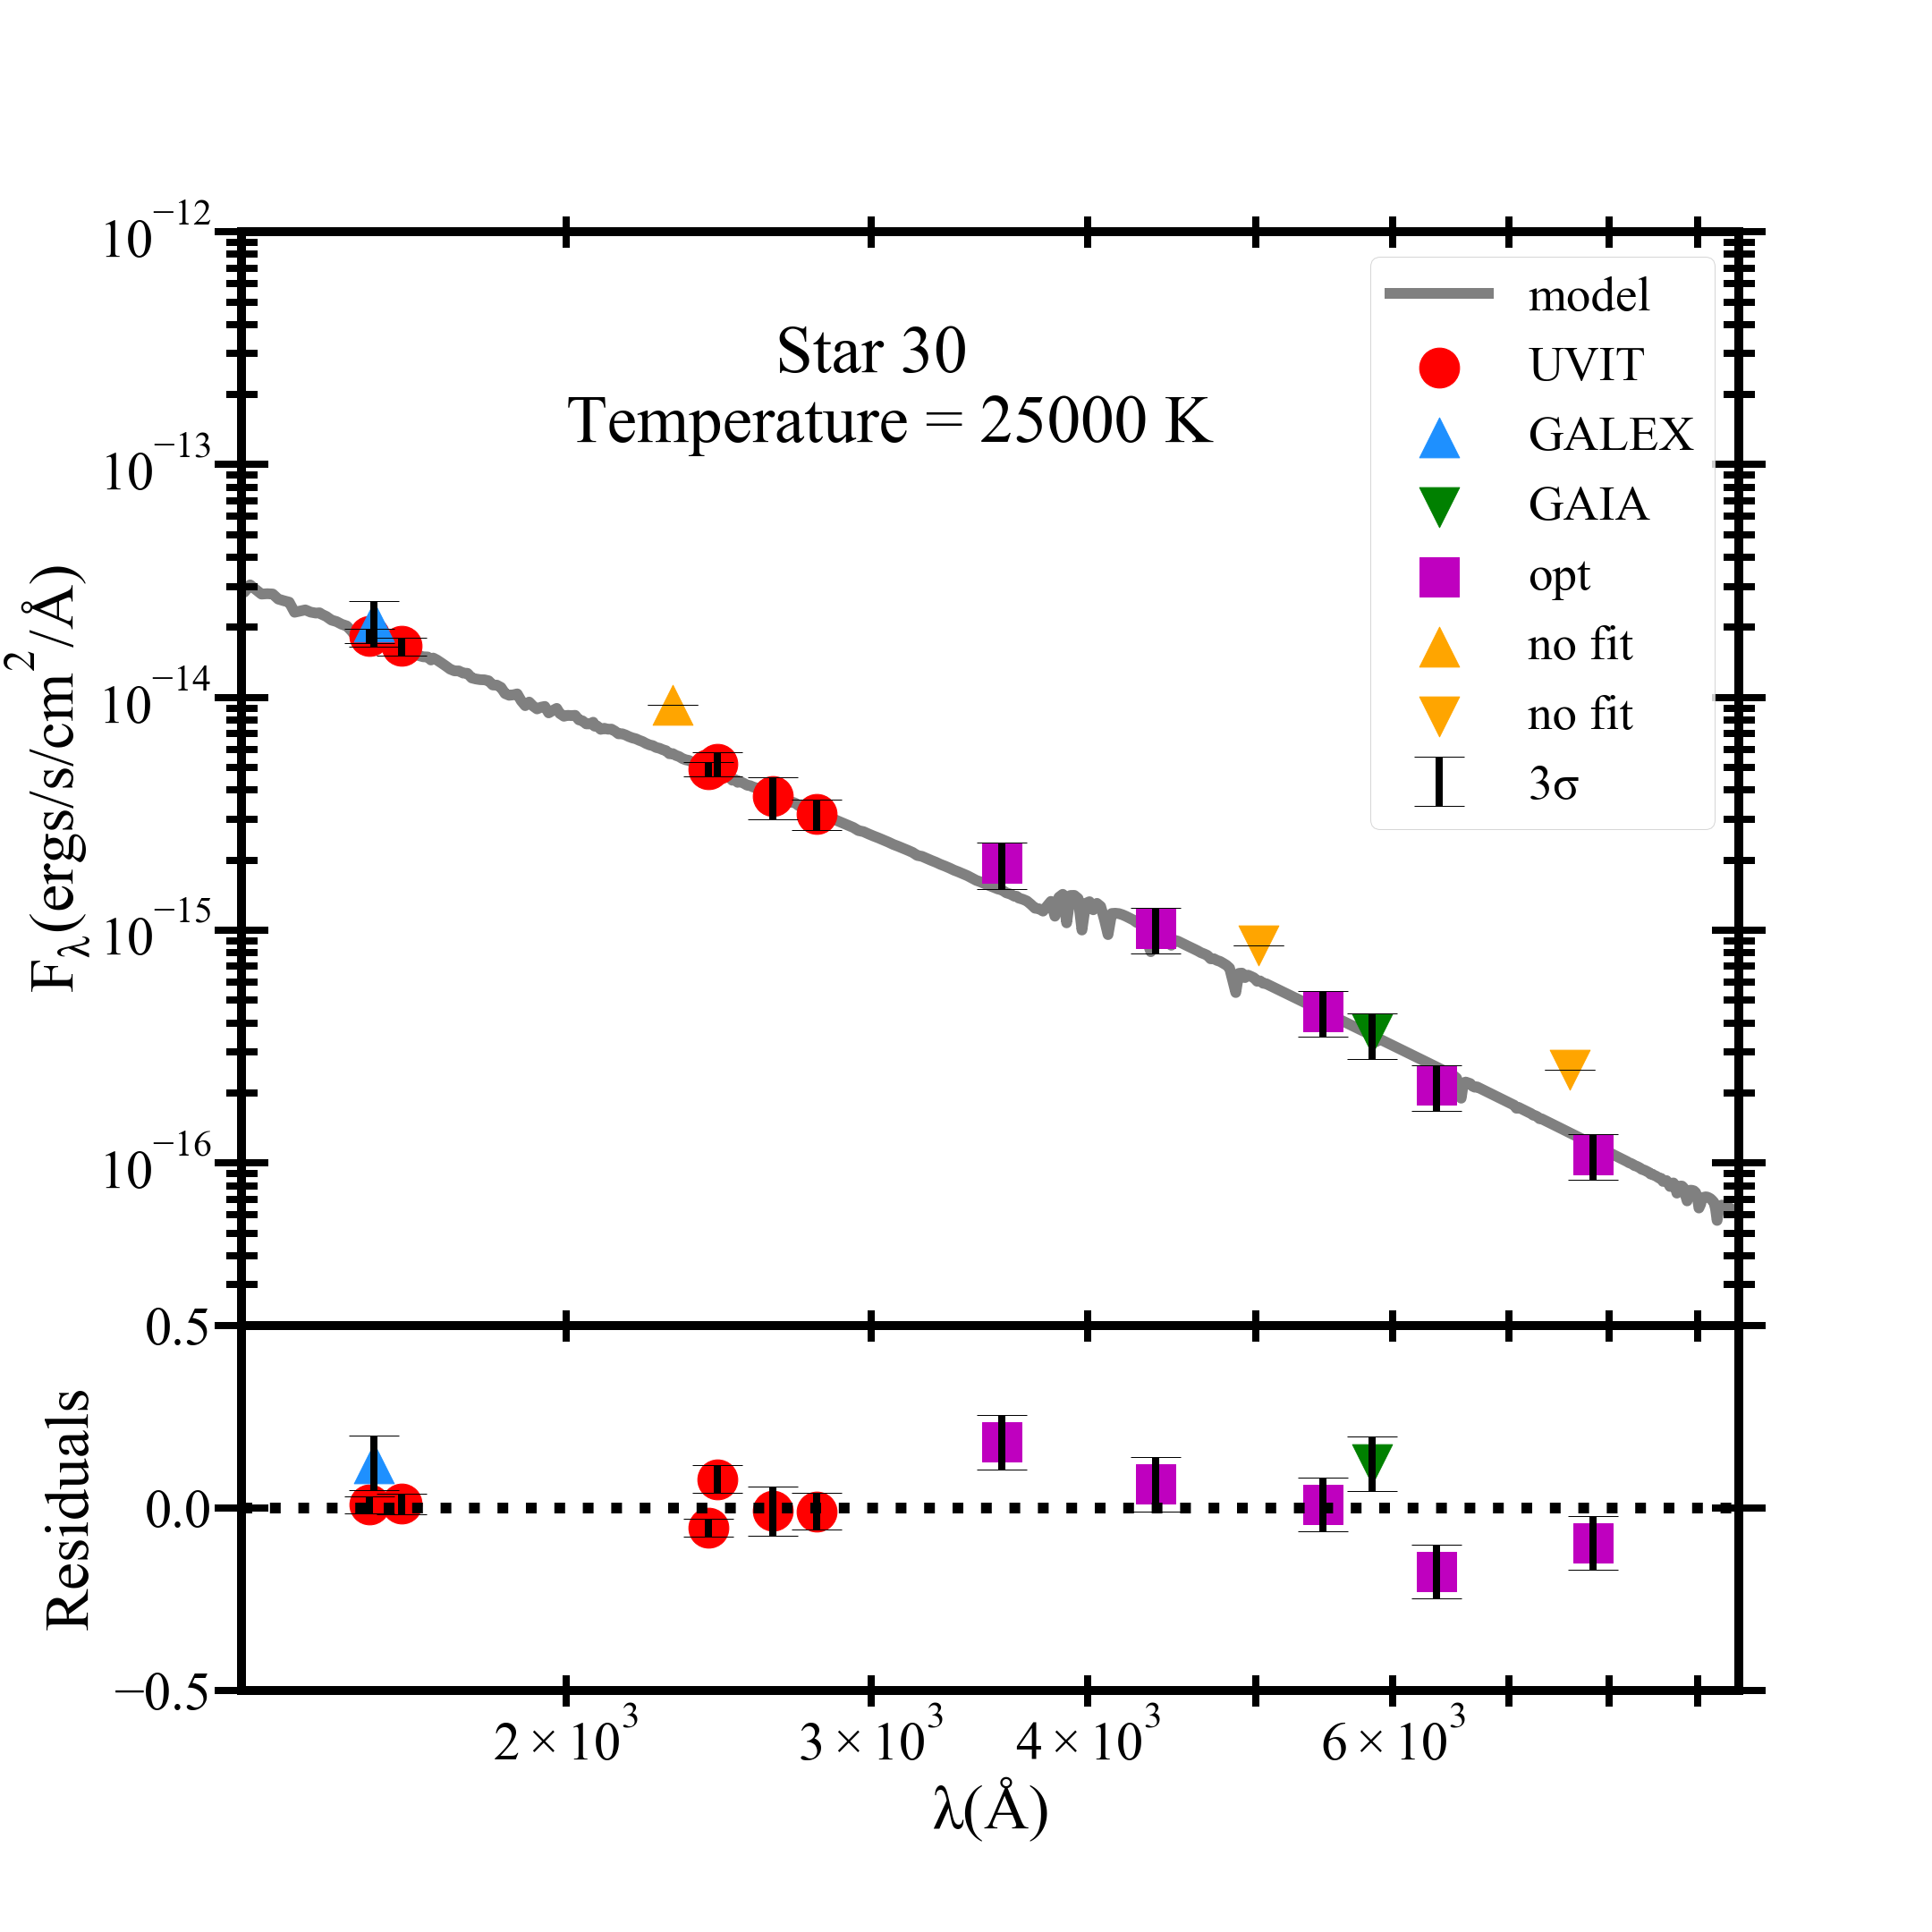
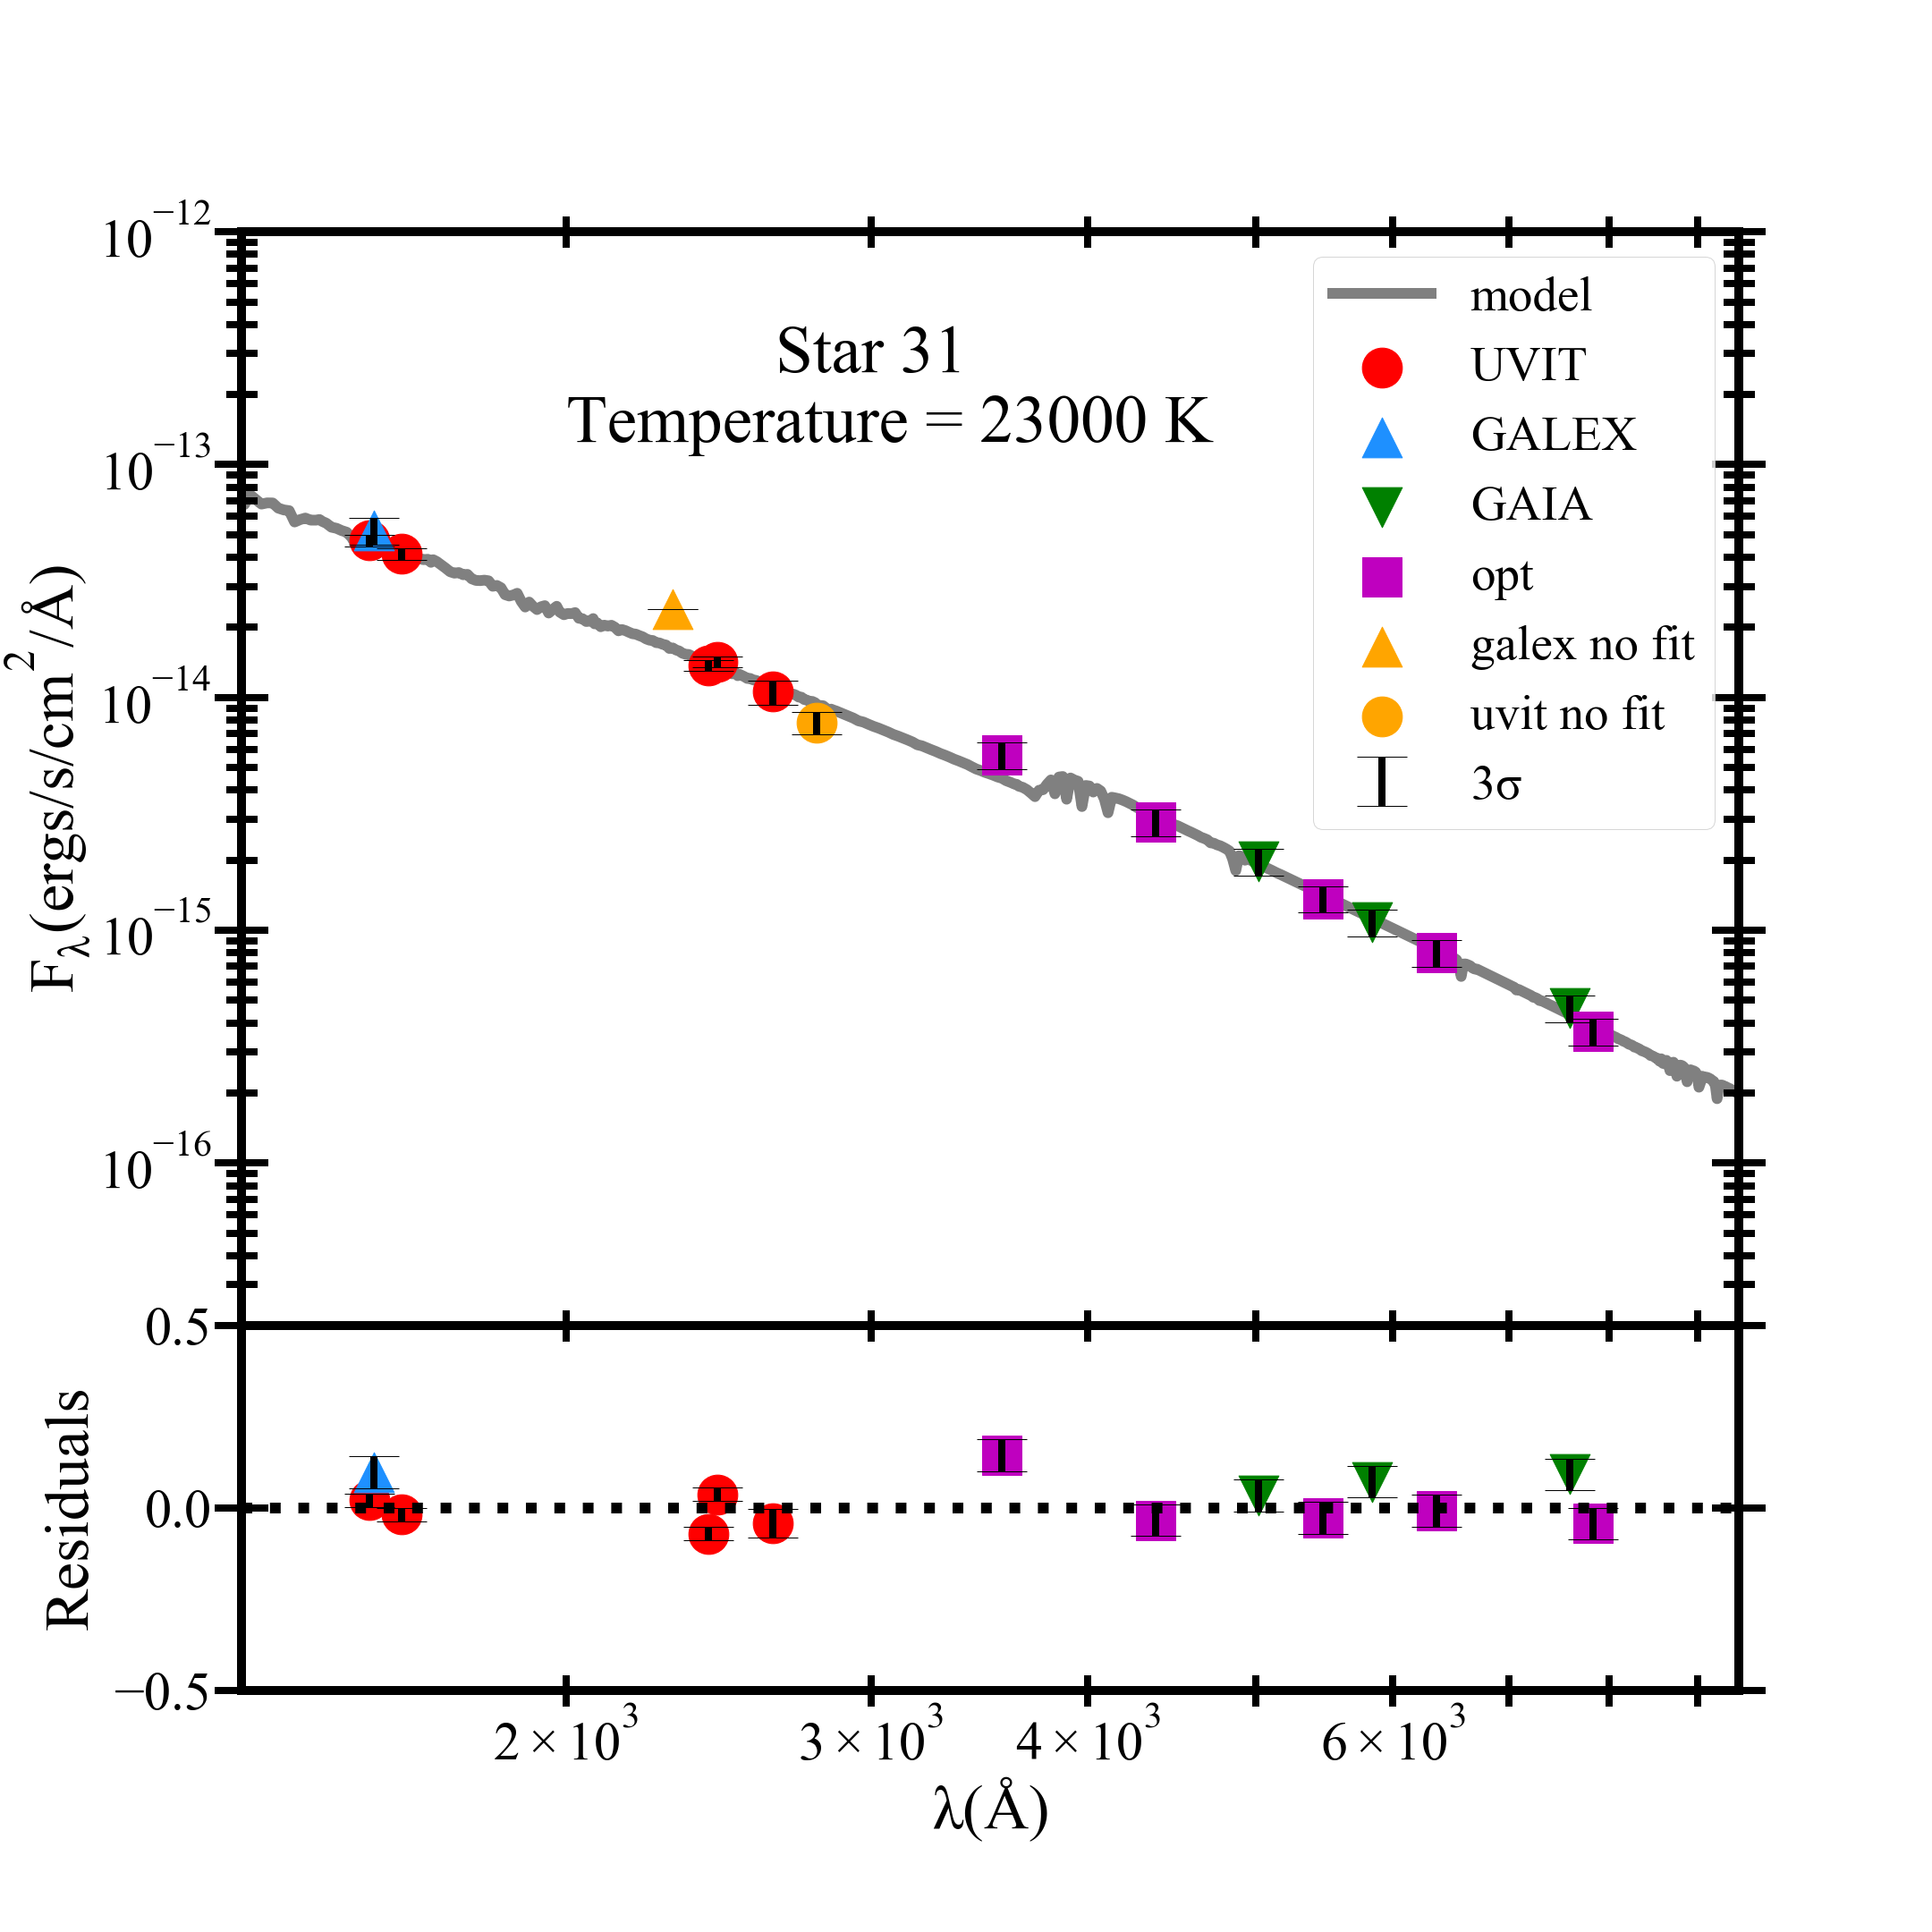
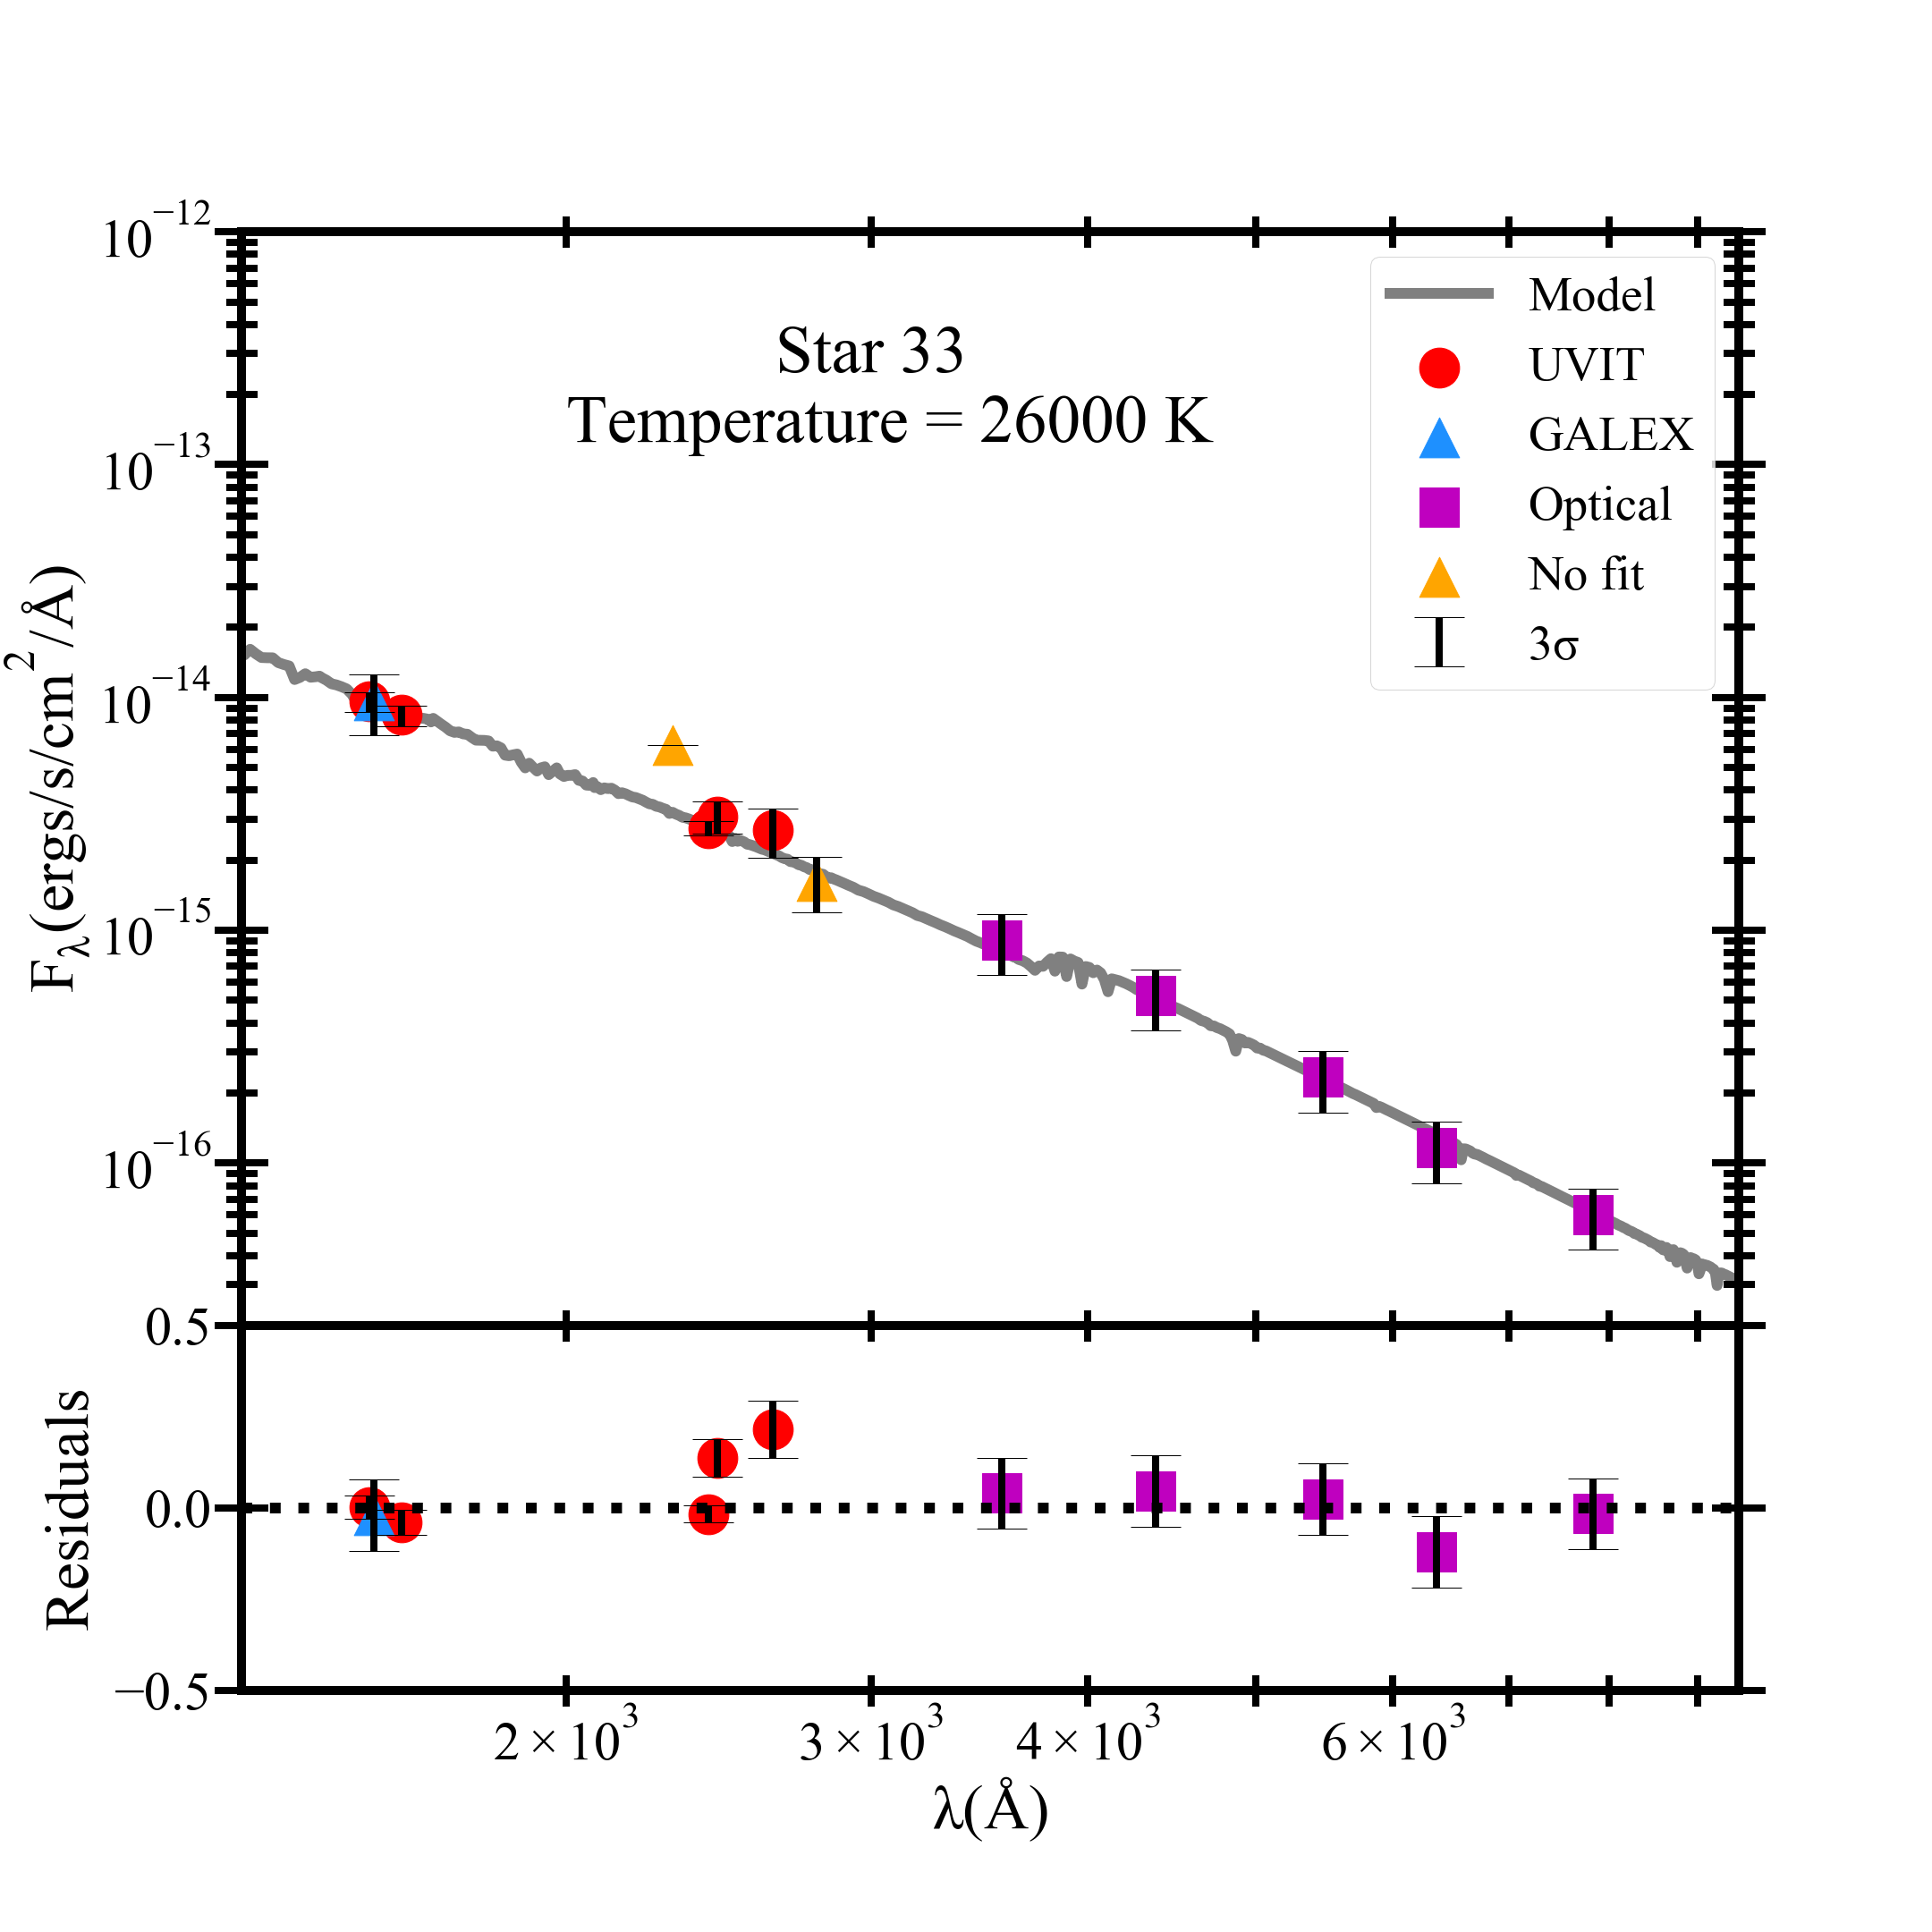
The SEDs for stars 1 to 11 contain the UVIT (FUV, NUV) and the HST (NUV, optical) photometric data points. Stars 12 to 26, lying within the inner region of the cluster, could not be resolved by the UVIT. Hence, only the HST photometry was used to construct the SEDs of these stars. Four stars among these, namely, Stars 12, 13, 14 and 15, have the HST STIS photometry (FUV, NUV) from Brown et al. (2001) apart from the NUV and optical HUGS data. For stars 27 to 34, which lie outside the HST FOV, we utilize the UVIT, GALEX (Schiavon et al., 2012), Gaia and ground-based optical data for SED generation. Examples of SED fits for star 3 and star 27 are shown in Figure 11. The SEDs for the other UVIT-resolved stars are shown in the appendix (Figure The First Extensive Exploration of UV-bright Stars in the Globular Cluster NGC 2808). The residuals shown in these plots were calculated for each data point as follows :
| (2) |
where and are the observed and model fluxes corresponding to the photometric points.
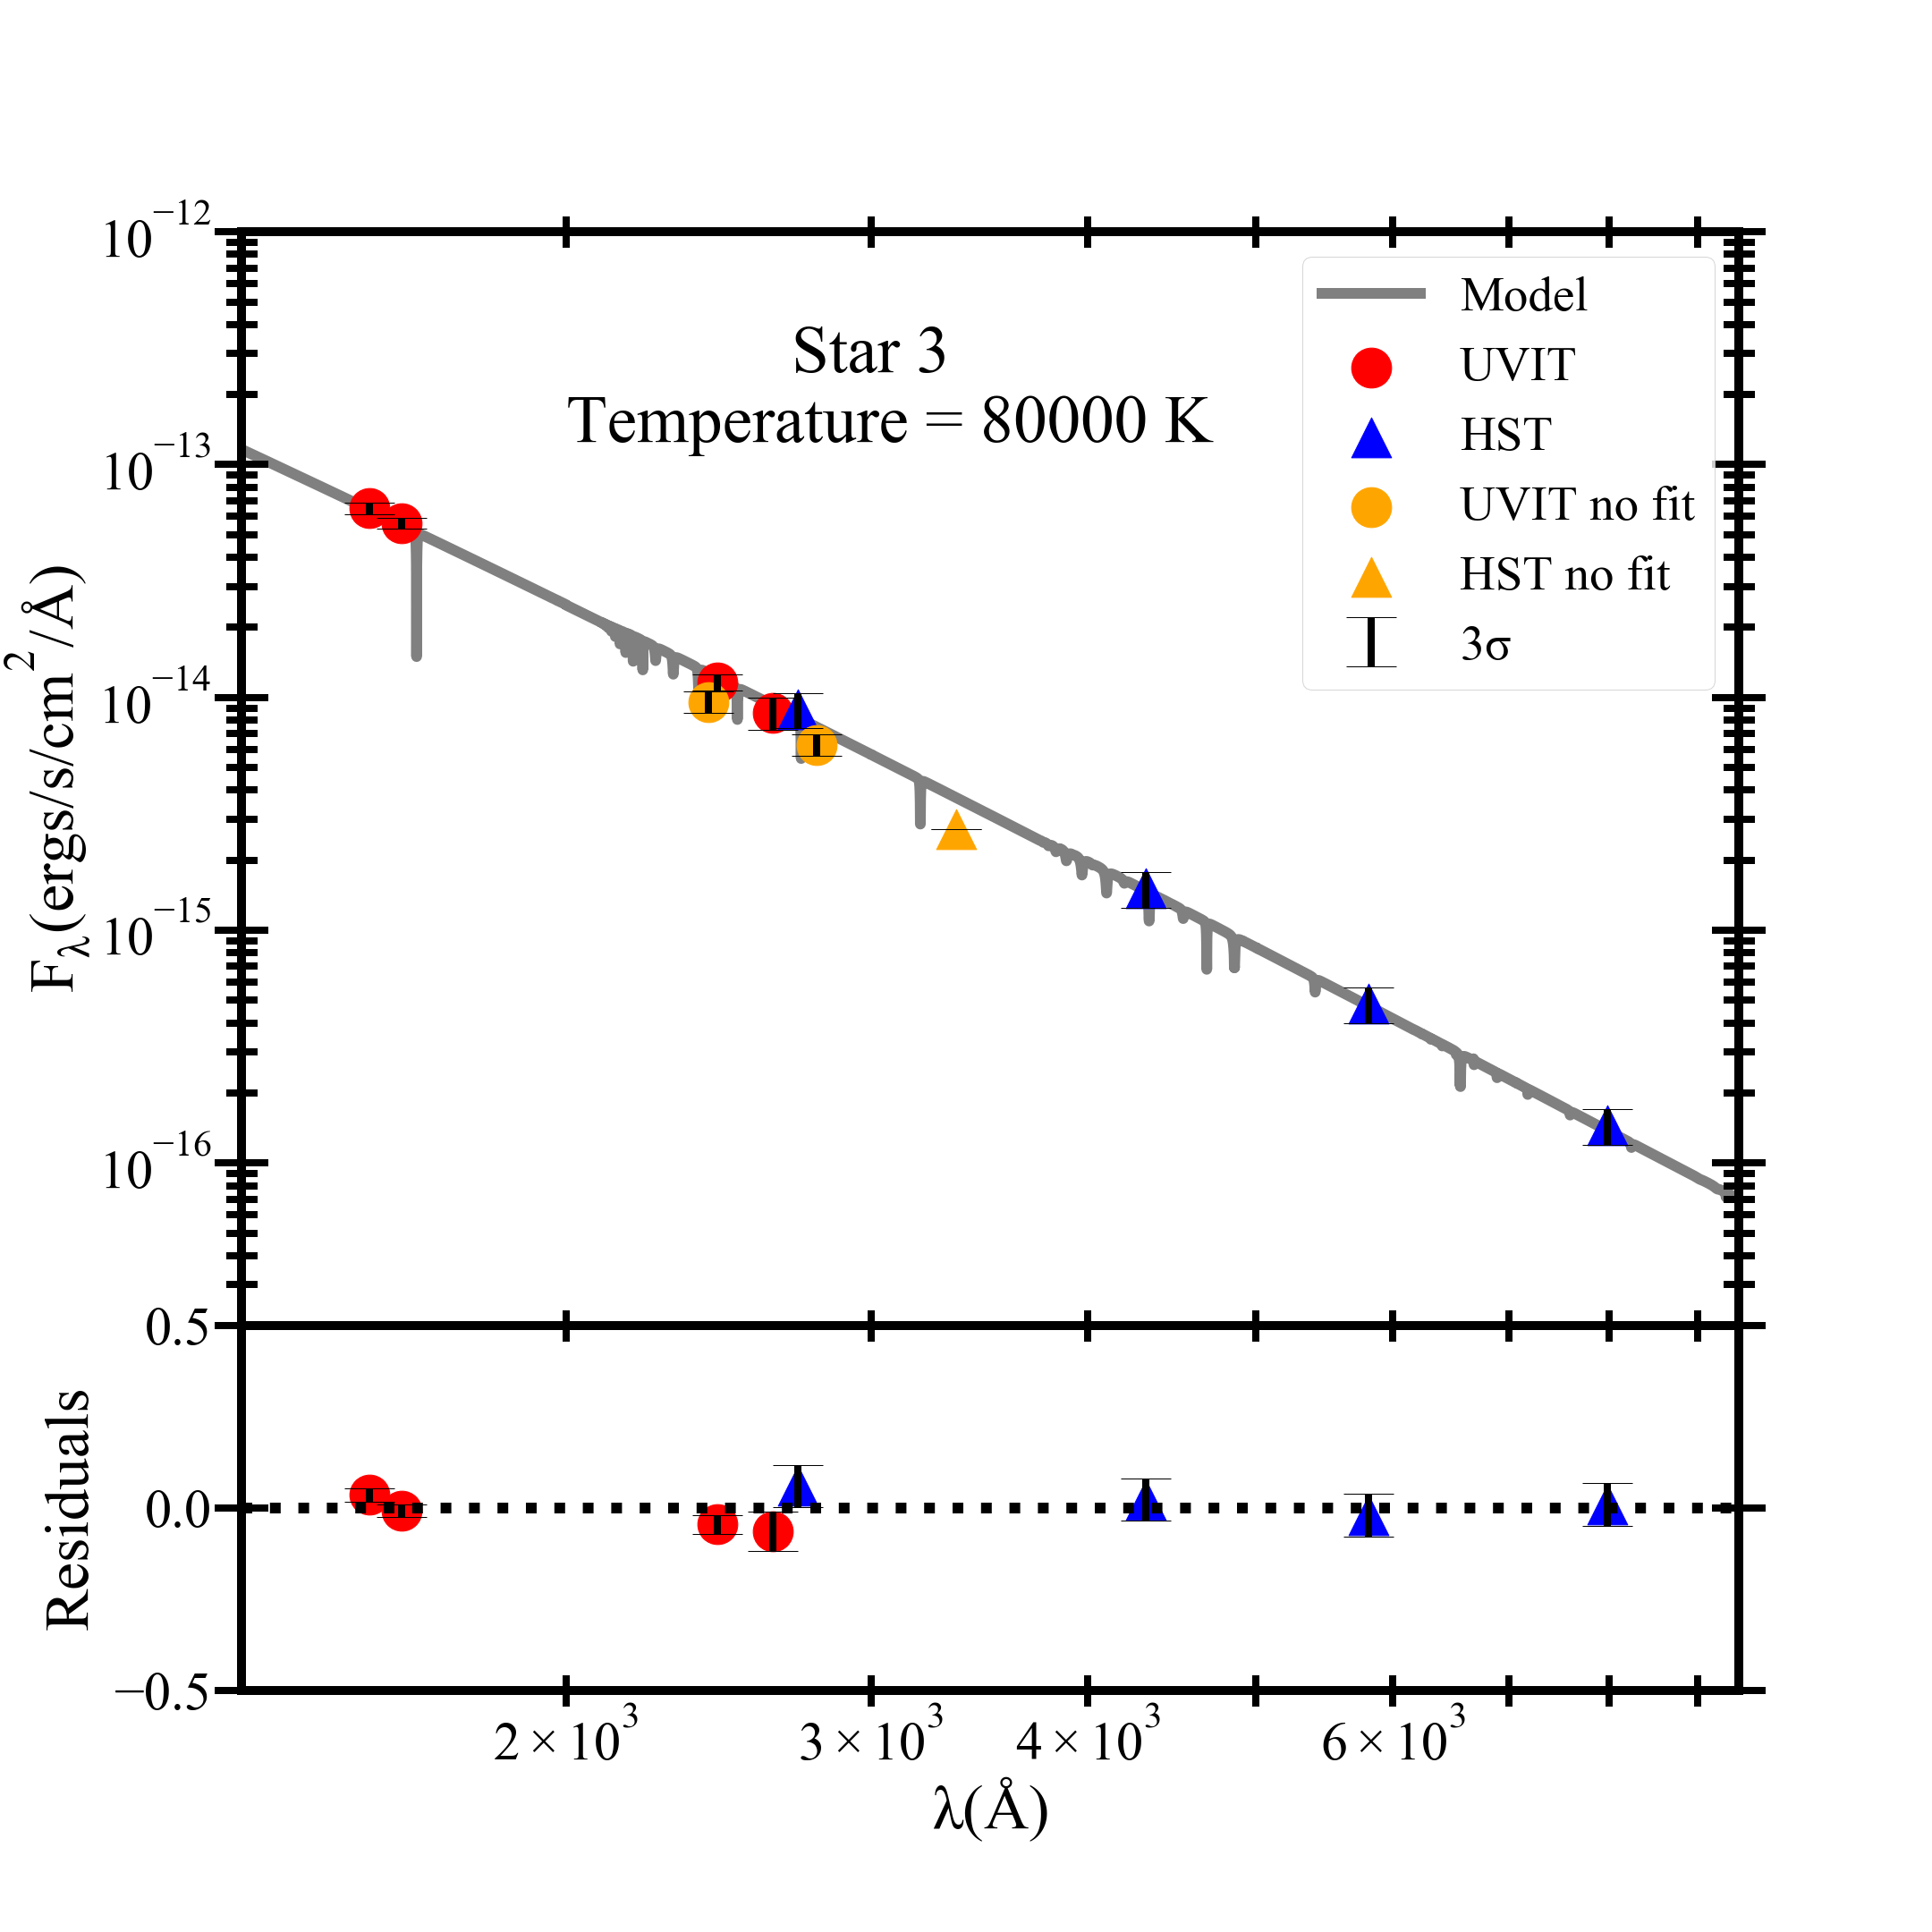
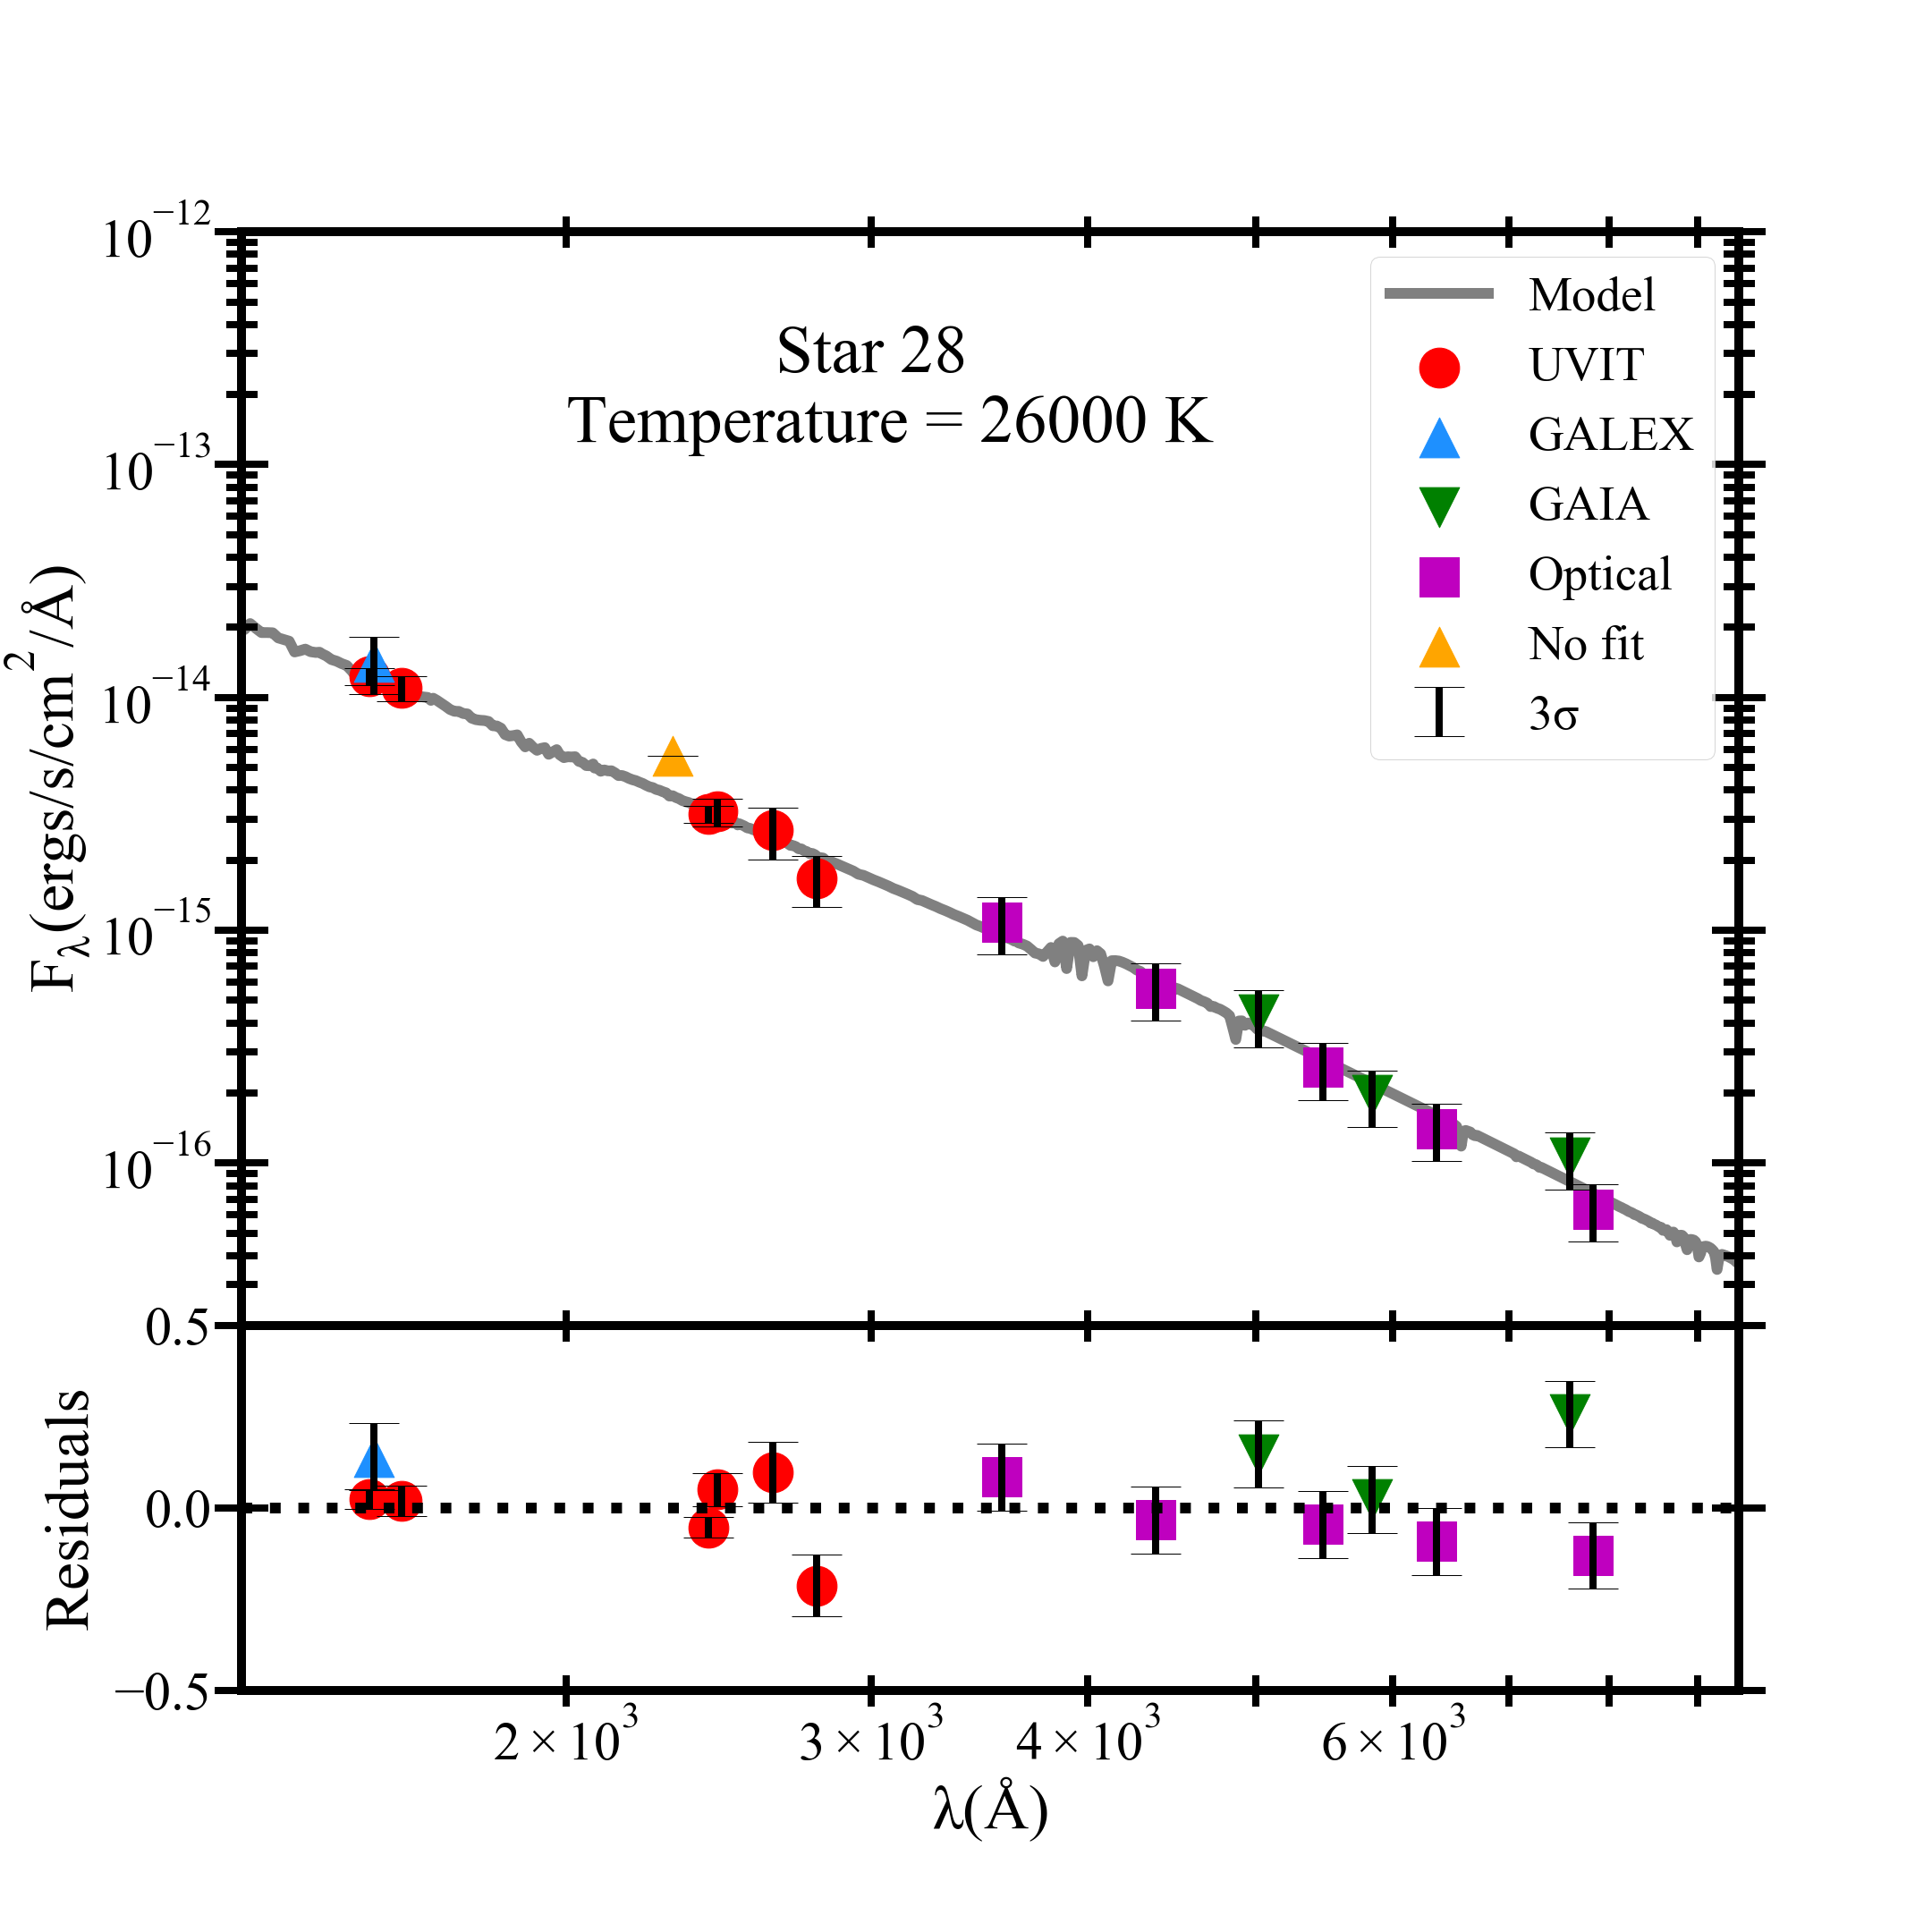
Figure 12 shows a histogram of the temperature distribution of the UV-bright stars in the cluster. The values take a range from 12500 to 100000 K with maximum number of stars having a temperature between 20000 to 30000 K.
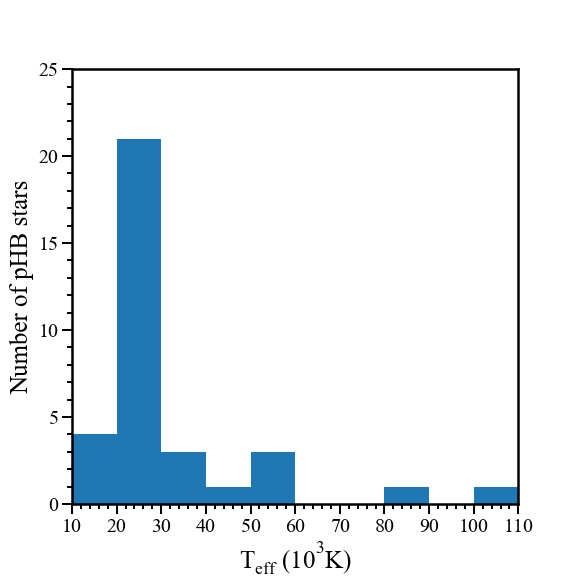
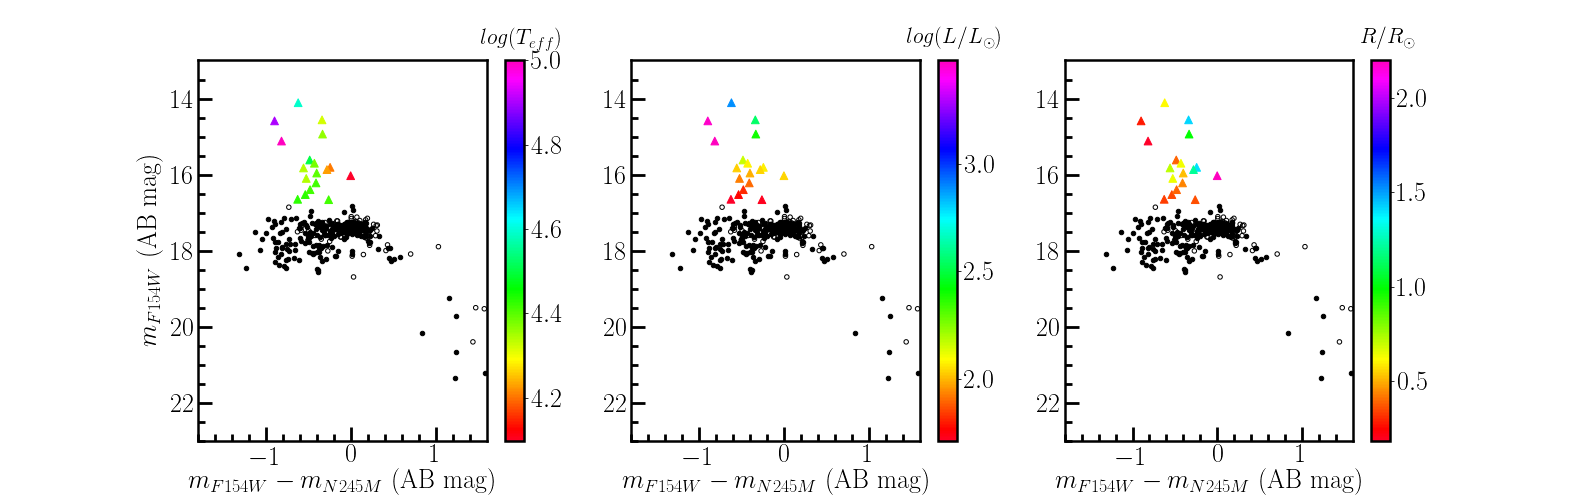
Figure 13 shows the trends in the best-fit parameters of the 18 UV-bright stars with UVIT photometry in the vs CMD. The left, middle and right panels display the trends in Teff, luminosity and radius, respectively. Among the 5 stars with the brightest magnitudes, the hottest stars are also the most luminous and have the smallest radii. The coolest among these 5 stars have 2.5 and 1.0. The star with the brightest magnitude has log 4.6, with a fairly high luminosity ( 3) and a smaller radius ( 0.5). Most of the remaining pHB stars with fainter than 15.5 mag have log in the range 4.3 to 4.5, with 2.2 and radii 0.5. The three coolest stars with 16 mag have 2.0 and are relatively larger in size with 1.5.
In order to evaluate the importance of FUV data points in the estimation of fundamental parameters, we fitted the SEDs of Stars 1 to 15 and Stars 28 to 34 excluding their available FUV photometric points. We found that the parameter values changed significantly for stars hotter than = 40,000 K with the underestimation of , and the overestimation of . This implied that FUV data is crucial to estimate the parameters of very hot stars. Hence, the results derived for hot stars without FUV data points are to be considered with lesser weightage.
Since several previous studies (Bedin et al., 2000; Marino et al., 2017) adopted a reddening value of = 0.19 mag for this cluster, we also fitted the SEDs using this value to see by what amount the estimated parameter values change. With this reddening measure, we found that the effective temperature values decreased by 10 (eg., in the case of the hottest star) to 20%, the bolometric luminosities decreased by about 20 to 30% and the radii increased by about 5 to 10%.
6 Evolutionary status of UV-bright stars
The luminosities and temperatures derived from SED analysis were used to assess the evolutionary status of the observed UV-bright stars using the Hertzsprung-Russell (HR) diagram. We used the pHB evolutionary tracks from Moehler et al. (2019) which are extended versions of the pAGB evolutionary models developed by Miller Bertolami (2016). The tracks correspond to [M/H] = 1, and zero-age main-sequence (ZAMS) mass of = (age = 12 Gyr) assuming scaled-solar metallicity with initial abundances = 0.00172, = 0.24844, and = 0.74984. In the models, the RHB, BHB and EHB sequences were populated by regulating the mass loss on the RGB phase. Further details of the evolutionary tracks are presented in the appendix (Table The First Extensive Exploration of UV-bright Stars in the Globular Cluster NGC 2808).
Figure 14 shows the observed UV-bright stars in black (inner region) and magenta (outer region) inverted triangles plotted over the evolutionary tracks. It is evident from this figure that all the UV-bright stars except the three most luminous ones, have evolutionary masses 0.53 . Most of these stars are observed to lie along/near the sequence with = 0.5 , which is a track evolving from the EHB phase. These are likely to be AGB-manqué stars, which directly descend the white dwarf cooling sequence after core-He exhaustion. The hottest and the most luminous UV-bright star (Star 32 in Table 3) is located between the tracks with = 0.75 and 0.85 . Star 3, with slightly lower luminosity and , lies at the intersection of two post-RHB sequences with = 0.65 and 0.75 . From the models, the mass of this star then ranges from 0.527 to 0.544 . Two stars (Star 23 and Star 24) are found to be located outside the range of the model tracks.
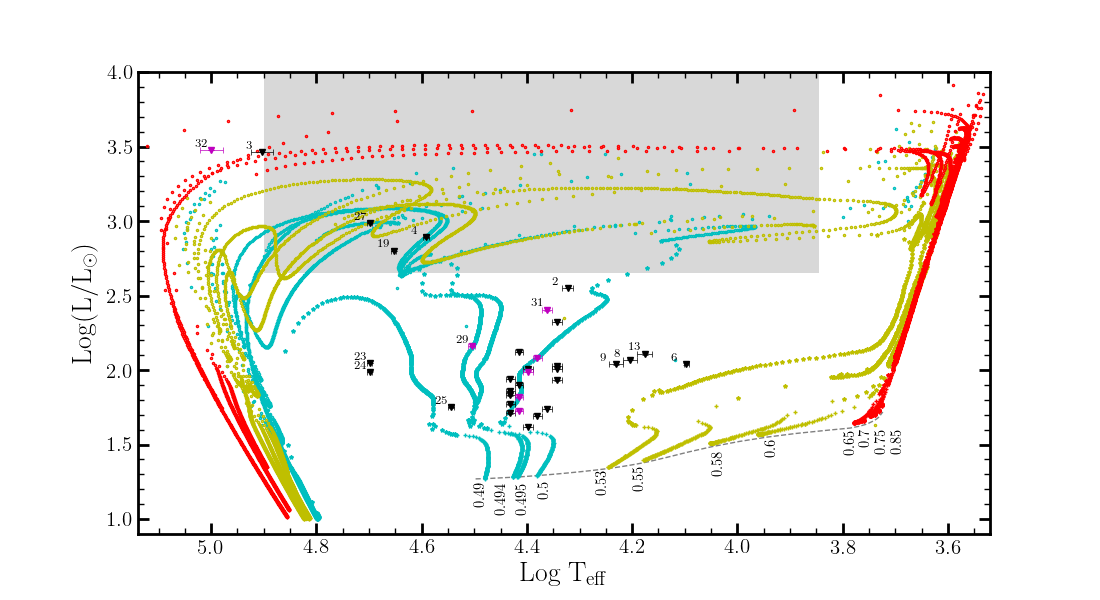
Moehler et al. (2019) considered the area defined by and log in the HR diagram (region shaded in gray in Figure 14) to be corresponding to hot UV-bright p(e)AGB stars. Going by their definition, from Figure 14, we observe three stars to lie inside this region and one star on the high temperature boundary. Among these three stars which are inside the gray-shaded region, two (Star 4 and Star 19) are quite unlikely to be p(e)AGB stars as they are located close to the evolutionary track with = 0.494 . The remaining one star (Star 27) occupies a position where post-EHB (cyan) and post-BHB (olive green) sequences overlap, making it difficult to distinguish. Hence, only the hot and the luminous star (Star 3) seen on the boundary of the shaded region can be confirmed as a hot p(e)AGB star. In other words, the cluster has a maximum of 2 and a minimum of 1 detected hot p(e)AGB candidate as per the above definition. We have detected one star (star 32) hotter than the hot boundary of the shaded region. This star might have crossed the p(e)AGB stage and is probably evolving towards the white-dwarf stage.
6.1 Comparison of theoretically expected and observed numbers of hot p(e)AGB stars
We now make a comparison of the observed number of hot p(e)AGB stars with the number of such stars anticipated from theoretical predictions. For this, we make use of the evolutionary flux method described in detail in Greggio & Renzini (2011). The following suppositions are made in this calculation : a) GCs are simple stellar populations (SSPs), b) the rate at which stars end up as remnants is equal to the rate at which stars leave the main sequence, c) the life-times of later stages of stellar evolution are considerably shorter than that of main-sequence evolution. Under this premise, the number of stars, , in a particular stage of evolution, i, in a SSP is given by the relation,
| (3) |
Here, B(t) is the specific evolutionary flux, which is the number of stars entering (or exiting) a certain phase of stellar evolution per year per luminosity () of the sampled population; is the total luminosity of the stellar population and is the duration of the evolutionary phase being analyzed. Assuming an age 10 Gyr for the cluster and Salpeter’s initial mass function (IMF), we can obtain an approximate value for specific evolutionary flux as stars per year per .
In this analysis, we consider stars in the hot p(e)AGB phase of evolution, which corresponds to the gray shaded region in Figure 14. Each evolutionary track spans a duration, , in this region. In order to estimate the expected number of hot p(e)AGB stars from Eq. 3, we use the parameters for NGC 2808 listed in Table 4. The anticipated number of p(e)AGB stars in a cluster depends on how frequently a particular evolutionary track is followed in that cluster, which in turn depends on the fraction of stars in various parts of the HB. We calculate the number of p(e)AGB stars evolving along all the evolutionary tracks starting from each branch of HB, i.e., , & for stars evolving from RHB, BHB and EHB respectively, using Eq. 3 (Moehler et al., 2019). For this, we derive the fraction of RHB, BHB and EHB stars with respect to the total number of HB stars in the cluster (, and ) by combining the members from the HUGS and Gaia catalogs for complete spatial coverage. The values thus obtained are = 0.47, = 0.35 and = 0.07. The final expected number of hot p(e)AGB stars in the cluster is then,
| (4) |
We obtain a range for since , and take range of values depending on the duration in the p(e)AGB phase along each evolutionary track. Thus, for NGC 2808, we estimate the expected number of hot p(e)AGB in the gray shaded region of HR diagram as 1.27 to 3.80. The maximum observed number of p(e)AGB stars detected in this shaded region is 2, which is in good agreement with the expected number of such stars.
\topruleParameter Value Source [Fe/H] 1.14 dex H96 Age 10.9 Gyr Massari et al. (2016) Integrated V magnitude, 6.20 mag H96 Distance modulus, 15.59 mag H96 Reddening, E(BV) 0.22 mag H96 Bolometric correction, 0.45 mag Worthey (1994) \toprule
7 Discussion
We identify and characterize the sample of UV-bright member stars in NGC 2808 using the photometric data from the UVIT, in combination with HST, Gaia and ground observations. The detection of these stars is extremely important to build a statistically significant sample which can aid in understanding the late phases of evolution of low-mass stars and determining their contribution to the UV luminosity of old stellar systems. As highlighted earlier, observations in the UV wave bands are critical for this purpose. The UVoptical and UV CMDs constructed by combining the UVIT data with the HST (inner region of the GC), Gaia and ground-based optical data (outside HST FOV) reveal the sequences of hot members in the cluster. We do not use the UVIT data for stars within the innermost diameter region because of possible effects of crowding. In the FUV filters, we detect mainly the pHB, BHB, EHB, BHk and BSS populations, whereas in the NUV filters, the cooler RHB stars can also be spotted additionally. The identification of HB location is supported by the overlaid ZAHB and TAHB models.
Brown et al. (2001) observed the central region of NGC 2808 using HST STIS FUV/F25QTZ and NUV/F25CN270 filters. Although a direct comparison cannot be made between their and our UV CMDs (due to the differences in the filter characteristics and the FOV covered), some general features of the CMDs can be examined in detail. In their FUVNUV vs. FUV CMD, a gap between BHB and EHB was found at FUVNUV color mag. They also found a sparse sub-luminous population of stars below the end of canonical ZAHB and explained them by invoking the late-hot flasher (BHk) scenario having enhanced He and C abundances due to flash mixing. The spread in the magnitudes of these stars was accounted for by the evolution of BHk stars to higher luminosities as the He-core burning progressed. We find a similar spread in the BHk magnitudes in our vs CMD shown in Figure 8. Brown et al. (2001, 2010) noted that some of these BHk stars are unusually redder, i.e., redder than expected from the models for normal BHk or EHB stars. A similar dispersion in the color of BHk stars is observed in our FUVNUV vs. FUV CMD. Brown et al. (2012) analyzed the UV spectra of two BHk stars with redder FUVNUV colors and found that there is large enhancement of Fe-peak elements in these stars which could serve as an explanation for their observed colors.
Brown et al. (2012) also discussed the results from UV spectral analysis of 3 unclassified objects, U1, U2 and U3, which are hotter than their canonical HB model. Based on their spectra and locations in the UV CMD, the possibilities of them being evolving pAGB stars or white dwarfs were disregarded. U1 and U2 were found to have implausible effective temperatures ( 250,000 K) and U3 to have = 50,000 K. These objects did not have any X-ray counterparts. The authors were unable to conclusively explain these unusually hot objects although propositions such as presence of accretion disk in the objects, change in extinction along the line of sight to the cluster, non-stellar source etc. were put forth. These objects, located within from the cluster center, are not resolved in the UVIT images. However, two of these objects, namely, U1 and U3, could be cross-matched with stars in the HUGS catalog having membership probability . These are found in the BHk and EHB positions respectively in the vs. CMD shown in Figure 3. We detect similar objects in our UV CMDs in Figure 8 with bluer colors ( 1 mag) than the ZAHB model and roughly the same magnitudes as that of the HB. We plan to characterize the HB stars in our future study.
The study by Schiavon et al. (2012) did not include the full sample of pHB stars in NGC 2808 due to the limited spatial resolution of GALEX and the lack of membership analysis for these stars. There are 22 candidates in their list of UV-bright stars in NGC 2808. We find 15 stars to be in common between our sample and theirs.
The UV CMD presented in Brown et al. (2001) shows one pAGB candidate star with FUV magnitude 12.46 mag. This star is unresolved in the UVIT images and not included in the HUGS catalog as it is saturated in the WFC3/UVIS filters. Hence, our analysis does not include this star. Brown et al. (2001) also found 5 pHB candidates from the UV CMD of which 4 stars are common with our catalog. The fifth pHB candidate is not included in the HUGS catalog, and hence, its membership cannot be assessed even though it is detected in the UVIT images (R.A. = 138.0235 degrees, Decl. = 64.86531 degrees).
In Table 5, we compare our estimates of with the values available in literature for three UV-bright stars in the cluster. Brown et al. (2012) derived the for the AGB-manqué star AGBM1 using the STIS UV spectrum. Moehler et al. (2019) estimated the values for the stars C4594 and C2946 using the medium-resolution optical spectra from the EFOSC2 instrument at the 2.2m MPI/ESO telescope. From the table, it is evident that the values derived through SED analysis are in close agreement with spectroscopic estimations.
\topruleID ID in literature from literature from our analysis Reference (K) (K) Star 13 AGBM1 14500 15500 500 Brown et al. (2012) Star 31 C4594 19900 1600 23000 500 Moehler et al. (2019) Star 34 C2946 24900 1800 24000 500 Moehler et al. (2019) \toprule
Moehler et al. (2019) calculated the theoretically expected numbers of hot p(e)AGB stars in 17 galactic GCs (excluding NGC 2808) and compared them with the observed numbers. The numbers matched more or less in the case of 14 clusters. In the remaining 3 clusters, the observed numbers of p(e)AGB stars were larger than the predicted values. The massive and dense GC, NGC 5139 ( Cen) has the maximum number of observed p(e)AGB stars (5 stars), with the expected number in the range 1.3 - 13.5. Here, we find that the number of such stars is between 1 and 3 (including the saturated pAGB candidate from Brown et al. (2001)), which agrees well with the expected number for NGC 2808.
The pHB stars identified in this study will provide a good sample to explore the stellar evolutionary properties in this phase. From Figure 9, we see that there are seven member stars located in the outer region of the cluster that are ideal candidates for further follow-up spectroscopic studies. These are identified from the AstroSat/UVIT images and are in relatively less crowded regions of the cluster. This GC is known to host populations with a wide range of main-sequence He abundances (Piotto et al., 2007; Milone et al., 2015). In addition, many of the UV-bright stars with 25,000 K are likely to experience gravitational settling, and/or weak winds which may alter their surface helium (and metal) abundance (eg., Dixon et al. (2017)). These abundance uncertainties call for thorough spectroscopic investigation. Moreover, spectroscopy can provide accurate estimation of , log g, radial velocity and its variation (if any), detailed chemical abundance information on the signs of third dredge-up (which will help to clearly distinguish between peAGB and pAGB phases), and so on.
8 Summary
1. We performed a comprehensive study of the UV-bright member stars in the GC NGC 2808 using the AstroSat/UVIT, HST, Gaia DR2 and ground-based optical data. The identification and detailed study of these stars are important to create a statistically significant sample for two main reasons : (i) to throw light on the rapid evolution of late phases of low mass stars such as pAGB, peAGB and AGB-manqué phases, (ii) to assess the contribution of these stars to the total UV output of old stellar systems.
2. Member stars in the inner and outer parts of the cluster are identified to create optical, UV-optical and UV CMDs. The stars in the HB sequence are identified and compared with the ZAHB and TAHB models. A large number of hot HB stars are detected along with a FUV-bright BSS. These will be studied in detail in the future.
3. We detected 34 UV-bright stars based on their locations in the UV CMDs. Among these, 27 stars are found to be located within the inner region of the cluster and 7 stars in the outer region.
4. We estimated parameters such as , and of these stars through SED fitting technique. Their effective temperatures range from 12500 K to 100,000 K, luminosities from to and radii from 0.13 to 2.2 . Our estimations from SED fitting are found to match well with the available spectroscopic estimations for a few stars from literature.
5. By comparing the derived parameters with theoretical models available for evolved stellar populations, the evolutionary status of these stars is probed. We find that most UV-bright stars have evolved from EHB stars with = 0.5 , and these are in the AGB-manqué phase. From the theoretical models, we observe that all except the three hottest and the most luminous UV-bright stars have HB progenitors with 0.53 .
6. The expected number of hot p(e)AGB stars in NGC 2808 is estimated from stellar evolutionary models and is found to agree well with the observed number.
7. Seven pHB stars identified in the outer region are ideal for further spectroscopic follow-up studies. These stars are identified from the AstroSat/UVIT images. This work thus demonstrates the capability of the UVIT in detecting and characterizing the UV-bright stars.
References
- Bayo et al. (2008) Bayo, A., Rodrigo, C., Barrado Y Navascués, D., et al. 2008, A&A, 492, 277
- Bedin et al. (2000) Bedin, L. R., Piotto, G., Zoccali, M., et al. 2000, A&A, 363, 159
- Boch & Fernique (2014) Boch, T., & Fernique, P. 2014, in Astronomical Society of the Pacific Conference Series, Vol. 485, Astronomical Data Analysis Software and Systems XXIII, ed. N. Manset & P. Forshay, 277
- Bonnarel et al. (2000) Bonnarel, F., Fernique, P., Bienaymé, O., et al. 2000, A&AS, 143, 33
- Brocato et al. (1990) Brocato, E., Matteucci, F., Mazzitelli, I., & Tornambe, A. 1990, ApJ, 349, 458
- Brown et al. (2000) Brown, T. M., Bowers, C. W., Kimble, R. A., Sweigart, A. V., & Ferguson, H. C. 2000, ApJ, 532, 308
- Brown et al. (1997) Brown, T. M., Ferguson, H. C., Davidsen, A. F., & Dorman, B. 1997, ApJ, 482, 685
- Brown et al. (2012) Brown, T. M., Lanz, T., Sweigart, A. V., et al. 2012, ApJ, 748, 85
- Brown et al. (2001) Brown, T. M., Sweigart, A. V., Lanz, T., Land sman, W. B., & Hubeny, I. 2001, ApJ, 562, 368
- Brown et al. (2010) Brown, T. M., Sweigart, A. V., Lanz, T., et al. 2010, ApJ, 718, 1332
- Brown et al. (2016) Brown, T. M., Cassisi, S., D’Antona, F., et al. 2016, ApJ, 822, 44
- Cardelli et al. (1989) Cardelli, J. A., Clayton, G. C., & Mathis, J. S. 1989, ApJ, 345, 245
- Castelli et al. (1997) Castelli, F., Gratton, R. G., & Kurucz, R. L. 1997, A&A, 318, 841
- Castelli & Kurucz (2003) Castelli, F., & Kurucz, R. L. 2003, in IAU Symposium, Vol. 210, Modelling of Stellar Atmospheres, ed. N. Piskunov, W. W. Weiss, & D. F. Gray, A20
- Charpinet et al. (2011) Charpinet, S., Van Grootel, V., Fontaine, G., et al. 2011, A&A, 530, A3
- Chayer et al. (2015) Chayer, P., Dixon, W. V., Fullerton, A. W., Ooghe-Tabanou, B., & Reid, I. N. 2015, MNRAS, 452, 2292
- Constantino et al. (2015) Constantino, T., Campbell, S. W., Christensen-Dalsgaard, J., Lattanzio, J. C., & Stello, D. 2015, MNRAS, 452, 123
- Dixon et al. (2017) Dixon, W. V., Chayer, P., Latour, M., Miller Bertolami, M. M., & Benjamin, R. A. 2017, AJ, 154, 126
- Dixon et al. (2019) Dixon, W. V., Chayer, P., Reid, I. N., & Miller Bertolami, M. M. 2019, AJ, 157, 147
- Dorman et al. (1995) Dorman, B., O’Connell, R. W., & Rood, R. T. 1995, ApJ, 442, 105
- Dorman et al. (1993) Dorman, B., Rood, R. T., & O’Connell, R. W. 1993, ApJ, 419, 596
- Fitzpatrick (1999) Fitzpatrick, E. L. 1999, PASP, 111, 63
- Gaia Collaboration et al. (2018) Gaia Collaboration, Helmi, A., van Leeuwen, F., et al. 2018, A&A, 616, A12
- Greggio & Renzini (1990) Greggio, L., & Renzini, A. 1990, ApJ, 364, 35
- Greggio & Renzini (1999) —. 1999, Mem. Soc. Astron. Italiana, 70, 691
- Greggio & Renzini (2011) —. 2011, The Fundamentals of Evolutionary Population Synthesis (John Wiley & Sons, Ltd), 35–59
- Harris (1996) Harris, W. E. 1996, AJ, 112, 1487
- Harris (2018) —. 2018, AJ, 156, 296
- Hidalgo et al. (2018) Hidalgo, S. L., Pietrinferni, A., Cassisi, S., et al. 2018, ApJ, 856, 125
- Hunter (2007) Hunter, J. D. 2007, Computing in Science & Engineering, 9, 90
- Jain et al. (2019) Jain, R., Vig, S., & Ghosh, S. K. 2019, MNRAS, 485, 2877
- Kunder et al. (2013) Kunder, A., Stetson, P. B., Catelan, M., Walker, A. R., & Amigo, P. 2013, AJ, 145, 33
- Marino et al. (2017) Marino, A. F., Milone, A. P., Yong, D., et al. 2017, ApJ, 843, 66, doi: 10.3847/1538-4357/aa7852
- Massari et al. (2016) Massari, D., Fiorentino, G., McConnachie, A., et al. 2016, A&A, 586, A51
- McDonald & Zijlstra (2015) McDonald, I., & Zijlstra, A. A. 2015, MNRAS, 448, 502
- McKinney (2010) McKinney, W. 2010, in Proceedings of the 9th Python in Science Conference, Vol. 445, Austin, TX, 51–56
- McKinney (2011) McKinney, W. 2011, Python for High Performance and Scientific Computing, 14
- Miller Bertolami (2016) Miller Bertolami, M. M. 2016, A&A, 588, A25
- Milone et al. (2015) Milone, A. P., Marino, A. F., Piotto, G., et al. 2015, ApJ, 808, 51, doi: 10.1088/0004-637X/808/1/51
- Moehler (2001) Moehler, S. 2001, PASP, 113, 1162
- Moehler (2010) —. 2010, Mem. Soc. Astron. Italiana, 81, 838
- Moehler et al. (2019) Moehler, S., Landsman, W. B., Lanz, T., & Miller Bertolami, M. M. 2019, A&A, 627, A34
- Nardiello et al. (2018) Nardiello, D., Libralato, M., Piotto, G., et al. 2018, MNRAS, 481, 3382
- O’Connell (1999) O’Connell, R. W. 1999, Annual Review of Astronomy and Astrophysics, 37, 603
- Piotto et al. (2007) Piotto, G., Bedin, L. R., Anderson, J., et al. 2007, ApJ, 661, L53, doi: 10.1086/518503
- Piotto et al. (2015) Piotto, G., Milone, A. P., Bedin, L. R., et al. 2015, AJ, 149, 91
- Postma & Leahy (2017) Postma, J. E., & Leahy, D. 2017, PASP, 129, 115002
- Raso et al. (2017) Raso, S., Ferraro, F. R., Dalessandro, E., et al. 2017, ApJ, 839, 64
- Rauch & Deetjen (2003) Rauch, T., & Deetjen, J. 2003, in Astronomical Society of the Pacific Conference Series, Vol. 288, Stellar Atmosphere Modeling, ed. I. Hubeny, D. Mihalas, & K. Werner, 103
- Salaris et al. (2016) Salaris, M., Cassisi, S., & Pietrinferni, A. 2016, A&A, 590, A64
- Schiavon et al. (2012) Schiavon, R. P., Dalessandro, E., Sohn, S. T., et al. 2012, AJ, 143, 121
- Singh et al. (2020) Singh, G., Sahu, S., Subramaniam, A., & Yadav, R. K. S. 2020, arXiv e-prints, arXiv:2010.06979. https://arxiv.org/abs/2010.06979
- Sirianni et al. (2005) Sirianni, M., Jee, M. J., Benítez, N., et al. 2005, PASP, 117, 1049, doi: 10.1086/444553
- Stetson (1987) Stetson, P. B. 1987, Publications of the Astronomical Society of the Pacific, 99, 191
- Stetson et al. (2019) Stetson, P. B., Pancino, E., Zocchi, A., Sanna, N., & Monelli, M. 2019, MNRAS, 485, 3042
- Tandon et al. (2017) Tandon, S. N., Subramaniam, A., Girish, V., et al. 2017, AJ, 154, 128
- Taylor (2005) Taylor, M. B. 2005, in Astronomical Society of the Pacific Conference Series, Vol. 347, Astronomical Data Analysis Software and Systems XIV, ed. P. Shopbell, M. Britton, & R. Ebert, 29
- Thompson et al. (2007) Thompson, H. M. A., Keenan, F. P., Dufton, P. L., et al. 2007, MNRAS, 378, 1619
- Van Der Walt et al. (2011) Van Der Walt, S., Colbert, S. C., & Varoquaux, G. 2011, Computing in Science & Engineering, 13, 22
- Virtanen et al. (2020) Virtanen, P., Gommers, R., Oliphant, T. E., et al. 2020, Nature Methods, 17, 261
- Werner et al. (2003) Werner, K., Deetjen, J. L., Dreizler, S., et al. 2003, in Astronomical Society of the Pacific Conference Series, Vol. 288, Stellar Atmosphere Modeling, ed. I. Hubeny, D. Mihalas, & K. Werner, 31
- Werner & Dreizler (1999) Werner, K., & Dreizler, S. 1999, Journal of Computational and Applied Mathematics, 109, 65
- Worthey (1994) Worthey, G. 1994, ApJS, 95, 107
- Zinn et al. (1972) Zinn, R. J., Newell, E. B., & Gibson, J. B. 1972, A&A, 18, 390
\toprule log HB location pHB behaviour () (K) () () [M/H] = 1, Age = 12 Gyr, = 0.490 30138 5.74 EHB post-EHB, no thermal pulses 0.490 0.494 26706 5.52 EHB 1 thermal pulse (like a LTP) 0.493 0.495 26152 5.49 EHB 1 thermal pulse (like a LTP) 0.495 0.500 24040 5.34 EHB 2 thermal pulses (like a LTP) 0.496 0.530 17770 4.78 BHB post-EAGB, 2 thermal pulses (like a LTP) 0.499 0.550 15264 4.48 BHB TP-AGB + LTP 0.504 0.580 11097 3.80 BHB TP-AGB + LTP 0.513 0.600 8815 3.35 BHB TP-AGB 0.518 0.650 5724 2.56 RHB TP-AGB +LTP 0.528* 0.700 5484 2.50 RHB TP-AGB 0.537 0.750 5392 2.47 RHB TP-AGB 0.545 0.850 5315 2.46 RHB TP-AGB 0.555 \toprule Notes. TP-AGB stands for thermally pulsing AGB, (V)LTP for (very) late thermal pulse.(∗)These sequences end up highly H-deficient due to burning or dilution of the H-rich envelope during the last He-shell flash.
\topruleID R.A. Decl. F154W err1 F169M err2 N242W err3 N245M err4 N263M err5 N279N err6 (deg) (deg) \topruleStar 1 137.96181 -64.84165 18.437 0.039 18.514 0.041 19.017 0.033 18.924 0.070 18.757 0.093 18.783 0.083 Star 2 138.02575 -64.84307 16.349 0.018 16.346 0.023 16.923 0.029 16.549 0.023 16.389 0.045 16.515 0.031 Star 3 138.06046 -64.86146 16.376 0.020 16.417 0.018 17.450 0.038 17.135 0.027 17.077 0.056 17.190 0.037 Star 4 138.05040 -64.84379 15.899 0.018 15.891 0.018 16.724 0.031 16.380 0.028 16.325 0.040 16.444 0.032 Star 5 138.04719 -64.87492 18.313 0.030 18.289 0.034 19.015 0.039 18.710 0.052 18.476 0.088 18.483 0.068 Star 6 138.06813 -64.86459 17.817 0.025 17.727 0.031 17.826 0.024 17.680 0.039 17.419 0.053 17.439 0.055 Star 7 138.05264 -64.86779 17.888 0.028 17.825 0.029 18.629 0.045 18.274 0.052 18.105 0.094 18.224 0.060 Star 8 138.04842 -64.84887 17.597 0.025 17.559 0.029 18.087 0.031 17.702 0.046 17.473 0.064 17.525 0.049 Star 9 138.04760 -64.85790 17.657 0.025 17.611 0.034 18.208 0.055 17.799 0.041 17.588 0.051 17.524 0.056 Star 10 138.03820 -64.87028 17.613 0.023 17.579 0.030 18.743 0.061 18.031 0.042 17.930 0.075 17.856 0.059 Star 11 137.96088 -64.85092 18.006 0.032 18.004 0.035 18.540 0.032 18.277 0.044 17.995 0.071 18.403 0.065 Star 28 137.85352 -64.87929 18.184 0.029 18.178 0.044 18.652 0.030 18.525 0.048 18.342 0.087 18.623 0.087 Star 29 137.92453 -64.70158 17.404 0.025 17.465 0.025 17.807 0.022 17.749 0.034 17.675 0.048 17.814 0.054 Star 30 138.08369 -64.84865 17.747 0.025 17.738 0.031 18.173 0.026 18.010 0.041 17.975 0.071 17.932 0.053 Star 31 138.00728 -64.79293 16.723 0.020 16.748 0.020 17.058 0.019 16.917 0.020 16.855 0.042 16.950 0.039 Star 32 137.99974 -64.89071 16.906 0.025 16.953 0.024 17.844 0.035 17.583 0.038 17.515 0.044 17.712 0.066 Star 33 138.02306 -64.89646 18.447 0.034 18.477 0.036 18.759 0.025 18.569 0.055 18.339 0.082 18.651 0.093 Star 34 138.09187 -64.87727 17.489 0.025 17.493 0.027 18.003 0.035 17.779 0.042 17.745 0.064 17.704 0.063 \toprule