Serendipitous discovery of a dusty disc around WDJ181417.84735459.83
Abstract
Spectroscopic observations of white dwarfs reveal that many of them are polluted by exoplanetary material, whose bulk composition can be uniquely probed this way. We present a spectroscopic and photometric analysis of the DA white dwarf WDJ181417.84735459.83, an object originally identified to have a strong infrared excess in the 2MASS and WISE catalogues that we confirmed to be intrinsic to the white dwarf, and likely corresponding to the emission of a dusty disc around the star. The finding of Ca, Fe and Mg absorption lines in two X-SHOOTER spectra of the white dwarf, taken 8 years apart, is further evidence of accretion from a dusty disc. We do not report variability in the absorption lines between these two spectra. Fitting a blackbody model to the infrared excess gives a temperature of 910 K. We have estimated a total accretion flux from the spectroscopic metal lines of g s-1.
keywords:
white dwarfs – accretion, accretion discs1 Introduction
White dwarfs, the final evolutionary stage of low to intermediate mass stars, are compact objects whose photospheres typically show absorption spectral lines of hydrogen, helium or do not show any lines (DA, DB or DC white dwarf spectral type, respectively). Due to their high surface gravities, with [cm s-2], elements heavier than H and He rapidly diffuse from the convective envelope into the interior, with timescales much shorter than the white dwarfs’ cooling time (e.g. Fontaine & Michaud, 1979; Paquette et al., 1986; Koester, 2009).
However, traces of metals are found in white dwarfs’ spectra as absorption lines, in which case the white dwarfs are classified as DAZ, DBZ or DZ. These metals were initially thought to come from accretion of the interstellar medium (e.g. Bruhweiler & Kondo, 1981; Aannestad & Sion, 1985; Dupuis et al., 1993), but were later alternatively explained by ongoing accretion from exoplanetary material around the white dwarf (Farihi et al., 2010). To date, we know of several hundreds of white dwarfs with atmospheric metals, representing a percentage of 2550 per cent of the spectroscopically confirmed white dwarfs (e.g. Zuckerman et al., 2003; Koester, D. et al., 2005; Zuckerman et al., 2010; Hollands et al., 2017). Dusty discs have been observed as an excess in the infrared (IR) emission of the white dwarf in dozens of these cases, in around 14 per cent of white dwarfs (e.g. Farihi et al., 2009; Debes et al., 2011; Barber et al., 2014; Rocchetto et al., 2015). In a few systems, Ca ii triplet and other metallic emission lines are also detected in the white dwarf’s spectrum, associated with a gaseous component of the accretion disc (e.g. Gänsicke et al., 2006; Manser et al., 2020).
The current widely-accepted explanation for the formation of circumstellar discs around white dwarfs is the tidal disruption of asteroids (Jura, 2003). In this model, either a large asteroid or several small ones (Wyatt et al., 2014) are tidally disrupted when entering the Roche radius of the white dwarf, forming an opaque flat ring or rings of dust with an extension of less than 1 solar radius, in a Saturn-like ring system. This flat ring model predicts the flux from the disc integrating the Planck function along the ring radius, with a radius-temperature dependence. The model successfully accounts for observations out to 24 microns taken by Spitzer space telescope (Fazio et al., 2004; Hora et al., 2004), with the caveat that 8 micron photometry can be contaminated in some cases by a silicate emission feature. This scenario includes also the possibility of planetesimals or any other exoplanetary material to be the parent bodies of these discs.
Earth-sized white dwarfs are intrinsically faint, and their observed discs are compact. It may be that many stars host discs that lie below the detection threshold (Rocchetto et al., 2015). Furthermore, IR excess may also be explained by a substellar companion in the system (e.g. Probst, 1983), so a spectrum of the white dwarf is usually needed for the discrimination between the two scenarios, as discs have been found only around metal polluted white dwarfs.
Variability in the IR, first detected by Xu & Jura (2014) and suspected to be present in the majority of white dwarfs with discs (Swan et al., 2019a; Swan et al., 2020) is evidence of dynamical dust evolution, with no generally accepted explanation yet. Rogers et al. (2020) do not find variability in a near infrared monitoring campaign of a sample of white dwarfs with IR excesses, one interpretation being that tidal disruption events are rare and occur on short time-scales. There have been reported changes in spectral lines associated to circumstellar gas (e.g. Manser et al., 2016a; Manser et al., 2016b; Dennihy et al., 2018). No definitive evidence for variability of absorption lines of metal pollutants have been found (von Hippel et al., 2007; Debes & López-Morales, 2008).
The analysis of the metal lines and discs found in white dwarfs can give us unique information about compositions of rocky planets (e.g. Jura & Young, 2014), asteroids, comets and even gaseous giants (see recent discovery by Gänsicke et al. 2019). The dust composition is in some cases consistent with carbon-deficient and rocky material, likely similar to the material of the inner Solar System (e.g. Jura et al., 2009). We can infer the rate of the accretion of dusty material and abundances of metal species with respect to H or He abundances in white dwarfs’ photospheres, whilst the accretion rates are consistent with parent bodies with sizes of the order of kilometers (Farihi 2016 and references therein). The most prevalent elements found in white dwarfs to date are oxygen, magnesium, aluminium, silicon, calcium and iron (e.g. Visscher & Fegley, 2013; Gänsicke et al., 2012; Xu et al., 2019), elements that dominate also in the rocky bodies of the Solar System.
Here we report the discovery of photometric infrared excess and absorption lines due to accretion of metals in a DAZ white dwarf, identified as WDJ181417.84735459.83 by Gentile Fusillo et al. (2020b) (hereafter, WDJ18147354). In Section 2 we report the discovery of this object and present photometry and astrometry from the literature. In Section 3 we present follow-up observations: two epochs of X-SHOOTER spectroscopy in Section 3.1 and Spitzer photometry in Section 3.2. In Section 4 we discuss the analysis of the data: a white dwarf model fit to the spectroscopy in Section 4.1, determination of the composition of the accreted material and the diffusion timescales in Section 4.2 and a disc model fit to the infrared excess in Section 4.3. We discuss our results in Section 5. The conclusions are presented in Section 6.
2 Discovery of WDJ18147354
| Gaia Source ID | Gaia DR2 6417955993895552128 |
|---|---|
| [deg] | 273.57335015736 |
| [deg] | 73.91738768154 |
| [mas yr-1] | 63.890.08 |
| [mas yr-1] | 178.20.1 |
| [mas] | 15.510.07 |
| G [mag] | 16.20280.0009 |
| GBP [mag] | 16.2330.005 |
| GRP [mag] | 16.1040.004 |
| GBP GRP [mag] | 0.1290.009 |
| d [pc] | 64.60.6 |
| [K] | 1019050 |
| [cm s-1] | 8.000.10 |
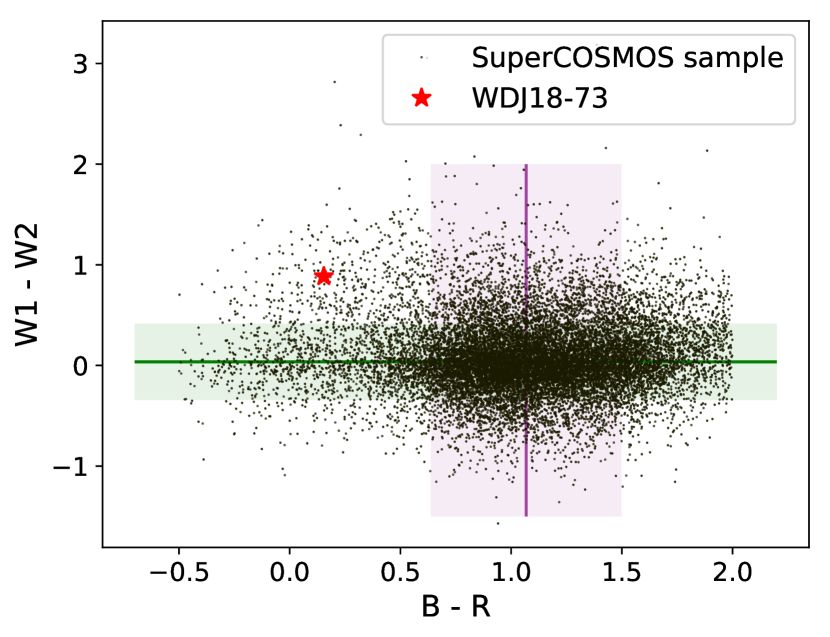
WDJ18147354 was originally identified by one of us (AD) as part of a search for unresolved white dwarf + ultracool dwarf benchmark binaries. The original sample of white dwarf candidates came from a selection of 36,876 objects in the SuperCOSMOS Sky Survey (Hambly et al., 2001), following the same selection criteria as in Day-Jones et al. (2008). This list was then cross-matched with the All-Sky WISE catalogue (Cutri et al., 2013) to select targets with infrared excess, that could potentially have an ultracool dwarf companion, obtaining 16,928 objects. WDJ18147354 is one such outlier in the WISE (Wide Field Infrared Explorer, Wright et al. 2010) vs SuperCOSMOS colour-colour diagram presented in Fig 1, lying 2.2 away from the median of the distribution of white dwarfs. The Gaia Data Release 2 (DR2; Lindegren et al., 2018) astrometry, photometry and parameters of WDJ18147354 are presented in Table 1. The publicly available photometry for WDJ18147354 is summarized in Table 2.
| Band (Survey) | [m] | [mag] | Epoch | PSF ["] |
|---|---|---|---|---|
| B (APASS9) | 0.444 | 16.490.0.11 | 2013.75 | 15 |
| B (S-COSMOS) | 0.467 | 16.345 | 1987.13 | |
| g (APASS9) | 0.482 | 16.230.06 | 2013.75 | 15 |
| GBP (GaiaDR2) | 0.5131 | 16.2330.005 | 2015.5 | 0.1 |
| V (APASS9) | 0.554 | 16.1130.011 | 2013.75 | 15 |
| R2 (S-COSMOS) | 0.595 | 16.191 | 1987.13 | |
| r (APASS9) | 0.625 | 16.190.06 | 2013.75 | 15 |
| G (GaiaDR2) | 0.640111Central wavelengths of Gaia passbands are from Weiler (2018). | 16.20280.0009 | 2015.5 | 0.1 |
| GRP (GaiaDR2) | 0.778 | 16.1040.004 | 2015.5 | 0.1 |
| I (S-COSMOS) | 0.807 | 16.115 | 1987.13 | |
| J (2MASS) | 1.24 | 15.90.1 | 2001 | 2.5 |
| J (VHS) | 1.252 | 16.0780.009 | 2019 | 0.51 |
| H (2MASS) | 1.65 | 15.490.13 | 2013 | 2.5 |
| Ks (VHS) | 2.147 | 15.700.03 | 2019 | 0.51 |
| Ks (2MASS) | 2.16 | 15.100.13 | 2013 | 2.5 |
| W1 (AllWISE) | 3.35 | 13.940.03 | 2010.59 | 6.1 |
| W1 (unWISE)222unWISE magnitudes were obtained by applying the relations in Finkbeiner et al. (2004) to the fluxes found in the unWISE catalogue: 192010 nanomaggies for W1 and 423030 nanomaggies for W2. Systematic uncertainties of 0.02 mag were added (See Schlafly et al., 2019) | 3.35 | 14.2900.03 | 6.1 | |
| W2 (AllWISE) | 4.60 | 13.070.03 | 2010.59 | 6.4 |
| W2 (unWISE) | 4.60 | 13.4330.03 | 6.4 | |
| W3 (AllWISE) | 11.6 | 10.760.09 | 2010.31 | 6.5 |
| W4 (AllWISE) | 22.1 | 8.70.4 | 2010.31 | 12 |
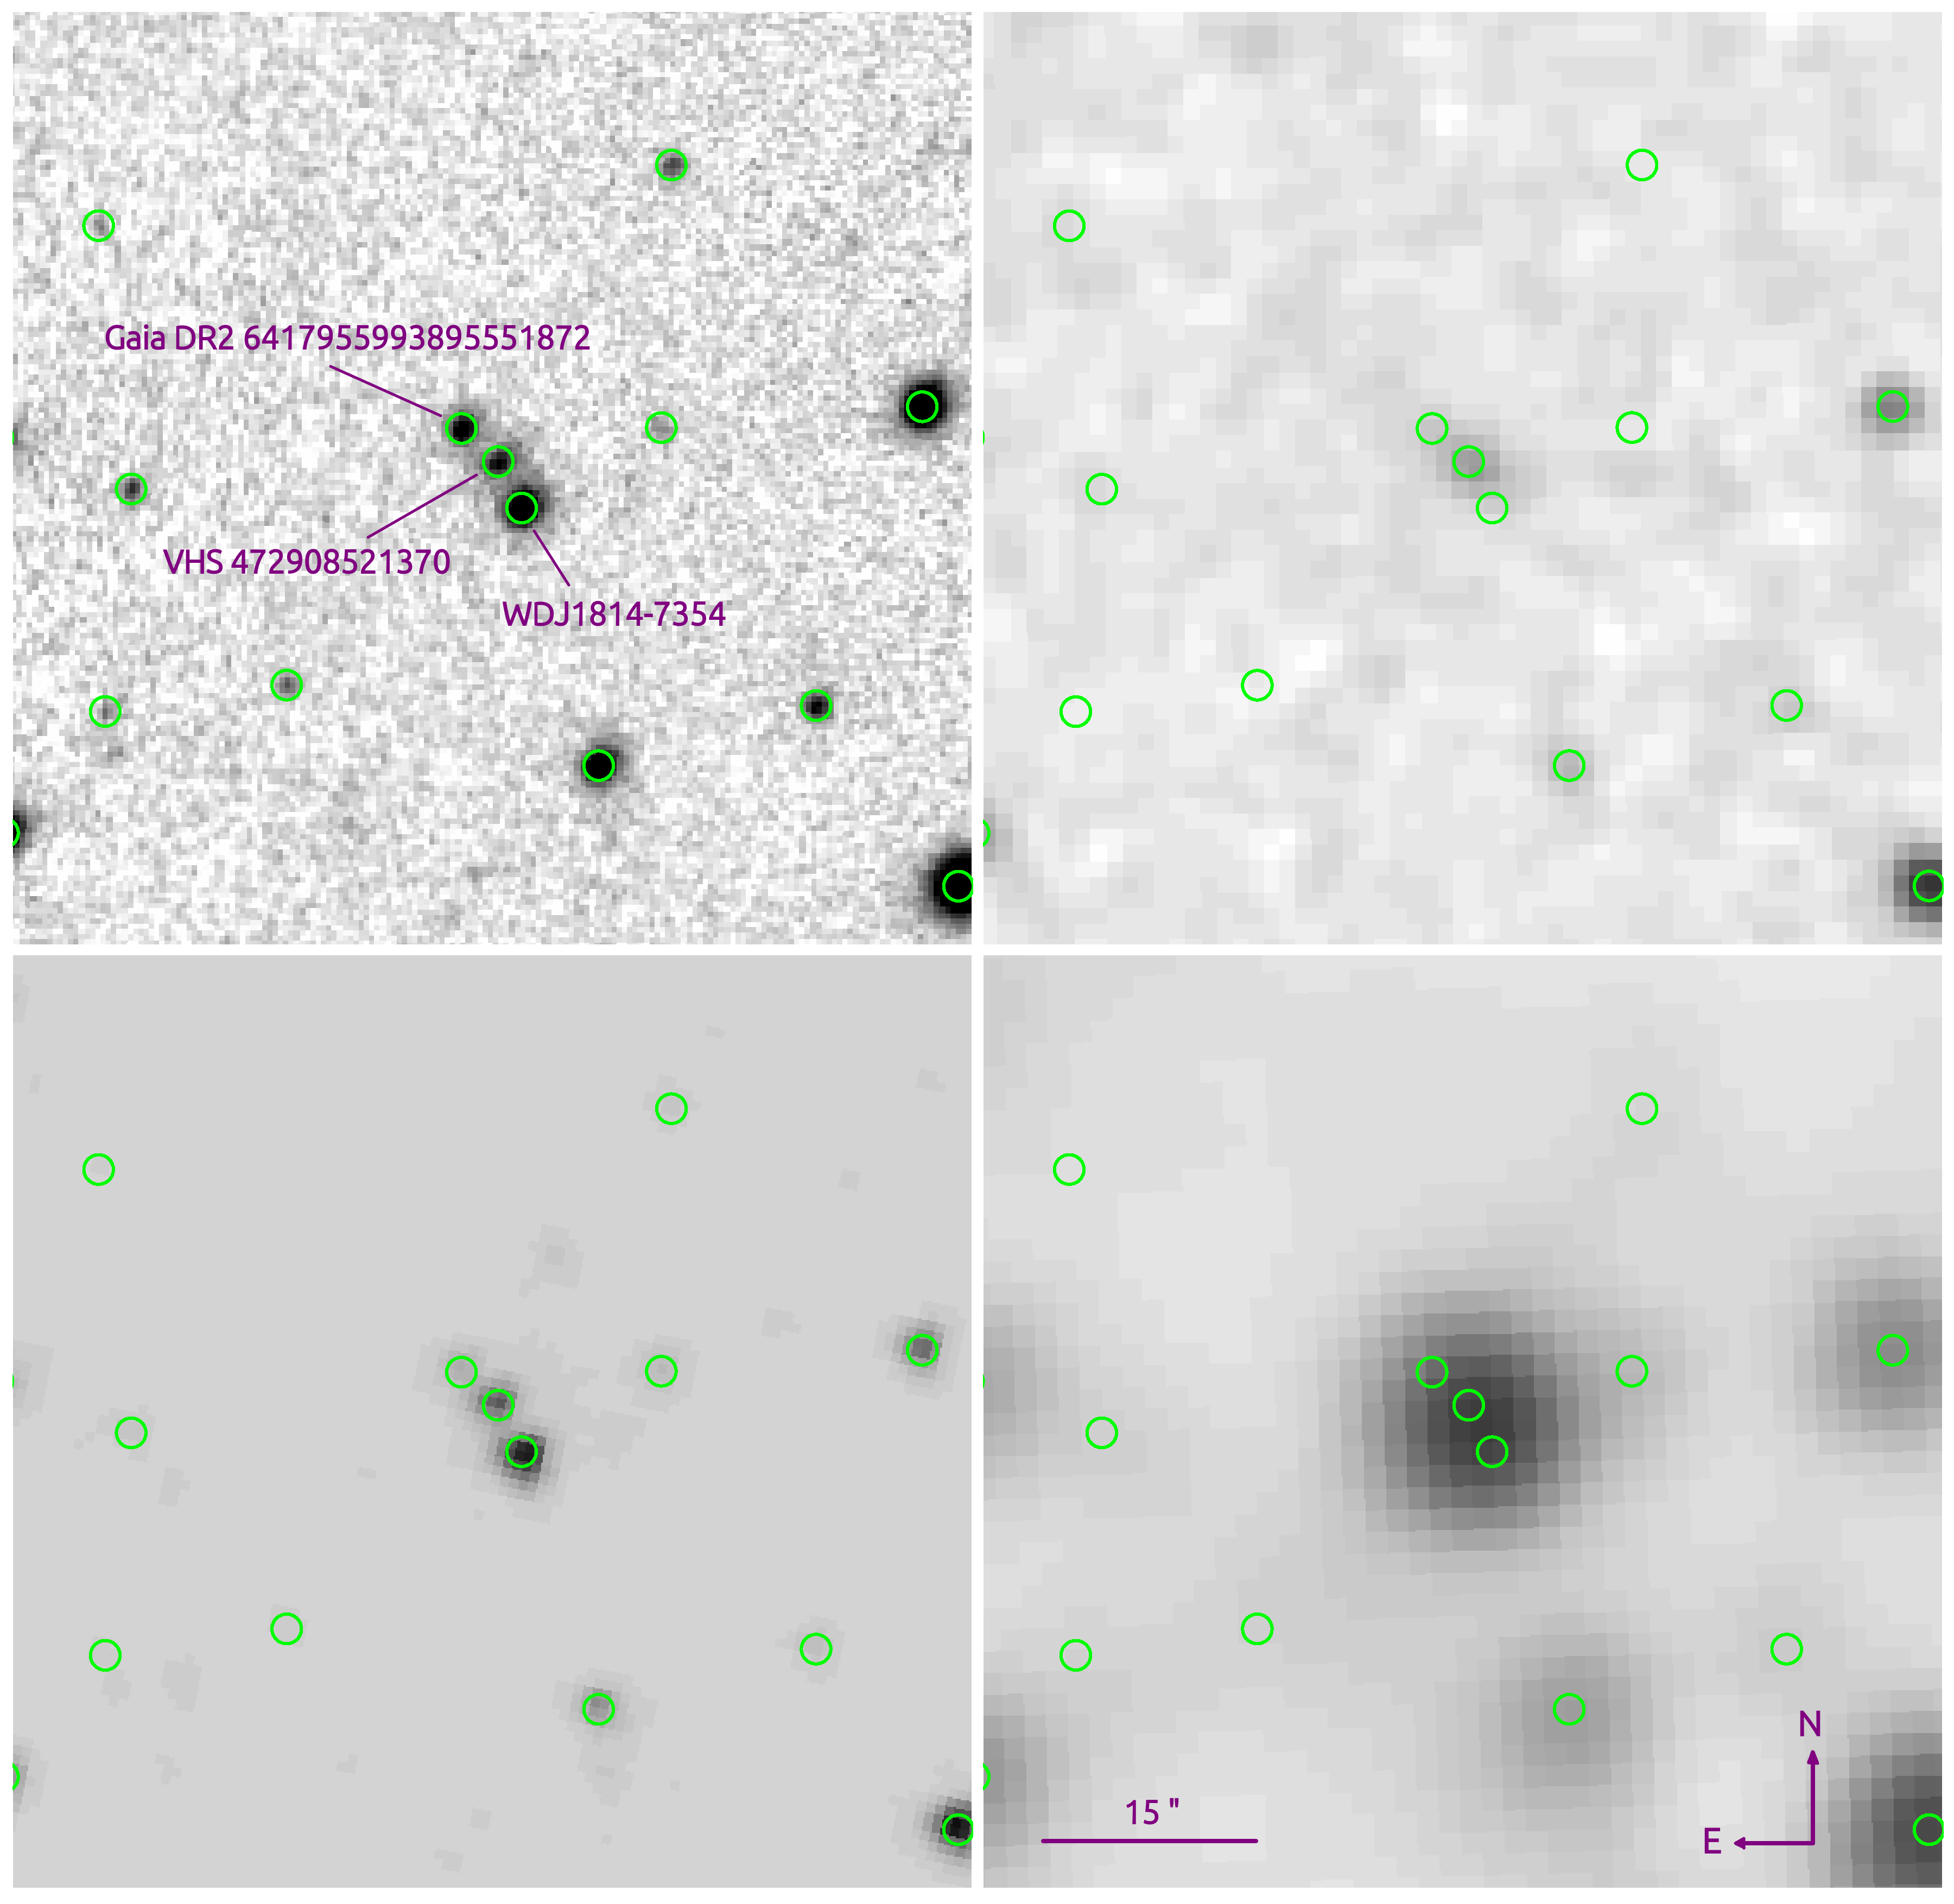
After comparing images and photometry from the Two Micron All Sky Survey (2MASS; Skrutskie et al., 2006) and VHS (VISTA Hemisphere Survey; McMahon et al. 2019) and from unWISE and WISE (see Fig. 2), we noted that the 2MASS and WISE detections are the blend of multiple objects. The WISE single source appears as two resolved sources in the unWISE catalogue, based on deeper imaging obtained after the coaddition of all 3-5 m WISE images and with improved modeling of crowded regions (Schlafly et al., 2019). Three sources are detected by VHS.
Two objects are identified in Gaia DR2, one corresponding to the white dwarf and the other is identified as Gaia DR2 6417955993895551872, for which its Gaia DR2 information is presented in Table 3. VHS and unWISE photometry for this source and the third source, identified as VHS 472908521370, is presented in Table 4. VHS 472908521370 has no counterpart in Gaia DR2. The angular separation from WDJ18147354 is 3.2 arcseconds for VHS472908521370 and 6.3 arcseconds for Gaia DR2 6417955993895551872. These additional objects are likely contributing to the 2MASS and WISE IR excess, but their contribution to optical photometry is negligible: Gaia DR2 6417955993895551872 is 3.5 mag fainter in the G-band with respect to WD18147354. VHS 472908521370 is even fainter, given its non-detection in Gaia DR2, which combined with its VHS colours indicate a very red object.
| Gaia Source ID | Gaia DR2 6417955993895551872 |
|---|---|
| [deg] | 273.57335015736 |
| [deg] | 73.91602610506 |
| [mas yr] | 7.40.1 |
| [mas yr] | 41 |
| [mas] | 1.80.8 |
| G [mag] | 19.8770.008 |
| GBP [mag] | 20.620.08 |
| GRP [mag] | 18.670.03 |
| GBP GRP [mag] | 1.950.11 |
| d [pc] | 3200 |
Gaia DR2 6417955993895551872 is likely a distant background object, as its proper motion is very small and not compatible with that of WDJ18147354, and its distance is not well constrained. This object has also photometric information in VHS catalog but not in the unWISE catalog.
| Band (survey) | VHS 472908521370 | Gaia DR2 |
|---|---|---|
| 6417955993895551872 | ||
| J (VHS) [mag] | 17.780.04 | 17.2630.025 |
| Ks (VHS) [mag] | 16.180.04 | 16.520.06 |
| J Ks [mag] | 1.60.08 | 0.740.08 |
| W1 (unWISE) [mag] | 15.1440.011 | |
| W2 (unWISE) [mag] | 14.6430.024 | |
| W1 W2 [mag] | 0.500.03 |
3 Follow-up observations
3.1 X-SHOOTER spectroscopy
3.1.1 Observations in 2011
WDJ18147354 was observed on 2011 September 18 with the multi-wavelength X-SHOOTER spectrograph (Vernet et al., 2011), mounted at the Cassegrain focus of the Very Large Telescope (VLT) UT2 in Cerro Paranal (Chile), as part of the ESO programme ID 087.C0639B. The observing mode was SLITSPEC 100k/1pt/hg, longslit spectroscopy with auto-nodding along the slit. The three X-SHOOTER arms covering the ultraviolet (UVB, 30005595 Å), visible (VIS, 559510240 Å) and near-infrared (NIR, 1024024800 Å) parts of the spectrum were used to take four subsequent exposures of 500 seconds each (590 in the case of the NIR arm), giving 2000 seconds of total exposure time for the UVB and VIS arms and 2360 seconds for the NIR arm. We used narrow slits of 1.0" width for the UVB arm and 0.9" for the VIS and NIR arms, giving spectral resolutions of 5400 (UVB), 8900 (VIS) and 5600 (NIR). The signal-to-noise ratio (SNR) achieved was around 40 for the VIS and 20 for the UVB part of the spectrum, enough for precise model fitting. The NIR part did not contain useful information for white dwarf modelling or abundance analysis. The weather conditions of the observing night were good, with seeing around 0.50.6", and the airmass was 1.51.6 during the observations of this target.
3.1.2 Observations in 2019
WDJ18147354 was observed again in 2019 with X-SHOOTER as part of the ESO programme ID 0103.C-0431(B), with PI S. Xu. Stare mode was used, and the exposure times are as follows: 2 exposures of 1700 seconds with the UVB arm (total of 3400 seconds) and 2 exposures of 1729 seconds with the VIS arm (3458 seconds total). The NIR part was not needed, so just 1 exposure of 100 seconds was taken. The signal-to-noise ratio (SNR) achieved was around 35 for the VIS and 20 for the UVB part of the spectrum. The weather conditions of the observing night were excellent, with seeing around 0.40.5", and the airmass was around 1.61.7 during the observations.
To reduce both spectra we used the ESO X-SHOOTER reduction pipeline (Modigliani et al., 2010) and the software esoreflex333Available at https://www.eso.org/sci/software/esoreflex/.
3.2 Spitzer observations
WDJ18147354 was observed with Spitzer on 2019 July 10 as part of the DDT program ID 14220, with PI Dr. Siyi Xu (see Xu et al. 2020), with the instrument and mode IRAC/Map PC, in both bands IRAC [3.6] and [4.5], centered at wavelengths 3.6 and 4.5 microns, respectively. The observing strategy was 30 seconds frame time with 11 medium size dithers for each wavelength.
The Spitzer [3.6] band image of WDJ18147354 is shown in Fig. 2 (bottom-left panel). Three sources are clearly distinguished in the Spitzer images. The relative fluxes of two of these sources (at the positions of WDJ18147354 and VHS 472908521370) were extracted after performing aperture photometry on successfully PSF-fitted sources positions using the stack of images, following Recipe 7 of the IRAC Instrument Handbook444Available at %TT␣every␣character␣and␣hyphenate␣after␣ithttps://irsa.ipac.caltech.edu/data/SPITZER/docs/irac/iracinstrumenthandbook/IRAC_Instrument_Handbook.pdf adapted to the command-line mopex (Makovoz & Marleau, 2005). Passive deblending of the sources was automatically performed with mopex routines, to take contamination from nearby sources into account. The uncertainty in Spitzer fluxes was the sum between the uncertainty obtained after the MOPEX extraction and the median values of the rms variatins due to the relative repeatability of IRAC reported by Reach et al. (2005) of 1.7 per cent for channel 1 and 2.2 per cent in channel 2.
The Spitzer fluxes were later corrected following section 7.9 of the IRAC Instrument Handbook. The first correction was applied by dividing the PRF fluxes by the correction factors in table C.1 of the IRAC Instrument Handbook, whose values are 1.021 for IRAC1 and 1.012 for IRAC2. The second correction mentioned was not applied, as this correction applies to blue sources, being null for red sources like our target.
Apparent magnitudes were computed using Vega zero flux values determined with the Python Pyphot package, that agree with the zero fluxes listed in the IRAC Instrument Handbook (280.94.1 Jy for IRAC [3.6] and 179.72.6 Jy for IRAC45). The results are presented in Table 5.
| WDJ18147354 | VHS 472908521370 | |
|---|---|---|
| [Jy] | 5917 | 2975 |
| [Jy] | 6439 | 353.26 |
| [mag] | 14.1850.013 | 14.9330.017 |
| [mag] | 13.6220.015 | 14.2720.017 |
3.3 FIRE spectroscopy
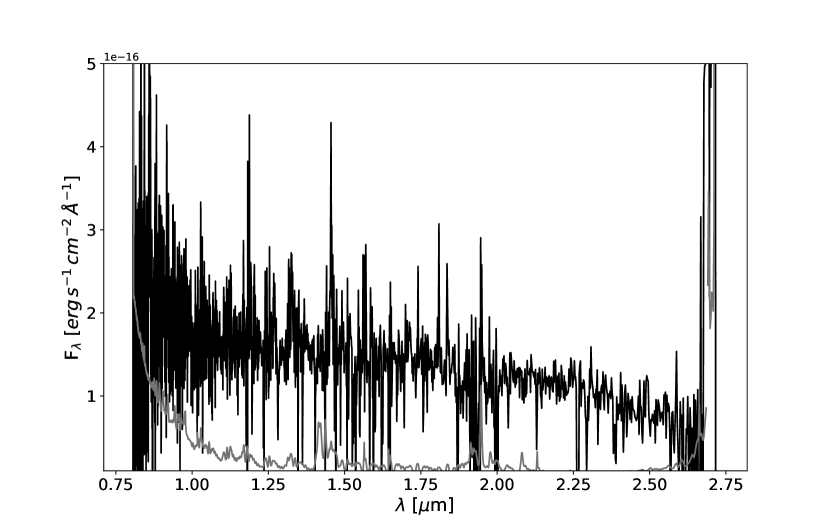
We explored the possibility of VHS 472908521370 being a cool companion of WDJ18147354. If we place it at the same distance as WDJ18147354, its absolute magnitudes in J and Ks VHS bands and in Spitzer bands would be consistent with a brown dwarf of spectral type L5.5-L6, according to the relations from Dupuy & Liu (2012; Table 14). To discard or confirm this possibility, we obtained a spectrum of this object with the Folded-port InfraRed Echellette (FIRE, Simcoe et al. 2013) at the Magellan Baade telescope, Las Campanas observatory, on the night of June 02 2019. We used the low-resolution prism mode, with a 0.6" wide slit, to obtain 8 exposures with a total integration time of 1732 sec (28,8 min). We used the typical ABBA nodding pattern.
We used the firehose pipeline (Fica et al., 2016) to reduce the spectra which include: flat fielding, wavelength calibration, A-B pair subtraction to remove first-order sky emission. We then trace the spectra in each positive and negative feature and remove the residual background emission using the flux that fell on the slit. We then combined the 8 individual spectra using a robust weighted mean. For telluric correction and flux calibration we used the A0V star HD 167061 and we reduced following an identical procedure than for the object and to construct and apply the telluric correction we used the IDL based task xtellcor (Vacca et al., 2003).
The FIRE spectrum is shown in figure 3. Although the signal-to-noise ratio is 1.9, it does not show any evident characteristic features of substellar objects, such as strong water bands, iron hydrates (FeH), NaI, CO or methane absorption. We therefore conclude that VHS 472908521370 is likely another background object. It is brighter in the infrared and closer to the white dwarf than Gaia DR2 6417955993895551872, and it is likely contributing to 2MASS and WISE photometry.
4 Analysis
4.1 White dwarf properties
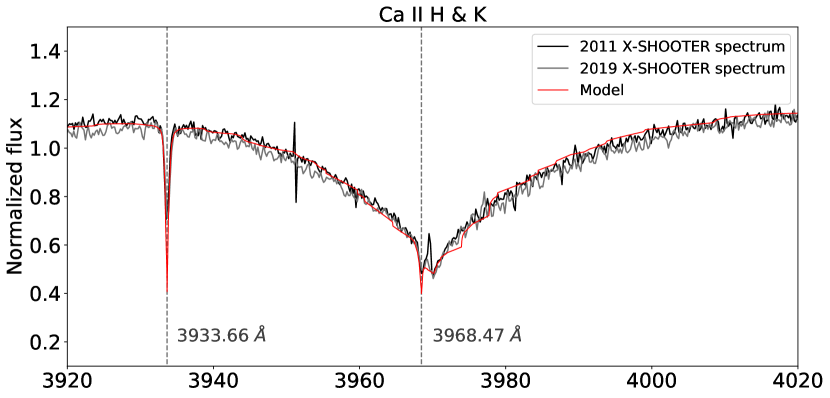
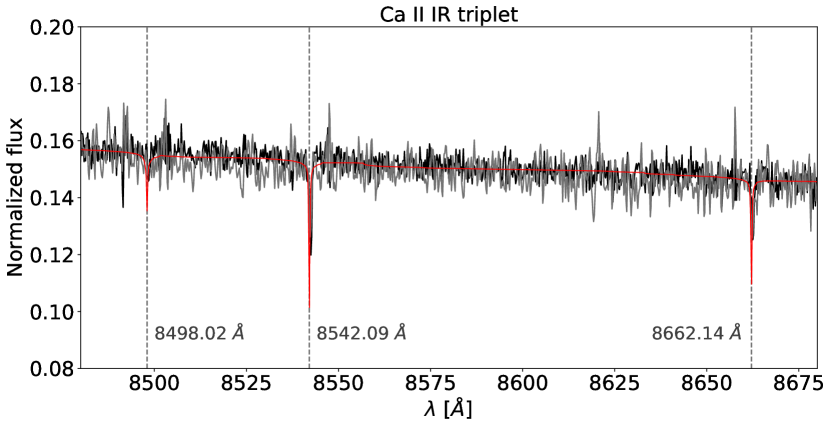
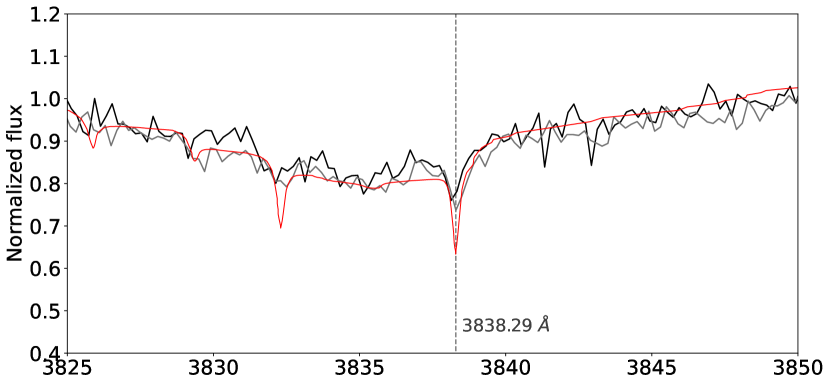
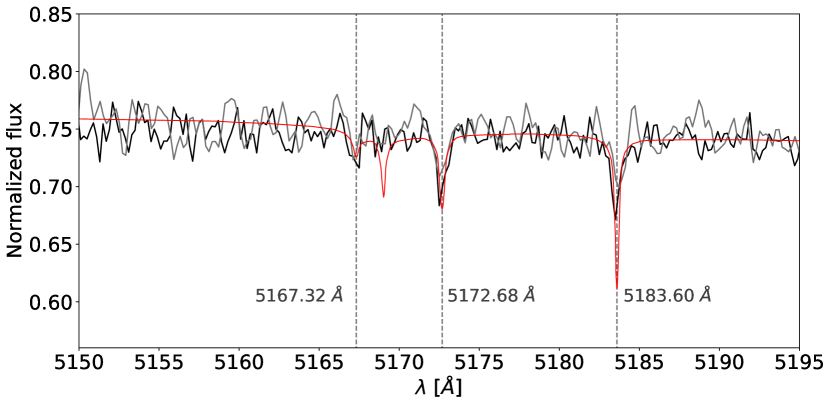
The spectrum of WDJ18147354 is that of a typical DAZ white dwarf, characterised by broad Balmer lines and absorption from Mg i–ii and Ca i–ii species and weaker absorption lines from Fe i. Examples of Mg and Ca lines in both 2011 and 2019 spectra are shown in Figs 4–5. Fe lines are not shown in the figures due to their faintness, but with a large number of them and consistent results we are confident of the Fe detection.
We analysed the combined UVB and VIS 2011 spectra via comparison with a grid of synthetic spectra modelled with the stellar atmosphere code outlined by Koester (2010); Koester et al. (2020). The NIR spectrum was not used due to its low SNR. The 2019 spectrum was used to investigate the potential variability of metal absorption lines within the 1-sigma errors (see Section 4.2).
We started by fitting the full Balmer series, incrementally including the identified pollutants after finding the initial best fit and subsequently adjusting the result. The best-fit is obtained for K and . Statistical uncertainties are negligible due to the high SNR of the optical spectrum. Subsequently, we performed a photometric fit of the available APASS and Gaia DR2 photometry (Table 2), in which we used the Gaia DR2 parallax and the white dwarf mass-radius relation (Fontaine et al., 2001) as additional priors. We have not used VHS photometry to be sure that the IR excess has no effect in the fit. The photometric fit delivers a 0.1 dex-lower surface gravity. Hence, we iterated between spectroscopic ( fixed) and photometric ( fixed) fits, until both methods converged to a final solution. The difference between the initial spectroscopic fit and the final result is adopted as the error estimate, resulting in K and . The interstellar reddening obtained as a result of our fitting procedure is negligible, and of the order of 0.01 mag.
We measured the radial velocities of the strongest metal lines via fitting gaussian models and estimate the uncertainty as the scatter between the measurements of the different lines. For the 2011 spectrum we obtained an average radial velocity of = 445 km s-1 and for the 2019 spectrum, = 478 km s-1. The individual radial velocities for the different lines are presented in table 6.
The atmospheric parameters of WDJ18147354 correspond to a white dwarf mass of M☉ and a cooling age of Gyr. Using the Cummings et al. (2018) initial-to-final-mass relation (IFMR), we infer a progenitor mass of M☉. To estimate the progenitor age we used the evolutionary tracks of Choi et al. (2016). For a progenitor mass of 1.3 M☉ (late F-type star), the progenitor age is Gyr, and the total age of the white dwarf would be + = 5.8 Gyr. The large systematic uncertainty implied by the empirical IFMR translates into a large uncertainty on the progenitor age. For the upper limit of the progenitor mass of 1.8 M☉ (a late A-type star), the progenitor age would be Gyr, so the lower limit on the total age of the white dwarf is 4 Gyr. The upper limit on the total age is unconstrained, because the lower limit of the progenitor mass is 0.9 M☉ (an early K dwarf star), whose lifetime could be comparable or longer than the age of the Universe.
| Line (Wavelength) [Å] | RV2011 [km s-1] | RV2019 [km s-1] |
|---|---|---|
| Ca ii (3933.66) | 46 | 54 |
| Ca ii (3968.47) | 58 | 54 |
| Ca ii (8662.14) | 47 | 31 |
| Ca i (4226.73) | 39 | 48 |
| Mg i (3838.29) | 41 | 52 |
| Mg i (5167.32) | 42 | 41 |
| Mg i (5172.68) | 46 | 40 |
| Mg i (5183.69) | 43 | 56 |
4.2 Composition of the accreted material and diffusion timescales
The abundances of the three detected elements (Mg, Ca, and Fe) are given in Table 7. The listed abundances and uncertainties are the averages and the standard deviations inferred from the modelling of the strongest lines for each detected element: lines at 3933.66, 3968.47, 8498.02, 8542.09, 8662.14 (Ca ii) and 4226.73 Å (Ca i) for Calcium; lines at 4481.13 (Mg ii), 3838.29, 5167.32, 5172.68 and 5183.69 Å (Mg i) for Magnesium; and lines at 3609, 3619, 3632, 3720, 3738, 3750, 3759, 3816, 3821 and 3826 Å for iron (Fe i). In addition, we derive upper limits for Na, Al, Si, P, S, Ti, and Ni.
Using the accretion-diffusion models of Koester (2009), we estimate a mass-fraction contained within the convection zone of . The diffusion time-scales of the three detected pollutants are of the order of 10–20 yr. Given these relatively short diffusion timescales, we tested whether any measurable changes occurred during the -yr baseline between our first observation and the more recent 2019 spectrum. For the three strongest lines of CaII and MgI there is an indication that the equivalent widths of 2019 spectrum are smaller by 36 per cent than in 2011. The lines have the same widths, but are slightly less deep, which might be caused by a small difference in resolution of the two spectra. This difference is marginally compatible with the mutual errors. For the smaller lines, any differences are within the errors. If the differences are real, they would correspond to differences in the abundances by about 0.02-0.04 dex, within the errors of our determinations. We interpret this result as an indication of WDJ18147354 currently accreting from its debris disc.
In Table 7, we list the diffusion timescales, defined as the time necessary for the flux to be reduced by 1/e, corresponding to the model atmosphere of WDJ18147354 and the accretion fluxes we measure for each detected elements as well as those with upper limits. The accretion flux is defined as , where is the mass of the white dwarf, is the atomic weight and , being the mass of the convection zone. The systematic errors from the parameters on the accretion fluxes largely cancel when we use abundance ratios.
| Element | [Z/H] | [yrs] | log|| [g s-1] |
|---|---|---|---|
| Na | <7.40 | 22.42 | <7.124 |
| Mg | 6.140.08 | 21.66 | 8.420.08 |
| Al | <7.30 | 19.78 | <7.35 |
| Si | <6.00 | 19.32 | <8.67 |
| P | <4.50 | 17.701 | <10.26 |
| S | <4.50 | 17.33 | <10.28 |
| Ca | 7.220.15 | 14.415 | 7.740.15 |
| Ti | <8.00 | 12.21 | <7.12 |
| Fe | 6.060.19 | 10.814 | 9.170.19 |
| Ni | <6.30 | 10.44 | <8.96 |
| Total | 9.250.17 |
4.3 Disc model fit
The infrared excess of WDJ18147354 detected by 2MASS and WISE persists in the higher-resolution photometry of VHS, unWISE and Spitzer (see Fig. 6).
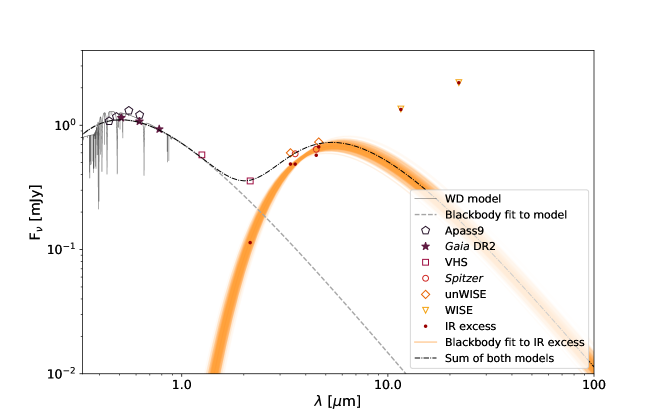
We have estimated the IR excess as the difference between a blackbody fit to the white dwarf model scaled to Gaia band GRP photometry and the resolved photometry (VHS, unWISE and Spitzer). We have modelled this IR excess with a simple blackbody function:
| (1) |
where is the Plank constant, the speed of light, KB the Boltzmann constant, T the temperature of the blackbody and is the scaling factor.
We have used a blackbody model instead of a Flat Ring Model because we lack reliable photometry for wavelengths longer than 4.5 m, necessary to properly constrain the inner and outer temperatures of the disc. We note the limitations of using a single temperature blackbody to model the dust and that more detailed modelling is required to fully constrain the properties of the disc.
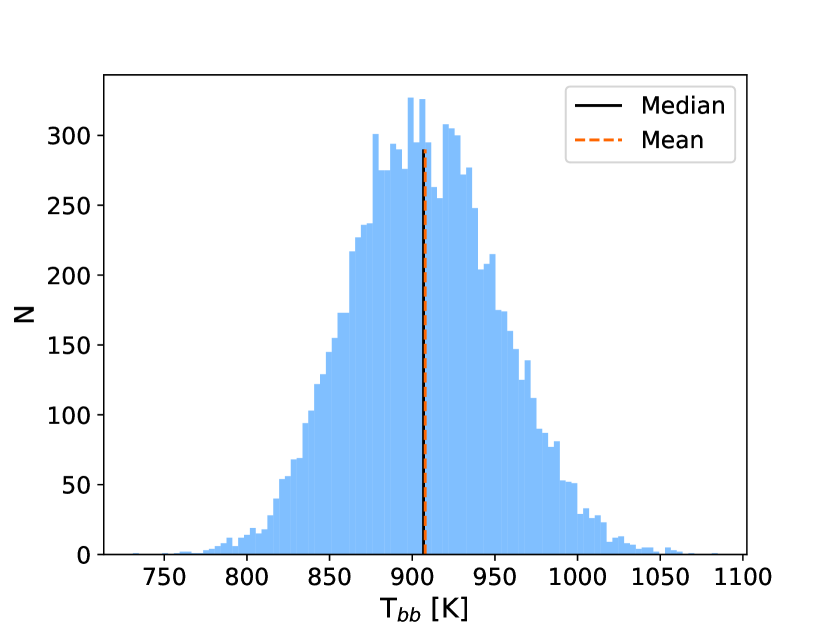
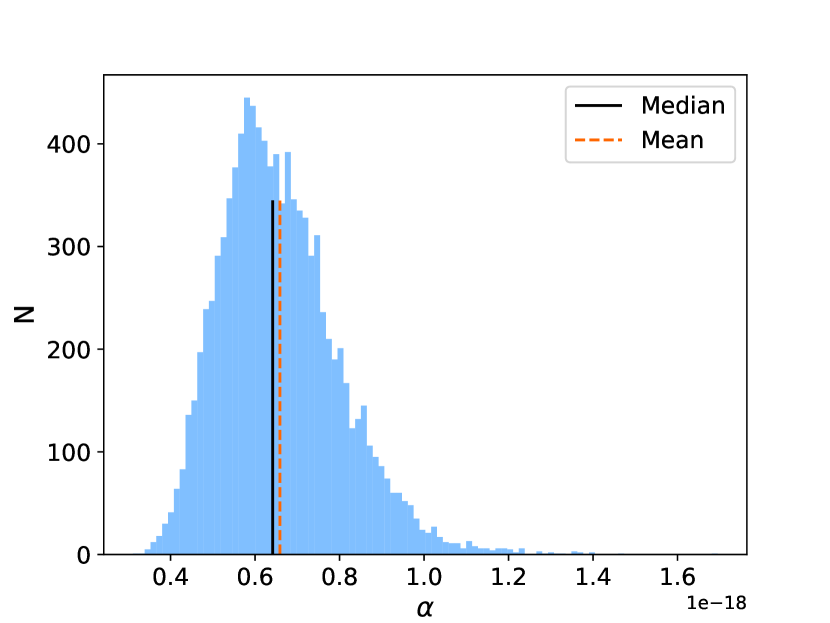
For computing the parameters of the disc blackbody model fit ( temperature Tbb of the disc and scaling factor ) and their uncertainties, we have produced a set of 10,000 simulated random data points drawn from a Gaussian distribution, with mean equal to each IR excess value (excluding the blended 2MASS and WISE photometry) and equal to its corresponding error, obtained after a linear propagation of the errors from the photometry and the previous blackbody fit to the white dwarf model.
We have fit the blackbody model to each of the 10,000 data sets and we have obtained the two parameter distributions shown in Fig. 7. The effective temperature distribution is a gaussian distribution, whose median and standard deviation is = 91050 K. The scaling factor is proportional to Rd, where Rbb is the radius of the blackbody and d the distance to the system. The mean value of the distribution of the scaling gives a rough estimate of R 1011 cm 100 R.
In Fig. 6, a random set of 500 blackbody fits is shown along with the IR excess data points, the photometry, the scaled white dwarf model and its blackbody fit and the sum of this fit and the disc model corresponding to the obtained parameters. We can see that the resolved photometry is reasonably well fitted with this model. The reduced of the fit to the IR excess is 2.5.
5 Discussion
The discovery of the disc around WDJ18147354 was serendipitous, as the initial search in which this object was found was aiming to identify white dwarf + ultracool dwarf pairs. This object was not found in previous searches for discs around white dwarfs. An explanation could be that the background objects made its IR excess unlikely to be due to a disc, until the photometry was recently deblended. This is an issue for WISE selected white dwarfs with infrared excesses, as noted recently by Dennihy et al. (2020b).
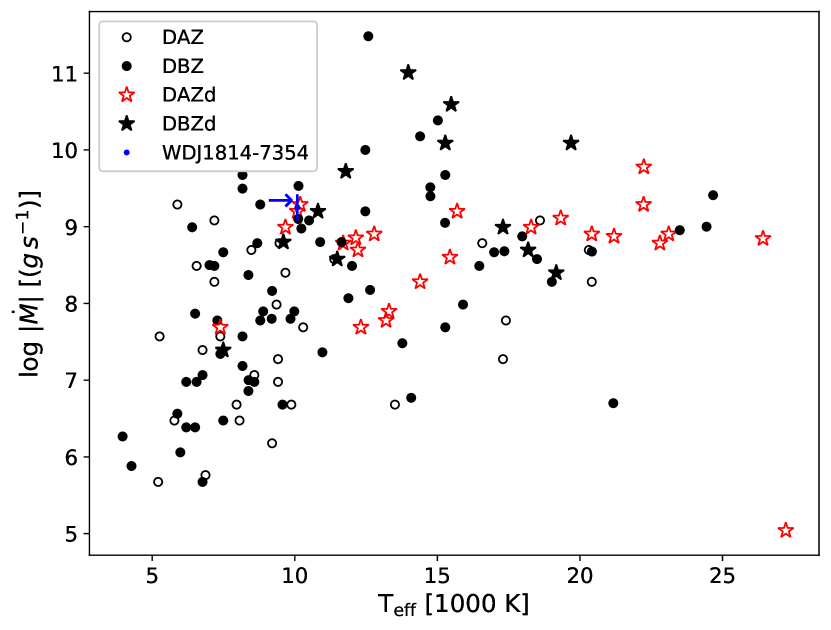
The total estimated accretion flux of g s-1, presented in Table 7, is higher than the average value for DAZ type objects with detected discs, (see table 6 of Xu et al. 2019), as can be also seen in Fig. 8. In this figure, we have placed WDJ18147354 in Fig. 10 of Farihi (2016), updated with data from Swan et al. (2019b) and Xu et al. (2019), to compare it with other white dwarfs with measured accretion rates from the literature. It has the fourth highest accretion flux of the DAZd type (defined by von Hippel et al. 2007 as white dwarf of DAZ type with a detected circumstellar disc), and this flux is higher than 83.8 per cent of all the other white dwarfs shown in the plot. We can see that WDJ18147354 is also one of the coolest (hence, with longer cooling ages) DAZ white dwarfs with discs known to date, with only 16 per cent of this sample having lower temperatures, and it is the third coolest of the known sample of 17 DAZd white dwarfs.
We have estimated the fractional disc luminosity () of our system by calculating the bolometric fluxes of the IR excess and the white dwarf. To do so, we have integrated the blackbody models of the IR excess and the white dwarf within the limits where the flux drops 99.99 per cent. The uncertainty for each bolometric flux has been estimated as the standard deviation of a distribution of 10,000 blackbody models created by randomly varying the model parameters within their errors. We have compared the fractional luminosity obtained with that of other systems from the literature in Fig. 9. We can see that WDJ18147354 disc luminosity fraction is among the largest of the discovered systems. In this plot it is the largest for cool white dwarfs (with K), although many systems from the literature do not have fractional luminosities available and were not included in this plot, and the available data for the rest does not include uncertainties, so the comparison has to be taken with caution.
Finally, under the assumption that WDJ18147354 is currently accreting debris from a circumstellar reservoir in a steady state, i.e. with equilibrium between accretion and diffusion, we can estimate the accreted body composition, relative to Fe, via the following equation, (cf. Koester, 2009; Gänsicke et al., 2012):
| (2) |
where is the number abundance of element and its atomic weight.
Thus, we can compare the composition of the accreted material of WDJ18147354 with that of Solar system bodies and of other polluted white dwarfs from the literature (see Fig. 10). A steady state can be assumed to be valid for white dwarf atmospheres that are characterised by short diffusion timescales, like for WDJ18147354, and systems that do not show line or disc variability. Veras & Heng (2020); Girven et al. (2012); Farihi et al. (2012) show that disc lifetimes are expected to be much longer than such diffusion timescales. In our case, the disc could have been building up material for 10 years, and it is expected not to show a change in its composition if the accretion timescale is longer than the diffusion timescale.
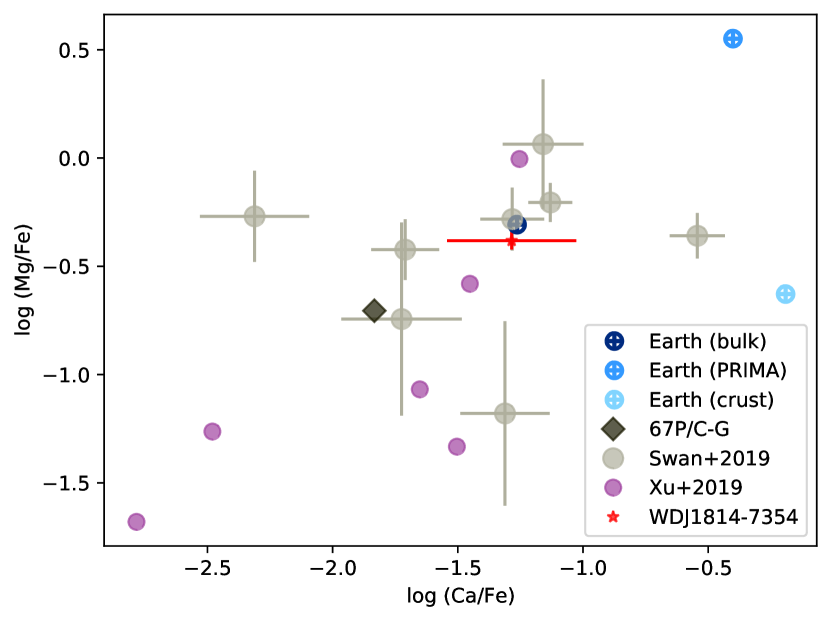
The material being accreted by WDJ18147354 has similar metal ratios of Ca/Fe and Mg/Fe like those of bulk Earth, as can be seen in Fig. 10. The upper limits available for other elements do not allow a wider comparison with the chemical profile of known Solar system bodies, as it has been done for other stars in the literature. We cannot accurately determine the total mass of the disc (See e.g Dufour et al., 2010) but we can estimate the mass of the accreted material. By multiplying the order of magnitude of the estimated lifetime of white dwarf discs, yrs (Girven et al., 2012), with our measured total accretion rate of detected elements of g s-1, given in Table 7, we obtain kg of accreted material, which is in the region of masses of Solar system asteroids such as 13 Egeria (Baer et al., 2011) or 48 Bamberga (Carry, 2012). This finding supports the evidence that rocky minor planetary bodies with Earth-like composition form around Sun-like stars elsewhere.
6 Summary
We have presented a spectroscopic and photometric analysis of the white dwarf WDJ18147354, an object originally identified to have a strong infrared excess in the 2MASS and WISE catalogues. We confirmed this IR excess to be intrinsic to the white dwarf, and likely corresponding to the emission of a dusty disc around the star. The finding of Ca, Fe and Mg absorption lines in the X-SHOOTER spectrum of the white dwarf is further evidence of accretion from a dusty disc.
We have compared the circumstellar metal lines in two spectra taken 8 years apart, finding no significant changes in radial velocities or in equivalent widths. This is not surprising, as the diffusion timescales derived in Section 4.2 for Mg, Ca and Fe go from 10 to 22 years, and as there has not yet been found unambiguously variability in white dwarf absorption metallic lines. Due to the blended photometry for this object in most IR surveys, we cannot study the potential variability of WDJ18147354 in the IR without follow-up observations.
The ratio of the disc and white dwarf luminosities is among the highest from the literature for a relatively cool white dwarf. From the analysis of the composition of the accreted material and the estimated total accretion rate, we suggest the possibility that a minor body was tidally disrupted into forming the disc of debris material around WDJ18147354.
Acknowledgments
We thank the anonymous referee for a quick and adequately thorough revision of this manuscript. EGE acknowledges Astronomers for Planet Earth555https://astronomersforplanet.earth/ and recent works that raise awareness about CO2 emissions from our professional activities (See e.g Burtscher et al., 2020; Stevens et al., 2020) and commits to not travel anywhere by aeroplane for the purpose of promoting this paper. EGE also thanks Andrew Swan and astronomy PhD students in the University of Hertfordshire for helpful discussions. We thank Dr. Siyi Xu and Dr. Amy Bonsor for kindly sharing their recent X-SHOOTER and Spitzer observations of this white dwarf. We thank Beth Klein and Jay Farihi for a helpful discussion that improved this article.
EGE and WJC are supported by a University of Hertfordshire PhD studentship. Part of this work was possible thanks to the support of the Royal Astronomical Society via the RAS grant E. A. Milne Travelling Fellowship awarded to EGE. RR has received funding from the postdoctoral fellowship programme Beatriu de Pinós, funded by the Secretary of Universities and Research (Government of Catalonia) and by the Horizon 2020 programme of research and innovation of the European Union under the Maria Skłodowska-Curie grant agreement No 801370. FM acknowledges support from the NASA Postdoctoral Program at the Jet Propulsion Laboratory, administered by Universities Space Research Association under a contract with NASA. FM also acknowledges support from grant #80NSSC20K0452 under the NASA Astrophysics Data Analysis Program. JCB acknowledges support from FONDECYT postdoctorado 3180716. LKR would like to acknowledge funding from The Science and Technology Facilities Council and the Institute of Astronomy, Cambridge.
Based on observations collected at the European Southern Observatory under ESO programmes 087.C0639(B) (PI Dr. Avril Day-Jones) and 0103.C-0431(B) (PI Dr. Siyi Xu, Rogers et al. in prep.), and observations by Spitzer space telescope, DDT program ID 14220, with PI Dr. Siyi Xu (Lai et al. in prep.). This work has made use of data from the European Space Agency (ESA) mission Gaia (https://www.cosmos.esa.int/gaia), processed by the Gaia Data Processing and Analysis Consortium (DPAC, https://www.cosmos.esa.int/web/gaia/dpac/consortium). Funding for the DPAC has been provided by national institutions, in particular the institutions participating in the Gaia Multilateral Agreement. The VISTA Data Flow System pipeline processing and science archive are described in Irwin et al. (2004), Hambly et al. (2008) and Cross et al. (2012). We have used data from the 6th data release (VHSDR6).
Data Availability
All data underlying this article is publicly available from the relevant observatory archive (see section 3 and acknowledgements) or it is available on https://doi.org/10.5281/zenodo.4268013
References
- Aannestad & Sion (1985) Aannestad P. A., Sion E. M., 1985, AJ, 90, 1832
- Astropy Collaboration et al. (2013) Astropy Collaboration et al., 2013, A&A, 558, A33
- Baer et al. (2011) Baer J., Chesley S. R., Matson R. D., 2011, AJ, 141, 143
- Bailer-Jones et al. (2018) Bailer-Jones C. A. L., Rybizki J., Fouesneau M., Mantelet G., Andrae R., 2018, AJ, 156, 58
- Barber et al. (2014) Barber S. D., Kilic M., Brown W. R., Gianninas A., 2014, ApJ, 786, 77
- Bruhweiler & Kondo (1981) Bruhweiler F. C., Kondo Y., 1981, ApJ, 248, L123
- Burtscher et al. (2020) Burtscher L., Barret D., Borkar A. P., Grinberg V., Jahnke K., Kendrew S., Maffey G., McCaughrean M. J., 2020, Nature Astronomy, 4, 823
- Carry (2012) Carry B., 2012, Planetary and Space Science, 73, 98
- Choi et al. (2016) Choi J., Dotter A., Conroy C., Cantiello M., Paxton B., Johnson B. D., 2016, ApJ, 823, 102
- Cross et al. (2012) Cross N. J. G., et al., 2012, A&A, 548, A119
- Cummings et al. (2018) Cummings J. D., Kalirai J. S., Tremblay P. E., Ramirez-Ruiz E., Choi J., 2018, ApJ, 866, 21
- Cutri et al. (2013) Cutri R. M., et al., 2013, Explanatory Supplement to the AllWISE Data Release Products, Explanatory Supplement to the AllWISE Data Release Products
- Day-Jones et al. (2008) Day-Jones A. C., et al., 2008, MNRAS, 388, 838
- Debes & López-Morales (2008) Debes J. H., López-Morales M., 2008, ApJ, 677, L43
- Debes et al. (2011) Debes J. H., Hoard D. W., Wachter S., Leisawitz D. T., Cohen M., 2011, ApJS, 197, 38
- Dennihy et al. (2018) Dennihy E., Clemens J. C., Dunlap B. H., Fanale S. M., Fuchs J. T., Hermes J. J., 2018, ApJ, 854, 40
- Dennihy et al. (2020a) Dennihy E., et al., 2020a, arXiv e-prints, p. arXiv:2010.03693
- Dennihy et al. (2020b) Dennihy E., Farihi J., Fusillo N. P. G., Debes J. H., 2020b, ApJ, 891, 97
- Dufour et al. (2010) Dufour P., Kilic M., Fontaine G., Bergeron P., Lachapelle F. R., Kleinman S. J., Leggett S. K., 2010, ApJ, 719, 803
- Dupuis et al. (1993) Dupuis J., Fontaine G., Pelletier C., Wesemael F., 1993, ApJS, 84, 73
- Dupuy & Liu (2012) Dupuy T. J., Liu M. C., 2012, ApJS, 201, 19
- Farihi (2016) Farihi J., 2016, New Astron. Rev., 71, 9
- Farihi et al. (2009) Farihi J., Jura M., Zuckerman B., 2009, ApJ, 694, 805
- Farihi et al. (2010) Farihi J., Barstow M. A., Redfield S., Dufour P., Hambly N. C., 2010, Monthly Notices of the Royal Astronomical Society, 404, 2123
- Farihi et al. (2012) Farihi J., Gänsicke B. T., Wyatt M. C., Girven J., Pringle J. E., King A. R., 2012, MNRAS, 424, 464
- Fazio et al. (2004) Fazio G. G., et al., 2004, ApJS, 154, 10
- Fica et al. (2016) Fica H. D., Lambrides E., Faherty J., Cruz K. L., BDNYC 2016, in American Astronomical Society Meeting Abstracts #227. p. 146.05
- Finkbeiner et al. (2004) Finkbeiner D. P., et al., 2004, AJ, 128, 2577
- Fontaine & Michaud (1979) Fontaine G., Michaud G., 1979, ApJ, 231, 826
- Fontaine et al. (2001) Fontaine G., Brassard P., Bergeron P., 2001, PASP, 113, 409
- Gänsicke et al. (2006) Gänsicke B. T., Marsh T. R., Southworth J., Rebassa-Mansergas A., 2006, Science, 314, 1908
- Gänsicke et al. (2012) Gänsicke B. T., Koester D., Farihi J., Girven J., Parsons S. G., Breedt E., 2012, MNRAS, 424, 333
- Gänsicke et al. (2019) Gänsicke B. T., Schreiber M. R., Toloza O., Fusillo N. P. G., Koester D., Manser C. J., 2019, Nature, 576, 61
- Gentile Fusillo et al. (2020a) Gentile Fusillo N. P., et al., 2020a, arXiv e-prints, p. arXiv:2010.13807
- Gentile Fusillo et al. (2020b) Gentile Fusillo N. P., Tremblay P.-E., Bohlin R. C., Deustua S. E., Kalirai J. S., 2020b, MNRAS, 491, 3613
- Girven et al. (2012) Girven J., Brinkworth C. S., Farihi J., Gänsicke B. T., Hoard D. W., Marsh T. R., Koester D., 2012, ApJ, 749, 154
- Hambly et al. (2001) Hambly N. C., et al., 2001, MNRAS, 326, 1279
- Hambly et al. (2008) Hambly N. C., et al., 2008, MNRAS, 384, 637
- Harris et al. (2020) Harris C. R., et al., 2020, Nature, 585, 357–362
- Hollands et al. (2017) Hollands M. A., Koester D., Alekseev V., Herbert E. L., Gänsicke B. T., 2017, MNRAS, 467, 4970
- Hora et al. (2004) Hora J. L., Latter W. B., Allen L. E., Marengo M., Deutsch L. K., Pipher J. L., 2004, ApJS, 154, 296
- Hunter (2007) Hunter J. D., 2007, Computing in Science and Engineering, 9, 90
- Irwin et al. (2004) Irwin M. J., et al., 2004, in Quinn P. J., Bridger A., eds, Society of Photo-Optical Instrumentation Engineers (SPIE) Conference Series Vol. 5493, Optimizing Scientific Return for Astronomy through Information Technologies. pp 411–422, doi:10.1117/12.551449
- Jura (2003) Jura M., 2003, ApJ, 584, L91
- Jura & Young (2014) Jura M., Young E., 2014, Annual Review of Earth and Planetary Sciences, 42, 45
- Jura et al. (2009) Jura M., Farihi J., Zuckerman B., 2009, AJ, 137, 3191
- Koester (2009) Koester D., 2009, A&A, 498, 517
- Koester (2010) Koester D., 2010, Mem. Soc. Astron. Italiana, 81, 921
- Koester, D. et al. (2005) Koester, D. Rollenhagen, K. Napiwotzki, R. Voss, B. Christlieb, N. Homeier, D. Reimers, D. 2005, A&A, 432, 1025
- Koester et al. (2020) Koester D., Kepler S. O., Irwin A. W., 2020, A&A, 635, A103
- Kramida et al. (2019) Kramida A., Ralchenko Y., Reader J., NIST ASD Team 2019, NIST Atomic Spectra Database (version 5.7.1) [Online], https://physics.nist.gov/asd
- Lindegren et al. (2018) Lindegren L., et al., 2018, A&A, 616, A2
- Makovoz & Marleau (2005) Makovoz D., Marleau F. R., 2005, PASP, 117, 1113
- Manser et al. (2016a) Manser C. J., et al., 2016a, MNRAS, 455, 4467
- Manser et al. (2016b) Manser C. J., Gänsicke B. T., Koester D., Marsh T. R., Southworth J., 2016b, MNRAS, 462, 1461
- Manser et al. (2020) Manser C. J., Gänsicke B. T., Gentile Fusillo N. P., Ashley R., Breedt E., Hollands M., Izquierdo P., Pelisoli I., 2020, MNRAS, 493, 2127
- McMahon et al. (2019) McMahon et al., 2019, VizieR Online Data Catalog, p. II/359
- Modigliani et al. (2010) Modigliani A., et al., 2010, in Observatory Operations: Strategies, Processes, and Systems III. p. 773728, doi:10.1117/12.857211
- Paquette et al. (1986) Paquette C., Pelletier C., Fontaine G., Michaud G., 1986, ApJS, 61, 197
- Probst (1983) Probst R. G., 1983, ApJS, 53, 335
- Reach et al. (2005) Reach W. T., et al., 2005, PASP, 117, 978
- Rocchetto et al. (2015) Rocchetto M., Farihi J., Gänsicke B. T., Bergfors C., 2015, MNRAS, 449, 574
- Rogers et al. (2020) Rogers L. K., Xu S., Bonsor A., Hodgkin S., Su K. Y. L., von Hippel T., Jura M., 2020, MNRAS, 494, 2861
- Schlafly et al. (2019) Schlafly E. F., Meisner A. M., Green G. M., 2019, ApJS, 240, 30
- Simcoe et al. (2013) Simcoe R. A., et al., 2013, PASP, 125, 270
- Skrutskie et al. (2006) Skrutskie M. F., et al., 2006, AJ, 131, 1163
- Smithsonian Astrophysical Observatory (2000) Smithsonian Astrophysical Observatory 2000, SAOImage DS9: A utility for displaying astronomical images in the X11 window environment (ascl:0003.002)
- Stevens et al. (2020) Stevens A. R. H., Bellstedt S., Elahi P. J., Murphy M. T., 2020, Nature Astronomy, 4, 843
- Swan et al. (2019a) Swan A., Farihi J., Wilson T. G., 2019a, MNRAS, 484, L109
- Swan et al. (2019b) Swan A., Farihi J., Koester D., Holland s M., Parsons S., Cauley P. W., Redfield S., Gänsicke B. T., 2019b, MNRAS, 490, 202
- Swan et al. (2020) Swan A., Farihi J., Wilson T. G., Parsons S. G., 2020, MNRAS, 496, 5233
- Vacca et al. (2003) Vacca W. D., Cushing M. C., Rayner J. T., 2003, PASP, 115, 389
- Veras & Heng (2020) Veras D., Heng K., 2020, MNRAS, 496, 2292
- Vernet et al. (2011) Vernet J., et al., 2011, A&A, 536, A105
- Virtanen et al. (2020) Virtanen P., et al., 2020, Nature Methods, 17, 261
- Visscher & Fegley (2013) Visscher C., Fegley Bruce J., 2013, ApJ, 767, L12
- Weiler (2018) Weiler M., 2018, A&A, 617, A138
- Wes McKinney (2010) Wes McKinney 2010, in Stéfan van der Walt Jarrod Millman eds, Proceedings of the 9th Python in Science Conference. pp 56 – 61, doi:10.25080/Majora-92bf1922-00a
- Wright et al. (2010) Wright E. L., et al., 2010, AJ, 140, 1868
- Wyatt et al. (2014) Wyatt M. C., Farihi J., Pringle J. E., Bonsor A., 2014, MNRAS, 439, 3371
- Xu & Jura (2014) Xu S., Jura M., 2014, ApJ, 792, L39
- Xu et al. (2019) Xu S., Dufour P., Klein B., Melis C., Monson N. N., Zuckerman B., Young E. D., Jura M. A., 2019, AJ, 158, 242
- Xu et al. (2020) Xu S., Lai S., Dennihy E., 2020, arXiv e-prints, p. arXiv:2009.00193
- Zuckerman et al. (2003) Zuckerman B., Koester D., Reid I. N., Hunsch M., 2003, ApJ, 596, 477
- Zuckerman et al. (2010) Zuckerman B., Melis C., Klein B., Koester D., Jura M., 2010, ApJ, 722, 725
- von Hippel et al. (2007) von Hippel T., Kuchner M. J., Kilic M., Mullally F., Reach W. T., 2007, ApJ, 662, 544