Trait-based indices to assess benthic vulnerability to trawling and model potential loss of ecosystem functions 111© 2020. This manuscript version is made available under the CC-BY-NC-ND 4.0 license http://creativecommons.org/licenses/by-nc-nd/4.0/
Hilmar Hinza, Anna Törnroosb and Silvia de Juanc
aMediterranean Institute for Advanced Studies (IMEDEA), Department of Ecology and Marine Resources Esporles, Balearic Islands, Spain
bÅbo Akademi University, Environmental and Marine Biology, Department of Biosciences, Turku, Finland
cInstitut de Ciències del Mar (ICM), Renewable Marine Resources, Barcelona, Spain
Corresponding Author:
Hilmar Hinz; email: hhinz@imedea.uib-es
Keywords: Fishing impacts, Otter trawling, Macro-fauna, Infauna, Epifauna, Ecological traits, Ecosystem function, Bioturbation, Vulnerability, Resilience
Abstract
The physical impact of bottom towed fishing gears does not only reduce the abundance and biomass of species, but also alter the overall composition and through this functioning of benthic communities. The vulnerability to trawling on a species level is determined by a species’ individual combination of morphological, behavioural and life history traits. In turn, the ecosystem functions most affected will be defined by those same species, and their contribution towards a particular function. On the basis of this paradigm, trait-based indices of physical resistance (RI) and reproductive potential (RPI) were developed and combined into an overall vulnerability index on a species level, the RRI or Resistance and Reproductive Potential Index. The developed indices can be used to explore how resistance and reproductive potential, as well as overall community vulnerability, change over a trawling gradient. Furthermore, the RRI allows for dividing the benthic community into groups expressing different levels of vulnerability that can be linked to ecosystem functions to explore functional vulnerability to trawling. The RRI index furthermore opens up the possibility of scenario modelling by simulating the extinction or loss of vulnerable species and its effects on functions. This may be of particular interest in data poor case studies where there is lack of data over trawling gradients, or to project and explore the consequences of increases in fishing effort in a particular location. The validity of the trait-based RRI index was explored by comparing individual species’ RRI scores to empirically observed responses over a trawling gradient based on a previously published data. RRI score and observed responses (regression slopes) were significantly correlated providing support for the rationality of the approach taken. Moreover, further analysis of the data evidenced clear increases of resistance and resilience indices over the trawling gradient, demonstrating that communities lost vulnerable species with increasing trawling. When exploring the effects of trawling on the bioturbation as a chosen ecosystem function, we found it to be disproportionately affected though the loss of vulnerable species. The proposed indices provide new insights into the link of species vulnerability and function. Such information is of vital interest to environmental managers focused on persevering ecosystem functions and services in the face of anthropogenic global change.
1. Introduction
Globally, fishing impacts represent one of the main anthropogenic pressures acting on the marine environment (Clark et al., 2016; Eigaard et al., 2017) with negative consequences for the productivity and functioning of locally affected benthic ecosystems (Hiddink et al., 2011; Olsgard et al., 2008; Queirós et al., 2006). To safeguard the integrity of benthic ecosystems from fishing related impacts, various policy initiatives (e.g. among others Magnuson Stevenson Act USA, European Marine Strategy Framework Directive EU) have been promoted within the context of an ecosystem-based approach to fisheries management (Berg et al., 2015; Biedron and Knuth, 2016; Garcia et al., 2003). However, to evaluate the effectiveness of regulatory interventions, it is essential to monitor the health or status of benthic habitats through indicators that are able to capture changes in the structure and functioning of benthic ecosystems (de Juan et al., 2015; Rice et al., 2012).
Indicators that measure the status of benthic habitats have primarily been based on community metrics such as density, biomass and diversity (Hiddink et al., 2020) of the entire or of a specific size fraction of the benthos (McLaverty et al., 2020). A recent meta-analysis by Hiddink et al. (2020) concluded that community biomass as an indicator of fishing impacts gave the most reliable consistent responses compared to other community indicators. The disadvantage of these generalized community indicators is that, on their own, they cannot provide estimates of the functional status or loss associated with fishing impacts, as biomass and functioning may be reduced at different rates (Thrush et al., 2006). Thus, which functions are most affected by trawling and to which degree, will be defined by the biomass composition of species, their contribution towards a function and, most importantly, their vulnerability to trawling. The vulnerability of a species will in turn depend on the morphology, behaviour and life history characteristics of the species (Bremner et al., 2006; de Juan et al., 2020; Juan et al., 2007). Therefore, an ecosystem function will be most affected by human activities if the species that contribute significantly to that function are also the most vulnerable to the respective activity. Henceforth, to understand and potentially predict the consequences of external drivers of ecosystem change from trawling on benthic functioning, it is essential to integrate ecological information at a species level.
With this realisation in mind, benthic ecologists have implemented the concept of biological traits to assess the wider ecosystem consequences of changes in marine community composition (Bremner et al., 2003; Törnroos et al., 2019). Hereby, species’ biological attributes that describe certain aspects of their morphology and behaviour are used with the aim to approximate the ecological role of the species (Bremner et al., 2003; Törnroos and Bonsdorff, 2012). Simple examples are categorisations into morphological attributes such as size or fragility (Shin et al., 2005), while others are related to behaviour, for example mobility and feeding mode (Smale, 2008), and to life history traits, such as maximum size, fecundity or similar (King and McFarlane, 2003). This basic idea of the biological trait-based approach, first introduced in terrestrial systems (Díaz and Cabido, 2001) and later adopted for freshwater and marine systems (Bremner et al., 2003; Usseglio-Polatera et al., 2000), was to move away from a taxonomic approach of community analysis to a more meaningful functional approach.
Thus far, the majority of trait-based studies investigate the effect of anthropogenic stressors at a community level aiming to gain insights to how trawling changes the traits, or to some extend functional composition, of a community. Within this approach, traits are weighted by the abundance or biomass of all species exhibiting the selected trait (Bremner et al., 2003) and this pooled data is subsequently related to a stressor such as trawling (Villéger et al., 2010, Hiddink et al., 2019). The challenge with this approach is that the observed trait responses cannot indisputably be linked to the stressor nor can the results of such studies be easily generalized. This stems from the fact that the individually analysed traits are in fact the result of a combination of interdepend traits exhibited by the species. Some of the traits expressed by a species may facilitate a certain response to a stressor, while others may impede it. Thus, it is the interplay or sum of opposing or synergistic traits that will determine the response of a species to a stressor. As an example, species living on the surface of the seabed are highly likely to be impacted by trawling (Tiano et al., 2020), however, if surface dwelling species have a highly resistant shell and have a large reproductive potential, they may survive trawling impacts and quickly compensate for individual losses at a population level (Bremner et al., 2005). If we had several species with a similar traits combination dominating the community, it could wrongly be concluded that trawling had little or no effect on organisms that inhabit the seabed surface. While this may be true for the particular area analysed due its species composition other areas may show different responses. Thus, analysing the responses of traits at community level has the potential to introduce bias and lead to spurious and inconsistent conclusions about the impact of a stressor.
To overcome some of these shortcomings, it has been suggested to group species into vulnerability groups according to a set of traits that are a-priori linked to a stressor or ecological function (De Juan et al., 2014) .Within the present paper, we introduce new trait-based indexes for benthic species and link this to a clearly defined ecosystem function, i.e., bioturbation. The index is based on the observations that the vulnerability of a species to trawling is not random but related to specific morphological, life history as well as behavioural characteristics (Jørgensen et al., 2016). In general, large, fragile and slow reproducing species living on the surface of the seabed appear to be the most affected by chronic trawling, while robust, small and fast reproducing species tend to be the least affected (de Juan et al., 2012; Jennings and Kaiser, 1998a; Van Denderen et al., 2015). From this general observation, two subgroups of traits can be delineated, those related to the physical resistance potential of a species (i.e. traits related to body size, living habit, body form) and those related to its recovery potential (i.e. traits such as small body size and fast reproduction). Both of these trait groups contribute to the vulnerability (or the opposite resilience) of species to trawling. The development of our indexes followed the same logic and, therefore, we first constructed two sub-indexes a) a physical “Resistance index” (RI), considering morphological and behavioural aspects (e.g., body structure or living position), and b) a “Recovery Potential index” (RPI), considering traits related to the reproductive strategies and population growth potential. These two indexes were subsequently combined into an overarching index that we named “Resistance and Recovery potential Index” or RRI. This index can on the one hand be used as a standalone index to attain a measure of the vulnerability or resilience of a community to trawling, on the other hand it can be used to explore the link between vulnerability and ecosystem functions. Besides introducing the RRI and its sub-indices, the present study aimed to validate and demonstrate the mulitple uses of the index by applying it to benthic data from the north-eastern Irish Sea Nephrops fishing ground (Hinz et al., 2009) and linking it to a well-established functional index, the bioturbation potential index (BPI) developed by Queirós et al. (2013).
This new trait-based index and approach provides a platform for a more in-depth exploration of the effects of trawling on vulnerability and ecosystem function, simultaneously. While the present study focuses on one particular stressor and function, its simplicity could serve as a template easily adapted and applied to other stressors and functions, e.g., climate change (stressor), habitat provision (function), or similar.
2. Methods
Within this this section we first describe the calculation of the indices, then outline the validation of these based on case study data from the Irish Sea. For the validation, we investigate the effectivity of the RRI to represent vulnerability to trawling based on observed responses to trawling at a species level. Furthermore, we describe the application of the RRI on a community level. Finally, we portray how we link the vulnerability of species to function through the RRI using the bioturbation potential index and how this can be used within scenario simulations in data poor areas.
2.1 Calculations of indices
To determine the vulnerability of species to trawling, we developed two additive indices: the resistance index (RI) and the recovery potential index (RPI). The combination of the two indices into a third index: Resistance and Recovery Potential Index (RRI), that determine the potential vulnerability of a species. All three indices are designed as weighted directional indices where the final calculated score of a species in the respective index reflects the contribution of all relevant traits combined towards the objective of the RRI index, that is expressing the vulnerability/resilience of species to trawling.
2.1.1. RI and RPI calculations
The rational for the RI and RPI indices follows from the objective to describe the physical resistance and the reproductive potential of a species to trawling. For this, we created simple indices using readily available traits information, avoiding traits with known gaps. The traits related to resistance included: body form, body texture, size and environmental position. While traits related to the potential recovery after disturbance were related to reproduction and growth: size, adult longevity, reproductive frequency, development type, regeneration of body parts, scavenger (see Table 1 and 2 for trait categories and their rational). The single feeding type scavenger, was included as trawling is known to significantly benefit species with this feeding mode (Groenewold and Fonds, 2000; Tillin et al., 2006). The trait body size was used in the two indices as size is related to the physical resistance of a species to trawling, with larger species having a higher tendency to be caught or damaged, and also to the potential to recover after trawling, as small organisms tend to have faster growth and reproductive cycles compared to large slower growing organisms with less frequent reproduction (Jennings and Kaiser, 1998b).
Following the methodology in biological trait analysis, (Bremner et al. 2003, Törnroos & Bonsdorff 2012) the traits linked to the different aspects of the morphology, reproduction and behavior, used in the indices, are collected for each species and compiled in a matrix. Trait categories are then assigned to the selected traits; in our case study, body texture had the following five categories: brittle, unprotected soft tissue, thin exoskeleton or shell, durable /flexible, hard exoskeleton or shell. Species are then scored for their affinity to a trait category following the fuzzy scoring method using a scale of 0 (no affinity) to 1 (high affinity), with a total score of 1 for each trait (Bremner et al., 2003). The fuzzy coding allowed the species to vary in the degree in which it exhibited affinity to a specific category within a trait. The traits’ assignment was based on available literature, information from online databases (e.g. BIOTIC, www.marlin.ac.uk/biotic and others see Appendix 1) and experts’ knowledge. When no information on a trait was available for a species, information for the genera was considered; a minor proportion of cases had family or higher group level information. All literature sources of trait information have been acknowledged as well as the amount of expert knowledge in populating the traits matrix used in this project (see S1).
To calculate the indices for a particular species, the fuzzy coding of traits as described above was multiplied by the directional weighting scores of the index. Scores were given on the logical proneness of a specific trait category to be impacted by trawling; e.g., in the case of “body form”, to be caught, broken or uprooted by a passing trawl, i.e., they were ranked 1 to 3 respectively, with erect contributing least to resistance and species with a low vertical depth contributing the most. To ensure each trait category had the same influence on the final index when calculating summed index scores, the trait category rank values were multiplied by the maximum number of trait categories in any one trait (which was 5) divided by the number of traits categories in the observed trait (Balancing Score see table 1 and 2). The contribution of each trait to the respective index was kept equal as there is uncertainty about the precise strength of influence of each individual trait towards the indices objectives, i.e., resistance or recovery potential (for a summary of the directional weighting scores and its rational see Table 1 and 2) .
![[Uncaptioned image]](/html/2011.13232/assets/Table1.png)
![[Uncaptioned image]](/html/2011.13232/assets/Table2.png)
To normalize both index scores, and thus providing results on a similar scale (0 to 1), the following formula was used:
Values close to 1 for the RI of a species indicates that it is potentially highly resistant to trawling, while a value of 1 for the RPI indicates high recovery potential due to the associated life history traits.
2.1.2. RRI calculations
To calculate the Resistance and Reproductive Potential Index (RRI), the mean of both individual normalized index scores (RI and RPI) was calculated (from 0= highly vulnerable, to 1= highly resilient). The RRI species scores were subsequently categorised into five levels to identify species with similar scores for the subsequent analyses: 0.8-1 = Very High RRI, 0.6-0.79 = High RRI, 0.4-5.9 = Moderate RRI, 0.2-4.9 = Low RRI and 0-0.19 =Very Low RRI.
2.2.Validation of the RRI index
2.2.1. The Irish Sea case study and macrofauna data
To validate the developed indices, we used macrofauna data collected over an active fishing ground for Norway lobster (Nephrops norvegicus, Linnaeus) and gadoid fish in the north-eastern Irish Sea. This data was previously published investigating the effects of trawling on a taxonomic level by Hinz et al. (2009). For more detailed information about the sampling design, as well as the fishing effort calculation, refer to Hinz et al. (2009). Macrofauna data was collected at 15 sites over a gradient of fishing intensity varying from 1.3 times trawled/year to 18.2 times trawled/year. Both benthic infauna (day grab samples 0.1 m2) and epifauna (2-m beam trawl) were sampled and standardized to m2 biomass. The two datasets were combined into one single data matrix for the subsequent analyses (for benthic data see S2 and for trawling intensity and physical characteristics of sampling sites S3). The methodology for calculating the two sub-indices and the final RRI index describe above was applied to the macrofauna dataset.
2.2.2 Effectivity of the RRI to represent vulnerability to trawling on a species level
The effectivity of the indices to represent the overall vulnerability of species to trawling was validated by comparing the calculated RRI scores of individual species to observed responses of those same species over a gradient of trawling intensity (as recorded by Hinz et al., 2008), using linear regression slopes. Prior to analysis, the individual species biomass data was normalized. For the validation analysis, we considered only species that had sufficient data: occurred at least over 4 stations out of 15, i.e., over 30%. We expected that for our RRI index to be valid, there should be a significant correlation between the species RRI scores and the individual species regression coefficients from the observed data. The correlation between the RRI index and regression coefficients was calculated for species groups with different occurrences over the sampling stations. Here we wanted to see if the correlations would improve when using data of species that had successively higher occurrences over our sampling area. The assumption made was that the responses of common species would contain less errors related to false zero observations (i.e., due to absence at sites unrelated to trawling) making the correlation between RRI score and coefficient more robust and representative for the validation of our index. However, considering that some of the less common species are also those highly vulnerable to trawling, we decided to present the results of all correlations above the aforementioned minimum threshold of 30% occurrence over the sampling stations (see above). Three species in the validation analysis form a commensal type of association with another larger species. The small bivalve Tellimya ferruginosa lives associated with irregular urchins such as Echinocardium spp, while the small bivalve Kurtiella bidentata and the polychaeta Podarkeopsis helgolandicus are associated with brittle stars such as Amphiura spp. In these cases, the lower scoring host species RRI was used and not the original score calculated based on the species traits. The assumption was that the hosts’ response to trawling would have a greater influence on the response of the associated species than the calculated species RRI score.
2.2.3. Modelled responses based on RRI grouping of species
We investigated the observed responses of species, when grouped according to their RRI index scores, test expected species responses to trawling (i.e., Low RRI species showing a strongly negative trend, followed by a less negative response for species of the Medium RRI group and non or a positive response for High RRI species). RRI group responses were modelled on a species level using generalized mixed modelling (GLMM) on the observed case study data, using the RRI group category as random effect (i.e. a grouping factor). As above, we used normalized biomass data versus fishing effort to calculate the regression coefficients by species. The resulting model relationships are thus the mean responses of species belonging to a RRI group. For the analysis, we pooled species with very low and low RRI scores as the former group only contained two species. Species with very high RRI scores did not exist within our study area, and therefore we investigated the response of three RRI groups: Low, Moderate and High. These three groups were maintained for all subsequent analysis. Note that the RRI group High only contained three species. The GLMM models were tested for their significance following procedures outlined by Zuur et al.(2009)
2.2.4. Relationship of indices (RI, RPI, RRI) to trawling on a community level
The relationship between scores of the indices at a community level and trawling were explored by linear regression models. An average score of the respective index on a community level were calculated by multiplying species index scores with species biomass at a respective station, subsequently summing all individual scores of that station and dividing this sum by the total biomass of the respective station.
2.3. Linking vulnerability to function
2.3.1. Response of bioturbation potential (BPc) to trawling
The Bioturbation Potential Index (BPc) introduced by Queirós et al. (2012) was selected to demonstrate the link between RRI and ecosystem functions.
BPc takes into account the average size and abundance of organisms attained from sample data and combines these with bioturbation weighting factors based on categorical scales describing the mobility and sediment reworking of an organism (Queirós et al 2012). The following formula describes the calculation of BPI of a benthic community:
Bi and Ai are the biomass and abundance of species/taxon i in a sample. Mobility (Mi) range from 1 (living in a fixed tube) to 4 (free three-dimensional movement via burrow system). Sediment reworking (Ri) from 1 (epifauna that bioturbates at the sediment–water interface) to 5 (regenerators that excavate holes, transferring sediment at depth to the surface). For the present paper we used the trait information provided by Queirós et al (2012) for 1033 macrofaunal species in the case study data by extracting the relevant information to match our species list. Most species were already included within the database. Only 7 species were not found in the database provided by Queirós et al (2012) and information for these species was therefore added by the present study (see S4 for a full of species list and their relevant biological traits categorisation) using published descriptions of species bioturbation behaviour, or in its absence, information on closely related species.
Table 3. Summary of trait categories and scores used to calculate BPc as described by Queirós et al (2012)
| Mobility (Mi) | Score | Sediment reworking types (Ri) | Score |
| Organisms that live in fixed tubes | 1 | Epifauna | 1 |
| Organisms with indicates limited movement | 2 | Surficial modifier | 2 |
| Organisms with slow, free movement through the sediment matrix | 3 | Upward and downward conveyors | 3 |
| Organisms with free movement, that is, via burrow system | 4 | Biodiffusors | 4 |
| Regenerators | 5 |
The relationship between trawling versus BPc for different RRI groups (i.e. low, medium, high) was investigated using linear regression models. At each station the summed bioturbation potential per station was calculated for each group. To linearize the data all regressions were performed after log transformation.
2.3.2. Scenario modelling of the effect of trawling on bioturbation
We undertook scenario or stress test modelling emulating a situation where little benthic data is available but the potential consequences of species removal or reductions of abundance are to be explored. For the scenario modelling, the data from the least impacted site in the Irish Sea case study was used as the baseline. We modelled the effect on bioturbation potential from 1) directed elimination and 2) reductions in species abundances, based on the species’ RRI ranking, which provided an indication of the species’ vulnerability to trawling.
2.3.3. Directed extinction scenario of low RRI or high RRI species
We simulated the complete extinction of the 5, 10, 20, 30 and 40 percent of the most vulnerable species based on their RRI ranking (low RRI scores). We contrasted this deletion of species with random deletions, i.e., removing species at random from the species list considering the same number of species as removed for the low RRI ranking species. Random removals were performed by the random subsampling function in R (sample, base v3.6.2) and repeated 999 times. The resulting “directed deletion” scenario can be compared to the position and slopes of the “random deletion”. If the slope of the directed removal is found to be above the random slope, vulnerable species are not strongly linked to that function. In contrast, if the slope is found below the random deletion slope, there is a strong indication that some of the vulnerable species contribute disproportionality to the function analysed. If the slopes of random and directed deletion are similar, vulnerability and function are not linked.
Furthermore, we reversed the removal to assess the contribution of non-vulnerable species to trawling, i.e., species ranked with a high RRI score to the bioturbation potential. In this scenario, we removed 5, 10, 20, 30 and 40 percent of the most resistant and resilient species from the species list and subsequently calculated the BPc. All scenario responses were analysed through linear regression models.
2.3.4.Reduction in abundance of different RRI groups
Within a set of secondary scenarios, we demonstrate the effect of reducing the abundance of species belonging to the three RRI groups on the BPc. Abundances were reduced from 10 to 90% for a certain RRI group, while species within other RRI groups were not reduced in abundance for community BPc calculations. Furthermore, we created a random group by selecting species at random from the species list and considering the number of species found within the low RRI group as a reference. Random abundance reductions were performed as described for the extinction scenarios. The impact of abundance reductions of different vulnerability groups (RRI) on BPc can be explored by comparing the slopes and their relative position. All scenario responses were analysed through linear regression models.
3. Results
3.1. Validation of the RRI index
3.1.1. Effectivity of the RRI to represent vulnerability to trawling on a species level
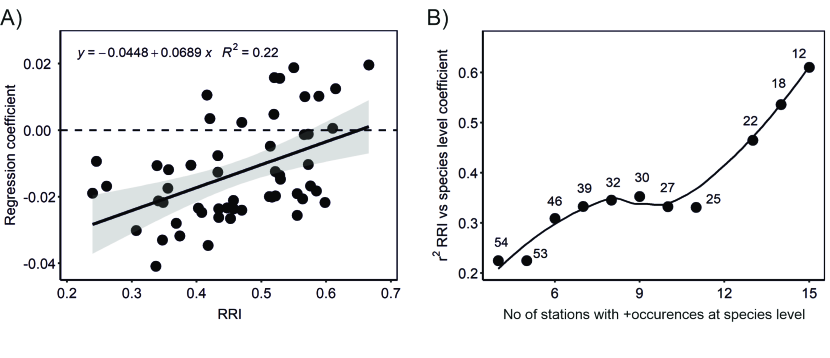
To confirm the assumption that species with a low RRI should respond more strongly to trawling compared to higher RRI species, we correlated individual RRI scores of species with their observed regression coefficients. Considering all 54 species, we found a 0.22 r2 correlation (Figure 1A). When considering species with subsequently higher frequency of occurrence over the study area, the r2 values increased up to 0.61 (Figure 1B) for the 12 species that occurred at all sampling stations.
3.1.2. Modelled responses to trawling based on RRI grouping of species
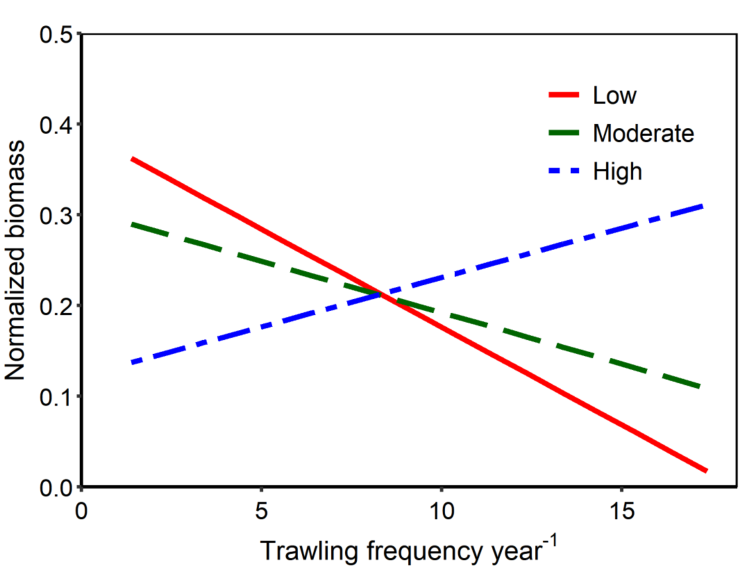
The estimated mean response of species belonging to the three RRI groups using GLMM showed that species belonging to the Low RRI group, i.e., species with a low resistance and reproductive potential, mostly had a negative response to increases in trawling intensities (Figure 2). This was followed by a slightly less negatively sloped relationship for the Moderate RRI species and a positive relationship for the High RRI species. The relationship for Low and Moderate RRI species was found to be statistically significant, while the estimated relationship for High RRI species was not (Table of model statistics see S6, figure showing individual and mean responses of grouped species S7).
3.1.3 Relationship of indices (RI, RPI, RRI) with trawling intensity on a community level
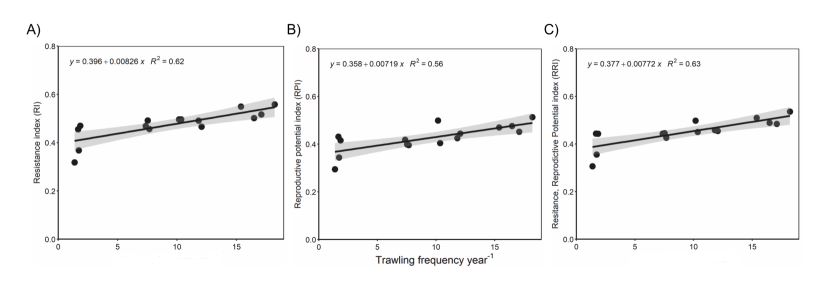
The individual species index scores, when calculated across the entire community, showed significant increases (p < 0.05) in all three indices in response to trawling (Figure 3 A-C). This indicates that the benthic communities in the case study area were increasingly composed of species with high resistance and reproductive potential.
3.2. Linking vulnerability to function
Response of bioturbation potential (BPc) to trawling intensity
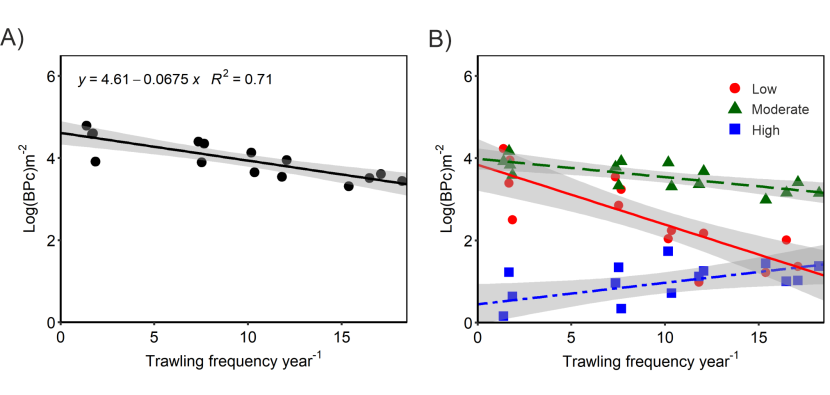
The BPc responded overall negative to increased intensities of trawling in the case study area (Figure 4a). When considering the different RRI groups, a strong negative relationship of the BPc was found for the low RRI group species (i.e. highly vulnerable species), while BPc for moderate RRI species responded negatively, but with a less strong slope (Figure 4b, S6). High RRI species, in contrast, increased their BPc over the trawling gradient.
3.4. Scenario modelling of the linkage between RRI and function
3.4.1. Directed extinction scenario of a low RRI or a high RRI species
The simulation of removing species from the station least affected by trawling in the order of vulnerability, from lower to higher RRI scores in 10% steps, showed a strong negative effect on the bioturbation potential (Figure 5A). Reversing the removal of species from the community, from higher to lower RRI species, showed a less steep negative response. The simulated mean random removal of species demonstrated an intermediate negative response with the slope being located between the former two (Figure 5 A, S6).
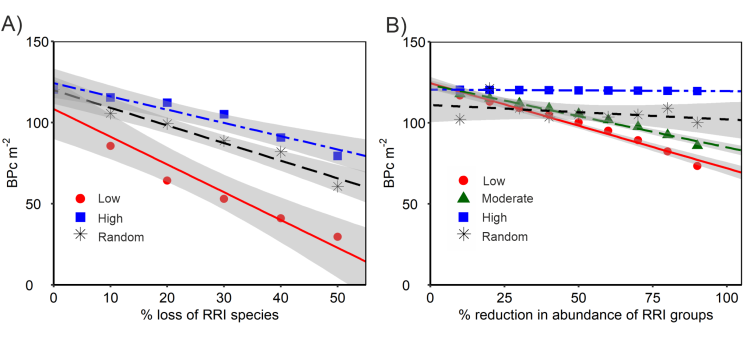
3.4.2. Reduction in abundance of RRI groups and its effect on bioturbation
Within this scenario, the effect of reducing the abundance of different RRI groups by 10 to 90% and its effect on BPc was investigated. The abundance of respective groups was lowered, while keeping the contributions from the other groups constant, providing an estimate of how the different levels of reduction affected community BPc. There was a strong negative response in BPc when the abundance of species with low (vulnerable) RRI scores was reduced (Figure 5B). The reduction in abundance of the moderate RRI had a similar negative effect with a slightly less steep slope (Figure 5B). The reduction in abundance of the high RRI group, as well as the reduction of random species, did not lower the BPc to the same extent as the other two groups (Figure 5B, see S6 for model statistics).
4. Discussion
4.1. Why a new trait-based approach for fishing impact studies?
The impetus of creating a benthic resistance and recovery potential index (RRI) was based on the simple realization that a species represents a combination of traits that are interdependent of each other. It is the interplay of a diversity of traits, with opposing or synergistic effects, that determine the response of a species to an external impact. The introduced RRI index aims to pay tribute to the fact that trawling impacts ultimately occur at a species level and that a better understanding at this level would allow us to make better predictions on benthic communities’ responses to trawling. Equally, as demonstrated within this study, understanding the vulnerability on a species level can allow us to model or stress test the response of species, communities and functions to different pressure scenarios, e.g., by removing or reducing the most vulnerable species and assessing the consequences for ecosystem functions, like bioturbation in the present study.
Another realisation that furthered the development of this index was that there are certain traits that are more directly linked to a stressor, while other traits respond only due to their association to those more directly linked traits. For example, a trait like life span could be regarded as indirectly related to the physical impact of the trawl gear, while living position, body texture or size are traits more closely linked to how a species will be directly affected by the trawling gear. We therefore created additive indices, combining traits that reflected a directional trend towards the resistance and reproductive potential of a species. This type of additive index, where various traits are combined to reflect a particular response or function, has been used in other traits-based studies as for example in the bioturbation potential index introduced by Queirós et al. (2013). We believe that the development of this type of index has great potential and could be refined for other fishing impacts, habitat types, as well as for other human impacts or functions in general.
Similar to other trait-based indices, there is an element of subjectivity over which traits to integrate into the indices presented in this study. In this case, the traits were chosen based on the currently best available knowledge and mechanistic understanding about trawling impacts on muddy habitats and the ease of attaining such data for most species. It is though crucial to provide transparency over the index construction and evaluate its performance in a validation process. In this study we tried to address both of these aspects by comparing its performance to real observational data and by providing the required references of our trait data including the amount of expert judgement that was used to populate the underlying traits matrix (see S1).
4.2. Validation of the Resistance and Recovery Potential Index
The RRI index was validated by estimating the mean observed response of different RRI groupings of species to trawling using data previously published by Hinz et al. (2008). The mean response of species grouped after their vulnerability (RRI score) demonstrated the predicted pattern based on theory about trawling impacts on benthos (Jennings and Kaiser, 1998b). Thus, vulnerable species (Low RRI) respond strongly with a negative trend to trawling pressure, followed by moderately vulnerable species (Moderate RRI), and species with a high resistance and reproductive potential (High RRI) showing no significant response. Similarly, when comparing the individual slopes of observed species responses with their respective RRI index scores, we found a significant correlation between the two. The results of this part of the validation analysis provided confidence that the traits chosen for our indices and their scoring reflected the relative vulnerability or resilience of benthic species to trawling intensities. Nevertheless, the difference in fits of the correlations observed, depending on which species were included in the relationship, also revealed the predicaments over the biases of this type of validation. Species with rare occurrences over the trawling gradient often had many zero observations introducing uncertainty over estimated species responses (slopes) to trawling. Therefore, species with very few observations were removed from the analysis. However, these species may have been rare due to the trawling impact and thus we removed species strongly related to trawling impacts. For example, the sea pen Virgularia mirabilis, a highly vulnerable species with one of the lowest RRI scores recorded within our study, only occurred at the two least fished sites and thus could not be included in the validation analysis. Contrary, other species included in the analysis showed trends based on few data points that were statistically not significant, potentially having introduced considerable bias into the evaluation analysis. Focusing the evaluation analysis only on the common species that occurred at most sites appeared to show the best fit between the observed regression slopes and our RRI index. Focusing the entire evaluation only on these species, however, would have reduced the generality of the analysis and would not have allowed the estimation of vulnerability (RRI) group responses as described at the beginning of the paragraph.
While the results of the validation analyses are encouraging, some details over the calculation of the RRI index need to be appreciated, in particular with respect to the scoring and weighting of the index and sub-indices. We choose to give each trait within each sub-index, the physical Resistance Index (RI) and the Reproductive potential index (RPI), roughly the same influence on the final score. It is quite likely that some traits have a higher influence on the resilience or reproductive potential of a species. However, currently there exists limited understanding over the relative importance of individual traits and their contribution towards a function. For example, in the case of resistance, it is difficult to scale how much more important the trait living position is compared to the body morphology. Equally, we gave each of the two sub-indices the same weighting in calculating the final Resistance Reproductive potential RRI index as we currently cannot determine which component makes a species more resilient to chronic trawling disturbance. As our understanding increases about trawling impacts, future versions of the indices could be weighted reflecting new emerging insights.
4.3. The application of the resistance and reproductive potential indices
The indices introduced within this study can be used in several distinct ways, a) they can be applied to investigate the changes in community resistance and reproductive potential as a response to a trawling gradient; b) they allow to explore the species contribution towards a response in terms of community biomass but also function, by the division of species into different resilient or vulnerability groups; and c) the can be used in stress test scenarios, by eliminating species or reducing their abundance/biomass depending on their vulnerability, and exploring its effect on linked ecosystem functions. The application of the indices to the fishing gradient study by Hinz et al. (2009) demonstrated well the multiple uses of the developed indices. All three indices (RI, RPI and RRI) showed significant positive responses on a community level to increasing trawling intensities. Thus, trawling, through the loss of more vulnerable species, increase the overall resilience of benthic communities in the Irish Sea with respect to their physical resistance and reproductive potential. While the term community resilience may have positive connotations depending on the context (Baggini et al., 2015; Knapp et al., 2001), in the present study it conveys the opposite. This is in line with many other studies on physical disturbances that found that communities in highly disturbed locations, anthropogenically or naturally, hold more resilient species adapted to this disturbance (de Juan et al., 2009; Sciberras et al., 2013). Resilience can therefore not be judged as a positive community aspect per se and the term should therefore be used with care with respect to the advocated preservation of resilience to affront ecosystem change (Gladstone-Gallagher et al., 2019). In general, our aim should be to strive to preserve functional resilience (Gladstone-Gallagher et al., 2019) through the protection of vulnerable species that make a considerable contribution through their abundance or biomass to a function. In this respect, our study found a strong impact of trawling on the bioturbation potential that experienced a loss of 81% along the trawling gradient studied. By having subdivided the species in vulnerability groups, we could explore the contribution of each group to this functional loss. High and moderately vulnerable species contributed with 55% and 45% respectively. Among those species with a high contribution towards bioturbation were, for example, the brittle star Amphiura spp., the irregular urchin Echinocardium spp. and the polychaete Pectinaria auricoma. In contrast, high resistant or low vulnerable species increased their biomass over the trawling gradient and compensated to a small extent the loss of the two other groups. Without this compensation, total bioturbation potential loss along the trawling gradient would have been 3% higher. The results of this study demonstrate that a large part of the bioturbation function was linked to vulnerable species and that their removal had a considerable effect on the provision of this function.
The scenario analysis performed on the least impacted site of the Irish Sea case study demonstrated the strength of the index for a data poor scenario, where only a few benthic samples are available. The simulation of sequential species loss from both the most vulnerable to the highest resilient, and vice versa, reflected well the trends identified in the observed data, demonstrating that similar conclusions about the importance of vulnerable species and their link to bioturbation could have been drawn from sampling one single site.
5. Conclusion
We feel that despite the adolescent nature of our index, it is sufficiently advanced to be discussed, applied and hopefully developed further by the scientific community. The principle idea to move away from descriptive community wide trait-based analysis towards a more focused and mechanistic trait-based approach, which appreciates the integrate nature of traits unified in a species, should enable scientists to develop new approaches that will be more universal, when it comes to impact studies, and potentially have higher predictive power. With respect to the presented RRI index and its sub-indices, it means that the vulnerability and the functional potential (e.g., bioturbation) of benthic communities can be determined and predicted for almost any location provided we have the associated traits data for the local species’ pool. Using the traits of individual species in this way, allows for stress testing communities through developing scenarios that may reflect future environmental change or management decisions (e.g., changes in fishing effort regulations). Within our study, we presented an index that was directed toward the physical impact of trawling, but equally, indices could be developed for other fishing gears or stressors such as climate change or eutrophication, combining relevant species traits linked to the respective stressor. As the introduced indices are conceptually simple, they should be easily adaptable to other scenarios and situations. To conclude, we demonstrated that through our indices, new insights into the link of species vulnerability and function in regard to trawling impact can be gained. While further testing and development of our index will be required, we hope that our approach will lead to a new scientific discourse with respect to the trait-based approach and its potential to increase our understanding of functional ecology.
References:
Baggini, C., Issaris, Y., Salomidi, M., Hall-Spencer, J., 2015. Herbivore diversity improves benthic community resilience to ocean acidification. J. Exp. Mar. Bio. Ecol. https://doi.org/10.1016/j.jembe.2015.04.019
Berg, T., Fürhaupter, K., Teixeira, H., Uusitalo, L., Zampoukas, N., 2015. The Marine Strategy Framework Directive and the ecosystem-based approach - pitfalls and solutions. Mar. Pollut. Bull. https://doi.org/10.1016/j.marpolbul.2015.04.050
Biedron, I.S., Knuth, B.A., 2016. Toward shared understandings of ecosystem-based fisheries management among fishery management councils and stakeholders in the U.S. Mid-Atlantic and New England regions. Mar. Policy. https://doi.org/10.1016/j.marpol.2016.04.010
Bremner, J., Frid, C.L.J., Rogers, S.I., 2005. Biological traits of the North Sea benthos: does fishing affect benthic ecosystem function? Am. Fish. Soc. Symp.
Bremner, J., Rogers, S.I., Frid, C.L.J., 2006. Methods for describing ecological functioning of marine benthic assemblages using biological traits analysis (BTA). Ecol. Indic. 6, 609–622. https://doi.org/10.1016/j.ecolind.2005.08.026
Bremner, J., Rogers, S.I., Frid, C.L.J., 2003. Assessing functional diversity in marine benthic ecosystems : a comparison of approaches 254, 11–25.
Clark, M.R., Althaus, F., Schlacher, T.A., Williams, A., Bowden, D.A., Rowden, A.A., 2016. The impacts of deep-sea fisheries on benthic communities: A review. ICES J. Mar. Sci. https://doi.org/10.1093/icesjms/fsv123
de Juan, S., Demestre, M., Thrush, S., 2009. Defining ecological indicators of trawling disturbance when everywhere that can be fished is fished: A Mediterranean case study. Mar. Policy. https://doi.org/10.1016/j.marpol.2008.11.005
de Juan, S., Hewitt, J., Thrush, S., Freeman, D., 2015. Standardising the assessment of Functional Integrity in benthic ecosystems. J. Sea Res. 98, 33–41. https://doi.org/10.1016/j.seares.2014.06.001
de Juan, S., Hinz, H., Sartor, P., Vitale, S., Bentes, L., Bellido, J.M., Musumeci, C., Massi, D., Gancitano, V., Demestre, M., 2020. Vulnerability of Demersal Fish Assemblages to Trawling Activities: A Traits-Based Index. Front. Mar. Sci. https://doi.org/10.3389/fmars.2020.00044
de Juan, S., Moranta, J., Hinz, H., Barberá, C., Ojeda-Martinez, C., Oro, D., Ordines, F., Ólafsson, E., Demestre, M., Massutí, E., Lleonart, J., 2012. A regional network of sustainable managed areas as the way forward for the implementation of an Ecosystem-Based Fisheries Management in the Mediterranean. Ocean Coast. Manag. 65, 51–58. https://doi.org/10.1016/j.ocecoaman.2012.04.024
De Juan, S., Thrush, S.F., Hewitt, J.E., Halliday, J., Lohrer, A.M., 2014. Cumulative degradation in estuaries: Contribution of individual species to community recovery. Mar. Ecol. Prog. Ser. https://doi.org/10.3354/meps10904
Díaz, S., Cabido, M., 2001. Vive la différence: Plant functional diversity matters to ecosystem processes. Trends Ecol. Evol. https://doi.org/10.1016/S0169-5347(01)02283-2
Eigaard, O.R., Bastardie, F., Hintzen, N.T., Buhl-Mortensen, L., Buhl-Mortensen, P., Catarino, R., Dinesen, G.E., Egekvist, J., Fock, H.O., Geitner, K., Gerritsen, H.D., González, M.M., Jonsson, P., Kavadas, S., Laffargue, P., Lundy, M., Gonzalez-Mirelis, G., Nielsen, J.R., Papadopoulou, N., Posen, P.E., Pulcinella, J., Russo, T., Sala, A., Silva, C., Smith, C.J., Vanelslander, B., Rijnsdorp, A.D., 2017. The footprint of bottom trawling in European waters: Distribution, intensity, and seabed integrity. ICES J. Mar. Sci. https://doi.org/10.1093/icesjms/fsw194
Garcia, S.M.M., Zerbi, a., Aliaume, C., Do Chi, T., Lasserre, G., 2003. The ecosystem approach to fisheries. FAO Fish. Tech. Pap. 443, 71. https://doi.org/10.1111/j.1467-2979.2010.00358.x
Gladstone-Gallagher, R. V., Pilditch, C.A., Stephenson, F., Thrush, S.F., 2019. Linking Traits across Ecological Scales Determines Functional Resilience. Trends Ecol. Evol. https://doi.org/10.1016/j.tree.2019.07.010
Groenewold, S., Fonds, M., 2000. Effects on benthic scavengers of discards and damaged benthos produced by the beam-trawl fishery in the southern North Sea. ICES J. Mar. Sci. 57, 1395–1406. https://doi.org/10.1006/jmsc.2000.0914
Hiddink, J.G., Jennings, S., Sciberras, M., Bolam, S.G., Cambiè, G., McConnaughey, R.A., Mazor, T., Hilborn, R., Collie, J.S., Pitcher, C.R., Parma, A.M., Suuronen, P., Kaiser, M.J., Rijnsdorp, A.D., 2019. Assessing bottom trawling impacts based on the longevity of benthic invertebrates. J. Appl. Ecol. https://doi.org/10.1111/1365-2664.13278
Hiddink, J.G., Johnson, A.F., Kingham, R., Hinz, H., 2011. Could our fisheries be more productive? Indirect negative effects of bottom trawl fisheries on fish condition. J. Appl. Ecol. 48, 1441–1449. https://doi.org/10.1111/j.1365-2664.2011.02036.x
Hiddink, J.G., Kaiser, M.J., Sciberras, M., McConnaughey, R.A., Mazor, T., Hilborn, R., Collie, J.S., Pitcher, C.R., Parma, A.M., Suuronen, P., Rijnsdorp, A.D., Jennings, S., 2020. Selection of indicators for assessing and managing the impacts of bottom trawling on seabed habitats. J. Appl. Ecol. https://doi.org/10.1111/1365-2664.13617
Hinz, H., Prieto, V., Kaiser, M.J., 2009. Trawl disturbance on benthic communities: Chronic effects and experimental predictions. Ecol. Appl. 19, 761–773. https://doi.org/10.1890/08-0351.1
Jennings, S., Kaiser, M.J., 1998a. The Effects of Fishing on Marine Ecosystems. Adv. Mar. Biol. 34, 201–352. https://doi.org/10.1016/S0065-2881(08)60212-6
Jennings, S., Kaiser, M.J., 1998b. The Effects of Fishing on Marine Ecosystems, in: Advances in Marine Biology. pp. 201–352. https://doi.org/10.1016/S0065-2881(08)60212-6
Jørgensen, L.L., Planque, B., Thangstad, T.H., Certain, G., 2016. Vulnerability of megabenthic species to trawling in the Barents Sea. ICES J. Mar. Sci. https://doi.org/10.1093/icesjms/fsv107
Juan, S. De, Cartes, J.E., Demestre, M., 2007. Effects of commercial trawling activities in the diet of the flat fish Citharus linguatula ( Osteichthyes : Pleuronectiformes ) and the starfish Astropecten irregularis ( Echinodermata : Asteroidea ) 349, 152–169. https://doi.org/10.1016/j.jembe.2007.05.003
King, J.R., McFarlane, G.A., 2003. Marine fish life history strategies: Applications to fishery management. Fish. Manag. Ecol. https://doi.org/10.1046/j.1365-2400.2003.00359.x
Knapp, R.A., Matthews, K.R., Sarnelle, O., 2001. Resistance and resilience of alpine lake fauna to fish introductions. Ecol. Monogr. https://doi.org/10.1890/0012-9615(2001)071[0401:RAROAL]2.0.CO;2
McLaverty, C., Eigaard, O.R., Gislason, H., Bastardie, F., Brooks, M.E., Jonsson, P., Lehmann, A., Dinesen, G.E., 2020. Using large benthic macrofauna to refine and improve ecological indicators of bottom trawling disturbance. Ecol. Indic. https://doi.org/10.1016/j.ecolind.2019.105811
Olsgard, F., Schaanning, M.T., Widdicombe, S., Kendall, M.A., Austen, M.C., 2008. Effects of bottom trawling on ecosystem functioning. J. Exp. Mar. Bio. Ecol. https://doi.org/10.1016/j.jembe.2008.07.036
Queirós, a. M., Hiddink, J.G., Kaiser, M.J., Hinz, H., 2006. Effects of chronic bottom trawling disturbance on benthic biomass, production and size spectra in different habitats. J. Exp. Mar. Bio. Ecol. 335, 91–103. https://doi.org/10.1016/j.jembe.2006.03.001
Queirós, A.M., Birchenough, S.N.R., Bremner, J., Godbold, J.A., Parker, R.E., Romero-Ramirez, A., Reiss, H., Solan, M., Somerfield, P.J., Van Colen, C., Van Hoey, G., Widdicombe, S., 2013. A bioturbation classification of European marine infaunal invertebrates. Ecol. Evol. https://doi.org/10.1002/ece3.769
Rice, J., Arvanitidis, C., Borja, A., Frid, C., Hiddink, J.G., Krause, J., Lorance, P., Ragnarsson, S.Á., Sköld, M., Trabucco, B., Enserink, L., Norkko, A., 2012. Indicators for sea-floor integrity under the european marine strategy framework directive. Ecol. Indic. https://doi.org/10.1016/j.ecolind.2011.03.021
Sciberras, M., Hinz, H., Bennell, J.D., Jenkins, S.R., Hawkins, S.J., Kaiser, M.J., 2013. Benthic community response to a scallop dredging closure within a dynamic seabed habitat. Mar. Ecol. Prog. Ser. 480, 83–98. https://doi.org/10.3354/meps10198
Shin, Y.J., Rochet, M.J., Jennings, S., Field, J.G., Gislason, H., 2005. Using size-based indicators to evaluate the ecosystem effects of fishing, in: ICES Journal of Marine Science. https://doi.org/10.1016/j.icesjms.2005.01.004
Smale, D.A., 2008. Ecological traits of benthic assemblages in shallow Antarctic waters: Does ice scour disturbance select for small, mobile, secondary consumers with high dispersal potential? Polar Biol. https://doi.org/10.1007/s00300-008-0461-9
Thrush, S.F., Hewitt, J.E., Gibbs, M., Lundquist, C., Norkko, A., 2006. Functional role of large organisms in intertidal communities: Community effects and ecosystem function. Ecosystems. https://doi.org/10.1007/s10021-005-0068-8
Tiano, J.C., van der Reijden, K.J., O’Flynn, S., Beauchard, O., van der Ree, S., van der Wees, J., Ysebaert, T., Soetaert, K., 2020. Experimental bottom trawling finds resilience in large-bodied infauna but vulnerability for epifauna and juveniles in the Frisian Front. Mar. Environ. Res. https://doi.org/10.1016/j.marenvres.2020.104964
Tillin, H.M., Hiddink, J.G., Jennings, S., Kaiser, M.J., 2006. Chronic bottom trawling alters the functional composition of benthic invertebrate communities on a sea-basin scale. Mar. Ecol. Prog. Ser. 318, 31–45.
Törnroos, A., Bonsdorff, E., 2012. Developing the multitrait concept for functional diversity: Lessons from a system rich in functions but poor in species. Ecol. Appl. https://doi.org/10.1890/11-2042.1
Törnroos, A., Pecuchet, L., Olsson, J., Gårdmark, A., Blomqvist, M., Lindegren, M., Bonsdorff, E., 2019. Four decades of functional community change reveals gradual trends and low interlinkage across trophic groups in a large marine ecosystem. Glob. Chang. Biol. https://doi.org/10.1111/gcb.14552
Usseglio-Polatera, P., Bournaud, M., Richoux, P., Tachet, H., 2000. Biological and ecological traits of benthic freshwater macroinvertebrates: Relationships and definition of groups with similar traits. Freshw. Biol. https://doi.org/10.1046/j.1365-2427.2000.00535.x
Van Denderen, P.D., Bolam, S.G., Hiddink, J.G., Jennings, S., Kenny, A., Rijnsdorp, A.D., Van Kooten, T., 2015. Similar effects of bottom trawling and natural disturbance on composition and function of benthic communities across habitats. Mar. Ecol. Prog. Ser. https://doi.org/10.3354/meps11550
Zuur, A.F., Ieno, E.N., Walker, N.J., Saveliev, A.A., Smith, G.M., 2009. Mixed effects models and extensions in ecology with R. Springer Verlag.