NLPStatTest: A Toolkit for Comparing NLP System Performance
Abstract
Statistical significance testing centered on -values is commonly used to compare NLP system performance, but -values alone are insufficient because statistical significance differs from practical significance. The latter can be measured by estimating effect size. In this paper, we propose a three-stage procedure for comparing NLP system performance and provide a toolkit, NLPStatTest, that automates the process. Users can upload NLP system evaluation scores and the toolkit will analyze these scores, run appropriate significance tests, estimate effect size, and conduct power analysis to estimate Type II error. The toolkit provides a convenient and systematic way to compare NLP system performance that goes beyond statistical significance testing.
1 Introduction
In the field of natural language processing (NLP), the common practice is to use statistical significance testing 111Here we adopt the frequentist approach to hypothesis testing. The debate over frequentist and Bayesian is beyond the scope of this paper. to demonstrate that the improvement exhibited by a proposed system over the baseline reflects meaningful differences, not happenstance Dror et al. (2018, 2020). The American Statistical Association emphasizes that ‘‘a -value, or statistical significance, does not measure the size of an effect or the importance of a result” Wasserstein and Lazar (2016). In other words, statistical significance is different from practical significance. The latter is rarely discussed in the NLP field.
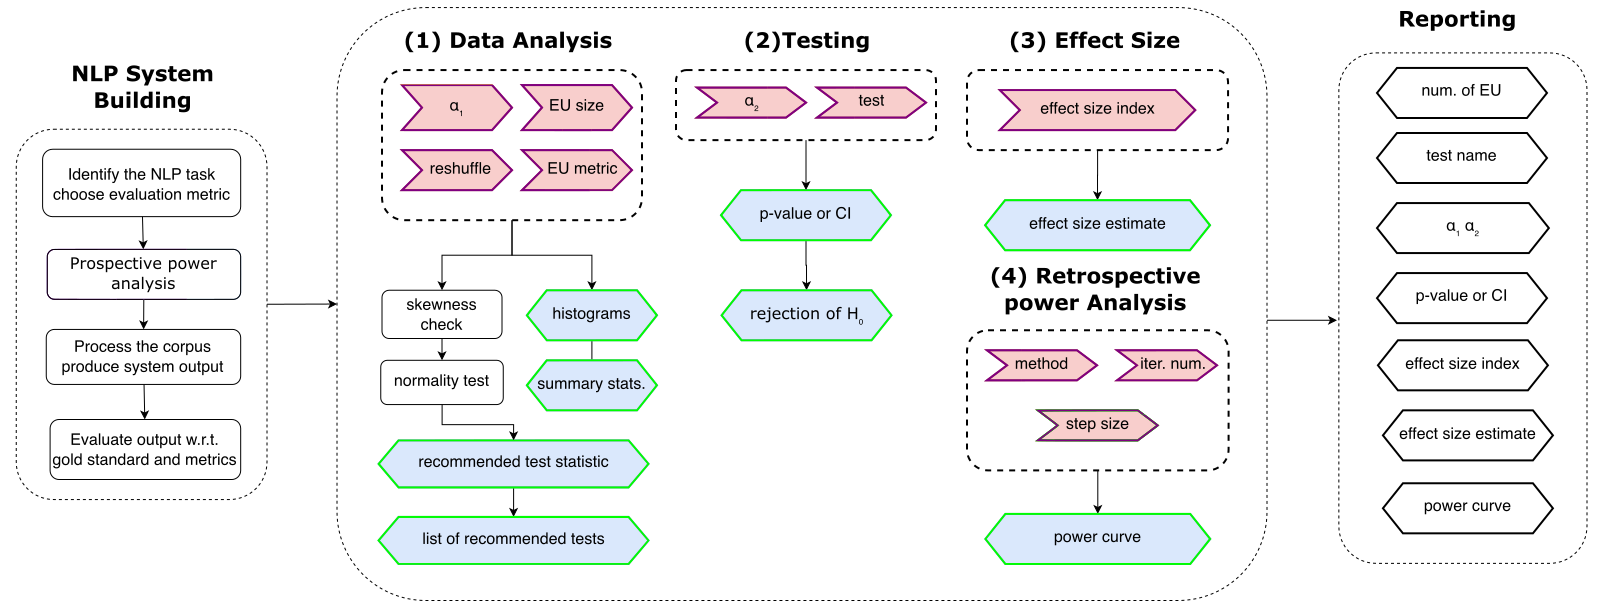
To address this issue, we propose a three-stage procedure for comparing NLP system performance, shown in Figure 1. The first stage is building an NLP system and using prospective power analysis to compute an appropriate sample size for test corpus. The second stage is hypothesis testing. We stress the need for data analysis to verify assumptions made by significance tests and the importance of estimating the effect size and conducting power analysis. The last stage is to report various results produced by the second stage.
To automate the process, we provide a toolkit, NLPStatTest. We introduce the three-stage comparison procedure (§2), and then describe the the main components (§3) and implementation details (§4) of NLPStatTest. We also present experimental results for running the system on both real-world and simulated data (§5). Lastly, we compare NLPStatTest with existing statistical testing toolkits (§6).
2 Comparing NLP System Performance
In this section we briefly describe the three-stage comparison procedure and define terms that are relevant to NLPStatTest. More detail about Stage 2 can be found in §3-§4.
2.1 Building an NLP System
The first stage is to build an NLP system, run it on test data, and compare the system output with a gold standard. The output of this stage is a list of numerical values such as accuracy or F-scores.
Definition 1 (Evaluation unit).
Let be a test instance. An evaluation unit (EU) is a set of test instances on which an evaluation metric can be meaningfully defined. A test set is a set of EUs.
Definition 2 (Evaluation metric).
Given an NLP system , the evaluation metric is a function that maps an EU to a numerical value:
| (1) |
where is the system output of given , and is the size of (i.e., the number of test instances in ).
An EU may contain one or more test instances. For example, a BLEU score can be computed on one or more sentences. The EU size affects sample size, -value, sample standard deviation, effect size and so on. It is therefore one of the parameters that users can set when using NLPStatTest.
2.2 The Comparison Stage
The second stage is the comparison stage which has four steps (see the largest box in Figure 1).
2.2.1 Data Analysis
When we compare two NLP systems and , the output of Stage 1 is a set of pairs, {}, where is the EU, and (similarly ) is defined in Equation 1.
Many statistical tests make certain assumptions about the sample (e.g., normality for test), so it is important to conduct data analysis to verify those assumptions in order to choose significance tests that are appropriate for a particular sample. If the sample does not follow any known distribution, non-parametric tests should be used.
NLPStatTestwill estimate sample skewness and test for normality. Then NLPStatTest will choose a test statistic (mean or median) for users and recommend a list of significance tests.
2.2.2 Statistical Significance Testing
The second step in Stage 2 is statistical significance testing, using two mutually exclusive hypotheses: the null hypothesis and the alternative . To compare two NLP systems, a (paired) two-sample test is usually used, though one-sample testing of pairwise difference is equivalent. NLPStatTest currently only considers paired two-sample testing for numerical data. Observations within a sample are assumed to be independent and identically distributed ().
To run a significance test, users first choose the direction of the test: left-sided, right-sided or two-sided. Then, users specify the hypothesized value of test statistic difference and the significance level , which is often set to 0.05 or 0.01 in the NLP field, and choose a test from the list. NLPStatTest will calculate the -value and reject if and only if .
2.2.3 Effect Size Estimation
In most experimental NLP papers employing significance testing, the -value is the only quantity reported. However, the -value is often misused and misinterpreted. For instance, statistical significance is easily conflated with practical significance; as a result, NLP researchers often run significance tests to show that the performances of two NLP systems are different (i.e., statistical significance), without measuring the degree or the importance of such a difference (i.e., practical significance).
Cohen (1990) noted “the null hypothesis, if taken literally, is always false in the real world.” For instance, because evaluation metric values of two NLP systems on a test set are almost never exactly the same, that two systems perform equally is (almost) always false. When is false, the -value will eventually approach zero in large samples Lin et al. (2013). In other words, no matter how tiny the system performance difference is, there is always a large enough dataset on which the difference is statistically significant. Therefore, statistical significance is markedly different from practical significance.
One way to measure practical significance is by estimating effect size, which is defined as the degree to which the ‘phenomenon’ is present in the population: the degree to which the null hypothesis is false Cohen (1994). While the need to estimate and report effect size has long been recognized in other fields Tomczak and Tomczak (2014), the same is not true in the NLP field. We include several methods for estimating effect size in NLPStatTest (see §3.3).
2.2.4 Power Analysis
There are two types of errors in hypothesis testing: Type I errors (false positives) and Type II errors (false negatives). The Type I error of a significance test, often denoted by , is the probability that, when is true, is rejected by the test. The Type II error of a significance test, usually denoted by , is the probability that under , is rejected by the test. While Type I error can be controlled by predetermining the significance level, Type II error can be controlled or estimated by power analysis.
Definition 3 (Statistical power).
The power of a statistical significance test is the probability that under , is correctly rejected by the test. The power of a test is .
Higher power means that statistical inferences are more correct and accurate Perugini et al. (2018). While power analysis is rarely used in the NLP field, it is considered good or standard practice in some other scientific fields such as psychology and clinical trials in medicine Perugini et al. (2018). We implement two methods of conducting power analysis in NLPStatTest(see §3.4).
2.3 Reporting Test Results
Beyond the -value, it is important to report other quantities to make the studies reproducible and available for meta-analysis, including the name of significance test used, the predetermined significance level , effect size estimate/estimator, the sample size, and statistical power.
3 System Design
NLPStatTest is a toolkit that automates the comparison procedure. It has four main steps, shown in the large box in Figure 1. To use NLPStatTest, users provide a data file with the NLP system performance scores produced in Stage 1. NLPStatTest will prompt users to either modify or use the default values for the parameters in the pink flags and then produce the output in the blue hexagons. The users can then report (some of) the output in Stage 3 of the comparison procedure.
3.1 Data Analysis
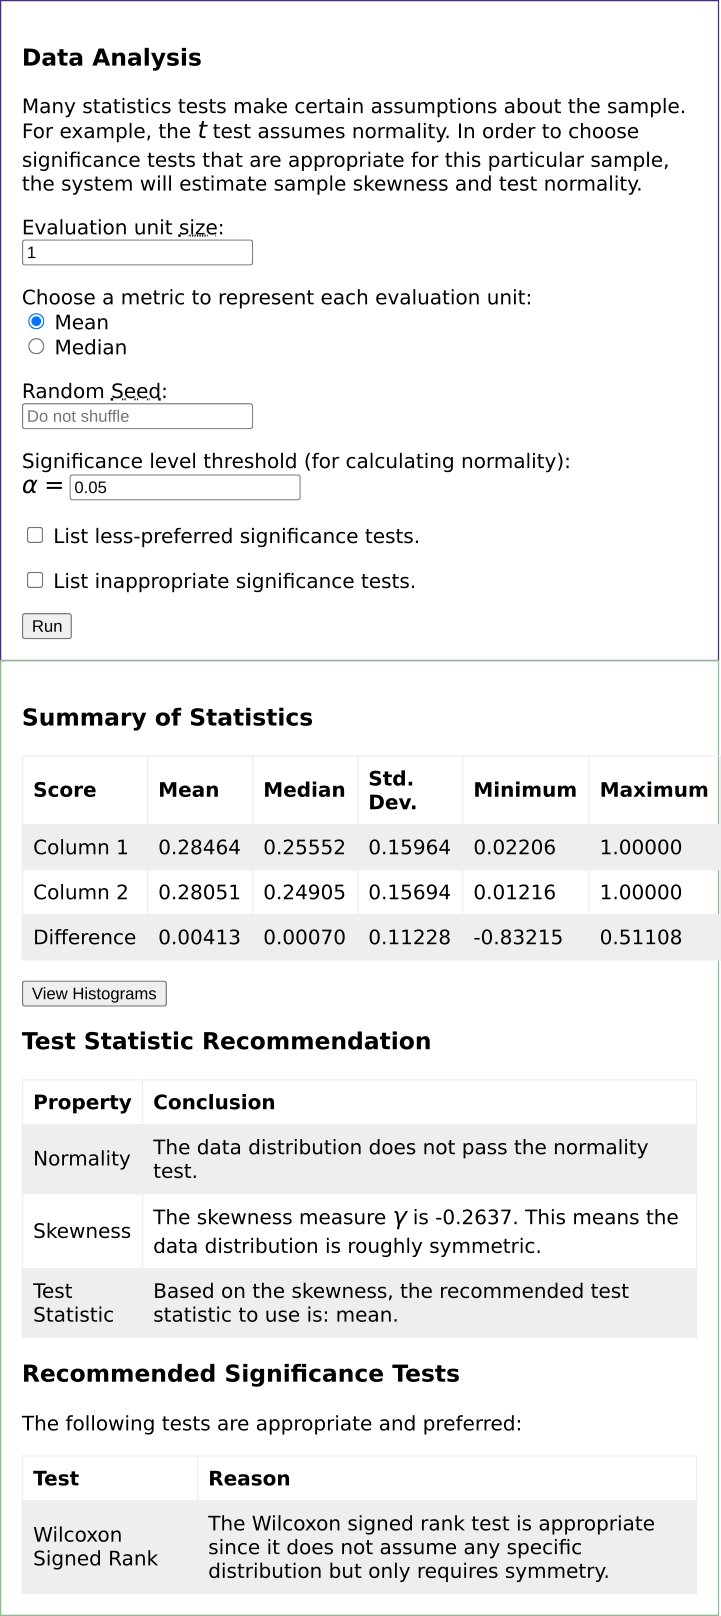
The first step of the comparison stage is data analysis, and a screenshot of this step is shown in Figure 2. The top part (above the Run button in the purple box) shows the input and parameters that the user needs to provide, and the bottom part (below the Run button in the green box) shows the output of the data analysis step.
3.1.1 The Input Data File
To compare two NLP systems, and , users need to provide a data file where each line is a pair of numerical values. There are two scenarios. In the first scenario, the pair is , where is the evaluation metric value (e.g., accuracy or F-score) of an EU given System A (see Equation 1), and .
In the second scenario, if and can be calculated as the mean or the median of the evaluation metric values of test instances in , users can upload a data file where each line is a pair of (, ), where and are the evaluation metric values of a test instance given System A and B, respectively. Users then chooses the EU size and specifies whether the EU metric value should be calculated as the mean or the median of the metric values of the instances in the EU. NLPStatTest will use adjacent lines in the file to calculate and . If users prefers to randomly shuffle the lines before calculating and , they can provide a seed for random shuffling.
3.1.2 Histograms and Summary Statistics
From the pairs, NLPStatTest generates descriptive summary statistics (e.g., mean, median, standard deviation) and histograms of three datasets, , , and , as shown in the first table and the three histograms in Figure 2.
3.1.3 Central Tendency Measure
Many statistical tests ( test, bootstrap test based on ratios, etc) are based on the mean as the test statistic, drawing inferences on average system performance. However, when the data distribution is not symmetric, the mean does not properly measure the central tendency. In that case, the median is a more robust measure. Another issue associated with mean is that if the distribution is heavy-tailed (e.g., the and Cauchy distributions), the sample mean oscillates dramatically.
In order to examine the symmetry of the underlying distribution, NLPStatTest checks the skewness of by estimating the sample skewness (). Based on the value, we use the following rule of thumb Bulmer (1979) to determine whether NLPStatTest would recommend the use of mean or median as the test statistic for statistical significance testing:
-
•
: roughly symmetric (use mean)
-
•
: slightly skewed (use median)
-
•
: highly skewed (use median)
3.1.4 Normality Test
To choose a good significance test for {}, we need to determine if the data is normally distributed. If it is, test is the most appropriate (and powerful) test; if not, then non-parametric tests which do not assume normality might be more appropriate.
If a distribution is skewed according to , there is no need to run normality test as the data is not normally distributed. For a non-skewed distribution, NLPStatTest will run the Shapiro-Wilk normality test Shapiro and Wilk (1965), which is itself a test of statistical significance. The user can choose the significance level ( in Figure 1).
3.1.5 Recommended Significance Tests
Based on the skewness check and normality test result, NLPStatTest will automatically choose a test statistic (mean or median) and recommend a list of appropriate significance tests (e.g., test if is normally distributed).
3.2 Testing
In this step, the user sets the significance level ( in Figure 1) and chooses a significance test from the ones recommended in the previous step. If the test has any parameter (e.g., the number of trials for bootstrap testing ), NLPStatTest will suggest a default value which can be changed by users. NLPStatTest will then run the test, calculate a -value (and/or provide a confidence interval), and reject if .
3.3 Effect Size
Effect size can be estimated by different effect size indices, depending on the data types (numerical or categorical) and significance tests. Dror et al. (2020) defined effect size as the unstandardized difference between system performance, while Hauch et al. (2012) and Pimentel et al. (2019) used the standardized difference.
NLPStatTest implements the following four indices. Once users select one or more, NLPStatTest will calculate effect size accordingly and display the results.
Cohen’s estimates the standardized mean difference by
| (2) |
where and are the sample means and denote standard deviation of . Cohen’s assumes normality and is one of the most frequently used effect size indices. If Cohen’s , or any other effect size indices depending on , is used to estimate effect size, the EU size will affect the standard deviation and thus effect size estimate.
Hedges’ adjusts the bias brought by Cohen’s in small samples by the following:
| (3) |
where is the size of .
Wilcoxon is an effect size index for the Wilcoxon signed rank test, calculated as , where
| (4) |
Here, is the test statistic for Wilcoxon signed rank test and is the set of tied ranks.
Hodges-Lehmann Estimator Hodges and Lehmann (1963) is an estimator for the median. Let . The estimator for one-sample testing is given by
| (5) |
3.4 Power Analysis
Power (Definition 3) covaries with sample size, effect size and the significance level . In particular, power increases with larger sample size, effect size, and . There are two common types of power analysis, namely prospective and retrospective power analysis, and NLPStatTest implements both types.
3.4.1 Prospective Power Analysis
Prospective power analysis is used when planning a study (usually in clinical trials) in order to decide how many subjects are needed. In the NLP field, when one constructs or chooses a test corpus for evaluation, it will be beneficial to conduct this type of power analysis to determine how big a corpus needs to be in order to ensure that the significance test reaches the desired power level.
In NLPStatTest, prospective power analysis is a preliminary and optional step. The user needs to provide the expected mean and standard deviation of the differences between samples, the desired power level, and the required significance level. NLPStatTest will calculate the minimally required sample size for test via a closed form, assuming the normal distribution of the data.
3.4.2 Retrospective Power Analysis
Retrospective or post-hoc power analysis is usually done after a significance test to determine the relation between sample size and power. There are two scenarios associated with retrospective power analysis: When the values in {} are from a known distribution, one can use Monte Carlo simulation to directly simulate from this known distribution. To do this, one has to have an informed guess of the desired effect size (i.e., mean difference) via meta-analysis of previous studies.
When the distribution of the sample is unknown a priori, one can resample with replacement from the empirical distribution of the sample (a.k.a. the bootstrap method Efron and Tibshirani (1993)) to estimate the power.
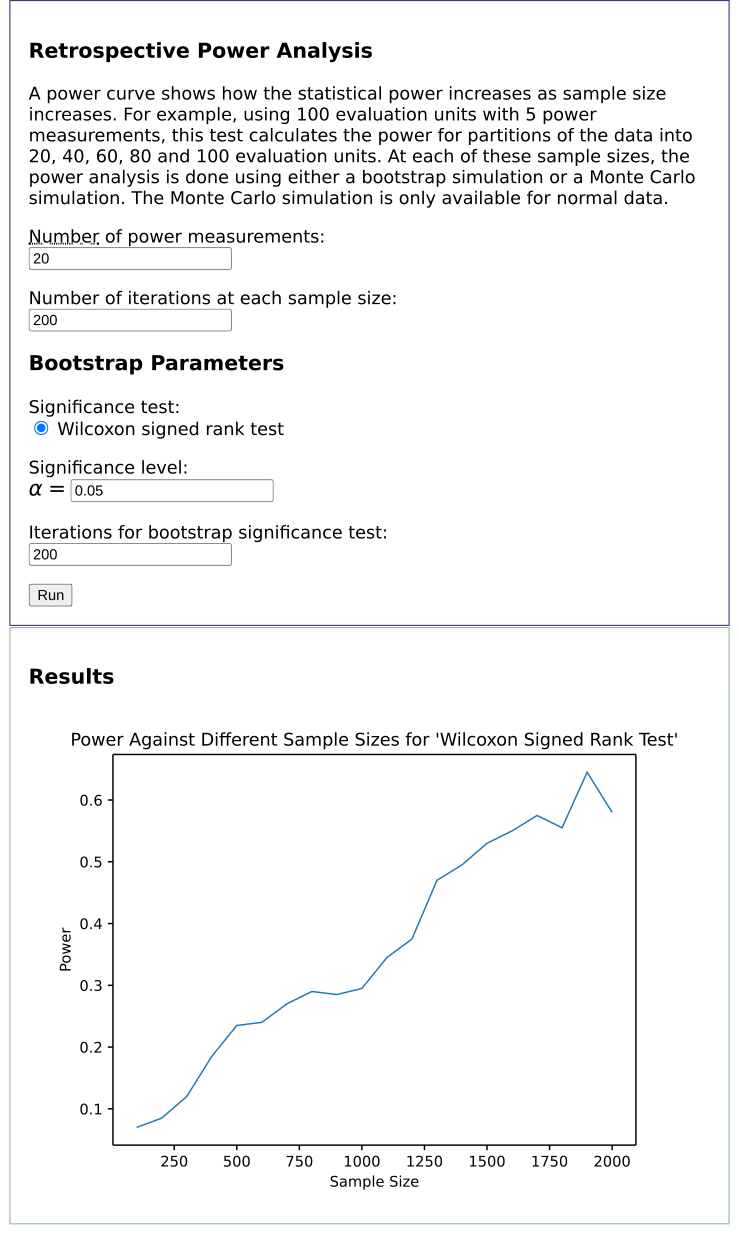
NLPStatTest implements both methods. Users can employ one or both; NLPStatTest will produce a figure that shows the relation between sample size and power, as in Figure 3.
4 Implementation Details
The NLPStatTest graphical user interface can be run locally or on the Web. There is also a command line version. The graphical tool, the command line tool, the source code, a user manual, a tutorial video are available at nlpstats.ling.washington.edu. We recommend using an updated Chromium-based browser.
The client-side web interface is written in HTML, CSS, and JavaScript (with JQuery). The server-side code is written in Python, using the Flask web framework. YAML is used for configuration files. KaTeX is used to render mathematical symbols. The Python code uses the SciPy and NumPy libraries to implement statistical tests and Matplotlib to generate the histograms and graphs.
5 Experiment
To test the output validity and speed of NLPStatTest, we run experiments using both real and simulated data.
5.1 Real Data from WMT-2017
The WMT-2017 shared task Bojar et al. (2017) reported system performance results based on human evaluation scores; unpaired testing (Wilcoxon rank-sum) was used because not many sentences had human evaluation scores for both MT systems that were being compared.
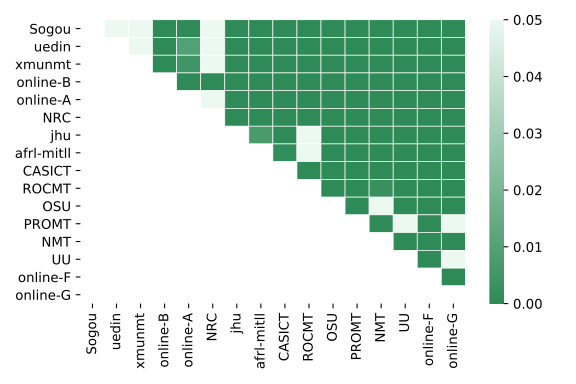
Because NLPStatTest currently implements paired testing only, we use the Wilcoxon signed-rank test (instead of Wilcoxon rank-sum test) and the BLEU scores (instead of human evaluation scores) when comparing MT systems. According to Bojar et al. (2017), a set of 15 or more sentence-level evaluation scores constitutes a reliable measure of translation quality; thus, we set the EU size to be 15. We also reshuffled the scores before grouping test instances into evaluation units.
Figure 4 shows the results of pairwise comparisons among all 16 Chinese-to-English MT systems (120 system pairs in total). The heatmap is similar to the comparison results in Bojar et al. (2017) (see Figure 5 in that paper). The minor differences of the two heatmaps are due to different evaluation metrics (BLEU vs. human scores), the significant tests (Wilcoxon signed-rank vs. Wilcoxon rank-sum), and the numbers of EUs (more test sentences have BLEU scores than human evaluation scores).
5.2 Simulated Data
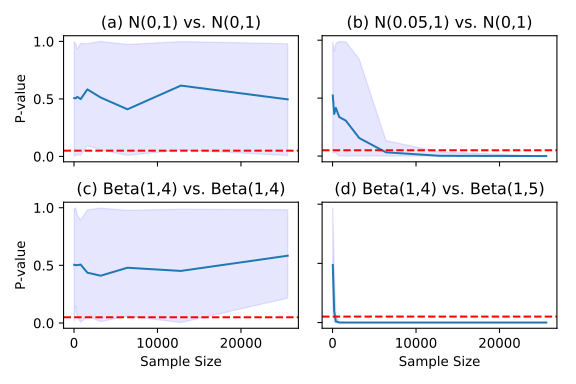
We also run simulation experiments on NLPStatTest to validate the testing results. Here, we conduct two-sided, paired testing, varying sample size from 30 to 25,000, each with 20 iterations of tests to obtain a range of -values. As shown in Figure 5, when is true (see Fig 5(a) and 5(c)), -values range freely in . When is false (see 5(b) and 5(d)), -values approach zero as sample size increases, as expected. The fast convergence to zero in 5(d) may be due to the small variance of the differences between the two Beta samples (), even though the difference between sample medians is small (). In contrast, 5(b) converges to zero much more slowly due to the large variance.
6 Related Work
Dror et al. (2018) made an accompanying package available 222https://github.com/rtmdrr/testSignificanceNLP for hypothesis testing. This package includes functionalities such as testing for normality, testing, permutation/bootstrap testing, and using McNemar’s test for categorical data. NLPStatTest implements all the aforementioned tests except McNemar’s test. In addition, NLPStatTest offers data analysis, effect size estimation, power analysis and graphical interface.
NLPStatTest is based on the frequentist approach to hypothesis testing. Sadeqi Azer et al. (2020) developed a Bayesian system333https://github.com/allenai/HyBayes which uses the Bayes factor to determine the posterior probability of being true or false.
7 Conclusion
While statistical significance testing has been commonly used to compare NLP system performance, a small -value alone is not sufficient because statistical significance is different from practical significance. To measure practical significance, we recommend estimating and reporting of effect size. It is also necessary to conduct power analysis to ensure that the test corpus is large enough to achieve a desirable power level. We propose a three-stage procedure for comparing NLP system performance, and provide a toolkit, NLPStatTest, to automate the testing stage of the procedure. For future work, we will extend this work to hypothesis testing with multiple datasets or multiple metrics.
References
- Bojar et al. (2017) O. Bojar, R. Chatterjee, C. Federmann, Y. Graham, B. Haddow, S. Huang, M. Huck, P. Koehn, Q. Liu, V. Logacheva, C. Monz, M. Negri, M. Post, R. Rubino, L. Specia, and M. Turchi. 2017. Findings of the 2017 conference on machine translation (WMT17). In Proceedings of the Second Conference on Machine Translation, Volume 2: Shared Task Papers, pages 169–214, Copenhagen, Denmark. Association for Computational Linguistics.
- Bulmer (1979) M. G. Bulmer. 1979. Principles of Statistics, page 57. Dover, New York.
- Cohen (1990) J. Cohen. 1990. Things I have learned (so far). American Psychologist, 45(12):1304 – 1312.
- Cohen (1994) J. Cohen. 1994. The earth is round (p .05). American Psychologist, pages 997–1003.
- Dror et al. (2018) R. Dror, G. Baumer, S. Shlomov, and R. Reichart. 2018. The hitchhiker’s guide to testing statistical significance in natural language processing. In Proceedings of ACL-2018 (Volume 1: Long Papers), pages 1383–1392, Melbourne, Australia.
- Dror et al. (2020) R. Dror, L. Peled-Cohen, S. Shlomov, and R. Reichart. 2020. Statistical Significance Testing for Natural Language Processing. Morgan & Claypool.
- Efron and Tibshirani (1993) B. Efron and R. J. Tibshirani. 1993. An Introduction to the Bootstrap. Chapman & Hall, New York, NY.
- Hauch et al. (2012) V. Hauch, I. Blandón-Gitlin, J. Masip, and S. L. Sporer. 2012. Linguistic cues to deception assessed by computer programs: A meta-analysis. In Proceedings of the Workshop on Computational Approaches to Deception Detection, pages 1–4, Avignon, France.
- Hodges and Lehmann (1963) J. L. Hodges and E. L. Lehmann. 1963. Estimates of location based on rank tests. Annals of Mathematical Statistics, 34(2):598–611.
- Lin et al. (2013) M. Lin, H. Lucas, and G. Shmueli. 2013. Too big to fail: Large samples and the p-value problem. Information Systems Research, 24:906–917.
- Perugini et al. (2018) M. Perugini, M. Gallucci, and G. Costantini. 2018. A practical primer to power analysis for simple experimental designs. International Review of Social Psychology, 31.
- Pimentel et al. (2019) T. Pimentel, A. D. McCarthy, D. Blasi, B. Roark, and R. Cotterell. 2019. Meaning to form: Measuring systematicity as information. In Proceedings of ACL-2019, pages 1751–1764, Florence, Italy.
- Sadeqi Azer et al. (2020) E. Sadeqi Azer, D. Khashabi, A. Sabharwal, and D. Roth. 2020. Not all claims are created equal: Choosing the right statistical approach to assess hypotheses. In Annual Meeting of the Association for Computational Linguistics (ACL).
- Shapiro and Wilk (1965) S. S. Shapiro and M. B. Wilk. 1965. An analysis of variance test for normality (complete samples)†. Biometrika, 52(3-4):591–611.
- Tomczak and Tomczak (2014) M. Tomczak and E. Tomczak. 2014. The need to report effect size estimates revisited. An overview of some recommended measures of effect size. Trends in Sport Sciences, 21:19–25.
- Wasserstein and Lazar (2016) R. L. Wasserstein and N. A. Lazar. 2016. The ASA statement on p-values: Context, process, and purpose. The American Statistician, 70(2):129–133.