font=sf,footnotesize
CEISAM, Nantes]Université de Nantes, CNRS, CEISAM UMR 6230, F-44000 Nantes, France
LCPQ, Toulouse]Laboratoire de Chimie et Physique Quantiques, Université de Toulouse, CNRS, UPS, France
LCPQ, Toulouse]Laboratoire de Chimie et Physique Quantiques, Université de Toulouse, CNRS, UPS, France
CEISAM, Nantes]Université de Nantes, CNRS, CEISAM UMR 6230, F-44000 Nantes, France
{tocentry}
![[Uncaptioned image]](/html/2011.13233/assets/Toc.png)
Benchmarking TD-DFT and Wave Function Methods for Oscillator Strengths and Excited-State Dipole Moments
Abstract
Using a set of oscillator strengths and excited-state dipole moments of near full configuration interaction (FCI) quality determined for small compounds, we benchmark the performances of several single-reference wave function methods (CC2, CCSD, CC3, CCSDT, ADC(2), and ADC(3/2)) and time-dependent density-functional theory (TD-DFT) with various functionals (B3LYP, PBE0, M06-2X, CAM-B3LYP, and B97X-D). We consider the impact of various gauges (length, velocity, and mixed) and formalisms: equation of motion (EOM) vs linear response (LR), relaxed vs unrelaxed orbitals, etc. Beyond the expected accuracy improvements and a neat decrease of formalism sensitivy when using higher-order wave function methods, the present contribution shows that, for both ADC(2) and CC2, the choice of gauge impacts more significantly the magnitude of the oscillator strengths than the choice of formalism, and that CCSD yields a notable improvement on this transition property as compared to CC2. For the excited-state dipole moments, switching on orbital relaxation appreciably improves the accuracy of both ADC(2) and CC2, but has a rather small effect at the CCSD level. Going from ground to excited states, the typical errors on dipole moments for a given method tend to roughly triple. Interestingly, the ADC(3/2) oscillator strengths and dipoles are significantly more accurate than their ADC(2) counterparts, whereas the two models do deliver rather similar absolute errors for transition energies. Concerning TD-DFT, one finds: i) a rather negligible impact of the gauge on oscillator strengths for all tested functionals (except for M06-2X); ii) deviations of ca. 0.10 D on ground-state dipoles for all functionals; iii) strong differences between excited-state dipoles obtained with, on the one hand, B3LYP and PBE0, and on the other hand, M06-2X, CAM-B3LYP, and B97X-D, the latter group being markedly more accurate; iv) the better overall performance of CAM-B3LYP for the two considered excited-state properties. Finally, for all investigated properties, both the accuracy and consistency obtained with the second-order wave function approaches, ADC(2) and CC2, do not clearly outperform those of TD-DFT, hinting that assessing the accuracy of the latter (or selecting a specific functional) on the basis of the results of the former is not systematically a well-settled strategy.
.
1. Introduction
The accurate modeling of electronically excited states (ESs) remains one of the main goals pursued by theoretical and computational chemists. 1, 2, 3, 4, 5, 6, 7, 8, 9, 10, 11 Indeed, theory is often required to support or complement photophysical and photochemical experiments, whose results are typically analyzed on the basis of both empirical models and first-principles calculations. Along the years, thanks to the fantastic development and implementation efforts of many research groups around the world, several ab initio methods have become applicable to chemically-relevant problems, and one can highlight the well-established time-dependent density-functional theory (TD-DFT) formalism, 12, 13, 3 the second-order algebraic diagrammatic construction [ADC(2)] scheme for the polarization propagator, 14, 15, 16, 17 the second-order approximate coupled-cluster (CC2) method, 18 as well as the emerging Bethe Salpeter equation (BSE/) formalism, 19, 20, 21, 10 and the similarity-transformed equation-of-motion coupled-cluster with singles and doubles (STEOM-CCSD) method 22, 23 as black-box single-reference methods able to deliver ES energies and properties for rather large compounds in complex environments. However, none of these five methodologies is able to yield chemically accurate excitation energies, i.e., average absolute errors smaller than 1 kcal.mol-1 (or 0.043 eV).11 Additionally, the computationally most efficient approach, namely TD-DFT, is plagued by a significant dependency on the selected exchange-correlation functional (XCF) in its traditional adiabatic formulation. 4
Another noteworthy issue is that theoretical calculations must be both accurate enough and deliver data allowing meaningful comparisons with measurements. This is a significant difficulty, as the most directly accessible theoretical quantities, i.e., the vertical excitation energies (VEEs), have no direct experimental equivalents. Therefore, the sets of theoretical best estimates (TBEs) of VEEs proposed by Thiel and coworkers, 24, 25, 26 and by some of us, 27, 28, 29, 30 have been mostly used to benchmark lower-order methods but do not pave the way to straightforward theory-experiment comparisons. To lift this difficulty, the obvious choice is to focus on the so-called 0-0 energies, 31, 32, 33, 34 but this requires computing ES vibrations, which is computationally expensive. In addition, comparisons between measured and predicted 0-0 energies is often limited to the lowest ES and still provides an almost purely energetic probe. Indded, it has been evidenced that the accuracy of the selected structures and vibrations is rather irrelevant in the final theoretical estimate. 32, 33
Even for ground states (GSs), it has been argued that such energetic metric provides only a rather incomplete assessment of the pros and cons of any specific methods. For example, a Kohn-Sham DFT energy can be accurate even if the underlying density is inaccurate. 35 As stated by Hait and Head-Gordon, molecular dipoles are, despite their intrinsic limitations, handy and valuable quantities for probing the quality of the density (or wave function). 36, 37 In an ES framework, one may use not only the ES dipole moments () but also the oscillator strengths () or other transition-related quantities to estimate the quality of ES wave functions or densities. Advantageously, both and can be measured experimentally, although the accuracy of such measurements clearly depends on both the nature of the ES and the experimental technique, as we discussed in the introduction of an earlier work. 38
To allow well grounded benchmarks of ES properties, we have recently developed a set of theoretical and values of (near) full configuration interaction (FCI) quality for a significant set of small molecules and ESs. 38 To attain near-FCI quality, we systematically increased the excitation degree of the coupled-cluster (CC) expansion up to quintuples (i.e., CCSDTQP) using a series of increasingly large correlation-consistent atomic basis sets including diffuse functions so as to be as close as possible from both radial and angular near-completeness. 39 The goal of the present work is to use these reference data (as well as new additional values computed for the present study) to benchmark a large set of wave function and density-based approaches for and .
In assessing theoretical models for these two ES properties, an additional complexity comes from the fact that various “options” are available to compute these, which is not the case for VEEs. First, the actual value of the oscillator strength naturally depends on the gauge of the interaction operator between the quantum system and the applied periodic field, and these quantities can be determined in the so-called length, velocity, or mixed gauges, the former being the typical default in most electronic structure software packages. The results obtained with these three gauges are equivalent only when the wave function is exact (or in the complete basis set limit for approximate methods, such as the random phase approximation or TD-DFT, 2 which fulfill the Thomas-Reiche-Kuhn sum rule, 40, 41, 42 the fulfillment of this sum rule being commonly used as a test of the degree of completeness of the one-electron basis set). 43 Taking neon, the nitrogen molecule, and water as examples, Pawloski et al. demonstrated that the gauge invariance improves significantly going from CC2 and CCSD to CC3. 44 This is, to the very best of our knowledge, the only study tackling this issue in a systematic way, the sole exception being an earlier work limited to CCSD by Pedersen and Koch. 45
Second and most importantly, there exist two different ways for calculating molecular properties, which are, in general, not equivalent for approximate wave functions. One of the possible approaches consists in computing a given property as a derivative of the energy with respect to the perturbation strength. In such a case, the variation of the wave function parameters are typically obtained through a Lagrangian formalism that provides a rigorous mathematical framework for such purposes. 46, 47, 18, 48, 49 The well-known linear-response (LR) 50, 47, 51, 52 formalism of CC theory follows this philosophy, and such formalisms can be applied for ADC as well. 49 In LR, one can additionally choose to perform the calculations within the “orbital-relaxed” (OR) or “orbital-unrelaxed” (OU) scheme, the latter neglecting the orbital response due to the external perturbation (e.g., the electric field for the dipole moments). 53, 54 In other words, at the LR(OU)-CC level, only the variation of the CC amplitudes with respect to the external perturbation is taken into account. Again, OU and OR do lead to the same results only when the underlying function is exact. Alternatively, one can compute molecular properties directly from the expectation value of the corresponding operator for the physical observable. This second route is followed in CC calculations performed in the well-known equation-of-motion (EOM) 55, 56 formalism, as well as in ADC calculations done within the so-called intermediate state representation (ISR). 57, 58, 17 Indeed, propagator methods such as ADC are not intrinsically designed to compute excited-state wave functions and properties, and the ISR has been introduced to palliate this. In terms of orbital relaxation, the ISR formalism can be viewed as an intermediate between OR and OU, 59 whereas the main theoretical distinction between LR and EOM is that the more expensive LR formalism takes into account the relaxation of the ground-state CC amplitudes due to the external perturbation (hence providing size-intensive transition properties), while the cheaper EOM approach freezes them during the computation of the perturbation but includes the contribution of the reference determinant to the transition properties. 56, 60 It is noteworthy, that all these formalisms [LR(OR), LR(OU), EOM, or ISR] systematically provide the same VEEs irrespective of the truncation order of the CC or ADC expansion. Yet, they deliver distinct oscillator strengths and dipole moments from one another (except again in the case of the exact wave function) as the level of wave function relaxation (at the correlated level) differs. In terms of numerical experiments, several groups have provided estimates: i) Caricato et al. studied the oscillator strengths obtained at the LR-CCSD and EOM-CCSD levels, 61 and concluded that significant differences only occur for large systems; ii) Kannar and Szalay also compared EOM and LR oscillator strengths obtained using CC2 and CCSD (see below); 62 (but no comparisons between EOM-CC3 and LR-CC3 has, to the best of our knowledge, been made available to date); iii) the Dreuw group has also evidenced for several examples that the differences between various frameworks tend to become insignificant as the expansion order of the ADC or CC series is increased. 59 Finally, neither the derivative-based formalism nor the expectation-value-based formalism can be considered superior in general.
In short, there is a plethora of “options” making the benchmarking of ES properties clearly more involved than that of VEEs. Several valuable benchmarks of oscillator strengths and excited-state dipole moments are, of course, available for various test sets, and we provide an overview of these works below.
2. Literature survey
2.1 Oscillator strengths
Let us start with oscillator strengths. These have been the subject of several assessments, most of them being focussed on TD-DFT’s reliability for such quantities. 63, 64, 65, 66, 67, 68, 62, 69, 70, 71 As early as 2007, Champagne and coworkers compared TD-DFT oscillator strengths obtained with several XCFs in a series of substituted benzenes to both experimental and CC2/CCSD values. 64 They concluded that a large share of exact exchange is required to obtain accurate results and recommended the use of BH&HLYP. In their seminal 2008 paper, the Thiel group compared LR-CC2, LR-CCSD and CASPT2 oscillator strengths determined with the TZVP basis set for their well-known set of compounds. 66 In contrast to the VEEs, they did not define TBEs, but highlighted the high degree of correlation between LR-CC2 and LR-CCSD values, whereas the CASPT2 oscillator strengths were found to be generally larger than their CC counterparts. They, next, extended this comparison to several TD-DFT approaches, 66 and reported mean absolute errors (MAEs) of 0.128 (0.075), 0.113 (0.055), 0.096 (0.044) and 0.069 (0.062) for BP86, B3LYP, BH&HLYP, and DFT/MRCI, respectively when using their own CASPT2 (LR-CC2) TZVP values as references. In 2010, the same group investigated basis set effects on the LR-CC2 oscillator strengths. 72 The same year, Caricato and coworkers compared values for eleven compact organic compounds (69 ESs) obtained with EOM-CCSD and TD-DFT, 67 both methods being applied with a very extended atomic basis set. Using the former approach as benchmark, these authors evidenced that CAM-B3LYP was the best performer amongst the 28 tested XCFs. In 2014, Dreuw’s group performed an extensive comparison of oscillator strengths obtained with ADC(2) and ADC(3/2) (within the ISR formalism), LR-CC2, LR-CCSD, as well as literature data for the molecules of the Thiel’s set. They concluded that ADC(3/2) delivers very accurate oscillator strengths. 16 The same year, Kannar and Szalay determined LR-CC3/TZVP oscillator strengths for Thiel’s set, and even LR-CCSDT/TZVP values for a subset of 15 ESs. 62 They tested both the LR and EOM formalisms for both CC2 and CCSD and found that LR slightly outperforms EOM, whereas the CCSD oscillator strengths are significantly more accurate than their CC2 equivalents. This is likely the most advanced benchmark of oscillator strengths available to date (for wave function methods). The data produced in Ref. 62 were subsequently employed to benchmark both SOPPA 69 and BSE/ oscillator strengths, 70 the former showing significantly larger MAEs than the latter. In Ref. 70, ADC(2), CC2 and BSE/ oscillator strengths determined for large organic dyes are reported and their relative accuracy discussed. Yet again, such comparisons do not rely on indisputable references. We note that all the studies on oscillator strengths mentioned above are performed in the length gauge.
2.2 Excited-state dipole moments
As for oscillator strengths, one can find several benchmark studies dealing with excited-state dipoles, most of them aiming at finding the most suitable XCF in a TD-DFT context. 73, 74, 66, 75, 76, 77, 78, 79, 80, 59, 81 The first investigation in this vein is likely due to Furche and Ahlrichs who considered ten in tiny compounds and compared the performances of five XCFs (BLYP, BP86, PBE, B3LYP, and PBE0) to experimental values. 73 Quite surprisingly, they found that the errors are larger with the global hybrids (B3LYP and PBE0) than with the three GGAs (BLYP, BP86, and PBE), the latter delivering MAEs in the range 0.11–0.12 D. In 2008, King compared TD-DFT excited-state dipoles determined with two functionals to the corresponding CC values obtained by EOM-CCSD and LR-CC3 values for 29 ESs in pyrrole and furan. He reported respective MAEs around 1.1 D and 0.5 D for these two compounds when considering the B97-1 functional. 74 The same year, Thiel and coworkers reported MAEs of 0.75, 0.59, and 0.61 D with BP86, B3LYP, and BH&HLYP, using their CASPT2/TZVP dipoles as reference. 24 Again, they later computed LR-CC2/aug-cc-pVTZ values for ES dipole moments. 72 The selection of OU or OR for the computation of is apparently not specified in that latter work. In 2011, Hellweg compared GS and ES dipole moments computed with the OR approach combined with LR-ADC(2), LR-CC2, and several spin-scaled variants to experimental values for ten molecules. 79 He reported a MAE of ca. 0.2 D for both of these second-order models, highlighting that they are reasonably accurate, yet far from flawless. In 2016, one of us compared the LR(OR)-CC2/aug-cc-pVTZ and TD-DFT/aug-cc-pVTZ (16 XCFs) excess dipole moments (i.e., ) determined in 30 organic dyes, 80 which led to MAEs around 1 D for hybrid XCFs and 1.5 D for semi-local XCFs. Finally, in the recent and very detailed work from Ref. 59, Hodecker et al. compared, in particular, the Lagrangian and ISR formalisms for several ADC variants [ADC(1), ADC(2), ADC(2)-x, ADC(3/2), and ADC(3)] considering both the GS and ES dipoles. They found that the ISR ADC(2) values are rather close from their LR(OU) analogs. In addition, they also showed that, within the LR framework, the differences between OR and OU GS dipole moments are slightly larger with CCSDT than with CC3, and that the impact of orbital relaxation is larger for than for , irrespective of the CC excitation level. The same group very recently assessed the performance of unitary CC theory for several ES dipole moments in water, hydrogen fluoride, 4-cyanoindole, and 2,3-benzofuran. 81 For the two former (latter) molecules FCI/3-21G (experimental) values were considered as reference.
As evidenced by the above literature survey, previous benchmark studies typically rely on significantly less accurate reference values than the present contribution. Moreover, they are generally focussed on a subset of specific approaches and/or molecules. Here, we have specifically designed the present study to be as general as possible (yet limited to small-sized compounds), while reporting comparisons between various formalisms for a given wave function method, as well as further assessments against highly-accurate TBEs.
3. Methods
3.1 Molecules, geometries and basis sets
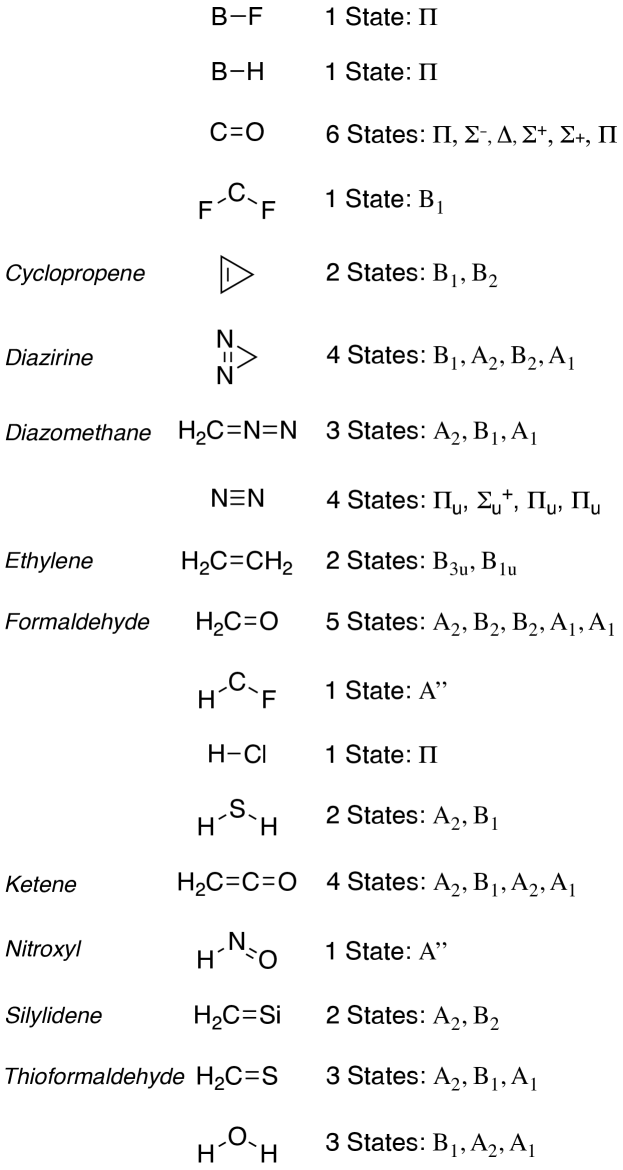
The molecules and states considered in the present study are represented in Fig. 1. The corresponding geometries have been obtained at the CC3/aug-cc-pVTZ level of theory 82, 83 and are given in the Supporting Information (SI). Note that several structures come from previous works, 27, 30, 38 whereas a few additional optimizations have been specifically performed for the present study with DALTON 2017 84 and CFOUR 2.1 85 applying default parameters in both cases.
All our computations of VEEs, , , and have been performed with the aug-cc-pVTZ basis set while enforcing the frozen-core (FC) approximation during the ground- and excited-state calculations. It is well known that energies and properties derived from density-based and wave function-based methods exhibit rather different basis set dependencies. 86, 87, 39 However, this augmented triple- basis set was chosen because it stands as the de facto standard in ES calculations. We refer the interested reader to Section S6 of the SI where one can find a basis set study for the water molecule. In addition, our previous work also contains many data regarding basis set effects at various CC levels.38
3.2 Reference values
For the smallest molecules, our reference values have been taken from Ref. 38, choosing the TBE/aug-cc-pVTZ values listed in this earlier work. We have added to this original data set, a set of five molecules (CF2, cyclopropene, diazirine, diazomethane, and ketene) encompassing an additional 14 ESs. To this end, we used exactly the same protocol as in our earlier work. 38 Briefly, we have applied the MRCC (2017 and 2019) program 88, 89 to perform LR-CC calculations for (length gauge), , and with CCSD, 90, 91, 92, 56, 93 CCSDT, 94, 95, 96, 97, 98 and CCSDTQ, 99, 100, 52, 101 combined with several atomic basis sets of increasingly large size. The OR variant of the LR formalism was systematically applied for the CC calculations. Next, we used the traditional incremental approach, 52, 102, 103, 104, 105, 106 consisting in estimating the LR-CCSTQ contribution determined with a small basis set to correct the LR-CCSDT/aug-cc-pVTZ values, so as to obtain TBE values. In our previous work, 38 it was shown that the difference between LR-CCSTQ and LR-CCSTQP dipoles and oscillator strengths are negligible. At this stage, we would like to stress that all our reference data include (at least) CCSDTQ corrections and have been determined with the most “ambitious” scheme, e.g., within the LR(OR) formalism. The interested reader is referred to Tables S1–S5 of the SI where one can find details regarding these new calculations as well as comparisons with existing experimental and theoretical literature data. For three of the molecules, we also performed additional CASPT2/aug-cc-pVTZ calculations. 107, 108 The CASPT2 calculations were performed on top of the state-averaged (SA) complete active space self consistent field (CASSCF) wave function. The SA-CASSCF wave functions have been obtained by considering the ground state and at least the excited state of interest. The information regarding the construction of the SA-CASSCF wave functions can be found in the relevant Tables in the SI. We tackled the intruder state problem in CASPT2 both by increasing the size of active spaces as well as by introducing a level shift parameter (0.3 a.u.). 109 One set of CASPT2 calculations are performed by introducing the ionization-potential-electron-affinity (IPEA) shift (0.25 a.u.). 110 All the SA-CASSCF and CASPT2 (rs2 contraction level) calculations have been performed with MOLPRO 2019 program. 111, 112.
3.3 Computational details
We used a large panel of codes to perform our calculations. We generally applied default parameters for all programs, as comparisons between the results obtained with different codes showed totally negligible differences (see Ref. 38 and the SI). Nonetheless, in the specific case of ES CC calculations with Q-CHEM 5.3, we had to significantly tighten the default settings to obtain numerically accurate dipole moments. As stated above, we systematically employed the aug-cc-pVTZ basis set and enforce the FC approximation during all wave function calculations. TD-DFT calculations are likewise performed in the FC approximation. For the ADC and CC calculations performed with TURBOMOLE 6.4 as well as the ADC calculations performed with Q-CHEM 5.3, the RI approach was applied with the default auxiliary basis sets associated with aug-cc-pVTZ.
Because ADC is a polarization propagator-based method, one does not have directly access to the ground-state wave function because such approach aims at a direct expansion of the response functions in orders of the electron fluctuation potential without reference to a specific ground-state wave function. 49, 59 However, the natural and computationally convenient choice is to choose MP2 and MP3 as ground-state methods for ADC(2) and ADC(3), respectively, which is furthermore consistent in terms of expansion order in the fluctuation potential.
3.3.1 Ground-state dipoles.
The computation of with wave function approaches have been performed with the following codes: MRCC (2017 and 2019) 88, 89 for CCSDT and CCSD (both OR and OU), DALTON 84 for CC3 (OU), CFOUR for CC3 (OR), TURBOMOLE 113, 114 for CC2 and MP2 (both OR and OU), and Q-CHEM 5.3 115 for MP2 (ISR). At the DFT level, the dipoles have been computed with GAUSSIAN 16, 116 selecting five popular hybrid functionals, namely B3LYP, 117, 118 PBE0, 119, 120 M06-2X, 121 CAM-B3LYP, 122 and B9X-D.123 The default ultrafine grid was used for all DFT and TD-DFT calculations. For the wave function approaches many consistency checks have been performed between various codes, including MRCC, Q-CHEM, GAUSSIAN, CFOUR, and DALTON (see Table S8 in the SI), and, as expected, only trifling differences (0.001 D) could be detected between various implementations.
3.3.2 Oscillator strengths.
Our LR-CC2, LR-CCSD, and LR-CC3 oscillator strengths have been obtained in the three gauges thanks to DALTON. The EOM-CC2, EOM-CCSD, and EOM-CC3 values in length gauge were obtained with 1.0, 124 whereas the EOM-CCSD values in the two other gauges were obtained with GAUSSIAN 16. The LR-CCSDT values (length gauge) were determined with the MRCC program. Q-CHEM was used to obtain ADC(2) and ADC(3/2) oscillator strengths in the ISR formalism (length gauge), whereas LR-ADC(2) values were obtained with TURBOMOLE in the three gauges. Finally, all TD-DFT calculations were realized with GAUSSIAN, applying the same XCFs as above.
3.3.3 Excited-state dipoles.
For the values, we selected MRCC again for LR-CCSDT and LR-CCSD (both OR and OU), TURBOMOLE for LR-CC2 and LR-ADC(2) (both OU and OR), CFOUR for EOM-CC2 and EOM-CCSD, Q-CHEM for the ISR-ADC(2) and ISR-ADC(3/2), and GAUSSIAN for all TD-DFT calculations. Again, the interested reader is referred to Table S16 in the SI for additional consistency checks between the various codes, including PSI-4 1.2125 for the EOM-CC dipoles.
As a final remark, let us stress that we provide, for molecules having a single non-zero dipole component, the signs of dipole moments in the Tables of the SI, so that a sign change from the GS to an ES is clear. However, we do not account for signs while computing MSEs, Max() and Max(), only its magnitude. In such a way, a negative MSE indicates an underestimated dipole amplitude rather than a specific orientation.
4. Results and Discussion
4.1 On the challenge and consequences of state mixing
For most of the ESs treated herein, the identification of the considered states with all tested theoretical approaches could be easily achieved using the usual criteria for such task (energy, symmetry, nature and symmetry of the involved molecular orbitals, oscillator strength, sign and magnitude of the dipole moment). Therefore, except for a few cases, the assignments are unambiguous. Nevertheless, it should be highlighted that, in contrast to benchmarks focussed on VEEs for which ambiguity in a specific assignment is not systematically a dramatic issue, state mixing is often a major problem when assessing and . Indeed, the mixing of two ESs of the same symmetry can strongly affect their properties while their relative energies remain similar, making assignments less settled. Let us discuss a few challenging cases.
For the three ESs of dinitrogen, that are close in energy, the computed values are very strongly basis set and method dependent, 38 so that several conflicting analyses of their nature can be found in the literature. 126, 127, 128 We have here considered the symmetry of the dominant molecular orbital pair in our assignment, 38 but it is quite obvious that the relative magnitudes of the oscillator strengths cannot be definitively determined: for the second ES, our TBE is , but values one order of magnitude larger are obtained with CC2, ADC(2) and all tested XCFs in a TD-DFT context.
For the third ES of diazirine, a Rydberg transition of symmetry (see Table S3 in the SI), our TBE value is eV with D. Many methods exhibit significant state mixing, an effect particularly pronounced with the two range-separated hybrids that yield incorrect values ( D with CAM-B3LYP and D with B97X-D), although the computed vertical energies are within eV of the TBE value (see Table S6). For the Rydberg ES of cyclopropene (), one also observes significant state mixing at the TD-DFT level, although it is less dramatic than for diazirine.
The highest transition of formaldehyde considered here has a nature (TBE values: eV, , and D). Although the CC2 energy is reasonable ( eV), the CC2 oscillator strength is markedly too small (–) and the ES dipole has the incorrect direction (/ D). These large errors are likely related to significant state mixing with a slightly higher-lying ES at eV that is built up on the same molecular orbital pairs, which also shows a significant oscillator strength (–), but still an incorrectly oriented dipole (/ D).
For the corresponding ES in thioformaldehyde, it has been shown that the contributions of the quadruples in the CC framework are rather large. 38 Additionally, TD-B3LYP yields another close-lying ES that significantly mixes with the state, making the B3LYP value of artificially much smaller than the one computed with the four other XCFs (–), yet closer from the TBE (). The TD-B3LYP ( D) is totally off target (TBE of D), while all other XCFs do provide much better estimates. Selecting the other close-lying TD-B3LYP ES would also yield a very inaccurate value of ( D), so that state mixing yields incorrect dipoles for both ESs.
When comparing several gauges and formalisms (e.g., length vs velocity or EOM vs LR), the above-described difficulties are rather irrelevant; one still compares clearly equivalent states. Therefore, we have not discarded these challenging situations during such comparisons, nor when discussing VEEs. The issue is, of course, also irrelevant for . However, when assessing the relative performances of methods with respect to the TBEs for and , one is left with two reasonable choices: i) including these difficult states in the statistics on the basis that state mixing is inherent to the quality of the assessed method (the exact treatment would not suffer from this particular deficiency), a choice of course resulting in large average deviations, or ii) discarding these problematic ESs as there is no clear one-to-one correspondence between methods. This latter option comes at the cost of removing the most difficult cases for a specific method, hence making the results look better than they truly are. In the body of the text, we went for the second solution and we have discarded accordingly the following ESs in the performance evaluation of the various models for both and : i) the three ESs of dinitrogen, ii) the transition in diazirine, and iii) the of both formaldehyde and thioformaldehyde. Of course, one could also find other “borderline” cases as there is no definitive answer to state identification when benchmarking “low-order” methods. For the sake of completeness, we do provide in the SI the results obtained when selecting the alternative option, i.e., considering all states.
4.2 Vertical transition energies
The vertical transition energies obtained with various methods can be found in the SI for all ESs (Table S6). Obviously, VEEs do not constitute our focus here and we have already commented on similar yet larger sets previously, 27 so they have been included only for the sakes of completeness and reproducibility. A statistical analysis of the results concerning VEEs can be found in Table 1. For the wave function approaches, the trends are very similar to the previously noted ones with: i) errors steadily decreasing when increasing the CC excitation order; ii) highly similar behavior for ADC(2) and CC2; and iii) a tendency of ADC(3) to underestimate transition energies. 27, 129 For TD-DFT, the trends are again similar to these published elsewhere, 130 all tested XCFs providing underestimated VEEs, the two range-separated hybrids delivering the smallest errors, with SDE and RMSE rather similar to the one obtained with ADC(2) and CC2. We underline that the relatively poor performance of B3LYP is, at least, partially related to both the small size of the treated molecules and the consideration of many ESs of Rydberg character, the latter being described more faithfully with range-separated hybrids thanks to the introduction of a large percentage of exact exchange at large interelectronic distances. 131
| Method | MSE | MAE | SDE | RMSE | Max() | Max() |
|---|---|---|---|---|---|---|
| CC2 | 0.03 | 0.21 | 0.29 | 0.29 | 0.60 | -0.71 |
| CCSD | 0.10 | 0.11 | 0.09 | 0.14 | 0.33 | -0.04 |
| CC3 | 0.01 | 0.03 | 0.04 | 0.04 | 0.13 | -0.05 |
| CCSDT | 0.01 | 0.02 | 0.03 | 0.03 | 0.09 | -0.06 |
| ADC(2) | 0.02 | 0.21 | 0.29 | 0.29 | 0.58 | -0.75 |
| ADC(3) | -0.12 | 0.20 | 0.19 | 0.22 | 0.40 | -0.40 |
| B3LYP | -0.44 | 0.45 | 0.47 | 0.64 | 0.24 | -2.74 |
| PBE0 | -0.29 | 0.33 | 0.40 | 0.49 | 0.48 | -2.40 |
| M06-2X | -0.27 | 0.34 | 0.30 | 0.41 | 0.75 | -0.90 |
| CAM-B3LYP | -0.24 | 0.26 | 0.22 | 0.33 | 0.41 | -0.83 |
| B97X-D | -0.18 | 0.22 | 0.22 | 0.29 | 0.54 | -0.74 |
4.3 Ground-state dipoles
For , the most extensive DFT benchmark to date is the one of Hait and Head-Gordon, 36 whereas the investigation of Hodecker et al. already provides a very valuable assessment of the differences between OU, OR, and ISR at several levels of theory. 59 Our goals here are therefore: i) to briefly discuss the quality of the GS dipoles so that straightforward comparisons with the corresponding ES analysis below can be done; ii) to assess both CC3 and CCSDT against FCI, which has not be done with a reasonable basis set to date; iii) to provide statistically relevant differences between OU, OR, and ISR. The raw data can be found in Table S7–S9 in the SI.
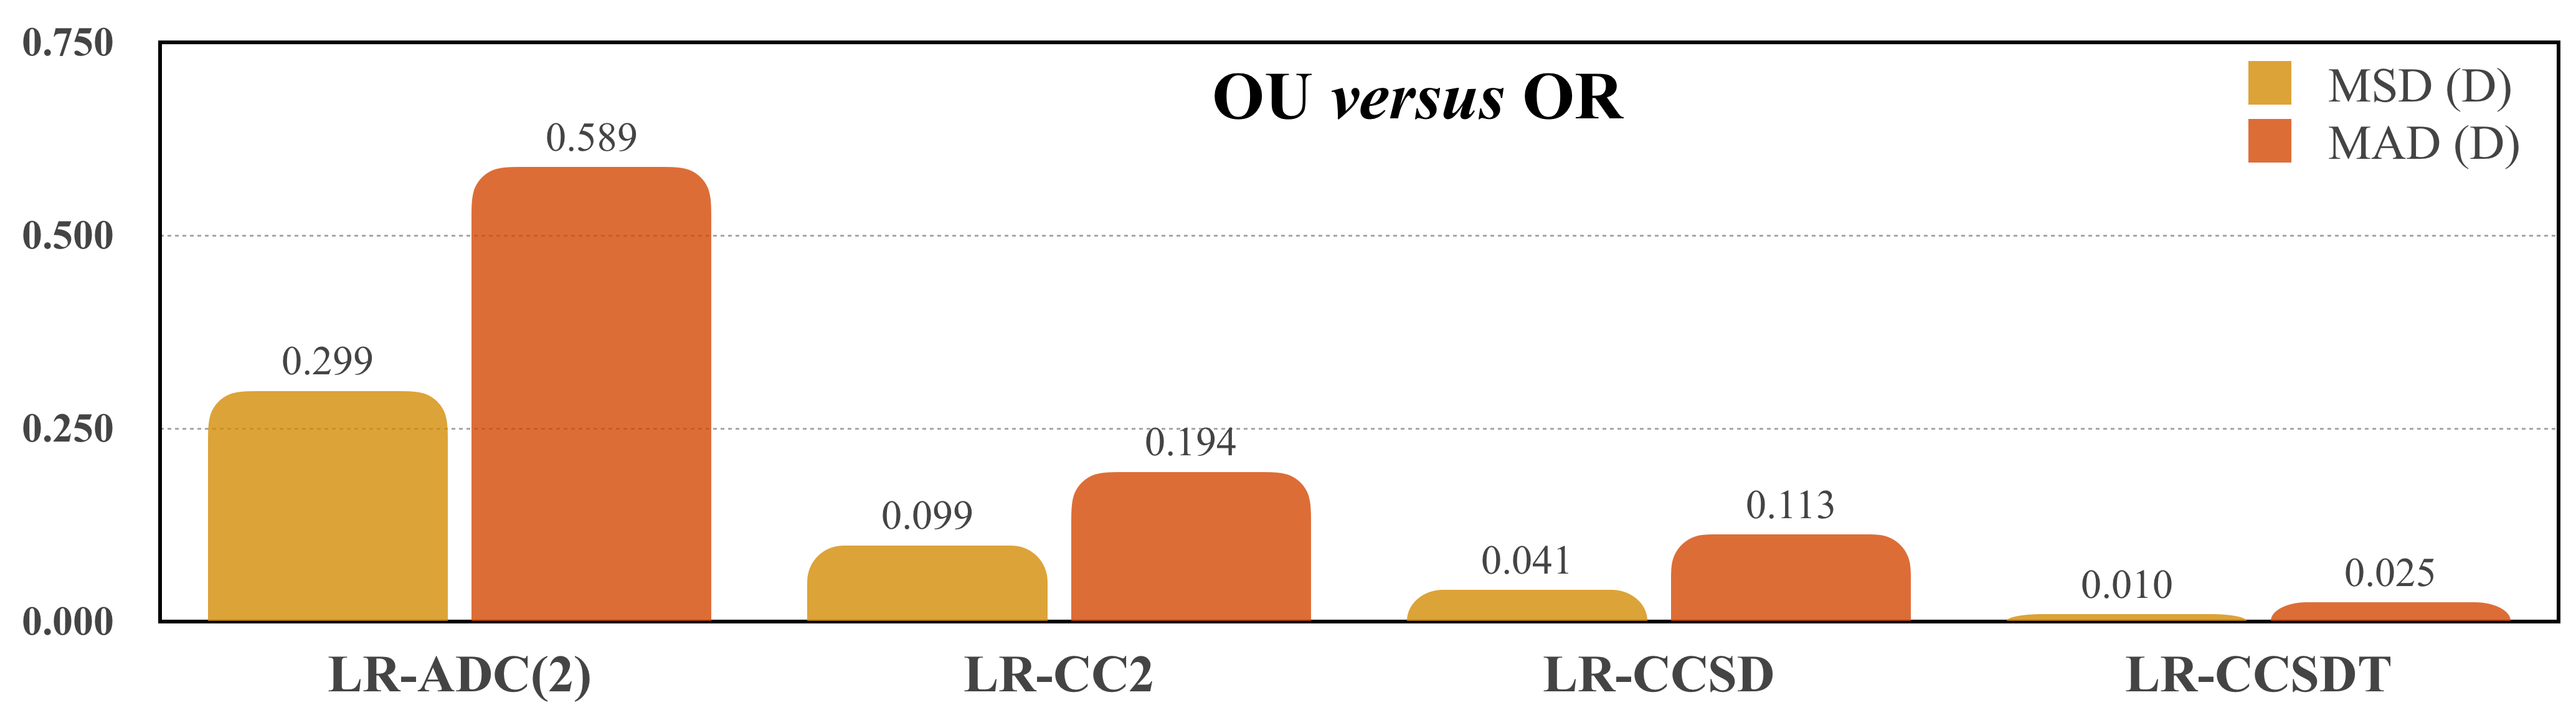
For the 16 non-centrosymmetric molecules of Figure 1, the mean absolute deviations (MADs) obtained when using OU instead of OR are 0.007, 0.004, 0.025, 0.042, and 0.167 D for CCSDT, CC3, CCSD, CC2, and MP2, respectively. For CCSDTQ, a subset of six compounds could be tested (Table S9) and the differences between OU and OR are found to be always insignificant with a MAD of 0.001 D. Consistently with a previous work, 59 the ISR-MP2 approach is roughly in-between the OU and OR, with a MAD of 0.090 D as compared to OR. As expected, the impact of neglecting orbital relaxation is sizable with MP2, but rapidly decreases when the quality of the wave function is improved to become essentially negligible for all methods incorporating iterative triples. Interestingly, it turns out that CC3 is less sensitive to orbital relaxation than CCSDT, so that the trend recently observed for the ground-state dipole of hydrogen fluoride 59 seems to be valid beyond that specific diatomic molecule.
Statistical quantities regarding ground-state dipole’s quality (with respect to the present TBEs) for various methods are reported in Table 2.
| Method | MSE | MAE | SDE | RMSE | Max() | Max() | |
|---|---|---|---|---|---|---|---|
| MP2 | OU | 0.15 | 0.16 | 0.15 | 0.21 | 0.45 | -0.10 |
| ISR | 0.10 | 0.14 | 0.17 | 0.19 | 0.50 | -0.22 | |
| OR | 0.04 | 0.08 | 0.11 | 0.11 | 0.23 | -0.16 | |
| CC2 | OU | 0.03 | 0.12 | 0.17 | 0.17 | 0.31 | -0.33 |
| OR | 0.04 | 0.09 | 0.12 | 0.12 | 0.23 | -0.22 | |
| CCSD | OU | 0.02 | 0.02 | 0.02 | 0.03 | 0.07 | -0.03 |
| OR | 0.02 | 0.04 | 0.04 | 0.05 | 0.09 | -0.06 | |
| CC3 | OU | 0.00 | 0.01 | 0.01 | 0.01 | 0.02 | -0.02 |
| OR | 0.00 | 0.01 | 0.01 | 0.01 | 0.02 | -0.02 | |
| CCSDT | OU | 0.00 | 0.00 | 0.01 | 0.01 | 0.01 | -0.01 |
| OR | 0.00 | 0.01 | 0.01 | 0.01 | 0.01 | -0.01 | |
| B3LYP | 0.06 | 0.07 | 0.06 | 0.08 | 0.19 | -0.05 | |
| PBE0 | 0.07 | 0.07 | 0.06 | 0.09 | 0.21 | -0.03 | |
| M06-2X | 0.08 | 0.09 | 0.08 | 0.12 | 0.29 | -0.09 | |
| CAM-B3LYP | 0.10 | 0.11 | 0.07 | 0.12 | 0.24 | -0.08 | |
| B97X-D | 0.09 | 0.09 | 0.07 | 0.11 | 0.27 | -0.04 |
Strikingly, all MSEs are positive (or null) indicating that all tested methods tend to overestimate the FCI values. For both MP2 and CC2, turning on the orbital relaxation improves the accuracy of the GS dipoles, with typical deviations around 0.1 D only at the OR level. With CCSD, one observes the opposite trend, i.e., OU is on average more accurate than OR, an effect that we attribute to error compensation. Finally, for both CC3 and CCSDT, all deviations are negligible, evidencing that both methods estimate with chemical accuracy. Turning now our attention to DFT, one first notes that all five XCFs yield errors of the same order of magnitude as OR-MP2 and OR-CC2, with a slightly improved consistency (smaller SDE). For MP2, the same conclusion can be easily deduced from the data of Hait and Head-Gordon. 36 These trends strengthen the claim that benchmarking DFT using CC2 (or MP2) reference values is a risky strategy: the latter does not yield smaller errors, at least for the compact compounds treated herein. Amongst the tested XCFs, B3LYP and PBE0 emerge as the most accurate, but the variations compared to the three other XCFs are limited and likely not significant
4.4 Oscillator strengths
The computed values of the oscillator strength for all tested approaches can be found in Tables S10–S12 in the SI along with the corresponding TBEs, and we discuss below statistical trends only.
4.4.1 Impact of the gauge
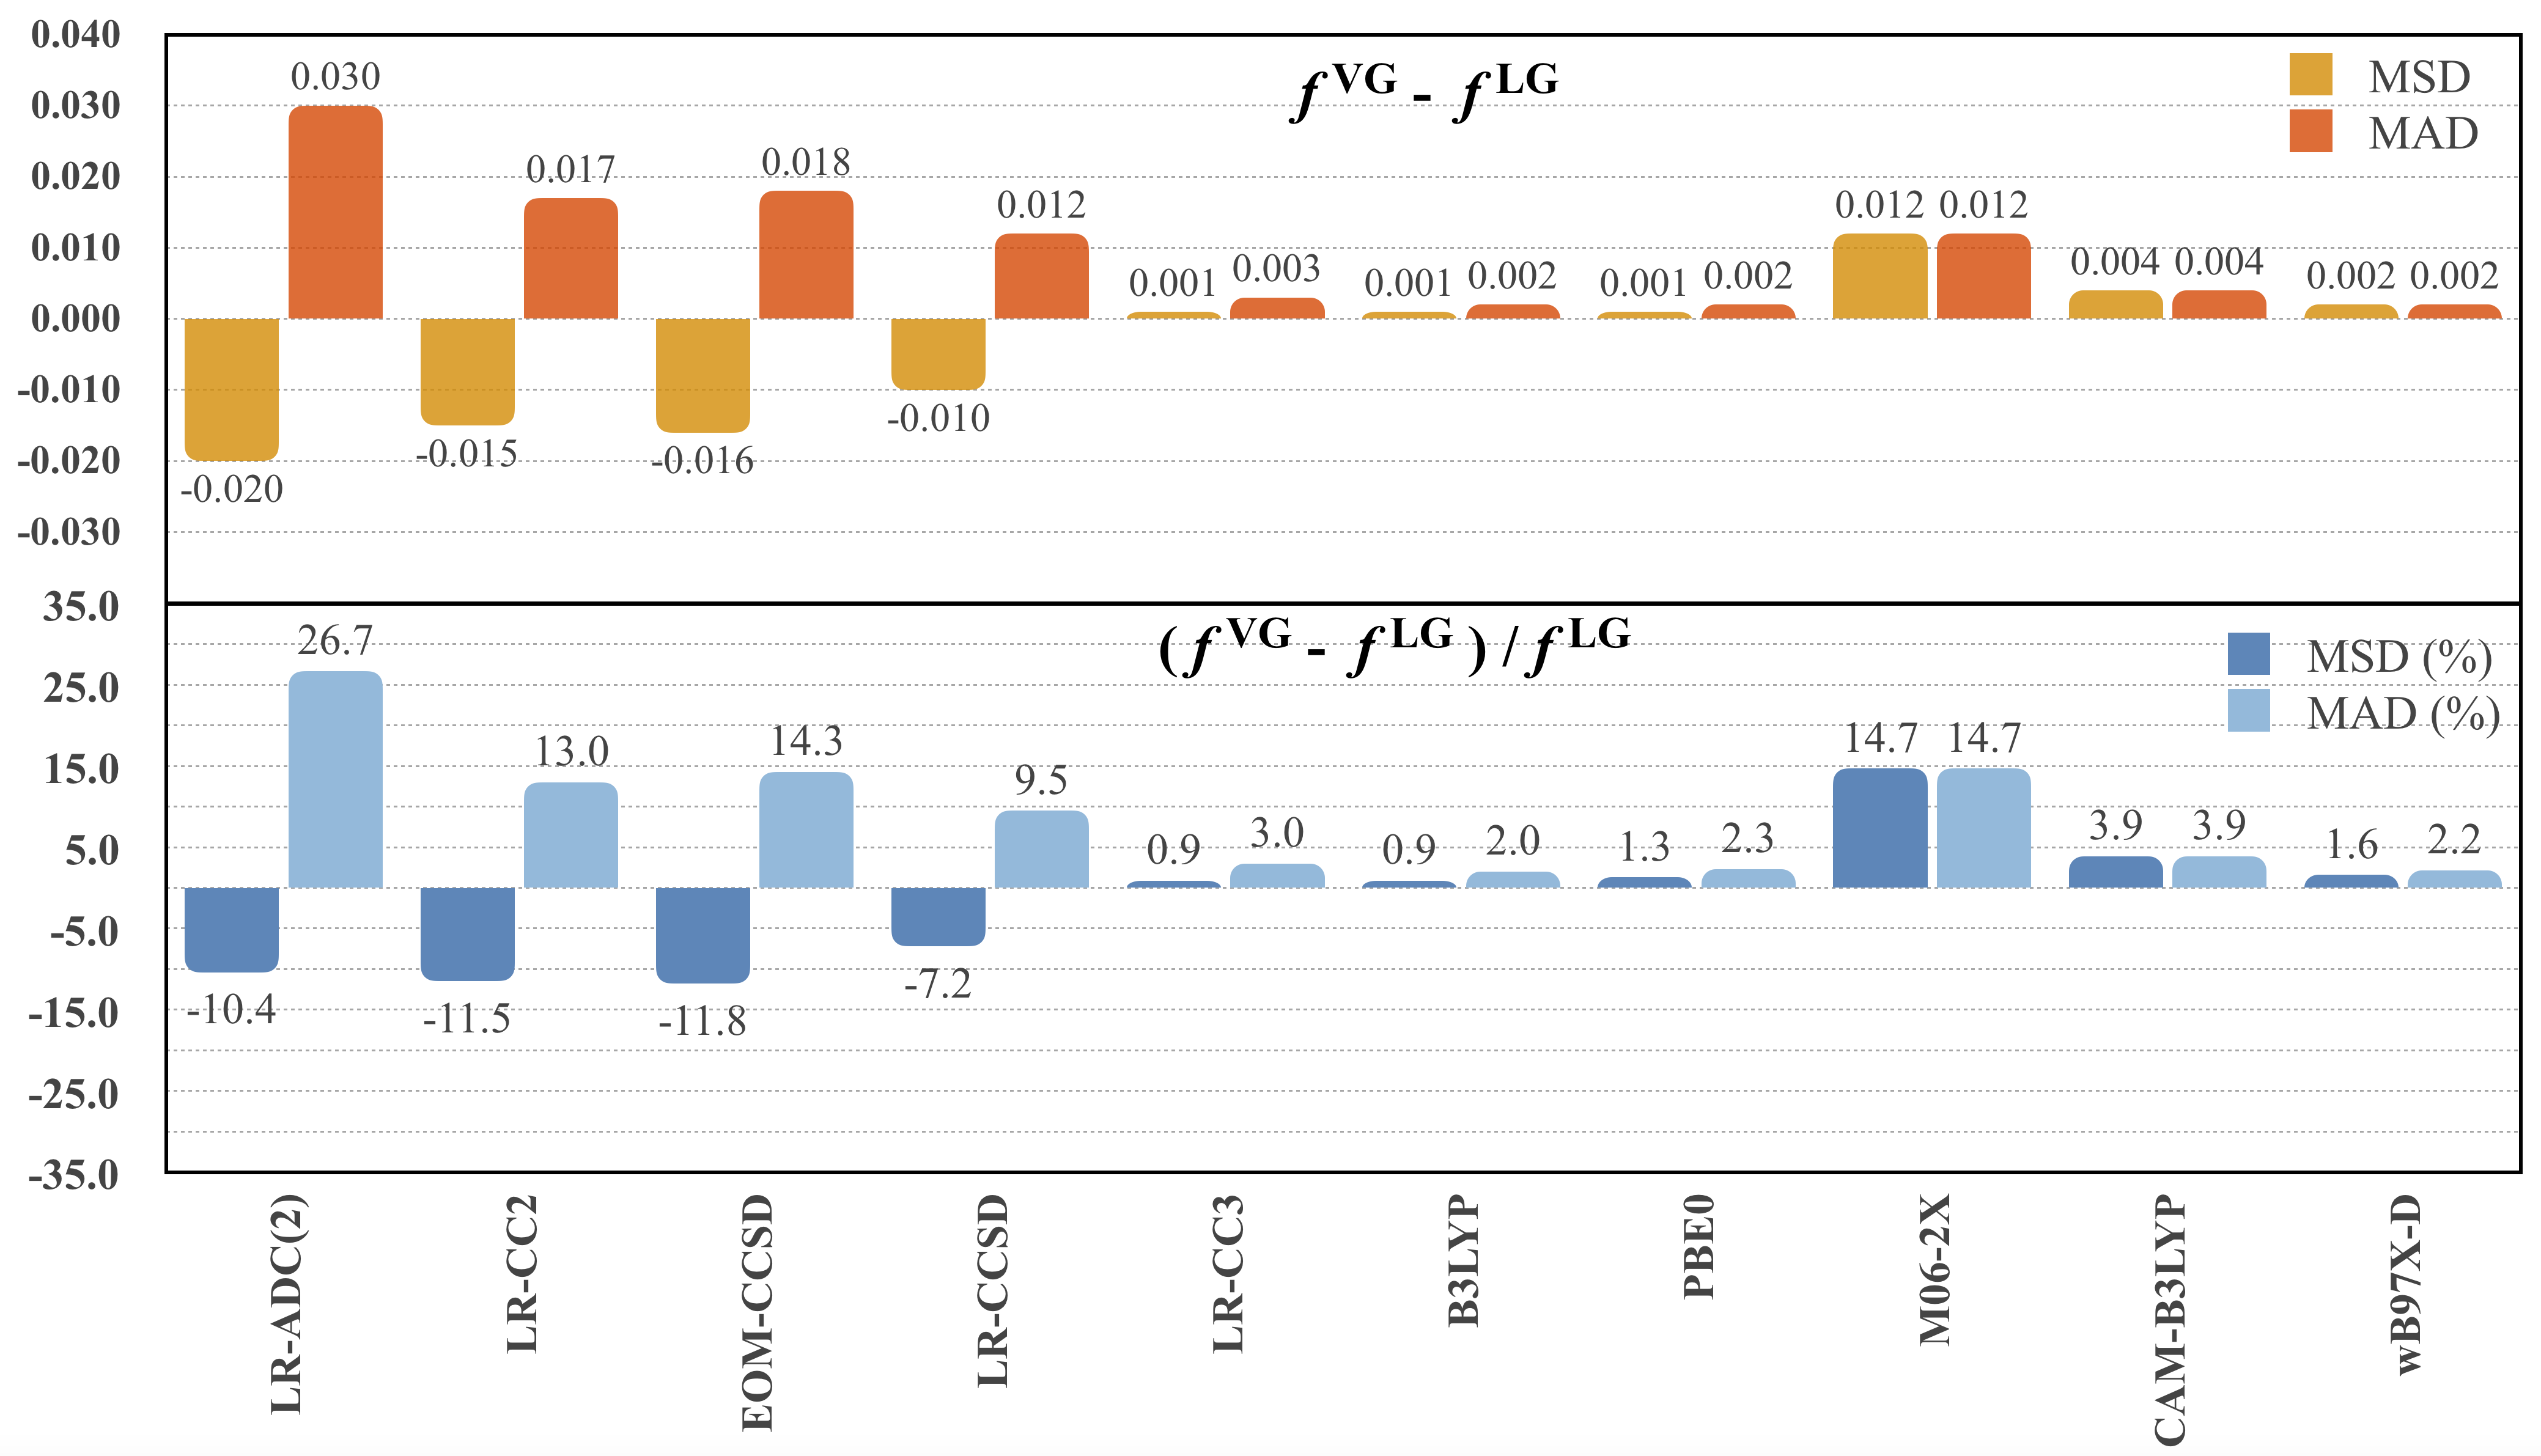
An aspect that is hardly discussed in practical applications of ES theories to “real-life” compounds is the gauge effect on the magnitude of the oscillator strengths, although comparisons between theoretical values and experimental intensities typically guide the identification of the relevant transitions. In Figure 2, we provide an overview of the variations of computed in the length () and velocity () gauges for five wave function methods as well as five XCFs within TD-DFT. The additional figure comparing length and mixed () gauges can be found in Figure S1 in the SI. As expected, the mixed gauge essentially delivers values bracketed by those obtained with the length and velocity gauges. Figure 2 shows the largest possible differences between the three gauges, but the methodological trends are conserved in other gauge comparisons, e.g., .
With the tested wave function approaches, going from to induces a decrease of the estimated oscillator strengths in the vast majority of the cases, whereas the opposite effect is found within TD-DFT. Following the expected trend, the more accurate the wave function is, the smaller the impact of the gauge is, hence the negligible gauge variance observed for CC3 with a MAD of 0.003 (i.e., 3%) between the length and velocity gauges. The gauge effects are more significant for both CCSD and CC2, and even quite large with ADC(2) with a MAD one order of magnitude larger than CC3 (0.030 or 27%). One also notices from Figure 2 that the values determined with the EOM formalism are more affected by the selected gauge than those computed computed within the LR framework. Turning our attention to TD-DFT, the differences between and are generally small with all XCFs (especially with B3LYP and PBE0) at the notable exception of M06-2X. With the latter functional, variations of ca. 15% are observed between the two gauges, which is four times larger than with the second most gauge-sensitive XCF (CAM-B3LYP). Nevertheless such effect remains of the same order of magnitude as the one noticed with EOM-CCSD. As mentioned in the Introduction section of the present paper, the weak gauge sensitivity of TD-DFT might be due to the fulfillment of the Thomas-Reiche-Kuhn sum rule.
As a final note, in Table S18 in the SI, one can find a basis set study of gauge effects for water performed at various levels of theory. Whilst one notes a small decrease of the gauge impact when enlarging the basis set, the methodological trends are preserved in going from aug-cc-pVTZ to aug-cc-pV5Z, with significant gauge effects pertaining for both ADC(2) and M06-2X even with the latter basis set.
4.4.2 Response vs expectation formalisms
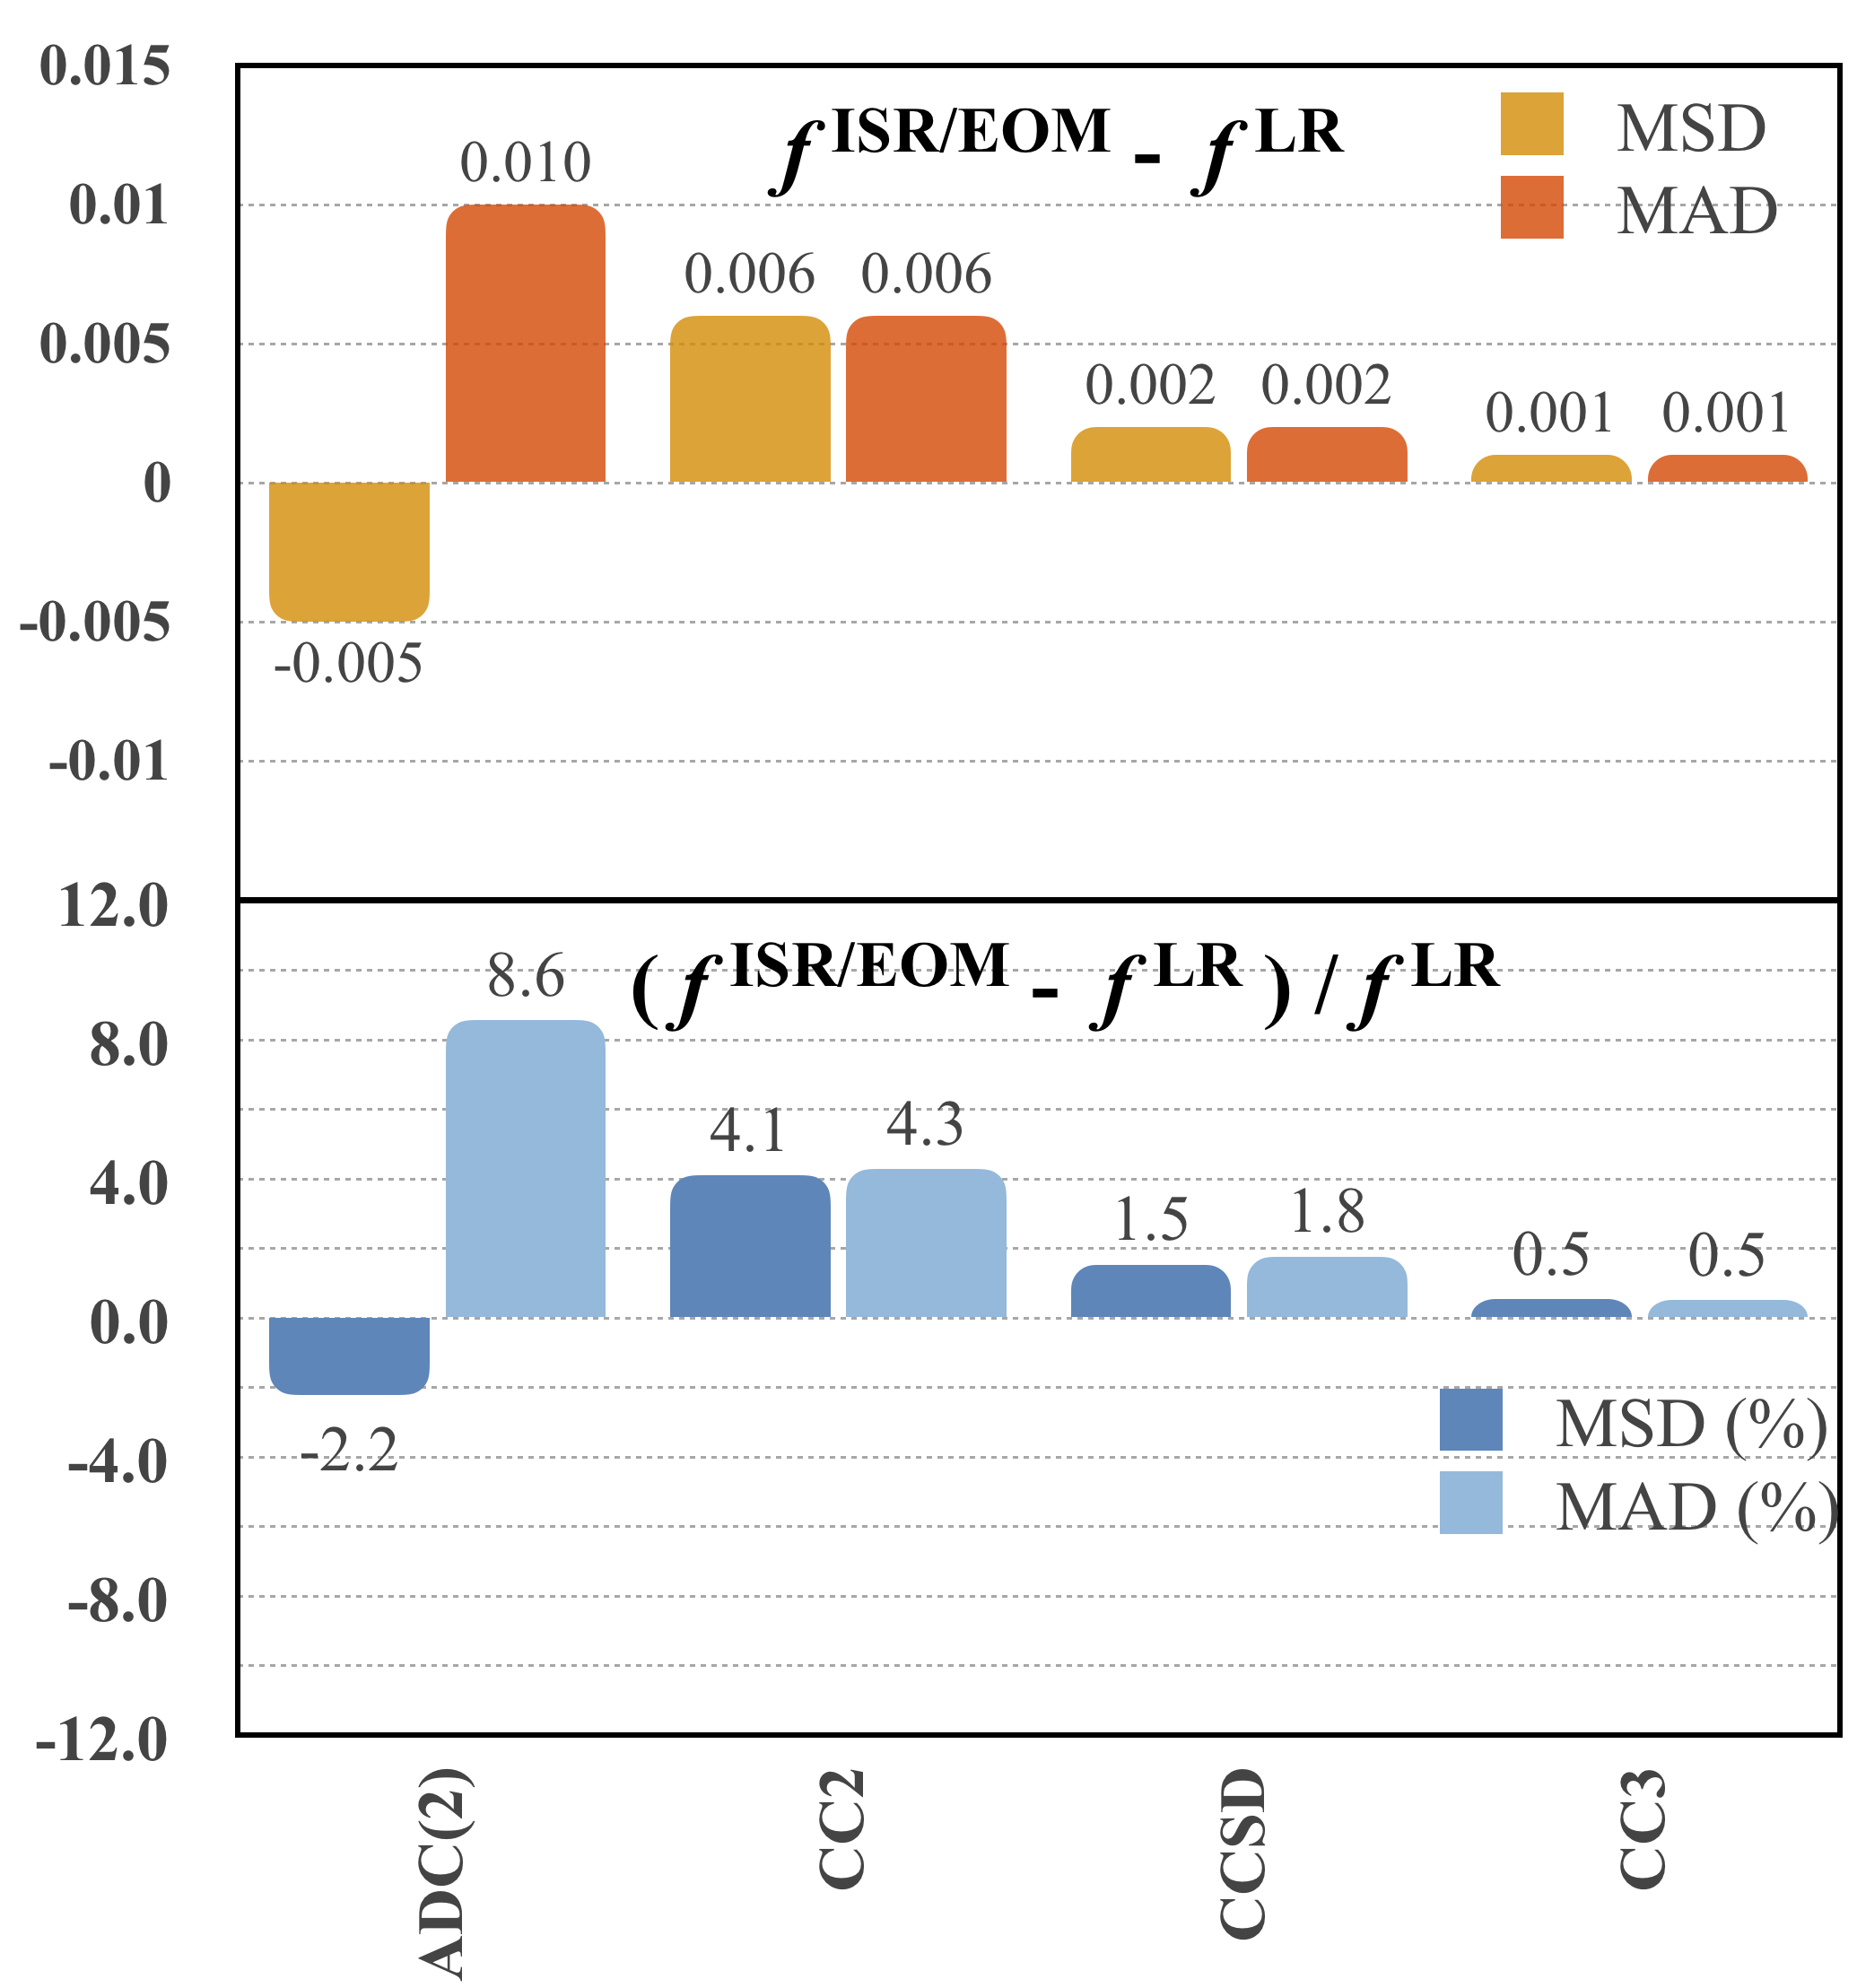
Figure 3 presents the MSD and MAD for oscillator strengths computed with the ISR and LR formalisms for ADC(2) and the EOM and LR formalisms for CC2, CCSD, and CC3. Again, one notices that the deviations between the various formalisms are magnified when one considers second-order computational methods. For the CC approaches, EOM generally yields larger oscillator strengths than LR, but as noted previously, 61, 62 these effects are relatively mild with changes of 4% for CC2 and 2% for CCSD, the changes becoming essentially zero with CC3. Of course, it is likely that the differences between the EOM and LR oscillator strengths would be exacerbated for larger compounds. 61 For ADC(2), the Q-CHEM (ISR) and TURBOMOLE (LR) implementations yield distinct estimates, the ISR scheme providing smaller values, with a MAD of 9% between the two schemes. Interestingly, at the ADC(2) level, the impact of the selected formalism is about a third of the one of the gauge as one can see by comparing Figures 2 and 3. Test calculations (Table S19) hint that the effects on these formalisms are similar with the triple- and quadruple- basis sets.
4.4.3 Statistical performances
Let us now turn towards comparisons with respect to our TBEs for all tested models, formalisms, and gauges. The complete statistical results can be found in Table 3 whereas Figure 4 provides a graphical view of the average relative errors for various methods. The statistical data corresponding to Table 3 are gathered in Table S13 of the SI in which none of the state mixing ES has been dropped out of the statistics (see above).
| Method | Gauge | MSE | MAE | SDE | RMSE | Max() | Max() | |
|---|---|---|---|---|---|---|---|---|
| ADC(2) | ISR | LG | 0.004 | 0.014 | 0.022 | 0.026 | 0.047 | -0.084 |
| LR | LG | 0.009 | 0.020 | 0.030 | 0.031 | 0.098 | -0.089 | |
| VG | -0.010 | 0.023 | 0.032 | 0.041 | 0.043 | -0.118 | ||
| MG | -0.002 | 0.014 | 0.021 | 0.035 | 0.044 | -0.085 | ||
| ADC(3/2) | ISR | LG | 0.004 | 0.008 | 0.013 | 0.014 | 0.052 | -0.028 |
| CC2 | EOM | LG | 0.008 | 0.014 | 0.023 | 0.036 | 0.084 | -0.078 |
| LR | LG | 0.003 | 0.010 | 0.018 | 0.029 | 0.048 | -0.082 | |
| VG | -0.011 | 0.014 | 0.020 | 0.026 | 0.014 | -0.091 | ||
| MG | -0.004 | 0.009 | 0.016 | 0.024 | 0.013 | -0.086 | ||
| CCSD | EOM | LG | 0.004 | 0.005 | 0.008 | 0.018 | 0.028 | -0.021 |
| VG | -0.010 | 0.013 | 0.019 | 0.022 | 0.007 | -0.070 | ||
| MG | -0.004 | 0.006 | 0.009 | 0.011 | 0.007 | -0.029 | ||
| LR | LG | 0.002 | 0.004 | 0.007 | 0.015 | 0.019 | -0.023 | |
| VG | -0.007 | 0.009 | 0.014 | 0.016 | 0.008 | -0.051 | ||
| MG | -0.002 | 0.005 | 0.007 | 0.010 | 0.008 | -0.028 | ||
| CC3 | EOM | LG | 0.001 | 0.002 | 0.002 | 0.010 | 0.011 | -0.002 |
| LR | LG | 0.000 | 0.001 | 0.002 | 0.008 | 0.010 | -0.002 | |
| VG | 0.001 | 0.004 | 0.005 | 0.009 | 0.020 | -0.011 | ||
| MG | 0.001 | 0.002 | 0.003 | 0.008 | 0.011 | -0.005 | ||
| CCSDT | LR | LG | 0.000 | 0.001 | 0.001 | 0.005 | 0.003 | -0.005 |
| B3LYP | LG | -0.015 | 0.017 | 0.024 | 0.029 | 0.007 | -0.110 | |
| VG | -0.014 | 0.017 | 0.024 | 0.029 | 0.015 | -0.108 | ||
| MG | -0.014 | 0.017 | 0.024 | 0.029 | 0.009 | -0.109 | ||
| PBE0 | LG | -0.013 | 0.015 | 0.021 | 0.027 | 0.006 | -0.097 | |
| VG | -0.012 | 0.015 | 0.021 | 0.027 | 0.017 | -0.094 | ||
| MG | -0.012 | 0.014 | 0.021 | 0.027 | 0.011 | -0.095 | ||
| M06-2X | LG | -0.014 | 0.014 | 0.013 | 0.022 | 0.000 | -0.047 | |
| VG | -0.002 | 0.009 | 0.013 | 0.020 | 0.045 | -0.029 | ||
| MG | -0.008 | 0.008 | 0.010 | 0.018 | 0.002 | -0.034 | ||
| CAM-B3LYP | LG | -0.006 | 0.007 | 0.009 | 0.017 | 0.004 | -0.032 | |
| VG | -0.006 | 0.008 | 0.010 | 0.017 | 0.013 | -0.032 | ||
| MG | -0.006 | 0.007 | 0.010 | 0.017 | 0.007 | -0.032 | ||
| B97X-D | LG | -0.006 | 0.011 | 0.016 | 0.021 | 0.015 | -0.056 | |
| VG | -0.005 | 0.011 | 0.016 | 0.022 | 0.027 | -0.050 | ||
| MG | -0.006 | 0.011 | 0.016 | 0.022 | 0.021 | -0.053 |
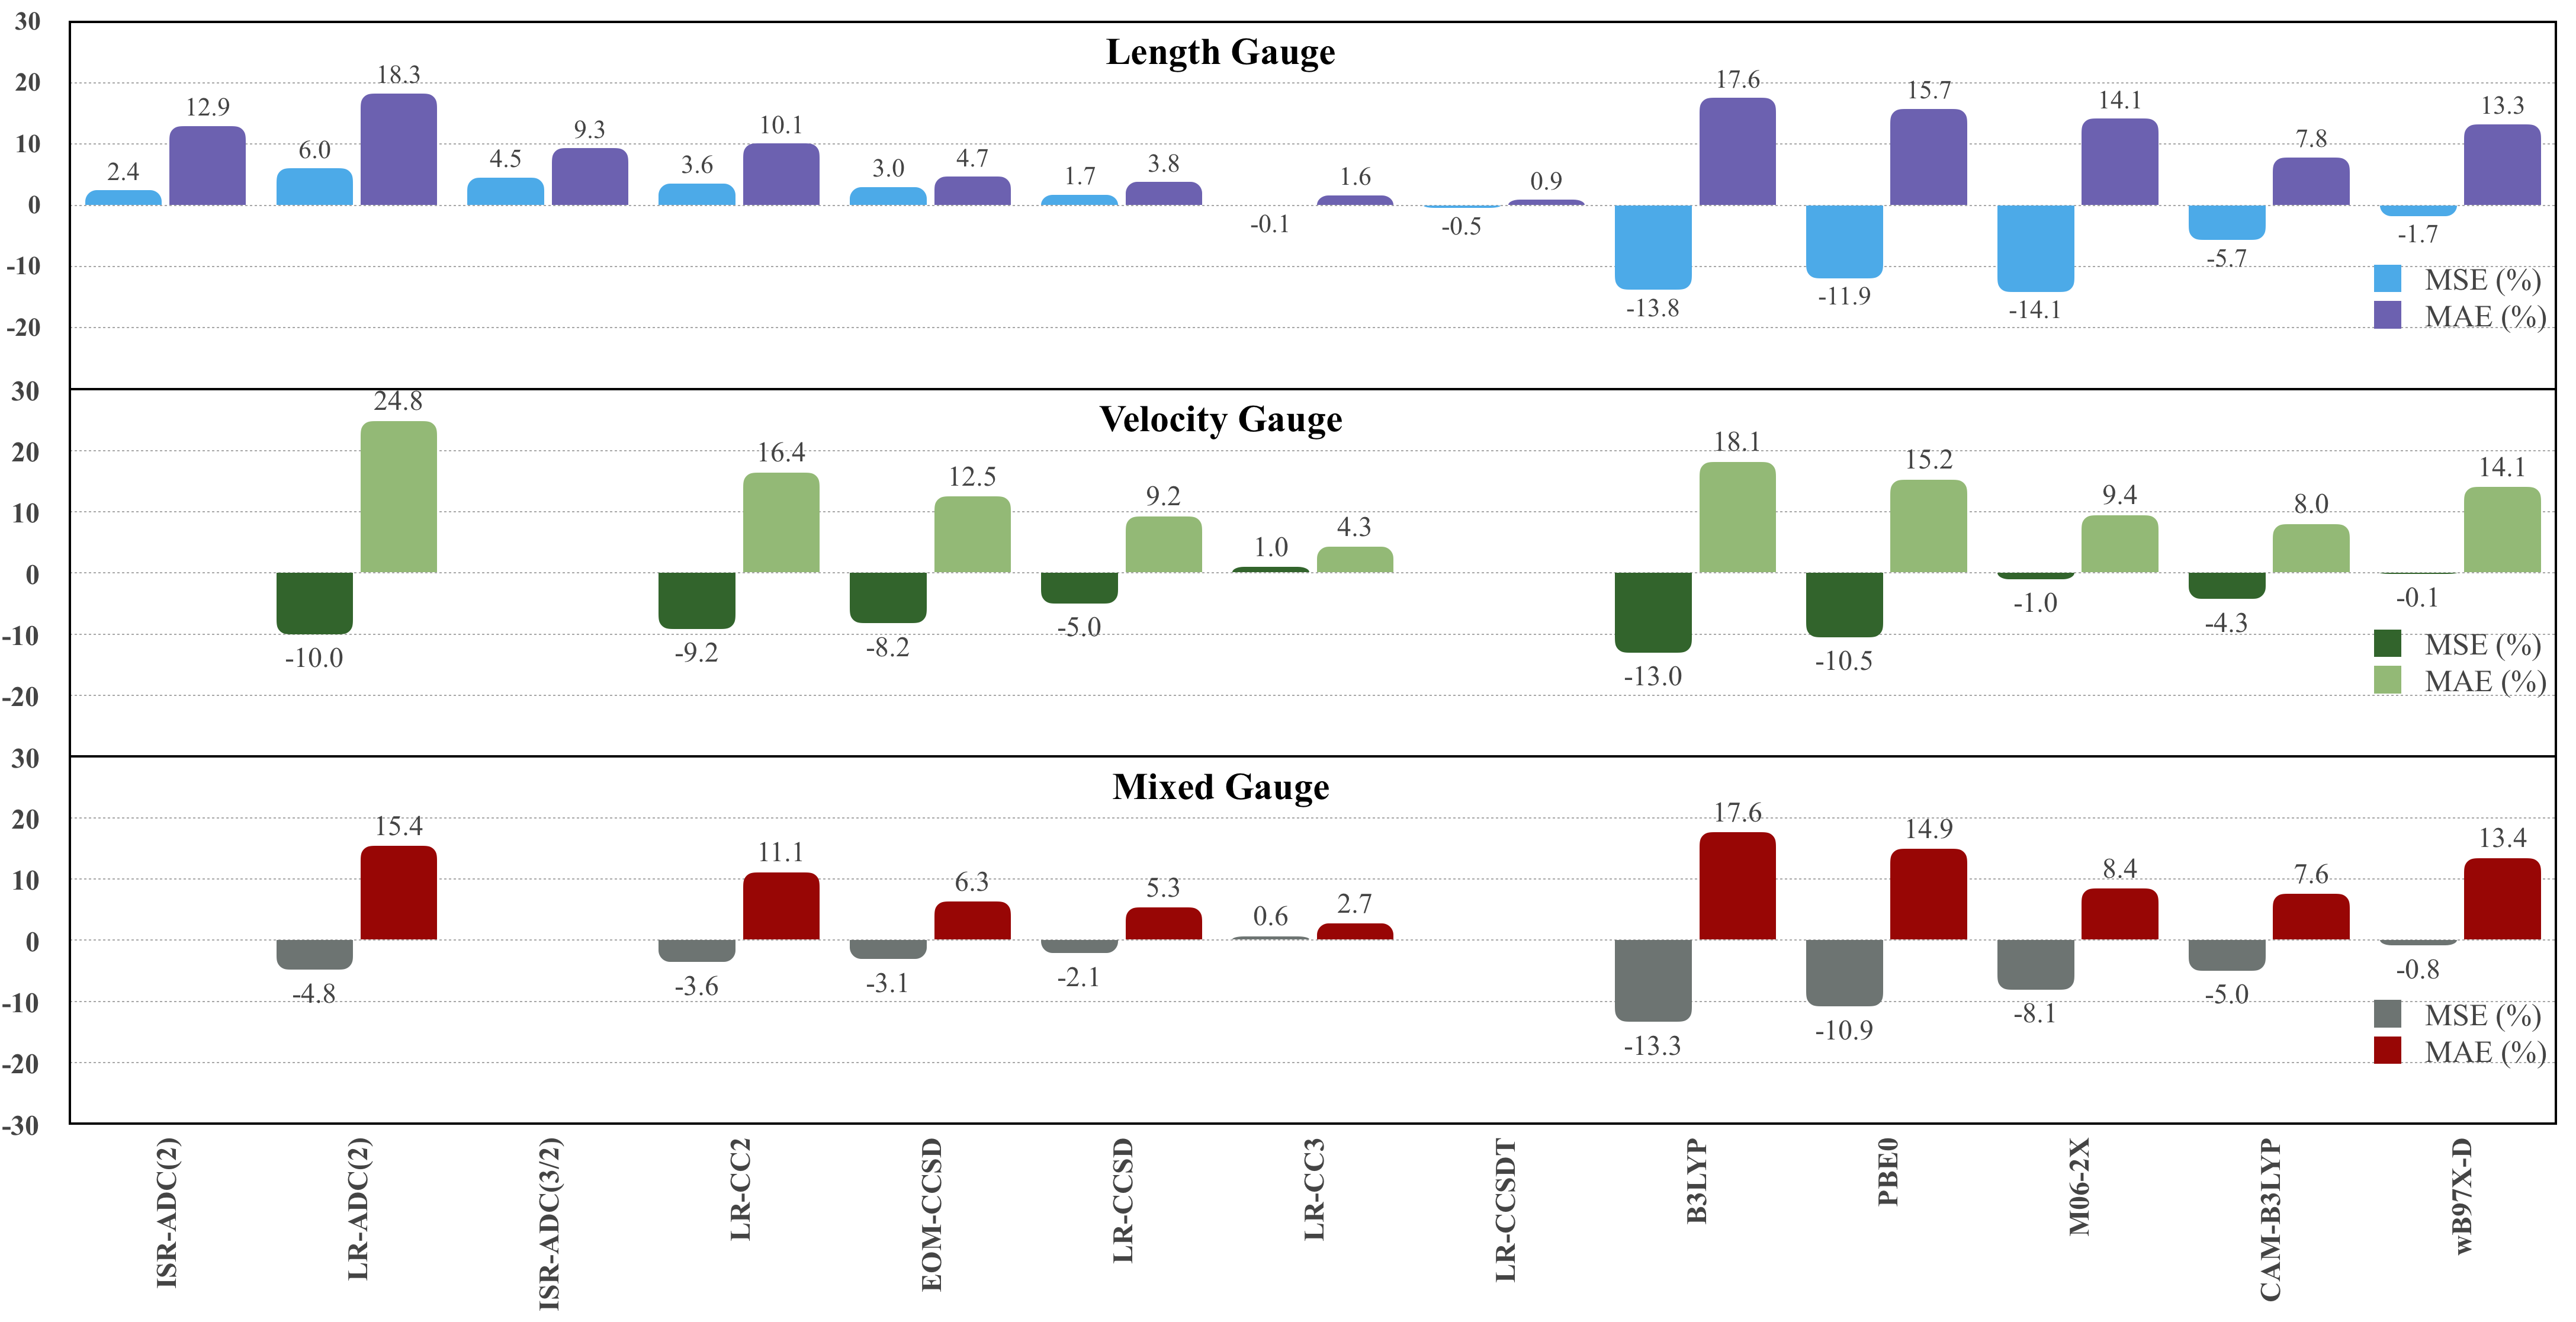
A first general conclusion is that all methods do deliver rather consistent estimates (small SDEs) with reasonably small absolute and relative errors. Indeed, the largest MAE reported in Figure 4 is smaller than 25%. In the commonly-selected length gauge, the MSE obtained with all tested wave function approaches are positive, whereas all investigated TD-DFT models tend to undershoot . Remaining in the length gauge, the ISR representation of ADC(2) outperforms the LR formulation, and ADC(3/2) provides a significant improvement over ADC(2), which contrasts with the vertical transition energies. We therefore confirm the earlier conclusion that ADC(3/2) is superior to ADC(2) for . 16 In the CC family, one notes that both CCSDT and CC3 provide extremely small deviations with respect to the TBEs, and, consistently with the analysis made in the previous paragraph, selecting EOM or LR has no significant effect for CC3. Concerning CCSD, the LR representation has a slight edge, an effect that is somewhat enlarged in CC2. These conclusions are consistent with an earlier work that reported CC2 errors significantly larger than their CCSD counterparts, although remaining “qualitatively correct”. 62 Amongst the five tested XCFs, CAM-B3LYP is clearly the best performer in the length gauge with a MAE of 8% only, whereas all other XCFs yield MAEs in the 13–17% range (see Figure 4). Again, it is clear that CAM-B3YP outperforms both CC2 and ADC(2) for each statistical quantity listed in Table 3. In the same vein, the PBE0 errors are quite comparable to those obtained with EOM-CC2. As we noted above for , one should then be cautious when using a second-order approach to evaluate the performance of TD-DFT. Let us now turn towards the velocity gauge. The accuracy of the wave function results seem to systematically degrade when turning to this gauge with negative MSEs and larger MAEs than with the length gauge, whereas the TD-DFT statistics are mostly unaffected, except for a significant improvement of M06-2X. The mixed gauge results are more contrasted, with an improvement for ADC(2) and M06-2X, no major changes for the other XCFs (as compared to ), and slight worsening of the errors associated with the CC methods.
4.5 Excited-state dipoles
Excited-state dipole moments computed with various methods are listed in Tables S14 and S15 in the SI. At this stage, we recall that we have considered in our statistical signed analyses the dipole norm, so that the reported MSE are indicative of amplitudes, not directions. Moreover, we have removed six ESs strongly influenced by state mixing Subsec. 4.5.3.
4.5.1 On the impact of orbital relaxation in LR
Let us first discuss the impact of various relaxation schemes on the computed . First, from Table S21 in the SI, it can be concluded that the orbital relaxation effects depend (much) more on the considered excited state and method than on the selected atomic basis set. A graphical analysis is given in Figure 5. When neglecting orbital relaxation in CC theory, one notices a slight overestimation of , though both negative and positive deviations are observed when investigating individual cases. Of course, and as expected, the difference between OR and OU decreases when increasing the CC order: it is significant for CC2 (0.19 D), smaller for CCSD (0.11 D), and negligible for CCSDT (0.03 D). For our set, using LR(OU)-ADC(2) yields a MAD of 0.59 D as compared to LR(OR)-ADC(2). One noteworthy point is that the statistical OR/OU discrepancies are much larger for than for , irrespective of the selected wave function model. Indeed, for the GS dipoles, we found MADs of 0.01 D for CCSDT, 0.03 D for CCSD, 0.04 D for CC2 and 0.17 D for MP2 (vide supra) between OU and OR, all values being roughly one-third of their ES analogs displayed in Figure 5. In other words, the ES dipoles are approximatively three times more sensitive to orbital relaxation than the GS dipoles.
4.5.2 Response vs expectation formalisms
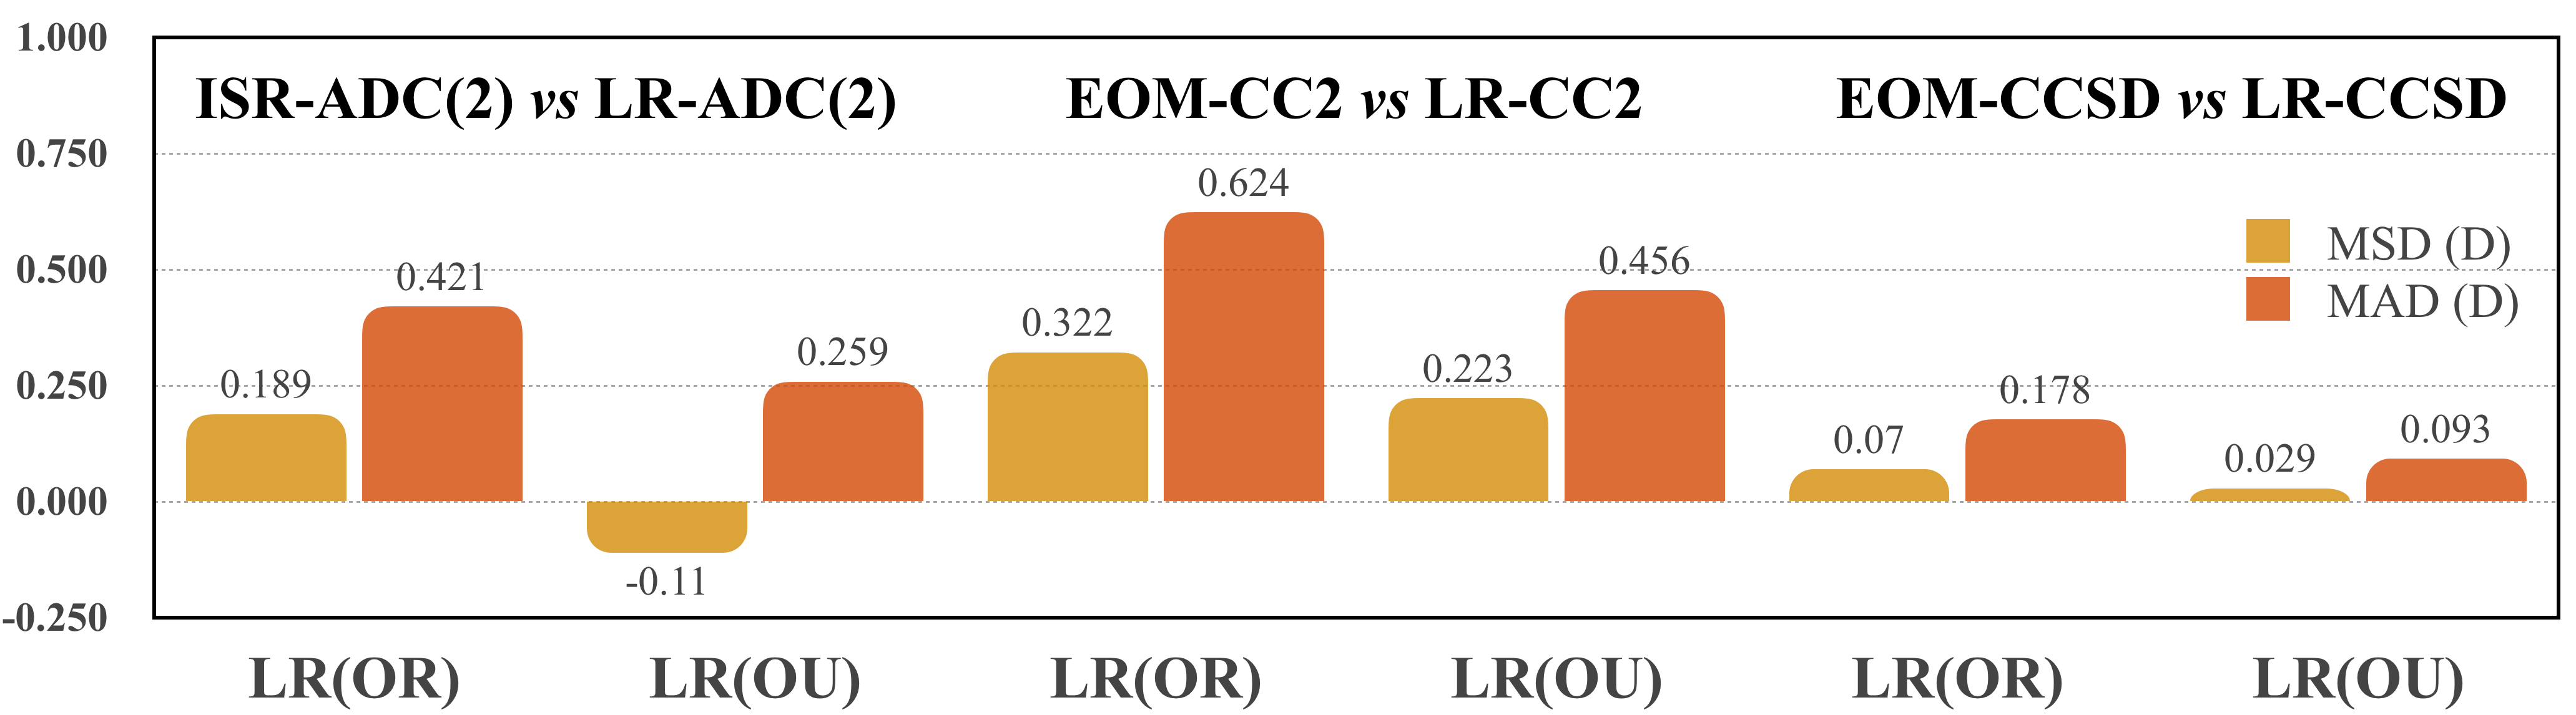
Let us now compare the ES dipoles obtained with the EOM and LR formalisms for both CC2 and CCSD. The raw data can be found in Table S14 in the SI, whereas a statistical analysis can be found in Figure 6. We found that, typically, the EOM-CCSD dipoles are more similar to the LR(OU)-CCSD values (MAD of 0.09 D) than the LR(OR)-CCSD data (MAD of 0.18 D), the magnitude of the ES dipoles, , tending to be slightly larger with the EOM formalism. If one turns to CC2, one observes exactly the same trends, but the deviations between EOM-CC2 and LR-CC2 are much larger with MAD of 0.46 D (OU) and 0.62 D (OR). Turning our attention to ADC(2), we notice that ISR, while providing dipole moments in between OU and OR, yields ES dipole magnitude typically closer to the former. The underlying reasons for this last outcome have been unveiled elsewhere. 59 The absolute deviation between ISR-ADC(2) and their LR counterparts averages to 0.26 D (OU) and 0.42 D (OR).
4.5.3 Statistical performances
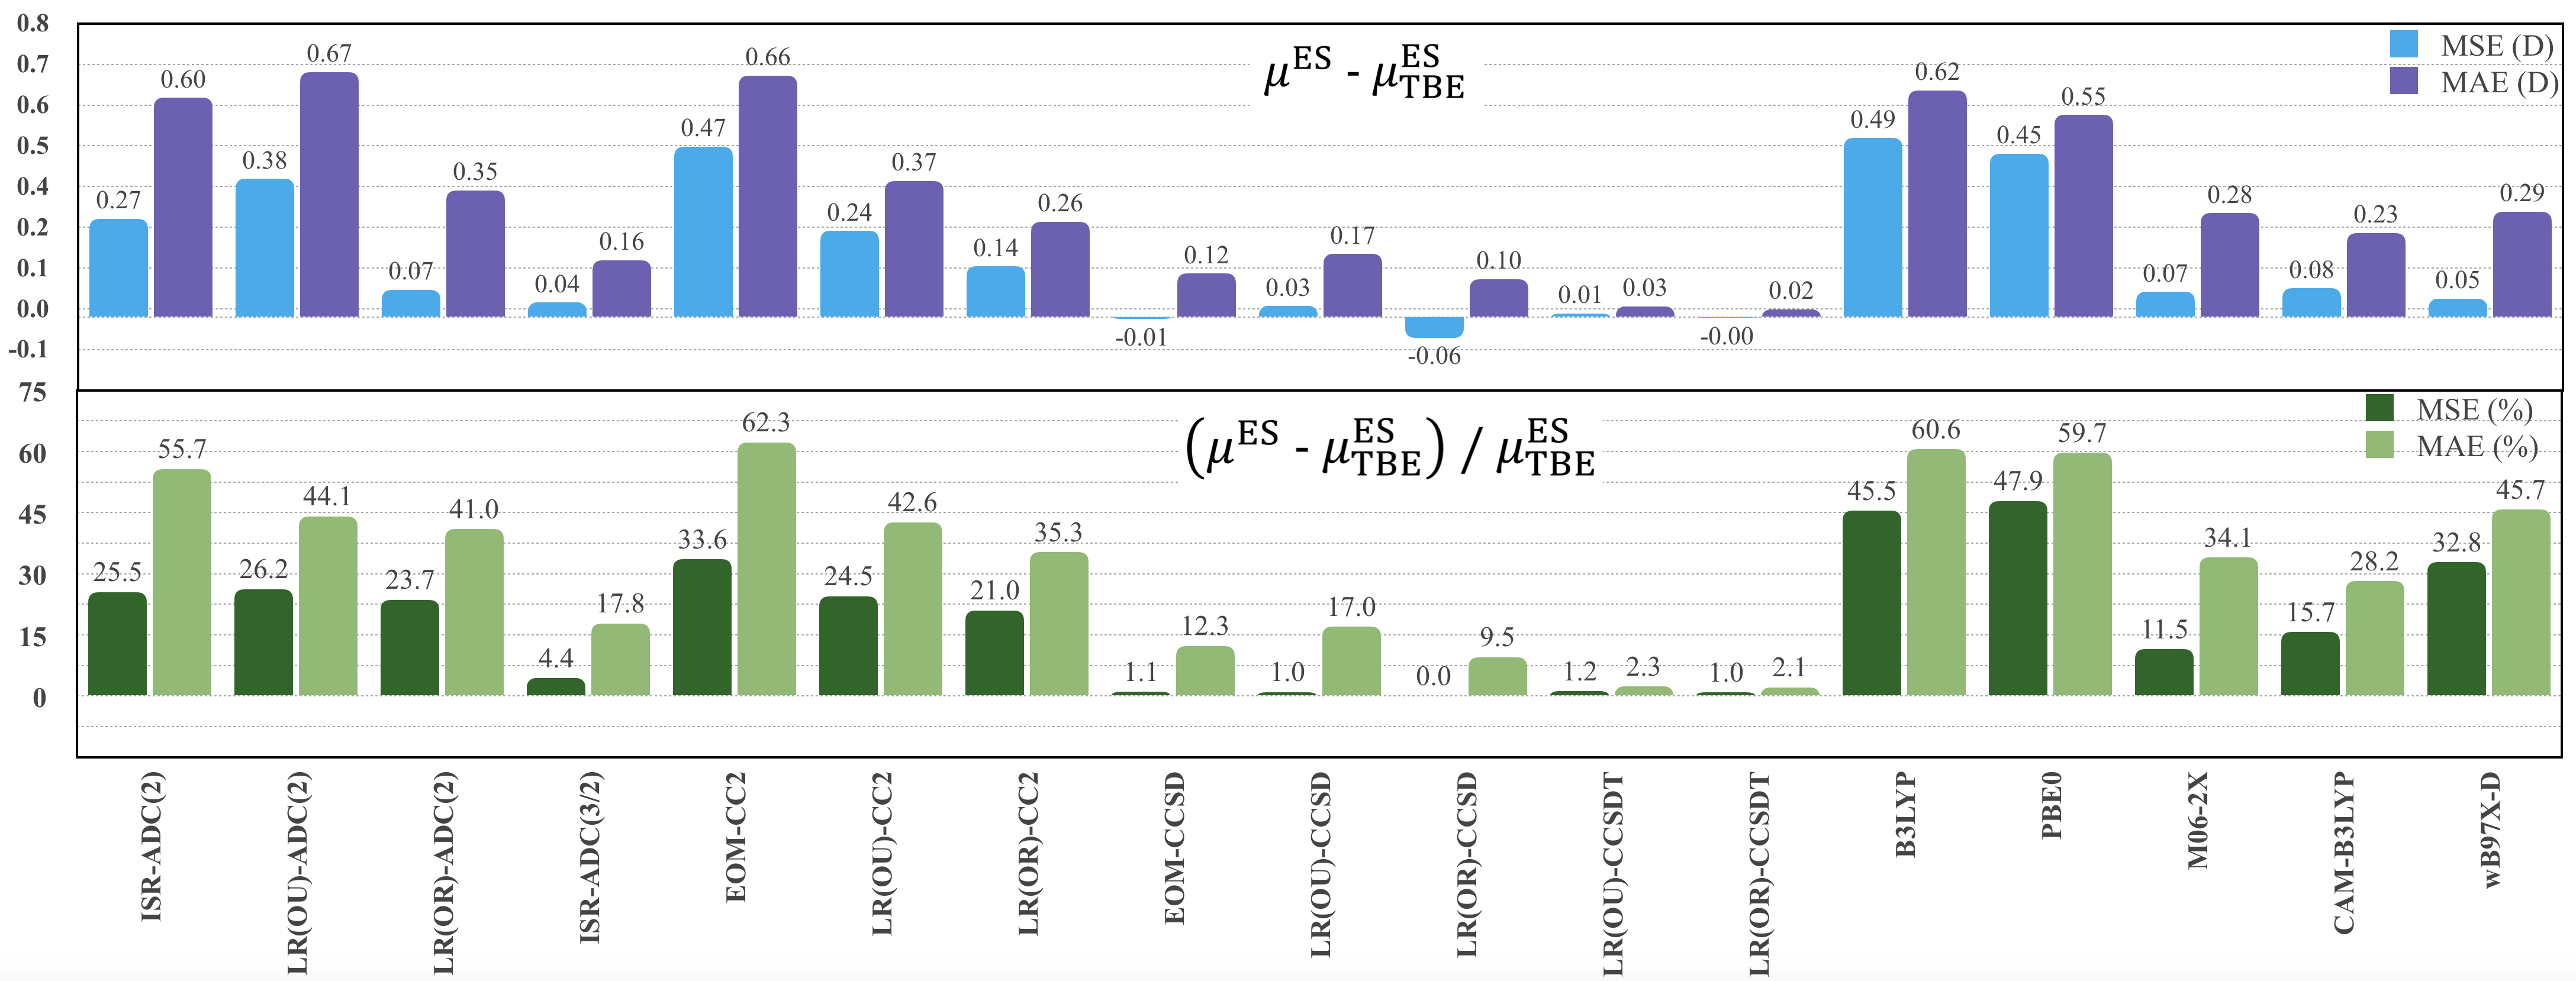
Finally, let us compare to our TBEs the ES dipole moments determined with the twelve wave function methods and five XCFs. The results are listed in Table 4 and a selection of values are displayed in Figure 7. Before discussing these results, it is important to recall that all our calculations are performed with the aug-cc-pVTZ basis set. As can be seen in Section S6.5 in the SI for the test case of water, the impact of increasing the basis set size on the estimated ES dipole moments is rather uniform within the wave function approaches, but might significantly differ between wave function and TD-DFT approaches. In other words, the TD-DFT errors reported below could be significantly different if another reference basis set was selected. From Table 4, one notices, except for some CCSD variants, that all tested approaches have positive MSEs, i.e., they tend to overestimate the magnitude of the dipole moments, which parallels the finding obtained for . When improving the level of theory by increasing the expansion order, one clearly improves the accuracy of the values obtained via the wave function methods, with MAEs of 0.60 and 0.16 D with ADC(2) and ADC(3/2) in the ISR formalism, and MAEs of 0.26, 0.11, and 0.02 D for LR-CC2, LR-CCSD, and LR-CCSDT, respectively, when orbital relaxation is accounted for. It is therefore clear, at least for the present set of small molecules, that while ADC(3) transition energies are of similar accuracy as their ADC(2) counterparts, going up one rung on the ADC ladder yields a very significant improvement for properties (including ES dipoles), ADC(3/2) clearly outperforming CC2 and providing an accuracy comparable to the one obtained with CCSD. For this latter method, and consistently with the above, there is a rather small difference in accuracy between the EOM and the two LR variants, with a MAD of 0.12 D for EOM-CCSD, and 0.10 D for LR(OR)-CCSD. In contrast for both LR-ADC(2) and LR-CC2, accounting for orbital relaxation does not only change significantly the values as stated above, but also markedly improves the accuracy, with errors halved as compared to LR(OU)-ADC(2) for the ADC approach(Figure 7). The ISR-ADC(2) show an accuracy slightly better than LR(OU)-ADC(2). By comparing the data listed in Tables 2 and 4, it also appears that the typical absolute errors are roughly tripled going from GS to ES properties, irrespective of the wave function method. We note that our MAE for both LR(OR)-ADC(2) and LR(OR)-CC2 are roughly 50% larger than the ones reported by Hellweg 79 from comparisons with experiments. This is likely related to the consideration of higher-lying Rydberg ESs here for which no experimental values are available. Indeed, it is known that both ADC(2) and CC2 are significantly more robust for valence than Rydberg transitions.132, 27
| Method | MSE | MAE | SDE | RMSE | Max() | Max() | |
|---|---|---|---|---|---|---|---|
| ADC(2) | ISR | 0.268 | 0.598 | 0.749 | 0.795 | 2.195 | -1.778 |
| OU | 0.377 | 0.668 | 0.812 | 0.903 | 2.384 | -2.041 | |
| OR | 0.074 | 0.345 | 0.519 | 0.536 | 1.384 | -1.866 | |
| ADC(3/2) | ISR | 0.040 | 0.155 | 0.229 | 0.237 | 0.360 | -0.523 |
| CC2 | EOM | 0.465 | 0.658 | 0.743 | 0.865 | 2.395 | -0.874 |
| OU | 0.235 | 0.371 | 0.508 | 0.525 | 1.915 | -0.819 | |
| OR | 0.138 | 0.260 | 0.375 | 0.388 | 1.419 | -0.692 | |
| CCSD | EOM | -0.005 | 0.119 | 0.176 | 0.186 | 0.221 | -0.633 |
| OU | 0.030 | 0.172 | 0.217 | 0.246 | 0.604 | -0.748 | |
| OR | -0.056 | 0.103 | 0.175 | 0.180 | 0.122 | -0.638 | |
| CCSDT | OU | 0.010 | 0.029 | 0.044 | 0.047 | 0.153 | -0.130 |
| OR | -0.002 | 0.021 | 0.037 | 0.038 | 0.095 | -0.135 | |
| B3LYP | 0.488 | 0.618 | 1.031 | 1.059 | 3.066 | -0.570 | |
| PBE0 | 0.445 | 0.551 | 0.899 | 0.924 | 2.570 | -0.603 | |
| M06-2X | 0.069 | 0.283 | 0.392 | 0.402 | 1.479 | -0.655 | |
| CAM-B3LYP | 0.078 | 0.229 | 0.292 | 0.308 | 0.786 | -0.463 | |
| B97X-D | 0.050 | 0.287 | 0.421 | 0.450 | 0.965 | -1.249 |
If we now turn our attention to the five tested TD-DFT approaches, two sets of XCFs clearly emerge. On the one hand, B3LYP and PBE0 very significantly overshoot the magnitude of the ES dipoles, with large MAEs of 0.62 and 0.55 D, respectively. While these errors are quite comparable to the ones obtained with ADC(2) in its LR(OU) or ISR formulations, they are almost one order of magnitude larger than those for the GS dipoles (0.07 D for both hybrids). As our set is constituted of small molecules, for which one does not expect charge-transfer effects to be important, this is likely related to the consideration of high-lying ESs. Indeed, as already stated above, global hybrids with low exact exchange are known to be less adequate for Rydberg excitations due to the wrong behavior of the exchange-correlation kernel at large interelectronic distances. 133, 134 Nevertheless, for B3LYP, Thiel’s group reported a MAE of 0.59 D as compared to CASPT2 on the basis of numerous valence ESs, 24 a value very similar to our MAE. On the other hand, one finds M06-2X, CAM-B3LYP and B97X-D with significantly smaller MAEs of ca. 0.25 D, that is roughly three times the corresponding deviations associated with , and about the same order of magnitude as the one obtained with LR(OR)-CC2. Amongst the five tested XCFs, CAM-B3LYP seems to have the edge in terms of both absolute accuracy and consistency. Following the GS analysis of Ref. 36, one can thus conclude that CAM-B3LYP does provide a more faithful description of the ES density than the other four functionals.
5. Conclusions and outlook
In this benchmark study, we have considered a set of 46 vertical transition energies, 16 GS dipoles, 34 oscillator strengths, and 40 ES dipole moments of very high quality to assess a series of single-reference wave function methods and five XCFs within TD-DFT. The TBEs used as references are obtained with the aug-cc-pVTZ basis set and all contain at least CCSDTQ or CCSDTQP corrections, which makes them of near-FCI quality. For the transition energies, our conclusions are in line with previous works with typical errors of 0.2 eV for ADC(2), ADC(3), CC2, but negligible deviations with CC3 and CCSDT, and errors in the 0.22–0.45 eV range for TD-DFT depending on the functional, B3LYP being the least accurate of the five we considered for the present set. For the GS dipoles, we found, as expected, that accounting for orbital relaxation is significant at the MP2 level (changes of ca. 0.17 D) but rapidly becomes irrelevant as the CC excitation order increases with deviations as small as 0.01 D with CC3 and CCSDT. All five considered functionals yield errors around 0.10 D only, and appear to be of similar accuracy as MP2 for GS dipoles. For the oscillator strengths, the mixed gauge typically yields results in between the velocity and length gauges. The differences between the two latter can be rather large with, e.g., MADs of 27% with ADC(2), 15% for M06-2X, and 13% for LR-CC2. In comparison, the changes induced by going from EOM to LR at the CC2 level are smaller (4% only). In terms of accuracy, the MAEs steadily decrease when improving the expansion order, e.g., the ADC(3/2) are more accurate than their ADC(2) counterparts. CAM-B3LYP appears to be the most accurate XCFs for the oscillator strengths with a MAE of 8% or 0.008, noticeably outperforming LR-CC2. For the ES dipole moments, the influence of orbital relaxation as well as the typical error bars given by the wave function approaches are approximatively three times larger than for the GS. Allowing orbital relaxation improves significantly the LR-ADC(2) and LR-CC2 estimates. Notably, ISR ADC(3/2) ES dipoles are much more accurate than their ISR ADC(2) counterparts. In TD-DFT, the results are contrasted: B3LYP and PBE0 overestimate strongly the (magnitude of the) ES dipoles, whereas the three other functionals (CAM-B3LYP in particular) yield acceptable deviations in the range 0.2–0.3 D, comparable to LR(OR)-CC2’s deviations, and clearly smaller than EOM-CC2’s.
Finally, and in line with our first mountaineering paper, 27 while the use of chemically-accurate reference values of near-FCI quality provides a definitive answer regarding the accuracy of various approaches for a given basis set (here: aug-cc-pVTZ), one is, of course, left wondering if the present outcomes would pertain for larger, more extended compounds. While there is no crystal-clear answer to this question at this stage, the present effort demonstrates that CC theory including triples (CC3 and CCSDT) provide oscillator strengths and dipoles that can be viewed as near-flawless, e.g., the EOM-CC3 scheme provides values with a MAE of 0.002 only whereas LR-CCSDT delivers values typically within 0.05 D of the corresponding TBEs. Therefore, for medium-sized molecules at least, these models can likely be used as trustworthy references. Within this framework, we recall that extensive sets of (LR-)CC3 oscillator strengths are already available for medium-sized molecules.132, 27, 29, 30
Acknowledgements
PFL and DJ thank Michael Herbst and Trond Saue for fruitful discussions. RS and DJ are indebted to the Région des Pays de la Loire program for support in the framework of the Opt-Basis grant. PFL thanks the European Research Council (ERC) under the European Union’s Horizon 2020 research and innovation programme (Grant agreement No. 863481) for financial support. This work benefited from the support of the ANR in the framework of the PIA program ANR-18-EURE-0012. This research used computational resources of (i) the GENCI-TGCC (Grant No. 2019-A0060801738); (ii) CALMIP under allocation 2020-18005 (Toulouse); (iii) CCIPL (Centre de Calcul Intensif des Pays de Loire); (iv) a local Troy cluster and (v) HPC resources from ArronaxPlus (grant ANR-11-EQPX-0004 funded by the French National Agency for Research).
Supporting Information Available
Additional reference data for five compounds. Raw values for transition energies, oscillator strengths, and dipole moments. Basis set effects for water. Cartesian coordinates. The Supporting Information is available free of charge at https://pubs.acs.org/doi/10.1021/doi.
REFERENCES
- González et al. 2012 González, L.; Escudero, D.; Serrano-Andrès, L. Progress and Challenges in the Calculation of Electronic Excited States. ChemPhysChem 2012, 13, 28–51
- Dreuw and Head-Gordon 2005 Dreuw, A.; Head-Gordon, M. Single-Reference ab initio Methods for the Calculation of Excited States of Large Molecules. Chem. Rev. 2005, 105, 4009–4037
- Adamo and Jacquemin 2013 Adamo, C.; Jacquemin, D. The calculations of Excited-State Properties with Time-Dependent Density Functional Theory. Chem. Soc. Rev. 2013, 42, 845–856
- Laurent and Jacquemin 2013 Laurent, A. D.; Jacquemin, D. TD-DFT Benchmarks: A Review. Int. J. Quantum Chem. 2013, 113, 2019–2039
- Roos et al. 2007 Roos, B. O.; Andersson, K.; Fülscher, M. P.; Malmqvist, P.-a.; Serrano-Andres, L.; Pierloot, K.; Merchan, M. Advances in Chemical Physics; John Wiley & Sons, Inc., 2007; Vol. 93; Chapter 5, pp 219–331
- Krylov 2006 Krylov, A. I. Spin-Flip Equation-of-Motion Coupled-Cluster Electronic Structure Method for a Description of Excited States, Bond Breaking, Diradicals, and Triradicals. Acc. Chem. Res. 2006, 39, 83–91
- Piecuch et al. 2002 Piecuch, P.; Kowalski, K.; Pimienta, I. S. O.; Mcguire, M. J. Recent Advances in Electronic Structure Theory: Method of Moments of Coupled-Cluster Equations and Renormalized Coupled-Cluster Approaches. Int. Rev. Phys. Chem. 2002, 21, 527–655
- Sneskov and Christiansen 2012 Sneskov, K.; Christiansen, O. Excited State Coupled Cluster Methods. WIREs Comput. Mol. Sci. 2012, 2, 566–584
- Ghosh et al. 2018 Ghosh, S.; Verma, P.; Cramer, C. J.; Gagliardi, L.; Truhlar, D. G. Combining Wave Function Methods with Density Functional Theory for Excited States. Chem. Rev. 2018, 118, 7249–7292
- Blase et al. 2020 Blase, X.; Duchemin, I.; Jacquemin, D.; Loos, P. F. The Bethe-Salpeter Formalism: From Physics to Chemistry. J. Phys. Chem. Lett. 2020, 11, 7371
- Loos et al. 2020 Loos, P. F.; Scemama, A.; Jacquemin, D. The Quest for Highly-Accurate Excitation Energies: A Computational Perspective. J. Phys. Chem. Lett. 2020, 11, 2374–2383
- Runge and Gross 1984 Runge, E.; Gross, E. K. U. Density-Functional Theory for Time-Dependent Systems. Phys. Rev. Lett. 1984, 52, 997–1000
- Casida 1995 Casida, M. E. In Time-Dependent Density-Functional Response Theory for Molecules; Chong, D. P., Ed.; Recent Advances in Density Functional Methods; World Scientific: Singapore, 1995; Vol. 1; pp 155–192
- Schirmer 1982 Schirmer, J. Beyond the Random-Phase Approximation: a new Approximation Scheme for the Polarization Propagator. Phys. Rev. A 1982, 26, 2395–2416
- Trofimov et al. 1999 Trofimov, A. B.; Stelter, G.; Schirmer, J. A Consistent Third-Order Propagator Method for Electronic Excitation. J. Chem. Phys. 1999, 111, 9982–9999
- Harbach et al. 2014 Harbach, P. H. P.; Wormit, M.; Dreuw, A. The Third-Order Algebraic Diagrammatic Construction Method (ADC(3)) for the Polarization Propagator for Closed-Shell Molecules: Efficient Implementation and Benchmarking. J. Chem. Phys. 2014, 141, 064113
- Dreuw and Wormit 2015 Dreuw, A.; Wormit, M. The Algebraic Diagrammatic Construction Scheme for the Polarization Propagator for the Calculation of Excited States. WIREs Comput. Mol. Sci. 2015, 5, 82–95
- Christiansen et al. 1995 Christiansen, O.; Koch, H.; Jørgensen, P. The Second-Order Approximate Coupled Cluster Singles and Doubles Model CC2. Chem. Phys. Lett. 1995, 243, 409–418
- Salpeter and Bethe 1951 Salpeter, E. E.; Bethe, H. A. A Relativistic Equation for Bound-State Problems. Phys. Rev. 1951, 84, 1232–1242
- Strinati 1988 Strinati, G. Application of the Green’s Functions Method to the Study of the Optical Properties of Semiconductors. Riv. Nuovo Cimento 1988, 11, 1–86
- Blase et al. 2018 Blase, X.; Duchemin, I.; Jacquemin, D. The Bethe-Salpeter Equation in Chemistry: Relations with TD-DFT, Applications and Challenges. Chem. Soc. Rev. 2018, 47, 1022–1043
- Nooijen 1999 Nooijen, M. Similarity Transformed Equation of Motion Coupled-Cluster Study of Excited States of Selected Azabenzenes. SpectroChim. Acta A 1999, 55, 539–559
- Dutta et al. 2018 Dutta, A. K.; Nooijen, M.; Neese, F.; Izsák, R. Exploring the Accuracy of a Low Scaling Similarity Transformed Equation of Motion Method for Vertical Excitation Energies. J. Chem. Theory Comput. 2018, 14, 72–91
- Schreiber et al. 2008 Schreiber, M.; Silva-Junior, M. R.; Sauer, S. P. A.; Thiel, W. Benchmarks for Electronically Excited States: CASPT2, CC2, CCSD and CC3. J. Chem. Phys. 2008, 128, 134110
- Sauer et al. 2009 Sauer, S. P. A.; Schreiber, M.; Silva-Junior, M. R.; Thiel, W. Benchmarks for Electronically Excited States: A Comparison of Noniterative and Iterative Triples Corrections in Linear Response Coupled Cluster Methods: CCSDR(3) versus CC3. J. Chem. Theory Comput. 2009, 5, 555–564
- Silva-Junior et al. 2010 Silva-Junior, M. R.; Schreiber, M.; Sauer, S. P. A.; Thiel, W. Benchmarks of Electronically Excited States: Basis Set Effecs Benchmarks of Electronically Excited States: Basis Set Effects on CASPT2 Results. J. Chem. Phys. 2010, 133, 174318
- Loos et al. 2018 Loos, P.-F.; Scemama, A.; Blondel, A.; Garniron, Y.; Caffarel, M.; Jacquemin, D. A Mountaineering Strategy to Excited States: Highly-Accurate Reference Energies and Benchmarks. J. Chem. Theory Comput. 2018, 14, 4360–4379
- Loos et al. 2019 Loos, P.-F.; Boggio-Pasqua, M.; Scemama, A.; Caffarel, M.; Jacquemin, D. Reference Energies for Double Excitations. J. Chem. Theory Comput. 2019, 15, 1939–1956
- Loos et al. 2020 Loos, P.-F.; Lipparini, F.; Boggio-Pasqua, M.; Scemama, A.; Jacquemin, D. A Mountaineering Strategy to Excited States: Highly-Accurate Energies and Benchmarks for Medium Size Molecules. J. Chem. Theory Comput. 2020, 16, 1711–1741
- Loos et al. 2020 Loos, P.-F.; Scemama, A.; Boggio-Pasqua, M.; Jacquemin, D. A Mountaineering Strategy to Excited States: Highly-Accurate Energies and Benchmarks for Exotic Molecules and Radicals. J. Chem. Theory Comput. 2020, 16, 3720–3736
- Dierksen and Grimme 2004 Dierksen, M.; Grimme, S. The Vibronic Structure of Electronic Absorption Spectra of Large Molecules: A Time-Dependent Density Functional Study on the Influence of Exact Hartree-Fock Exchange. J. Phys. Chem. A 2004, 108, 10225–10237
- Send et al. 2011 Send, R.; Kühn, M.; Furche, F. Assessing Excited State Methods by Adiabatic Excitation Energies. J. Chem. Theory Comput. 2011, 7, 2376–2386
- Loos and Jacquemin 2019 Loos, P.-F.; Jacquemin, D. Chemically Accurate 0-0 Energies with not-so-Accurate Excited State Geometries. J. Chem. Theory Comput. 2019, 15, 2481–2491
- Loos and Jacquemin 2019 Loos, P.-F.; Jacquemin, D. Evaluating 0-0 Energies with Theoretical Tools: a Short Review. ChemPhotoChem 2019, 3, 684–696
- Medvedev et al. 2017 Medvedev, M. G.; Bushmarinov, I. S.; Sun, J.; Perdew, J. P.; Lyssenko, K. A. Density Functional Theory is Straying From the Path Toward the Exact Functional. Science 2017, 355, 49–52
- Hait and Head-Gordon 2018 Hait, D.; Head-Gordon, M. How Accurate Is Density Functional Theory at Predicting Dipole Moments? An Assessment Using a New Database of 200 Benchmark Values. J. Chem. Theory Comput. 2018, 14, 1969–1981
- Hait et al. 2020 Hait, D.; Liang, Y. H.; Head-Gordon, M. Too Big, Too Small or Just Right? A Benchmark Assessment of Density Functional Theory for Predicting ehe Spatial Extent of the Electron Density of Small Chemical Systems. 2020, arXiv:2011.12561
- Chrayteh et al. 2021 Chrayteh, A.; Blondel, A.; Loos, P.-F.; Jacquemin, D. A Mountaineering Strategy to Excited States: Highly-Accurate Oscillator Strengths and Dipole Moments of Small Molecules. J. Chem. Theory Comput. 2021, 17, 416–438
- Giner et al. 2019 Giner, E.; Scemama, A.; Toulouse, J.; Loos, P. F. Chemically Accurate Excitation Energies With Small Basis Sets. J. Chem. Phys. 2019, 151, 144118
- Thomas 1925 Thomas, W. Über die Zahl der Dispersionselektronen, die einem stationären Zustande zugeordnet sind. Naturwissenschaften 1925, 13, 627–627
- Reiche and Thomas 1925 Reiche, F.; Thomas, W. Über die Zahl der Dispersionselektronen, die einem stationären Zustand zugeordnet sind. Z. Phys. 1925, 34, 510–525
- Kuhn 1925 Kuhn, W. Über die Gesamtstärke der von einem Zustande ausgehenden Absorptionslinien. Z. Phys. 1925, 33, 408–412
- A.Sauer et al. 2019 A.Sauer, S. P.; R.Sabin, J.; Oddershede, J. Calculation of Mean Excitation Energies. Adv. Quantum Chem. 2019, 80, 225–245
- Pawłowski et al. 2004 Pawłowski, F.; Jørgensen, P.; Hättig, C. Gauge Invariance of Oscillator Strengths in the Approximate Coupled Cluster Triples Model CC3. Chem. Phys. Lett. 2004, 389, 413–420
- Pedersen and Koch 1998 Pedersen, T. B.; Koch, H. Gauge Invariance of the Coupled Cluster Oscillator Strength. Chem. Phys. Lett. 1998, 293, 251–260
- Helgaker et al. 1989 Helgaker, T.; Jørgensen, P.; Handy, N. A Numerically Stable Procedure for Calculating Møller-Plesset Energy Derivatives, Derived Using the Theory of Lagrangians. Theoret. Chim. Acta 1989, 76, 227–245
- Koch et al. 1990 Koch, H.; Jensen, H. J. A.; Jorgensen, P.; Helgaker, T.; Scuseria, G. E.; Schaefer, H. F. Coupled Cluster Energy Derivatives. Analytic Hessian for the Closed-Shell Coupled Cluster Singles and Doubles Wave Function: Theory and Applications. J. Chem. Phys. 1990, 92, 4924–4940
- Hättig 2003 Hättig, C. Geometry Optimizations with the Coupled-Cluster Model CC2 Using the Resolution-of-the-Identity Approximation. J. Chem. Phys. 2003, 118, 7751–7761
- Hättig 2005 Hättig, C. In Response Theory and Molecular Properties (A Tribute to Jan Linderberg and Poul Jørgensen); Jensen, H. A., Ed.; Advances in Quantum Chemistry; Academic Press, 2005; Vol. 50; pp 37–60
- Monkhorst 1977 Monkhorst, H. J. Calculation of Properties with the Coupled-Cluster Method. Int. J. Quantum Chem. 1977, 12, 421–432
- Christiansen et al. 1998 Christiansen, O.; Jørgensen, P.; Hättig, C. Response Functions from Fourier Component Variational Perturbation Theory Applied to a Time-Averaged Quasienergy. Int. J. Quantum Chem. 1998, 68, 1–52
- Kállay and Gauss 2004 Kállay, M.; Gauss, J. Calculation of Excited-State Properties Using General Coupled-Cluster and Configuration-Interaction Models. J. Chem. Phys. 2004, 121, 9257–9269
- Salter et al. 1987 Salter, E. A.; Sekino, H.; Bartlett, R. J. Property Evaluation and Orbital Relaxation in Coupled Cluster Methods. J. Chem. Phys. 1987, 87, 502–509
- Trucks et al. 1988 Trucks, G. W.; Salter, E.; Sosa, C.; Bartlett, R. J. Theory and Implementation of the MBPT Density Matrix. An Application to One-Electron Properties. Chem. Phys. Lett. 1988, 147, 359–366
- ROWE 1968 ROWE, D. J. Equations-of-Motion Method and the Extended Shell Model. Rev. Mod. Phys. 1968, 40, 153–166
- Stanton and Bartlett 1993 Stanton, J. F.; Bartlett, R. J. The Equation of Motion Coupled-Cluster Method - A Systematic Biorthogonal Approach to Molecular Excitation Energies, Transition-Probabilities, and Excited-State Properties. J. Chem. Phys. 1993, 98, 7029–7039
- Schirmer 1991 Schirmer, J. Closed-Form Intermediate Representations of Many-Body Propagators and Resolvent Matrices. Phys. Rev. A. 1991, 43, 4647–4659
- Schirmer and Mertins 2010 Schirmer, J.; Mertins, F. Review of Biorthogonal Coupled Cluster Representations for Electronic Excitation. Theor. Chem. Acc. 2010, 125, 145–172
- Hodecker et al. 2019 Hodecker, M.; Rehn, D. R.; Dreuw, A.; Höfener, S. Similarities and Differences of the Lagrange Formalism and the Intermediate State Representation in the Treatment of Molecular Properties. J. Chem. Phys. 2019, 150, 164125
- Koch et al. 1994 Koch, H.; Kobayashi, R.; Sanchez de Merás, A.; Jorgensen, P. Calculation of Size-Intensive Transition Moments from the Coupled Cluster Singles and Doubles Linear Response Function. J. Chem. Phys. 1994, 100, 4393–4400
- Caricato et al. 2009 Caricato, M.; Trucks, G. W.; Frisch, M. J. On the Difference Between the Transition Properties Calculated with Linear Response- and Equation of Motion-CCSD Approaches. J. Chem. Phys. 2009, 131, 174104
- Kánnár and Szalay 2014 Kánnár, D.; Szalay, P. G. Benchmarking Coupled Cluster Methods on Valence Singlet Excited States. J. Chem. Theory Comput. 2014, 10, 3757–3765
- Tawada et al. 2004 Tawada, T.; Tsuneda, T.; Yanagisawa, S.; Yanai, T.; Hirao, K. A Long-Range-Corrected Time-Dependent Density Functional Theory. J. Chem. Phys. 2004, 120, 8425–8433
- Miura et al. 2007 Miura, M.; Aoki, Y.; Champagne, B. Assessment of Time-Dependent Density Functional Schemes for Computing The Oscillator Strengths of Benzene, Phenol, Aniline, and Fluorobenzene. J. Chem. Phys. 2007, 127, 084103
- Timerghazin et al. 2008 Timerghazin, Q. K.; Carlson, H. J.; Liang, C.; Campbell, R. E.; Brown, A. Computational Prediction of Absorbance Maxima for a Structurally Diverse Series of Engineered Green Fluorescent Protein Chromophores. J. Phys. Chem. B 2008, 112, 2533–2541
- Silva-Junior et al. 2008 Silva-Junior, M. R.; Schreiber, M.; Sauer, S. P. A.; Thiel, W. Benchmarks for Electronically Excited States: Time-Dependent Density Functional Theory and Density Functional Theory Based Multireference Configuration Interaction. J. Chem. Phys. 2008, 129, 104103
- Caricato et al. 2010 Caricato, M.; Trucks, G.; Frisch, M.; Wiberg, K. Oscillator Strength: How Does TDDFT Compare to EOM-CCSD? J. Chem. Theory Comput. 2010, 7, 456–466
- Szalay et al. 2012 Szalay, P. G.; Watson, T.; Perera, A.; Lotrich, V. F.; Bartlett, R. J. Benchmark Studies on the Building Blocks of DNA. 1. Superiority of Coupled Cluster Methods in Describing the Excited States of Nucleobases in the Franck–Condon Region. J. Phys. Chem. A 2012, 116, 6702–6710
- Sauer et al. 2015 Sauer, S. P.; Pitzner-Frydendahl, H. F.; Buse, M.; Jensen, H. J. A.; Thiel, W. Performance of SOPPA-Based Methods in the Calculation of Vertical Excitation Energies and Oscillator Strengths. Mol. Phys. 2015, 113, 2026–2045
- Jacquemin et al. 2016 Jacquemin, D.; Duchemin, I.; Blondel, A.; Blase, X. Assessment of the Accuracy of the Bethe-Salpeter (BSE/GW) Oscillator Strengths. J. Chem. Theory Comput. 2016, 12, 3969–3981
- Robinson 2018 Robinson, D. Comparison of the Transition Dipole Moments Calculated by TDDFT with High Level Wave Function Theory. J. Chem. Theory Comput. 2018, 14, 5303–5309
- Silva-Junior et al. 2010 Silva-Junior, M. R.; Sauer, S. P. A.; Schreiber, M.; Thiel, W. Basis Set Effects on Coupled Cluster Benchmarks of Electronically Excited States: CC3, CCSDR(3) and CC2. Mol. Phys. 2010, 108, 453–465
- Furche and Ahlrichs 2002 Furche, F.; Ahlrichs, R. Adiabatic Time-Dependent Density Functional Methods for Excited States Properties. J. Chem. Phys. 2002, 117, 7433–7447
- King 2008 King, R. A. On the Accuracy of Computed Excited-State Dipole Moments. J. Phys. Chem. A 2008, 112, 5727–5733
- Wong et al. 2009 Wong, B. M.; Piacenza, M.; Della Sala, F. Absorption and Fluorescence Properties of Oligothiophene Biomarkers from Long-Range-Corrected Absorption and Fluorescence Properties of Oligothiophene Biomarkersfrom Long-Range-Corrected Time-Dependent Density Functional Theory. Phys. Chem. Chem. Phys. 2009, 11, 4498–4508
- Tapavicza et al. 2009 Tapavicza, E.; Tavernelli, I.; Rothlisberger, U. Ab Initio Excited State Properties and Dynamics of a Prototype -Bridged-Donor-Acceptor Molecule. J. Phys. Chem. A 2009, 113, 9595–9602
- Guido et al. 2010 Guido, C. A.; Jacquemin, D.; Adamo, C.; Mennucci, B. On the TD-DFT Accuracy in Determining Single and Double Bonds in Excited-State Structures of Organic Molecules. J. Phys. Chem. A 2010, 114, 13402–13410
- Silva-Junior and Thiel 2010 Silva-Junior, M. R.; Thiel, W. Benchmark of Electronically Excited States for Semiempirical Methods: MNDO, AM1, PM3, OM1, OM2, OM3, INDO/S, and INDO/S2. J. Chem. Theory Comput. 2010, 6, 1546–1564
- Hellweg 2011 Hellweg, A. The Accuracy of Dipole Moments from Spin-Component Scaled CC2 in Ground and Electronically Excited States. J. Chem. Phys. 2011, 134, 064103
- Jacquemin 2016 Jacquemin, D. Excited-State Dipole and Quadrupole Moments: TD-DFT versus CC2. J. Chem. Theory Comput. 2016, 12, 3993–4003
- Hodecker and Dreuw 2020 Hodecker, M.; Dreuw, A. Unitary Coupled Cluster Ground- and Excited-State Molecular Properties. J. Chem. Phys. 2020, 153, 084112
- Christiansen et al. 1995 Christiansen, O.; Koch, H.; Jørgensen, P. Response Functions in the CC3 Iterative Triple Excitation Model. J. Chem. Phys. 1995, 103, 7429–7441
- Koch et al. 1995 Koch, H.; Christiansen, O.; Jorgensen, P.; Olsen, J. Excitation Energies of BH, CH2 and Ne in Full Configuration Interaction and the Hierarchy CCS, CC2, CCSD and CC3 of Coupled Cluster Models. Chem. Phys. Lett. 1995, 244, 75–82
- Aidas et al. 2014 Aidas, K.; Angeli, C.; Bak, K. L.; Bakken, V.; Bast, R.; Boman, L.; Christiansen, O.; Cimiraglia, R.; Coriani, S.; Dahle, P.; Dalskov, E. K.; Ekström, U.; Enevoldsen, T.; Eriksen, J. J.; Ettenhuber, P.; Fernández, B.; Ferrighi, L.; Fliegl, H.; Frediani, L.; Hald, K.; Halkier, A.; Hättig, C.; Heiberg, H.; Helgaker, T.; Hennum, A. C.; Hettema, H.; Hjertenæs, E.; Høst, S.; Hoyvik, I.-M.; Iozzi, M. F.; Jansik, B.; Jensen, H. J. A.; Jonsson, D.; Jørgensen, P.; Kauczor, J.; Kirpekar, S.; Kjærgaard, T.; Klopper, W.; Knecht, S.; Kobayashi, R.; Koch, H.; Kongsted, J.; Krapp, A.; Kristensen, K.; Ligabue, A.; Lutnæs, O. B.; Melo, J. I.; Mikkelsen, K. V.; Myhre, R. H.; Neiss, C.; Nielsen, C. B.; Norman, P.; Olsen, J.; Olsen, J. M. H.; Osted, A.; Packer, M. J.; Pawlowski, F.; Pedersen, T. B.; Provasi, P. F.; Reine, S.; Rinkevicius, Z.; Ruden, T. A.; Ruud, K.; Rybkin, V. V.; Sałek, P.; Samson, C. C. M.; de Merás, A. S.; Saue, T.; Sauer, S. P. A.; Schimmelpfennig, B.; Sneskov, K.; Steindal, A. H.; Sylvester-Hvid, K. O.; Taylor, P. R.; Teale, A. M.; Tellgren, E. I.; Tew, D. P.; Thorvaldsen, A. J.; Thogersen, L.; Vahtras, O.; Watson, M. A.; Wilson, D. J. D.; Ziolkowski, M.; Ågren, H. The Dalton Quantum Chemistry Program System. WIREs Comput. Mol. Sci. 2014, 4, 269–284
- 85 CFOUR, Coupled-Cluster Techniques for Computational Chemistry, a Quantum-Chemical Program Package by J.F. Stanton, J. Gauss, L. Cheng, M.E. Harding, D.A. Matthews, P.G. Szalay with contributions from A.A. Auer, R.J. Bartlett, U. Benedikt, C. Berger, D.E. Bernholdt, Y.J. Bomble, O. Christiansen, F. Engel, R. Faber, M. Heckert, O. Heun, M. Hilgenberg, C. Huber, T.-C. Jagau, D. Jonsson, J. Jusélius, T. Kirsch, K. Klein, W.J. Lauderdale, F. Lipparini, T. Metzroth, L.A. Mück, D.P. O’Neill, D.R. Price, E. Prochnow, C. Puzzarini, K. Ruud, F. Schiffmann, W. Schwalbach, C. Simmons, S. Stopkowicz, A. Tajti, J. Vázquez, F. Wang, J.D. Watts and the integral packages MOLECULE (J. Almlöf and P.R. Taylor), PROPS (P.R. Taylor), ABACUS (T. Helgaker, H.J. Aa. Jensen, P. Jørgensen, and J. Olsen), and ECP routines by A. V. Mitin and C. van Wüllen. For the current version, see http://www.cfour.de.
- Hattig et al. 2012 Hattig, C.; Klopper, W.; Kohn, A.; Tew, D. P. Explicitly Correlated Electrons in Molecules. Chem. Rev. 2012, 112, 4–74
- Loos et al. 2019 Loos, P. F.; Pradines, B.; Scemama, A.; Toulouse, J.; Giner, E. A Density-Based Basis-Set Correction for Wave Function Theory. J. Phys. Chem. Lett. 2019, 10, 2931–2937
- Kallay et al. 2020 Kallay, M.; Nagy, P. E.; Mester, D.; Rolik, Z.; Samu, J., G. Ans Csontos; Csoka, J.; Szabo, P. B.; Gyevi-Nagu, L.; Hegely, B.; Ladjanski, I.; Szegedy, L.; Ladoczki, B.; Petrov, K.; Farkas, M.; Mezei, P. D.; Ganyecz, A. The MRCC Program System: Accurate Quantum Chemistry from Water to Proteins. J. Chem. Phys. 2020, 152, 074107
- Kállay et al. 2017 Kállay, M.; Rolik, Z.; Csontos, J.; Nagy, P.; Samu, G.; Mester, D.; Csóka, J.; Szabó, B.; Ladjánszki, I.; Szegedy, L.; Ladóczki, B.; Petrov, K.; Farkas, M.; Mezei, P. D.; Hégely., B. MRCC, Quantum Chemical Program. 2017; See: www.mrcc.hu.
- Purvis III and Bartlett 1982 Purvis III, G. P.; Bartlett, R. J. A Full Coupled-Cluster Singles and Doubles Model: The Inclusion of Disconnected Triples. J. Chem. Phys. 1982, 76, 1910–1918
- Scuseria et al. 1987 Scuseria, G. E.; Scheiner, A. C.; Lee, T. J.; Rice, J. E.; Schaefer, H. F. The Closed-Shell Coupled Cluster Single and Double Excitation (CCSD) Model for the Description of Electron Correlation. A Comparison with Configuration Interaction (CISD) Results. J. Chem. Phys. 1987, 86, 2881–2890
- Koch et al. 1990 Koch, H.; Jensen, H. J. A.; Jorgensen, P.; Helgaker, T. Excitation Energies from the Coupled Cluster Singles and Doubles Linear Response Function (CCSDLR). Applications to Be, CH+, CO, and H2O. J. Chem. Phys. 1990, 93, 3345–3350
- Stanton 1993 Stanton, J. F. Many-Body Methods for Excited State Potential Energy Surfaces. I: General Theory of Energy Gradients for the Equation-of-Motion Coupled-Cluster Method. J. Chem. Phys. 1993, 99, 8840–8847
- Noga and Bartlett 1987 Noga, J.; Bartlett, R. J. The Full CCSDT Model for Molecular Electronic Structure. J. Chem. Phys. 1987, 86, 7041–7050
- Scuseria and Schaefer 1988 Scuseria, G. E.; Schaefer, H. F. A New Implementation of the Full CCSDT Model for Molecular Electronic Structure. Chem. Phys. Lett. 1988, 152, 382–386
- Kucharski et al. 2001 Kucharski, S. A.; Włoch, M.; Musiał, M.; Bartlett, R. J. Coupled-Cluster Theory for Excited Electronic States: The Full Equation-Of-Motion Coupled-Cluster Single, Double, and Triple Excitation Method. J. Chem. Phys. 2001, 115, 8263–8266
- Kowalski and Piecuch 2001 Kowalski, K.; Piecuch, P. The Active-Space Equation-of-Motion Coupled-Cluster Methods for Excited Electronic States: Full EOMCCSDt. J. Chem. Phys. 2001, 115, 643–651
- Kowalski and Piecuch 2001 Kowalski, K.; Piecuch, P. Excited-State Potential Energy Curves of CH+: a Comparison of the EOMCCSDt And Full EOMCCSDT Results. Chem. Phys. Lett. 2001, 347, 237–246
- Kucharski and Bartlett 1991 Kucharski, S. A.; Bartlett, R. J. Recursive Intermediate Factorization and Complete Computational Linearization of the Coupled-Cluster Single, Double, Triple, and Quadruple Excitation Equations. Theor. Chim. Acta 1991, 80, 387–405
- Kállay et al. 2003 Kállay, M.; Gauss, J.; Szalay, P. G. Analytic First Derivatives for General Coupled-Cluster and Configuration Interaction Models. J. Chem. Phys. 2003, 119, 2991–3004
- Hirata 2004 Hirata, S. Higher-Order Equation-of-Motion Coupled-Cluster Methods. J. Chem. Phys. 2004, 121, 51–59
- Balabanov and Peterson 2006 Balabanov, N. B.; Peterson, K. A. Basis set Limit Electronic Excitation Energies, Ionization Potentials, and Electron Affinities for the Transition Metal Atoms: Coupled Cluster and Multireference Methods. J. Chem. Phys. 2006, 125, 074110
- Kamiya and Hirata 2006 Kamiya, M.; Hirata, S. Higher-Order Equation-of-Motion Coupled-Cluster Methods for Ionization Processes. J. Chem. Phys. 2006, 125, 074111
- Watson and Chan 2012 Watson, M. A.; Chan, G. K.-L. Excited States of Butadiene to Chemical Accuracy: Reconciling Theory and Experiment. J. Chem. Theory Comput. 2012, 8, 4013–4018
- Feller et al. 2014 Feller, D.; Peterson, K. A.; Davidson, E. R. A Systematic Approach to Vertically Excited States of Ethylene Using Configuration Interaction and Coupled Cluster Techniques. J. Chem. Phys. 2014, 141, 104302
- Franke et al. 2019 Franke, P. R.; Moore, K. B.; Schaefer, H. F.; Douberly, G. E. tert-Butyl Peroxy Radical: Ground and First Excited State Energetics and Fundamental Frequencies. Phys. Chem. Chem. Phys. 2019, 21, 9747–9758
- Andersson et al. 1990 Andersson, K.; Malmqvist, P. A.; Roos, B. O.; Sadlej, A. J.; Wolinski, K. Second-Order Perturbation Theory With a CASSCF Reference Function. J. Phys. Chem. 1990, 94, 5483–5488
- Andersson et al. 1992 Andersson, K.; Malmqvist, P.-A.; Roos, B. O. Second-Order Perturbation Theory With a Complete Active Space Self-Consistent Field Reference Function. J. Chem. Phys. 1992, 96, 1218–1226
- Roos and Andersson 1995 Roos, B. O.; Andersson, K. Multiconfigurational Perturbation Theory with Level Shift — the Cr2 Potential Revisited. Chem. Phys. Lett. 1995, 245, 215–223
- Ghigo et al. 2004 Ghigo, G.; Roos, B. O.; Malmqvist, P.-Å. A Modified Definition of the Zeroth-Order Hamiltonian in Multiconfigurational Perturbation Theory (CASPT2). Chem. Phys. Lett. 2004, 396, 142–149
- Werner et al. 2012 Werner, H.-J.; Knowles, P. J.; Knizia, G.; Manby, F. R.; Schütz, M. Molpro: a general-purpose quantum chemistry program package. Wiley Interdisciplinary Reviews: Computational Molecular Science 2012, 2, 242–253
- Werner et al. 2019 Werner, H.-J.; Knowles, P. J.; Knizia, G.; Manby, F. R.; Schütz, M.; Celani, P.; Györffy, W.; Kats, D.; Korona, T.; Lindh, R.; Mitrushenkov, A.; Rauhut, G.; Shamasundar, K. R.; Adler, T. B.; Amos, R. D.; Bennie, S. J.; Bernhardsson, A.; Berning, A.; Cooper, D. L.; Deegan, M. J. O.; Dobbyn, A. J.; Eckert, F.; Goll, E.; Hampel, C.; Hesselmann, A.; Hetzer, G.; Hrenar, T.; Jansen, G.; Köppl, C.; Lee, S. J. R.; Liu, Y.; Lloyd, A. W.; Ma, Q.; Mata, R. A.; May, A. J.; McNicholas, S. J.; Meyer, W.; Miller III, T. F.; Mura, M. E.; Nicklass, A.; O’Neill, D. P.; Palmieri, P.; Peng, D.; Pflüger, K.; Pitzer, R.; Reiher, M.; Shiozaki, T.; Stoll, H.; Stone, A. J.; Tarroni, R.; Thorsteinsson, T.; Wang, M.; Welborn, M. MOLPRO, version 2019.2, a package of ab initio programs. 2019; see https://www.molpro.net
- Balasubramani et al. 2020 Balasubramani, S. G.; Chen, G. P.; Coriani, S.; Diedenhofen, M.; Frank, M. S.; Franzke, Y. J.; Furche, F.; Grotjahn, R.; Harding, M. E.; Hättig, C.; Hellweg, A.; Helmich-Paris, B.; Holzer, C.; Huniar, U.; Kaupp, M.; Marefat Khah, A.; Karbalaei Khani, S.; Müller, T.; Mack, F.; Nguyen, B. D.; Parker, S. M.; Perlt, E.; Rappoport, D.; Reiter, K.; Roy, S.; Rückert, M.; Schmitz, G.; Sierka, M.; Tapavicza, E.; Tew, D. P.; van Wüllen, C.; Voora, V. K.; Weigend, F.; Wodyński, A.; Yu, J. M. TURBOMOLE: Modular Program Suite for ab initio Quantum-Chemical and Condensed-Matter Simulations. J. Chem. Phys. 2020, 152, 184107
- 114 TURBOMOLE V7.3 2018, a development of University of Karlsruhe and Forschungszentrum Karlsruhe GmbH, 1989-2007, TURBOMOLE GmbH, since 2007; available from http://www.turbomole.com (accessed 13 June 2016).
- Krylov and Gill 2013 Krylov, A. I.; Gill, P. M. Q-Chem: an Engine for Innovation. WIREs Comput. Mol. Sci. 2013, 3, 317–326
- Frisch et al. 2016 Frisch, M. J.; Trucks, G. W.; Schlegel, H. B.; Scuseria, G. E.; Robb, M. A.; Cheeseman, J. R.; Scalmani, G.; Barone, V.; Petersson, G. A.; Nakatsuji, H.; Li, X.; Caricato, M.; Marenich, A. V.; Bloino, J.; Janesko, B. G.; Gomperts, R.; Mennucci, B.; Hratchian, H. P.; Ortiz, J. V.; Izmaylov, A. F.; Sonnenberg, J. L.; Williams-Young, D.; Ding, F.; Lipparini, F.; Egidi, F.; Goings, J.; Peng, B.; Petrone, A.; Henderson, T.; Ranasinghe, D.; Zakrzewski, V. G.; Gao, J.; Rega, N.; Zheng, G.; Liang, W.; Hada, M.; Ehara, M.; Toyota, K.; Fukuda, R.; Hasegawa, J.; Ishida, M.; Nakajima, T.; Honda, Y.; Kitao, O.; Nakai, H.; Vreven, T.; Throssell, K.; Montgomery, J. A., Jr.; Peralta, J. E.; Ogliaro, F.; Bearpark, M. J.; Heyd, J. J.; Brothers, E. N.; Kudin, K. N.; Staroverov, V. N.; Keith, T. A.; Kobayashi, R.; Normand, J.; Raghavachari, K.; Rendell, A. P.; Burant, J. C.; Iyengar, S. S.; Tomasi, J.; Cossi, M.; Millam, J. M.; Klene, M.; Adamo, C.; Cammi, R.; Ochterski, J. W.; Martin, R. L.; Morokuma, K.; Farkas, O.; Foresman, J. B.; Fox, D. J. Gaussian 16 Revision A.03. 2016; Gaussian Inc. Wallingford CT
- Becke 1993 Becke, A. D. Density-Functional Thermochemistry. 3. The Role of Exact Exchange. J. Chem. Phys. 1993, 98, 5648–5652
- Stephens et al. 1994 Stephens, P. J.; Devlin, F. J.; Chabalowski, C. F.; Frisch, M. J. Ab Initio Calculation of Vibrational Absorption and Circular Dichroism Spectra Using Density Functional Force Fields. J. Phys. Chem. 1994, 98, 11623–11627
- Adamo and Barone 1999 Adamo, C.; Barone, V. Toward Reliable Density Functional Methods Without Adjustable Parameters: the PBE0 Model. J. Chem. Phys. 1999, 110, 6158–6170
- Ernzerhof and Scuseria 1999 Ernzerhof, M.; Scuseria, G. E. Assessment of the Perdew–Burke–Ernzerhof Exchange-Correlation Functional. J. Chem. Phys. 1999, 110, 5029–5036
- Zhao and Truhlar 2008 Zhao, Y.; Truhlar, D. G. The M06 Suite of Density Functionals for Main Group Thermochemistry, Thermochemical Kinetics, Noncovalent Interactions, Excited States, and Transition Elements: Two New Functionals and Systematic Testing of Four M06-Class Functionals and 12 Other Functionals. Theor. Chem. Acc. 2008, 120, 215–241
- Yanai et al. 2004 Yanai, T.; Tew, D. P.; Handy, N. C. A New Hybrid Exchange-Correlation Functional Using the Coulomb-Attenuating Method (CAM-B3LYP). Chem. Phys. Lett. 2004, 393, 51–56
- Chai and Head-Gordon 2008 Chai, J. D.; Head-Gordon, M. Long-range Corrected Hybrid Density Functionals with Damped Atom–Atom Dispersion Corrections. Phys. Chem. Chem. Phys. 2008, 10, 6615–6620
- Folkestad et al. 2020 Folkestad, S. D.; Kjønstad, E. F.; Myhre, R. H.; Andersen, J. H.; Balbi, A.; Coriani, S.; Giovannini, T.; Goletto, L.; Haugland, T. S.; Hutcheson, A.; Høyvik, I.-M.; Moitra, T.; Paul, A. C.; Scavino, M.; Skeidsvoll, A. S.; Tveten, Å. H.; Koch, H. eT 1.0: An Open Source Electronic Structure Program with Emphasis on Coupled Custer and Multilevel Methods. J. Chem. Phys. 2020, 152, 184103
- Parrish et al. 2017 Parrish, R. M.; Burns, L. A.; Smith, D. G. A.; Simmonett, A. C.; DePrince, A. E.; Hohenstein, E. G.; Bozkaya, U.; Sokolov, A. Y.; Di Remigio, R.; Richard, R. M.; Gonthier, J. F.; James, A. M.; McAlexander, H. R.; Kumar, A.; Saitow, M.; Wang, X.; Pritchard, B. P.; Verma, P.; Schaefer, H. F.; Patkowski, K.; King, R. A.; Valeev, E. F.; Evangelista, F. A.; Turney, J. M.; Crawford, T. D.; Sherrill, C. D. Psi4 1.1: An Open-Source Electronic Structure Program Emphasizing Automation, Advanced Libraries, and Interoperability. J. Chem. Theory Comput. 2017, 13, 3185–3197
- Oddershede et al. 1985 Oddershede, J.; Grūner, N. E.; Diercksen, G. H. Comparison Between Equation of Motion and Polarization Propagator Calculations. Chem. Phys. 1985, 97, 303–310
- Ben-Shlomo and Kaldor 1990 Ben-Shlomo, S. B.; Kaldor, U. N2 Excitations Below 15 eV by the Multireference Coupled-Cluster Method. J. Chem. Phys. 1990, 92, 3680–3682
- Neugebauer et al. 2004 Neugebauer, J.; Baerends, E. J.; Nooijen, M. Vibronic Coupling and Double Excitations in Linear Response Time-Dependent Density Functional Calculations: Dipole-Allowed States of N2. J. Chem. Phys. 2004, 121, 6155–6166
- Loos and Jacquemin 2020 Loos, P.-F.; Jacquemin, D. Is ADC(3) as Accurate as CC3 for Valence and Rydberg Transition Energies? J. Phys. Chem. Lett. 2020, 11, 974–980
- Casanova-Páez et al. 2019 Casanova-Páez, M.; Dardis, M. B.; Goerigk, L. B2PLYP and B2GPPLYP: The First Two Double-Hybrid Density Functionals with Long-Range Correction Optimized for Excitation Energies. J. Chem. Theory Comput. 2019, 15, 4735–4744
- Peach et al. 2008 Peach, M. J. G.; Benfield, P.; Helgaker, T.; Tozer, D. J. Excitation Energies in Density Functional Theory: an Evaluation and a Diagnostic Test. J. Chem. Phys. 2008, 128, 044118
- Kánnár et al. 2017 Kánnár, D.; Tajti, A.; Szalay, P. G. Accuracy of Coupled Cluster Excitation Energies in Diffuse Basis Sets. J. Chem. Theory Comput. 2017, 13, 202–209
- Casida et al. 1998 Casida, M. E.; Jamorski, C.; Casida, K. C.; Salahub, D. R. Molecular Excitation Energies to High-Lying Bound States from Time-Dependent Density-Functional Response Theory: Characterization and Correction of the Time-Dependent Local Density Approximation Ionization Threshold. J. Chem. Phys. 1998, 108, 4439–4449
- Tozer and Handy 1998 Tozer, D. J.; Handy, N. C. Improving Virtual Kohn–Sham Orbitals and Eigenvalues: Application to Excitation Energies and Static Polarizabilities. J. Chem. Phys. 1998, 109, 10180–10189