Stecchini, P. E. et al
*
+IFSP, Av. Bahia 1739, 11685-071 Caraguatatuba-SP, Brazil
On the behavior of the black hole candidate 1E 1740.72942’s corona based on long-term INTEGRAL database
Abstract
One of the most straightforward ways to explain the hard X-ray spectra observed in X-ray binaries is to assume that comptonization of soft photons from the accretion disk is occurring. The region where this process takes place, called the corona, is characterized by only two parameters: its thermal energy and its optical depth . Hard X-ray spectra analysis is, thus, an imperative tool in diagnosing the behavior of these parameters. The lack of consistency in obtaining/analysing long-term databases, however, may have been hindering this kind of characterization from being attained. With the aim of better understanding the corona behavior in the black hole candidate 1E 1740.72942, we performed a homogeneous analysis for a large hard X-ray data set from the ISGRI telescope on-board the INTEGRAL satellite. Results from modelling the spectra show that, for most of our sample, unsaturated thermal comptonization is the main mechanism responsible for the hard X-ray spectra observed in 1E 1740.72942. Moreover, such extensive database allowed us to produce what is probably the longest hard X-ray light curve of 1E 1740.72942 and whose units – due to recent findings regarding dynamical quantities of the system – could be expressed in % of Eddington’s luminosity.
keywords:
X-rays: binaries, X-rays: general, black hole physics, surveys1 Introduction
The object 1E 1740.72942 (or simply 1E) is one amongst many strong hard X-ray emitting sources in the Galactic Center region. Although practically none is known about its probable counterpart, 1E is believed to be a black hole in a X-ray binary system due to its spectral similarities to Cyg X-1. Previous studies with relatively large data sets show that 1E spends most of its time in the so-called low/hard state of emission (e.g. Del Santo \BOthers., \APACyear2005, Castro \BOthers., \APACyear2014, Stecchini \BOthers., \APACyear2017), a state in which the hard spectra are well described by comptonization models.
In this present study, we report on the analysis of a large hard X-ray database of 1E conducted to better comprehend how the physical quantities that characterize the corona region of the system behave. Given the spectral coverage and the amount of spectra that such analysis demands, we made use of public available data from the ISGRI telescope (Lebrun \BOthers., \APACyear2003), which, due to the regular monitoring of the source by the INTEGRAL (Winkler \BOthers., \APACyear2003) satellite, certainly provides the largest hard X-ray spectra database of 1E. The IBIS software (Goldwurm \BOthers., \APACyear2003) was used to homogeneously reduce a set of 479 INTEGRAL revolutions, that spans approximately 15 years; the fitting procedures were then performed within the analysis package environment XSPEC (Arnaud, \APACyear1996). By applying simple and widely used models to fit the data, we were able to verify that unsaturated comptonization describes most hard X-ray spectra of 1E very well, for a wide variety of spectral indices or luminosities. Other results, as well as details on data selection and analysis, are described in the following sections.
2 Data selection and analysis
We retrieved from the INTEGRAL database all observations (or revolutions) comprised between 2003–2017 that contained 1E 1740.72942 in the field-of-view. With the aid of ISGRI tools for data reduction, an automatic script was developed to reduce (i.e. extract workable 20–200 keV spectra from) these revolutions; a total number of 479 spectra of 1E were obtained. From these, 392 remained after we excluded those whose count’s signal-to-noise ratio in the 20–200 keV band were below a threshold of 5. Another script was developed, under the XSPEC suite, to automatically perform the fitting to the 392 spectra by two models: a phenomenological power-law (powerlaw in XSPEC notation) and a model that deals with comptonization of low energy X-ray seed photons by an electron corona, comptt (Titarchuk, \APACyear1994). The first is parametrized by the spectral index, , and the second is dependent on the thermal energy and optical depth of the corona, as well as on the accretion disk’s inner temperature. This latter parameter was let free to vary only between 0.1 and 0.4 keV based on previous reported values (e.g. Castro \BOthers., \APACyear2014). Considering acceptable fits those whose 2, 283 spectra were fitted by powerlaw, 284 by comptt and 250 by both models jointly.
Before proceeding to the comptonization analysis, we have computed the 20–200 keV flux for each of the spectra fitted by the powerlaw in order to build a light curve. Given that estimates of the distance to the system (8 kpc, Tetarenko \BOthers., \APACyear2020) and of the black hole mass (5 M⊙, Stecchini \BOthers., \APACyear2020) have been recently reported, we are able to present this light curve in units of /. For the 109 spectra not fitted – within the criterion mentioned – by a single power-law, polynomial adjusts were made so the fluxes could be calculated and a more complete light curve could be produced. The resulting curve, with 392 points covering from MJD 52700 to MJD 58000, is shown in Figure 1.

3 Comptonization and the Corona in 1E 1740.72942
Comptonization is one major radiative process in astrophysics (Rybicki \BBA Lightman, \APACyear1979). The implementation of the simplest comptonization model in XSPEC came very quickly (compst; Sunyaev \BBA Titarchuk, \APACyear1980), and was promptly used to explain the high energy spectrum of Cyg X-1, a very well studied black hole. An improvement to this model, comptt, demanded some more time for implementation ( 1994) and still is, despite being over 25 years old now, one of the most used comptonization models.
Our goal is to study the corona in 1E 1740.72942 by correlating the physical quantities provided by comptt with the spectral indices obtained from the powerlaw fit. The basic approach is explained as follows.
If an up-scatter (i.e., a photon gains energy from an electron) occurs in a (so-called) thermal regime by a non-relativistic population of electrons, Titarchuk \BBA Lyubarskij (\APACyear1995) show that the slope – i.e. the power-law index – of the resulting spectrum shape must be tied to the values of and from the corona. An important quantity, that may be used to discriminate the comptonization’s regime and to correlate the physical parameters of the corona with the spectral index observed, is the Compton parameter . This parameter is (roughly) defined as the average change in a photon’s energy multiplied by the average number of scatterings a photon will suffer before leaving the corona; a general expression for computing from and is found, e.g., in Equation 2 of Petrucci \BOthers. (\APACyear2001). In an unsaturated comptonization regime, is likely to assume values of 1 and the expected spectral index may be calculated from it, as shown in the equation for presented in pp. 1281 of Steiner \BOthers. (\APACyear2009). To explore the comptonization nature of our spectra, we computed from each – pair obtained from the comptt fit, calculated the “predicted” indices (to be called the comptonization or ) and further compared these latter with the indices provided by the powerlaw fits. For this comparison to be possible, instead of using the 284 spectra fitted by only comptt, we proceeded with the 250 spectra fitted by both models.
One additional criterion was employed prior to using the comptt output parameters: it is pointed out in Hua \BBA Titarchuk (\APACyear1995) and Titarchuk \BBA Lyubarskij (\APACyear1995) that, to assure that only acceptable physical values are being provided by the model, the pairs – must satisfy certain relations. In other words, there is an applicability region beyond which comptt results should not be used (a diagram of this region can be found in Figure 7 of Hua \BBA Titarchuk, \APACyear1995). When placing the 250 spectra in this diagram (that we will refer to soon), 171 were within the zone of applicability and, thus, continued in the analysis.
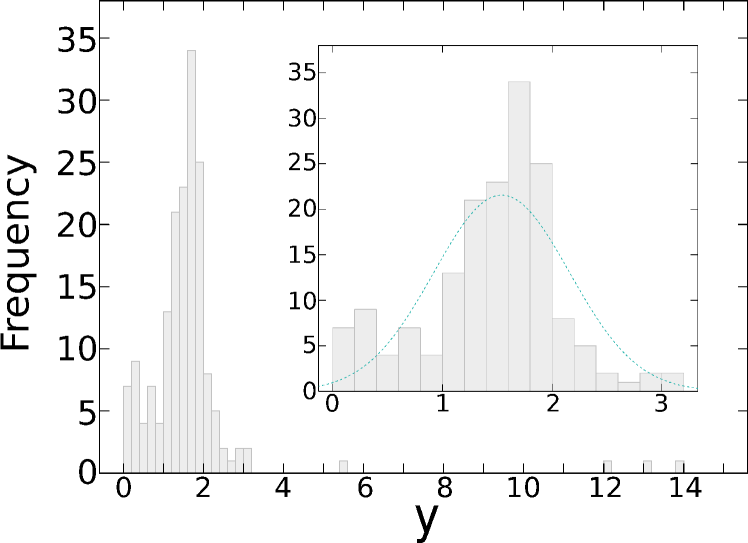
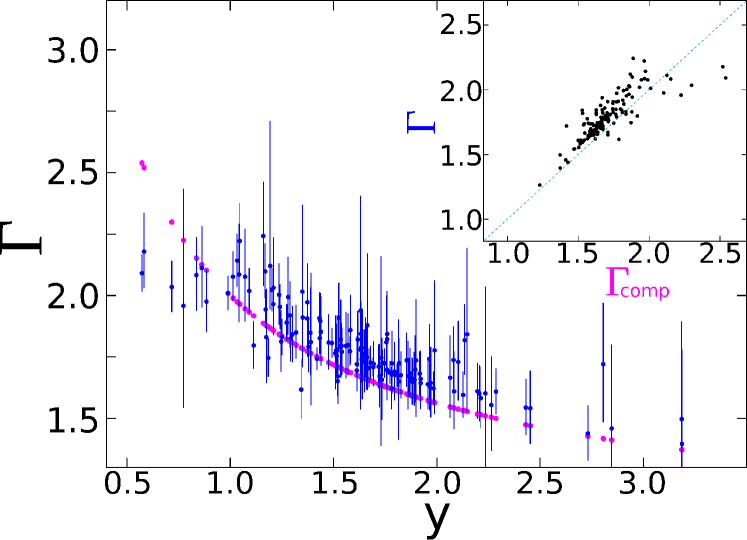
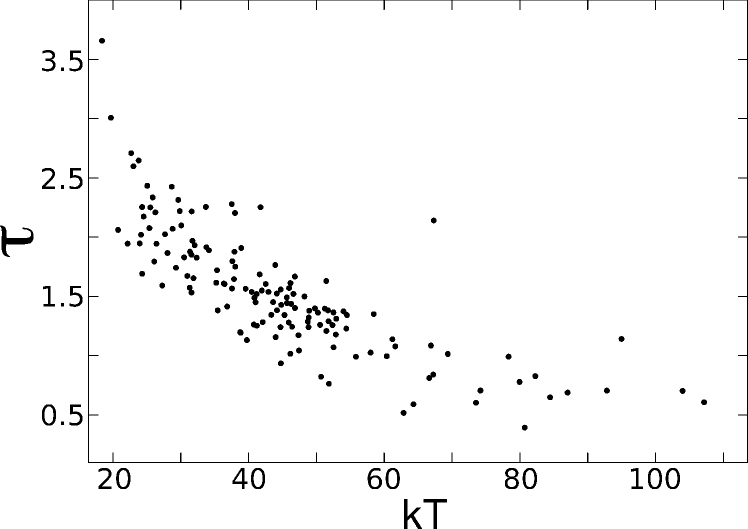
The compton parameter frequency distribution for the remaining 171 spectra is presented in Figure 2. A zoom, excluding the sparse occurrences above 3, is also shown. The median value (and dispersion) for this particular range is 1.54 0.59. These values already indicate that unsaturated comptonization is dominant amongst the spectra. However, since establishing which values of are to be considered close to 1 is a bit vague, we proceeded and calculated for all 171 data points. Once this expression should only be valid for cases in which 1, by using from the powerlaw fit as a proxy and comparing with , we can constrain better what range of values represent the unsaturated regime for 1E. Hence, we select only those whose two values are coincident within 20% of agreement. The result of this procedure, which selected 144 spectra, is shown in Figure 3. The median and dispersion values for all the quantities displayed are: = 1.63 0.55, = 1.76 0.17 and = 1.67 0.19. The values for and for these 144 selected points are = 43 17 (keV) and = 1.5 0.5; their correlation is presented in Figure 4.
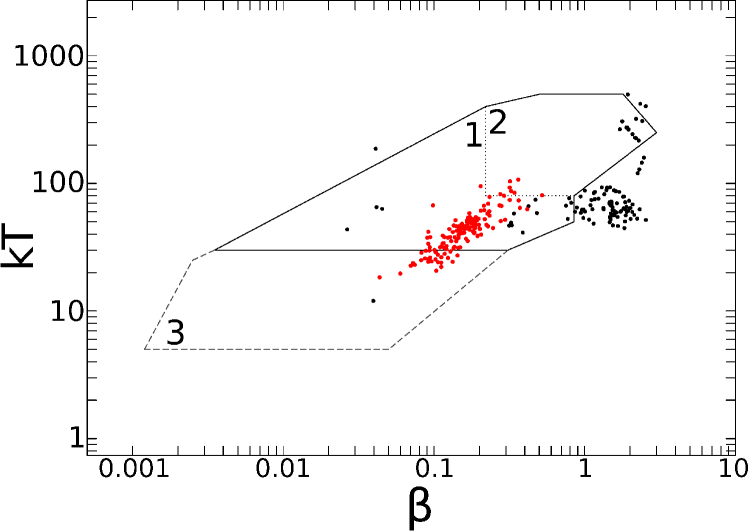
Based on the diagram presented in Figure 7 of Hua \BBA Titarchuk (\APACyear1995), we indicate, in Figure 5, the position of all 250 spectra in the applicability zone aforementioned. The parameter, that depends only on , was calculated for each spectra from Equation 3 of Hua \BBA Titarchuk (\APACyear1995) for the non-spherical geometry case. In the diagram of Figure 5, data points inside regions 1 and 2 correspond to characteristic spectra of optically thick and thin coronas, respectively; in region 3, the classification becomes less clear (Hua \BBA Titarchuk, \APACyear1995). Points within any of these regions are inside the applicability zone of comptt. The 144 cases in which and agreed within 20% points are drawn in red.
4 Discussion and final remarks
We have presented the results from modelling a great number of hard X-ray (20–200 keV) spectra of the black hole candidate 1E 1740.72942. An (almost) immediate outcome of the analysis was that, thanks to the extension and quality of INTEGRAL database, we were able to produce what is perhaps the longest hard X-ray light curve of 1E, which, due to recent estimates of the distance to and the mass of the compact object, could be displayed here in the convenient units of /.
It is worth mentioning that provided for the 283 spectra fitted by the powerlaw varied between 1.3–2.4, with a median value of 1.8 0.2. This range is compatible with a black hole in the low/hard state (Remillard \BBA McClintock, \APACyear2006) and reaffirms 1E’s permanency in this condition.
Regarding the corona, after employing a few selection criteria to avoid misusing the results of comptt, we have come to a total of 171 spectra. In 144 (roughly 85%), the equation to compute from the corona’s physical parameters worked very well in “reproducing” the spectral shape observed (using as proxy the slope from a power-law fit). This suggests that the (hard) spectral variations of 1E may be explained by means of only and . Recalling that the approximation is valid only for the unsaturated comptonization regime, we can state that this is the predominant regime for the corona in 1E. Moreover, their position in the diagram of Figure 5 indicate a predominantly optically thick corona as well. A closer look at the spectra that deviated from a power-law and at the few whose indices did not match the ones calculated from and is required for a more complete characterization and understanding of 1E’s corona behavior.
It is discussed in Banerjee \BOthers. (\APACyear2020) that a diagram may be used to distinguish whether the compact object in a X-ray binary is a neutron star or a black hole. Considering the (likely) black hole nature of 1E, we can assert that our results marginally corroborate the authors’ claim that black holes occupy a slightly upper region in such diagram (see, e.g., their Figure 1).
At last, however we find that the spectral changes in 1E 1740.72942 are, most of the time, driven by variations in the corona, neither nor and seem to be correlated with the 20–200 keV flux observed. Two possible explanations for the long flux excursions (see, e.g Figure 1) are i) a geometrically stable corona that is eventually partially obscured or ii) a corona whose size is in fact changing. By any means, our study does not allow us to make further assertions regarding this matter.
Acknowledgements
PES acknowledges FAPESP for financial support under grant #2017/13351-6. JL acknowledges Instituto Federal de São Paulo, IFSP/CAR, #2018/2.340.
References
- Arnaud (\APACyear1996) \APACinsertmetastararnaud1996{APACrefauthors}Arnaud, K\BPBIA. \APACrefYearMonthDay1996, \BBOQ\APACrefatitleAstr. Soc. Pac. Conf. Series Astr. Soc. Pac. Conf. Series.\BBCQ \BIn \BVOL 101, \BPG 17. \PrintBackRefs\CurrentBib
- Banerjee \BOthers. (\APACyear2020) \APACinsertmetastarBanerjee2020{APACrefauthors}Banerjee, S., Gilfanov, M., Bhattacharyya, S.\BCBL \BBA Sunyaev, R. \APACrefYearMonthDay2020, \APACjournalVolNumPagesMNRAS4985353. \PrintBackRefs\CurrentBib
- Castro \BOthers. (\APACyear2014) \APACinsertmetastarmanu2014{APACrefauthors}Castro, M., D’Amico, F., Braga, J., Maiolino, T., Pottschmidt, K.\BCBL \BBA Wilms, J. \APACrefYearMonthDay2014, \APACjournalVolNumPagesA&A569A82. \PrintBackRefs\CurrentBib
- Del Santo \BOthers. (\APACyear2005) \APACinsertmetastarsanto2005{APACrefauthors}Del Santo, M., Bazzano, A., Zdziarski, A. et al. \APACrefYearMonthDay2005, \APACjournalVolNumPagesA&A433613–617. \PrintBackRefs\CurrentBib
- Goldwurm \BOthers. (\APACyear2003) \APACinsertmetastargoldwurm2003{APACrefauthors}Goldwurm, A., David, P., Foschini, L. et al. \APACrefYearMonthDay2003, \APACjournalVolNumPagesA&A411L223. \PrintBackRefs\CurrentBib
- Hua \BBA Titarchuk (\APACyear1995) \APACinsertmetastarHuaTita95{APACrefauthors}Hua, X.\BCBT \BBA Titarchuk, L. \APACrefYearMonthDay1995, \APACjournalVolNumPagesApJ449188. \PrintBackRefs\CurrentBib
- Lebrun \BOthers. (\APACyear2003) \APACinsertmetastarlebrun2003{APACrefauthors}Lebrun, F., Leray, J\BPBIP., Lavocat, P. et al. \APACrefYearMonthDay2003, \APACjournalVolNumPagesA&A411L141. \PrintBackRefs\CurrentBib
- Petrucci \BOthers. (\APACyear2001) \APACinsertmetastarPetrucci2001{APACrefauthors}Petrucci, P\BPBIO., Merloni, A., Fabian, A., Haardt, F.\BCBL \BBA Gallo, E. \APACrefYearMonthDay2001, \APACjournalVolNumPagesMNRAS328501. \PrintBackRefs\CurrentBib
- Remillard \BBA McClintock (\APACyear2006) \APACinsertmetastarRemMc2006{APACrefauthors}Remillard, R\BPBIA.\BCBT \BBA McClintock, J\BPBIE. \APACrefYearMonthDay2006, \APACjournalVolNumPagesARAA4449. \PrintBackRefs\CurrentBib
- Rybicki \BBA Lightman (\APACyear1979) \APACinsertmetastarRybLi1979{APACrefauthors}Rybicki, G\BPBIB.\BCBT \BBA Lightman, A\BPBIP. \APACrefYear1979, \APACrefbtitleWiley-Interscience Publication Wiley-Interscience Publication (\PrintOrdinal1 \BEd). \APACaddressPublisherNew YorkJohn Wiley & Sons. \PrintBackRefs\CurrentBib
- Stecchini \BOthers. (\APACyear2017) \APACinsertmetastardudu2017{APACrefauthors}Stecchini, P\BPBIE., Castro, M., Jablonski, F., D’Amico, F.\BCBL \BBA Braga, J. \APACrefYearMonthDay2017, \APACjournalVolNumPagesApJ843L10. \PrintBackRefs\CurrentBib
- Stecchini \BOthers. (\APACyear2020) \APACinsertmetastardudu2020{APACrefauthors}Stecchini, P\BPBIE., D’Amico, F., Jablonski, F., Castro, M.\BCBL \BBA Braga, J. \APACrefYearMonthDay2020, \APACjournalVolNumPagesMNRAS4932694. \PrintBackRefs\CurrentBib
- Steiner \BOthers. (\APACyear2009) \APACinsertmetastarSteiner09{APACrefauthors}Steiner, J\BPBIF., Narayan, R., McClintock, J\BPBIE.\BCBL \BBA Ebisawa, K. \APACrefYearMonthDay2009, \APACjournalVolNumPagesPASP1211279. \PrintBackRefs\CurrentBib
- Sunyaev \BBA Titarchuk (\APACyear1980) \APACinsertmetastarSunyTita80{APACrefauthors}Sunyaev, R\BPBIA.\BCBT \BBA Titarchuk, L\BPBIG. \APACrefYearMonthDay1980, \APACjournalVolNumPagesA&A500167. \PrintBackRefs\CurrentBib
- Tetarenko \BOthers. (\APACyear2020) \APACinsertmetastartetarenko2020{APACrefauthors}Tetarenko, A\BPBIJ., Rosolowsky, E\BPBIW., Miller-Jones, J\BPBIC\BPBIA.\BCBL \BBA Sivakoff, G\BPBIR. \APACrefYearMonthDay2020, \APACjournalVolNumPagesMNRAS4973504. \PrintBackRefs\CurrentBib
- Titarchuk (\APACyear1994) \APACinsertmetastarTita94{APACrefauthors}Titarchuk, L. \APACrefYearMonthDay1994, \APACjournalVolNumPagesApJ434570. \PrintBackRefs\CurrentBib
- Titarchuk \BBA Lyubarskij (\APACyear1995) \APACinsertmetastarTitaLyu95{APACrefauthors}Titarchuk, L.\BCBT \BBA Lyubarskij. \APACrefYearMonthDay1995, \APACjournalVolNumPagesApJ450876. \PrintBackRefs\CurrentBib
- Winkler \BOthers. (\APACyear2003) \APACinsertmetastarwinkler2003{APACrefauthors}Winkler, C., Courvoisier, T\BPBIJ\BPBIL., Di Cocco, G. et al. \APACrefYearMonthDay2003, \APACjournalVolNumPagesA&A411L1. \PrintBackRefs\CurrentBib