ALMA CO Observations of the Gamma-Ray Supernova Remnant RX J1713.73946:
Discovery of Shocked Molecular Cloudlets and Filaments at 0.01 pc scales
Abstract
RX J1713.73946 is a unique core-collapse SNR that emits bright TeV gamma-rays and synchrotron X-rays caused by cosmic rays, in addition to interactions with interstellar gas clouds. We report here on results of ALMA 12CO(=1–0) observations toward the northwestern shell of the SNR. We newly found three molecular complexes consisting of dozens of shocked molecular cloudlets and filaments with typical radii of 0.03–0.05 pc and densities of cm-3. These cloudlets and filaments are located not only along synchrotron X-ray filaments, but also in the vicinity of X-ray hotspots with month or year-scale time variations. We argue that X-ray hotspots were generated by shock-cloudlet interactions through magnetic-field amplification up to mG. The ISM density contrast of , coexistence of molecular cloudlets and low-density diffuse medium of 0.1 cm-3, is consistent with such a magnetic field amplification as well as a wind-bubble scenario. The small-scale cloud structures also affect hadronic gamma-ray spectra considering the magnetic field amplification on surface and inside clouds.
1 Introduction
Galactic cosmic rays are believed to be accelerated by shockwaves in supernova remnants (SNR) via the diffusive shock acceleration (DSA; Bell, 1978; Blandford & Ostriker, 1978), and cosmic ray induced non-thermal radiation has been predicted and/or detected from various SNRs (e.g., Aharonian et al., 1994; Drury et al., 1994). In general, the classical DSA theory assumes uniform density distribution of the interstellar medium (ISM) surrounding SNRs. However, observational results indicated that non-thermal X-ray and/or gamma-ray bright SNRs are tightly interacting with dense and clumpy gaseous medium such as molecular and atomic clouds (e.g., Fukui et al., 2003, 2017; Aharonian et al., 2008; Zhou et al., 2016; Sano et al., 2020). A key issue at present is how shock-cloud interaction affects radiation processes of the non-thermal radiation, as well as acceleration mechanisms of cosmic rays beyond the DSA.
The core-collapse SNR RX J1713.73946 (a.k.a. G347.30.5) provides the best laboratory to test the effect because of its bright non-thermal X-rays and TeV gamma-rays (e.g., Koyama et al., 1997; Aharonian et al., 2004), in addition to certain interactions with dense gas clouds at the closed distance of 1 kpc (e.g., Fukui et al., 2003; Moriguchi et al., 2005; Sano et al., 2010; Maxted et al., 2012) and its young age of 1600 yr (Wang et al., 1997; Fukui et al., 2003; Tsuji & Uchiyama, 2016). The X-rays are dominated by synchrotron radiation up to 120 keV (e.g., Slane et al., 1999; Tanaka et al., 2008; Tsuji et al., 2019; Kuznetsova et al., 2019). Chandra observations discovered year-scale time variability of X-ray hotspots on the order of 10 arcsec or 0.05 pc widths as well as X-ray filaments of 0.1–0.2 pc widths, indicating efficient cosmic-ray acceleration with amplified magnetic field (Uchiyama et al., 2007; Higurashi et al., 2020). The TeV gamma-ray observations of RX J1713.73946 revealed its shell-like morphology with photon energies from 200 GeV to 40 TeV (Aharonian et al., 2004, 2006, 2007; H.E.S.S. Collaboration et al., 2018). Despite a number of efforts to model the broad-band spectra, the origin of gamma-rays—hadronic, leptonic, or a combination of both—was not clearly established because all scenarios could reproduce the observed spectra (see H.E.S.S. Collaboration et al. 2018 and references therein).
Investigating the interstellar gas associated with RX J1713.73946 holds a key to understanding the radiation processes and efficient acceleration of cosmic-rays. Fukui et al. (2012) presented a good spatial correspondence between the TeV gamma-rays and ISM proton column density. This provides an essential condition for gamma-rays to be predominantly of hadronic origin. Sano et al. (2010, 2013) found limb-brightening of synchrotron X-rays toward shocked molecular clouds with a size of 3 pc, where the small photon indices of synchrotron X-rays are seen (Sano et al., 2015; Okuno et al., 2018). The authors proposed a possible scenario that the shock-cloud interaction generates turbulence that enhances magnetic field and synchrotron X-rays on the surface of shocked clouds. Moreover, the enhanced turbulence and/or magnetic field may re-accelerate electrons into higher energy. This interpretation is also supported by numerical results, and well explains the observed broad-band spectra without bright thermal X-rays (e.g., Inoue et al., 2009, 2012; Celli et al., 2019). However, previous studies could not spatially resolve tiny molecular clouds relating to the X-ray hotspots and filaments at 0.05 pc scales which were predicted by Inoue et al. (2009).
We report here on results of ALMA CO observations toward the northwestern shell of RX J1713.73946 with a spatial resolution of 0.02 pc. Our findings for complexes of molecular cloudlets at 0.01 pc provide a new perspective on the ISM surrounding core-collapse SNRs.
2 Results
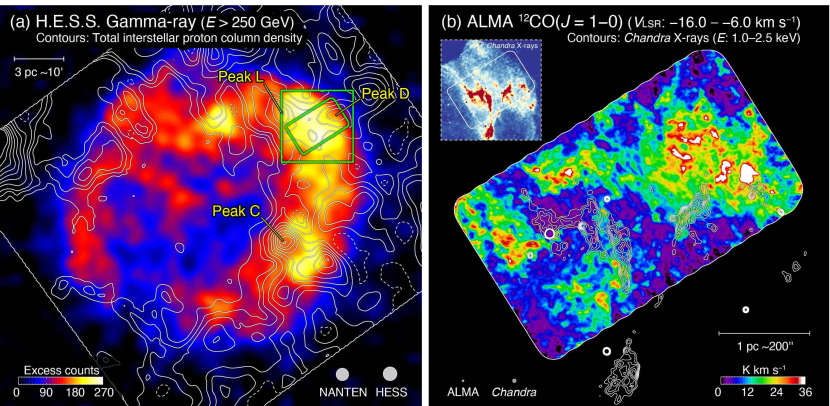
Figure 1a shows the overall TeV gamma-ray morphology of RX J1713.73946 (H.E.S.S. Collaboration et al., 2018). The TeV gamma-ray shell shows a good spatial correspondence with the total interstellar proton column density contours (Fukui et al., 2012). For the dense star-forming core named as peak C, TeV gamma-ray intensity is reduced respect to its surroundings. Note that the brightest TeV gamma-ray spot is located in the northwestern shell, especially in the intermediate region of peaks D and L. The intercloud region also bright in X-rays with filamentary structures.
| Name | Size | Mass | ||||||
|---|---|---|---|---|---|---|---|---|
| (h m s) | (∘ ) | (K) |
(km ) |
(km ) |
(pc) | () | (cm-3) | |
| (1) | (2) | (3) | (4) | (5) | (6) | (7) | (8) | (9) |
| CL1 ………… | 17 12 02.95 | 39 32 20.4 | 0.08 | 0.37 | ||||
| CL2 ………… | 17 12 02.50 | 39 32 06.7 | 0.07 | 0.27 | ||||
| CL3 ………… | 17 12 06.48 | 39 31 14.7 | 0.06 | 0.08 | ||||
| CL4 ………… | 17 11 57.33 | 39 32 08.1 | 0.10 | 0.33 | ||||
| CL5 ………… | 17 11 53.17 | 39 31 21.3 | 0.10 | 0.47 | ||||
| CL6 ………… | 17 11 52.72 | 39 33 35.2 | 0.07 | 0.08 |
Note. — Col. (1): Cloudlet name. Cols. (2–9): Observed properties of cloudlets obtained by single Gaussian fitting with 12CO(=1–0) emission line. Cols. (2)–(3): Position of cloudlets. Col. (4): Maximum brightness temperature. Col. (5): Central velocity. Col. (6): FWHM linewidth. Col. (7): Effective diameter of cloudlets defined as , where is the surface area of cloudlets surrounded by a contour of the half level of maximum integrated intensity. Col. (8): Mass of cloudlets defined as , where is the atomic hydrogen mass, is the mean molecular weight, is the distance to the SNR, is the solid angle in a spatial pixel, and () is molecular hydrogen column density for each pixel. We used and an equation of (K km s-1)-1 cm-2, where (CO) is the CO integrated intensity (Bertsch et al., 1993). Col. (9): Number density of molecular hydrogen .
Figure 1b shows the 12CO(=1–0) integrated intensity map obtained using ALMA (see Appendix A.1 for detailed information of observations and data reduction). The integration range of – km s-1 is typical radial velocity in the northwestern molecular clouds, which is certainly associated with RX J1713.73946 (e.g., Fukui et al., 2003, 2012; Moriguchi et al., 2005; Sano et al., 2010, 2013, 2015; Maxted et al., 2012). We newly identified three molecular complexes with a size of 1 pc toward the southeastern half of the ALMA observed area, in addition to the previously known molecular cloud peak D. The X-ray bright filaments as shown by contours are nicely along not only with the three molecular complexes (hereafter RXJ1713NW-East), but also with a part of the molecular cloud peak D (hereafter RXJ1713NW-West). It is noteworthy that intercloud diffuse regions show significantly low intensity (purple colored areas), whereas there are several tiny CO clumps with a size on the order of 0.01 pc. We hereafter refer to the tiny CO clumps as “molecular cloudlets.”
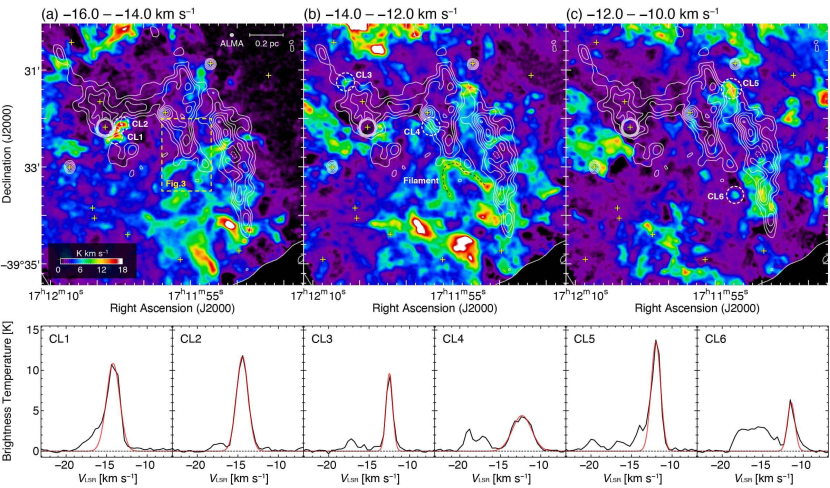
Figures 2a–2c show the velocity channel maps of ALMA CO toward RXJ1713NW-East. We confirmed that one of the newly identified molecular complexes is consisting of dozens of molecular cloudlets (e.g., CL1–6) and filaments (e.g., Figure 2b, 0.06 pc width). Almost all the molecular cloudlets and filaments are spatially associated with the X-ray filaments, but the X-ray minor peaks and X-ray hotspots identified by Higurashi et al. (2020) are located in the intercloud regions. The typical spatial separations between X-ray minor peaks or hotspots and nearest CO intensity peaks are 0.05–0.15 pc. Figure 2 bottom panels show CO line profiles of the typical molecular cloudlets CL1–6 which are located near the X-ray filaments and hotspots without contamination. All the sampled molecular cloudlets are significantly detected, and show the narrow velocity width ( km s-1) except for CL4. Although wing-like profiles are seen toward CL1 and CL5, these can be explained by other overlapped molecular cloudlets. The physical properties of molecular cloudlets CL1–6 are summarized in Table 1. The typical diameters and masses of molecular cloudlets are 0.06–0.10 pc and 0.1–0.5 , respectively. The number densities of molecular cloudlets are a few 104 cm-3, which were obtained using a CO-to-H2 conversion factor (see Table 1 note).
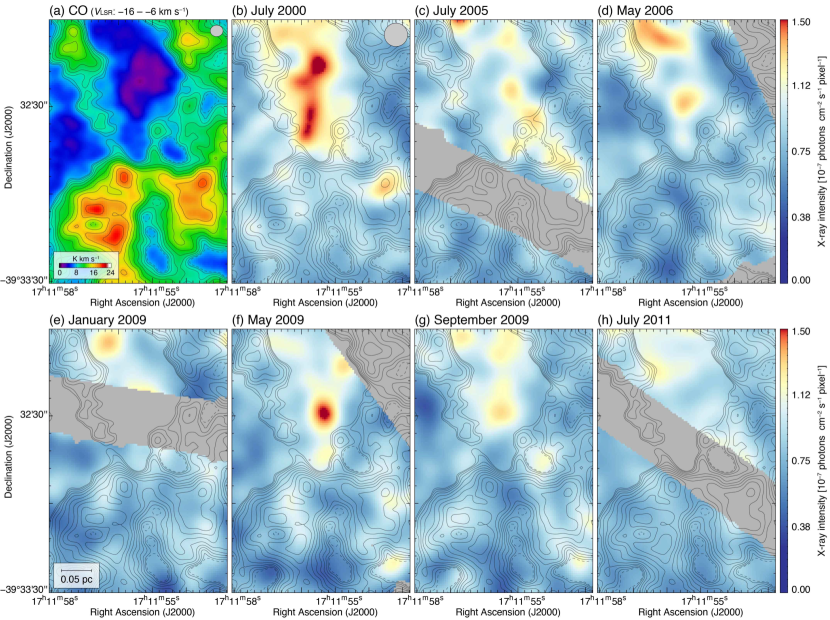
Figure 3 shows the enlarged view of the X-ray filament from which flux time variability was reported by Uchiyama et al. (2007). We compared spatial distributions of CO and X-rays for each observing epoch (see Appendix A.2 for detailes). Two X-ray hotspots in July 2000 (Figure 3b) and May 2009 (Figure 3f) are significantly detected. The former was previously reported by Uchiyama et al. (2007), whereas the latter is newly identified (4 above the surrounding level). The latter hotspot was excited within three years and disappeared within four months. It should be also noted that these hotspots are located on the intercloud or low-density region, but not in the direction of dense cloudlets.
3 Discussion
3.1 Origin of highly inhomogeneous density distribution
We spatially resolved shocked molecular cloudlets and filaments toward the northwestern shell of RX J1713.73946. These clumpy structures at 0.01 pc scales coexist with the low-density intercloud medium. We argue that the highly inhomogeneous gas environment provides conclusive evidence for a wind-bubble scenario proposed by Fukui et al. (2012) and Inoue et al. (2012). Before the supernova explosion, the high-mass progenitor of RX J1713.73946 ejected its outer hydrogen layer as stellar winds over a time scale of several years. The pre-existent intercloud diffuse gas was completely swept up and a low-density wind-bubble with a density of 0.01–0.1 cm-3 was created (e.g., Weaver et al., 1977). On the other hand, molecular cloudlets and filaments can survive wind erosion due to their high density 104 cm-3. Moreover, according to synthetic observations of MHD simulation for colliding Hi clouds, 0.1 pc clouds could be newly formed by stellar wind compression (e.g., Fukui et al., 2018; Tachihara et al., 2021). After the passage of the supernova shock wave, dense cloudlets and filaments will not be deformed or evaporated owing to short interacting time. In fact, numerical simulations show that a molecular cloud with the size 0.2 pc and density cm-3 can survive shock erosion at least 300 years after the passage of shocks (Celli et al., 2019). The CO line emission without line-broadening or wing-like profiles also supports this idea.
Note that such inhomogeneous gas density distribution is also expected in other core-collapse SNRs. Further ALMA observations with high special resolution on the order of 0.01 pc are needed for complete understanding the interstellar environment surrounding the SNRs.
3.2 Magnetic field amplification via shock-cloudlet interactions
Uchiyama et al. (2007) discovered X-ray hotspots in the northwestern shell of RX J1713.73946, which show year-scale time variability of X-ray flux with the typical spatial scale of 0.05 pc. Considering the acceleration and radiative cooling time of cosmic-ray electrons, the authors concluded that the time variability was caused by amplified magnetic field of mG. Most recently, Higurashi et al. (2020) presented a detailed analysis of 65 X-ray hotspots; about one-third of them showed year-scale time variabilities and eight hotspots showed monthly variabilities with significance of at least 3. The authors proposed that the time variabilities are caused by dense cloud cores with a density of – cm-3. In the present section, we argue that the observed time variabilities can be understood by the magnetic field amplification through interactions between shockwaves and cloudlets with a density of cm-3.
We estimate the magnetic field strength toward the newly identified X-ray hotspot, following the method by Uchiyama et al. (2007) and Higurashi et al. (2020). The radiative cooling time of electrons can be written as;
| (1) |
where is the photon energy of synchrotron X-rays and is the magnetic field strength. Considering the short decay time of four months and keV, we can obtain 3 mG toward the X-ray hotspot. On the other hand, the acceleration time of electrons can be expressed in terms of gyro-factor and shock velocity as
| (2) |
Adopting observed values of = 1 (Tsuji et al., 2019) and km s-1 (Tsuji & Uchiyama, 2016), the magnetic field strength is estimated to 300 G. Note that it is natural to have different magnetic field in Equations (1) and (2), because cosmic-rays do not need to be accelerated in the same location.
We argue that the strong magnetic field in X-ray hotspots as well as diffuse X-ray filaments was generated by shock-cloudlet interactions. According to MHD simulations by Inoue et al. (2009, 2012), the shock-cloud interaction generates multiple eddies that enhance magnetic field strength up to mG on the surface of dense Hi clouds with a density of cm-3. Subsequent numerical simulation confirmed that the magnetic field is also amplified by interactions between shocks and a molecular clump with a density of cm-3 (Celli et al., 2019). Note that the most enhanced magnetic field is placed 0.4 pc away from the shocked cloud by adopting the cloud size of 0.2 pc and the ISM density contrast of (see Figure 3 in Celli et al., 2019). For the northwestern shell of RX J1713.73946, the ISM density contrast is estimated to considering the electron density in an intercloud region 0.10–0.13 cm-3 (Katsuda et al., 2015) and the cloudlet density cm-3. The highest magnetic field is therefore expected to be 0.12–0.20 pc away from the observed cloudlet with sizes of 0.06–0.10 pc, which is roughly consistent with observed separations between the X-ray hotspots/filaments and cloudlets111Actual spatial separation between cloudlet and the highest magnetic field will be slightly modified considering the shape of shocked cloudlet and projected distance. For the case of Figure 3, we assumed the cylinder shape of shocked cloud as an extension of spherical cloud assumed by Celli et al. (2019)..
The shock-cloudlet interaction may also induce the spectrum modulation of synchrotron X-rays. Previous observational studies also indicate spectral flattening toward the shock interacting region (e.g., Sano et al., 2015; Okuno et al., 2018; Tanaka et al., 2020). Further spatially resolved X-ray spectroscopy based on distributions of molecular clouds reveals such spectrum modulations.
3.3 Prospects for gamma-ray spectra toward the northwestern shell
It is thought that the hadronic gamma-ray shows flat spectrum from the pion-creation threshold energy at 0.1 GeV to the maximum energy achieved by DSA, whereas the leptonic gamma-ray shows hard spectrum instead. Since the Fermi-LAT detected the hard spectrum with photon index of 1.5, this was often used to reject the hadronic gamma-ray scenario from RX J1713.73946 (e.g., Abdo et al., 2011). On the other hand, the hadronic gamma-ray can be harder spectrum by considering the inhomogeneous gas distribution and energy dependent diffusion of cosmic-ray protons (e.g., Gabici et al., 2009; Zirakashvili & Aharonian, 2010; Inoue et al., 2012; Gabici & Aharonian, 2014). In this section, we argue that hadronic gamma-ray spectrum from the northwestern shell of RX J1713.73946 will possibly be flatter than spatially combined spectra.
According to Inoue et al. (2012), the penetration depth of a relativistic particle into molecular clouds can be described as below;
| (3) |
where is the particle energy and is the elapsed time passed since the forward shock encountered the molecular cloud. The magnetic field will be enhanced not only on the surface of shocked clouds via shock interaction, but also inside the clouds caused by cosmic-ray streaming what is called Bell instability (Bell, 2004). Inoue (2019) argued that the Bell instability induced magnetic field amplification prevent further cosmic-ray penetration into shocked clouds by diminishing the diffusion coefficient for the cosmic-ray energy below 1 TeV. Note that the degree of magnetic field amplification depends on path length from the surface of shocked clouds, roughly corresponding to a radius of shocked clouds.
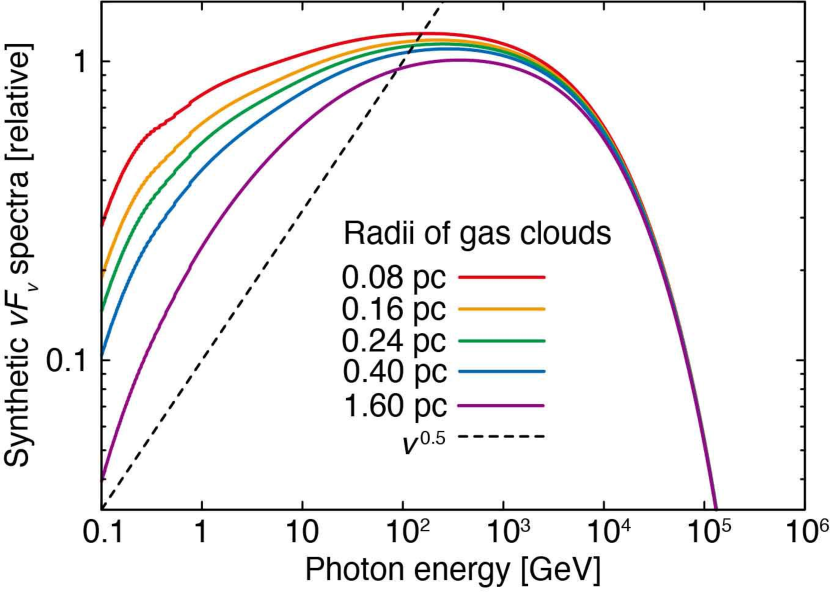
Figure 4 shows spectra of hadronic gamma-rays with various cloud radii. According to Moriguchi et al. (2005), typical radii of molecular clouds associated with the SNR were derived as 1–2 pc. The densest star-forming cloud peak C in the southwestern shell is a typical example with a featureless morphology and central concentration density gradient with an outer radius of 1.5 pc (Sano et al., 2010). Therefore, it is natural to be observed hard gamma-ray spectra ( or photon index of 1.5) when we combined them for the entire remnant (e.g., Abdo et al., 2011). On the other hand, the brightest gamma-ray peak in the northwestern shell is associated with dozens of molecular cloudlets and filaments with typical radii of 0.03–0.05 pc, suggesting that the flatter gamma-ray spectrum will be expected than the case of 0.08 pc in red curve of Figure 4. Future detailed spatially resolved spectroscopy of gamma-ray using the Cherenkov Telescope Array (CTA) has a potential to resolve such spatial difference of gamma-ray spectral shape.
In case we do not detect the gamma-ray spectrum flattening in the northwestern shell of RX J1713.73946 using CTA, it can be explained that the magnetic field in the cloudlet surface is more efficiently enhanced than inside the cloud via the shock-cloudlet interaction. Because smaller cloud size induces shorter time scale of magnetic field amplification even if the maximum magnetic field strength does not depend on the cloud size. Alternatively, the diffusion length of cosmic-rays could be shorter than 0.1 pc if the actual elapsed time in Equation (3) is significantly smaller than 1000 yrs. In fact, CO cloudlets in RXJ1713NW-East have been fully overtaken by the shocks, while the peak D including RXJ1713NW-West is likely now interacting with the forward shock (e.g., Sano et al., 2013). In any case, the clumpy cloud distribution interacting with shockwaves is important in understanding the gamma-ray and X-ray spectra from shock-accelerated cosmic-rays in SNRs.
4 Summary
By using ALMA, we have spatially resolved molecular complexes consisting of the 0.01 pc scale cloudlets and filaments interacting with the northwestern shell of RX J1713.73946, where the brightest TeV gamma-rays and synchrotron X-ray filaments/hotspots are detected. The molecular cloudlets having the typical radii of 0.03–0.05 pc and densities of 104 cm-3 are nicely along with X-ray filaments and hotspots, indicating that magnetic field is amplified through shock-cloudlet interactions. The ISM density contrast is to be , consistent with a wind-bubble scenario. The small-scale structures or density fluctuations of the ISM may induce spectral modulations both the hadronic gamma-rays and synchrotron X-rays, beyond the standard DSA.
Appendix A Observations and Data Reductions
A.1 ALMA CO
Observations of 12CO(=1–0) line emission at 115 GHz were carried out using the ALMA Band 3 (86–116 GHz) during Cycle 5 (PI: H. Sano, proposal ID 2017.1.01406.S). We used 46 antennas of 12-m array, 12 antennas of 7-m array, and four antennas of total power (TP) array. The observed area was rectangular region centered at (, ) (, ). The combined baseline length of 12-m and 7-m arrays is from 8.9 to 313.7 m, corresponding to u-v distances from 3.4 to 120.6 . The data were processed using the Common Astronomy Software Application (CASA; McMullin et al., 2007) package version 5.6.0. We utilized the “tclean” task with natural weighting and “multi-scale” deconvolution algorithm implemented in the CASA package (Cornwell, 2008). We applied “uvtaper” during the clean processes to improve the imaging quality. We combined the cleaned interferometer data (12-m+7-m) and calibrated TP array data by using “feather” task. The beam size of feathered image is with a position angle of , corresponding to a spatial resolution of 0.02 pc at the distance of 1 kpc. The typical noise fluctuations of the feathered image are 0.13 K at a velocity resolution of 0.4 km s-1.
A.2 Chandra X-rays
We utilized archival X-ray data obtained using Chandra, for which the observation IDs are 736, 5560, 6370, 10090, 10091, 10092, and 12671 (PI: P. Slane for 736 and Y. Uchiyama for the others), which were published in previous papers (Uchiyama et al., 2003, 2007; Lazendic et al., 2003, 2004; Tsuji & Uchiyama, 2016; Okuno et al., 2018; Tsuji et al., 2019; Higurashi et al., 2020). The X-ray data were taken with the Advanced CCD Imaging Spectrometer I-array on July 2000, July 2005, May 2006, January/May/September 2009, and July 2011. We used Chandra Interactive Analysis of Observations (CIAO; Fruscione et al., 2006) software version 4.12 with CALDB 4.9.1 for data reprocessing and imaging. All the downloaded data were reprocessed using the “chandra_repro” task. We then created energy-filtered, exposure-corrected images using the “fluximage” task for each observation, where the energy band of 1–2.5 keV. To eliminate regions with low photon statistics, we also masked areas with 60% or less of maximum exposure time for each observation.
References
- Abdo et al. (2011) Abdo, A. A., Ackermann, M., Ajello, M., et al. 2011, ApJ, 734, 28
- Aharonian et al. (1994) Aharonian, F. A., Drury, L. O., & Voelk, H. J. 1994, A&A, 285, 645
- Aharonian et al. (2004) Aharonian, F. A., Akhperjanian, A. G., Aye, K.-M., et al. 2004, Nature, 432, 75
- Aharonian et al. (2006) Aharonian, F., Akhperjanian, A. G., Bazer-Bachi, A. R., et al. 2006, A&A, 449, 223
- Aharonian et al. (2007) Aharonian, F., Akhperjanian, A. G., Bazer-Bachi, A. R., et al. 2007, A&A, 464, 235
- Aharonian et al. (2008) Aharonian, F., Akhperjanian, A. G., Bazer-Bachi, A. R., et al. 2008, A&A, 481, 401
- Bell (1978) Bell, A. R. 1978, MNRAS, 182, 147
- Bell (2004) Bell, A. R. 2004, MNRAS, 353, 550
- Bertsch et al. (1993) Bertsch, D. L., Dame, T. M., Fichtel, C. E., et al. 1993, ApJ, 416, 587
- Blandford & Ostriker (1978) Blandford, R. D. & Ostriker, J. P. 1978, ApJ, 221, L29
- Celli et al. (2019) Celli, S., Morlino, G., Gabici, S., et al. 2019, MNRAS, 487, 3199
- Cornwell (2008) Cornwell, T. J. 2008, IEEE Journal of Selected Topics in Signal Processing, 2, 793
- Drury et al. (1994) Drury, L. O., Aharonian, F. A., & Voelk, H. J. 1994, A&A, 287, 959
- Fruscione et al. (2006) Fruscione, A., McDowell, J. C., Allen, G. E., et al. 2006, Proc. SPIE, 6270, 62701V
- Fukui et al. (2003) Fukui, Y., Moriguchi, Y., Tamura, K., et al. 2003, PASJ, 55, L61
- Fukui et al. (2012) Fukui, Y., Sano, H., Sato, J., et al. 2012, ApJ, 746, 82
- Fukui et al. (2017) Fukui, Y., Sano, H., Sato, J., et al. 2017, ApJ, 850, 71
- Fukui et al. (2018) Fukui, Y., Hayakawa, T., Inoue, T., et al. 2018, ApJ, 860, 33
- Gabici et al. (2009) Gabici, S., Aharonian, F. A., & Casanova, S. 2009, MNRAS, 396, 1629
- Gabici & Aharonian (2014) Gabici, S. & Aharonian, F. A. 2014, MNRAS, 445, L70
- H.E.S.S. Collaboration et al. (2018) H.E.S.S. Collaboration, Abdalla, H., Abramowski, A., et al. 2018, A&A, 612, A6
- Higurashi et al. (2020) Higurashi, R., Tsuji, N., & Uchiyama, Y. 2020, ApJ, 899, 102
- Inoue (2019) Inoue, T. 2019, ApJ, 872, 46
- Inoue et al. (2009) Inoue, T., Yamazaki, R., & Inutsuka, S.-. ichiro . 2009, ApJ, 695, 825
- Inoue et al. (2012) Inoue, T., Yamazaki, R., Inutsuka, S.-. ichiro ., et al. 2012, ApJ, 744, 71
- Katsuda et al. (2015) Katsuda, S., Acero, F., Tominaga, N., et al. 2015, ApJ, 814, 29
- Koyama et al. (1997) Koyama, K., Kinugasa, K., Matsuzaki, K., et al. 1997, PASJ, 49, L7
- Kuznetsova et al. (2019) Kuznetsova, E., Krivonos, R., Churazov, E., et al. 2019, MNRAS, 489, 1828
- Lazendic et al. (2003) Lazendic, J. S., Slane, P. O., Gaensler, B. M., et al. 2003, ApJ, 593, L27
- Lazendic et al. (2004) Lazendic, J. S., Slane, P. O., Gaensler, B. M., et al. 2004, ApJ, 602, 271
- Maxted et al. (2012) Maxted, N. I., Rowell, G. P., Dawson, B. R., et al. 2012, MNRAS, 422, 2230
- McMullin et al. (2007) McMullin, J. P., Waters, B., Schiebel, D., et al. 2007, Astronomical Data Analysis Software and Systems XVI, 376, 127
- Moriguchi et al. (2005) Moriguchi, Y., Tamura, K., Tawara, Y., et al. 2005, ApJ, 631, 947
- Okuno et al. (2018) Okuno, T., Tanaka, T., Uchida, H., et al. 2018, PASJ, 70, 77
- Sano et al. (2010) Sano, H., Sato, J., Horachi, H., et al. 2010, ApJ, 724, 59
- Sano et al. (2013) Sano, H., Tanaka, T., Torii, K., et al. 2013, ApJ, 778, 59
- Sano et al. (2015) Sano, H., Fukuda, T., Yoshiike, S., et al. 2015, ApJ, 799, 175
- Sano et al. (2020) Sano, H., Plucinsky, P. P., Bamba, A., et al. 2020, ApJ, 902, 53
- Slane et al. (1999) Slane, P., Gaensler, B. M., Dame, T. M., et al. 1999, ApJ, 525, 357
- Tachihara et al. (2021) Tachihara, K., Fukui, Y., Hayakawa, T., et al. 2021, PASJ under review, arXiv:1811.02224
- Tanaka et al. (2008) Tanaka, T., Uchiyama, Y., Aharonian, F. A., et al. 2008, ApJ, 685, 988
- Tanaka et al. (2020) Tanaka, T., Uchida, H., Sano, H., et al. 2020, ApJ, 900, L5
- Tsuji & Uchiyama (2016) Tsuji, N. & Uchiyama, Y. 2016, PASJ, 68, 108
- Tsuji et al. (2019) Tsuji, N., Uchiyama, Y., Aharonian, F., et al. 2019, ApJ, 877, 96
- Uchiyama et al. (2003) Uchiyama, Y., Aharonian, F. A., & Takahashi, T. 2003, A&A, 400, 567
- Uchiyama et al. (2007) Uchiyama, Y., Aharonian, F. A., Tanaka, T., et al. 2007, Nature, 449, 576
- Wang et al. (1997) Wang, Z. R., Qu, Q.-Y., & Chen, Y. 1997, A&A, 318, L59
- Weaver et al. (1977) Weaver, R., McCray, R., Castor, J., et al. 1977, ApJ, 218, 377
- Zhou et al. (2016) Zhou, P., Chen, Y., Zhang, Z.-Y., et al. 2016, ApJ, 826, 34
- Zirakashvili & Aharonian (2010) Zirakashvili, V. N. & Aharonian, F. A. 2010, ApJ, 708, 965