Fourier transform detection of weak optical transitions with cyclic routines
Abstract
We demonstrate a means of detecting weak optical transitions in cold atoms that undergo cyclic routines with high sensitivity. The gain in sensitivity is made by probing atoms on alternate cycles leading to a regular modulation of the ground state atom population when at the resonance frequency. The atomic transition is identified by conducting a fast Fourier transform via algorithm or instrument. We find an enhancement of detection sensitivity compared to more conventional scanning methods of for the same sampling time, and can detect clock lines with fewer than atoms in a magneto-optical trap. We apply the method to the clock transition in 171Yb and 173Yb. The ac-Stark shift of this line in 171Yb is measured to be 0.19(3) kHzWm2 at 556 nm.
We investigate a technique of detecting weakly allowed optical transitions that have poor signal-to-noise ratio (SNR) when using conventional frequency sweep methods. This is of importance given the resurgence of isotopic shift spectroscopy used to search for beyond Standard-Model signatures Fla2018 ; Cou2020 ; Sol2020 . Forbidden transitions in neutral atoms, such as the transition in group-II-like atoms Tak2005 ; Lud2015 may be used in such investigations. Knowledge of isotopic shifts is also relevant to many radiopharmaceutical applications Gre1990 ; Par2008 ; Kos2020 . We demonstrate a means to increase the sensitivity of detecting weak transitions and apply it to the clock transition in the composite fermions of ytterbium Hoy2005 ; Hin2013 . The method is applicable to any transition in atoms that undergo cyclic preparation before probing. With regard to searching for atomic transitions, the technique is appropriate where the ratio of search space in frequency, , to transition linewidth, , is not excessively large. For example, where the transition frequency can be estimated using the knowledge of isotope shifts Zin2002 , or in the case of photoassociation spectroscopy, estimated using a Le RoyBernstein type equation Wei1999 ; Toj2006 . The gain in detection sensitivity is made by cycling the probe light and looking for a corresponding signal in the Fourier domain. For example, if we refer to each atom loading and cooling cycle as one cycle, then for subsequent cycles the probe light alternates between on and off. When on resonance, some fraction of atoms will be excited to the upper state every second cycle. This appears as a modulation of the fluorescence received by the photodetector, which is proportional to the number of atoms in the ground state. The strength of the modulation is extracted through the FFT of a time record of the photoreceiver’s signal. We demonstrate the sensitivity of the method by performing spectroscopy on the line in 171Yb and 173Yb, which have natural linewidths of approximately 40 mHz Por2004 . A Fourier signal with dB SNR is observed for the 171Yb clock line with atoms. We note that the technique should be well suited to searching for clock transitions in bosonic isotopes when held in an optical lattice trap Pol2008 ; Aka2010 ; Bai2007 . It could also be applied in the search for photoassociation resonances in ultra cold molecules Yas2006 ; Zel2006 ; Jon2006 ; Nem2009 , for example, at predicted frequencies, where otherwise they are not apparent Gut2018 .
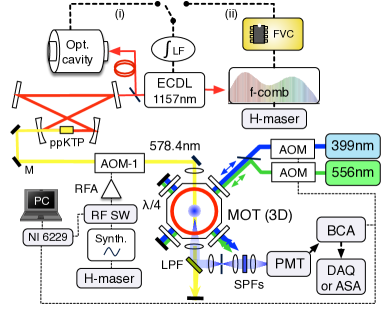
The experiment is comprised of a magneto-optical trap (MOT), a frequency comb (MenloSystems FC1500), a hydrogen maser (KVARZ-75A), cooling lasers at 399 nm and 556 nm, and the clock-line laser at 578 nm to probe the transition. The main components are shown in Fig. 1. The source of ytterbium atoms is provided by an oven at 400∘C from which atoms effuse through an array of narrow collimation tubes orientated horizontally. Some fraction of atoms pass through a narrow conduit downstream that separates the vacuum chamber into two main sections: (i) the oven and (ii) the Zeeman slower and main chamber.
The MOT operates in two stages; first with 399 nm light acting on the transition, then 556 nm light acting on the transition to reduce the atomic temperature to 50 K Comment1 . A dual tapered Zeeman slower (crossing zero magnetic field) assists with loading atoms into the MOT. The 399 nm light is generated by frequency doubling 798 nm light from a Ti:sapphire laser in a resonant cavity. The 556 nm light is produced by use of a second frequency doubling cavity, where the incident 1112 nm light originates from a fibre laser (NKT Photonics) that injection locks a semiconductor laser (EYP-RWL-1120). The 399 nm light is stabilized by locking to the line in atoms progressing to the Zeeman slower. The 556 nm light is stabilized by locking the sub-harmonic at 1112 nm to a mode of the frequency comb via a frequency-to-voltage converter (FVC) Rey2019 . The cooling laser signals are controlled with acousto-optic modulators (AOMs) driven with amplified RF signals from voltage controlled oscillators (VCOs).
The clock line laser at 578 nm is produced by use of a third frequency doubling cavity, where the master laser is an extended cavity diode laser (LD1001 Time-Base) and Hänsch-Couillaud frequency stabilization is used with the doubling cavity Nen2016 . The yellow light frequency is tuned with an additional AOM (AOM-1 in Fig. 1) whose RF is set with a synthesizer (Agilent E4428c) that is referenced to the H-maser (with accuracy in the range).
The optical frequency of the 578 nm light is evaluated with
| (1) |
where and are the frequency comb’s mode spacing and offset frequency, respectively ( MHz), is the beat frequency, is the mode number of the comb, and is the RF drive frequency of the AOM in the path of the 578 nm light. The sign of may vary depending on the isotope. The comb’s repetition rate is controlled by mixing its fourth harmonic with a 1.00 GHz signal that is the sum of 20 MHz and 980.0 MHz signals provided by a direct digital synthesizer (DDS) and a dielectric resonator oscillator (DRO), respectively. Hence . Both the DRO and DDS are locked to a 10 MHz signal from the H-maser. The DDS frequency is imposed by that of the 556 nm cooling light.
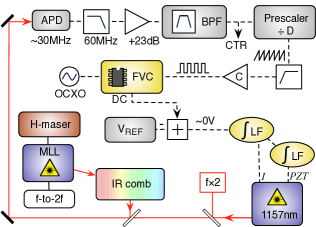
For the 171Yb clock transition the 1157 nm laser can be stabilized in one of two ways (summarized in Fig. 1): (i) with use of an ultrastable cavity and Pound-Drever-Hall lock, or (ii) by locking to the frequency comb using the FVC technique. The ultrastable cavity (Stable Laser Systems) and laser frequency stabilization have been described previously Nen2016 . The coefficient of thermal expansion is zero at ∘C, and the second order thermal expansion coefficient is K-2 (for THz). The laser when locked to the cavity drifts at a rate of 20.3 mHzs-1. The free spectral range of the cavity is 1496.5210(1) MHz. This is found by measuring the frequency separation between consecutive modes of the cavity with the frequency comb and the 1157 nm beat signal. A more accurate determination is then found using the 171Yb clock transition frequency. By locking to the 173167th mode of the cavity and offsetting the 578 nm light by MHz with AOM-1 the transition frequency can be reached. The transition for 173Yb lies approximately midway between cavity modes, which makes frequency offsetting with AOMs difficult. To overcome this obstacle one could use offset sideband locking with the ultrastable cavity Tho2008b . Instead, our approach is to lock the 1157 nm laser to the frequency comb, which also gives flexibility in reaching the transition (rather than using a sequence of AOMs). There are some constraints because the comb is also used to stabilize the 556 nm light frequency, and beat signals can only lie at frequencies set by the bandpass filters; here, 21 MHz and 30 MHz for the 1112 nm and 1157 nm beats, respectively.
The setup for the probe laser frequency stabilization by use of a FVC (Analog Devices AD652) is shown in Fig. 2. After filtering and amplifying the beat signal from the avalanche photodiode it is divided in frequency by 128 with a prescaler (Fujitsu MB506). A comparator (LM360) regularizes the waveform making it suitable for the CMOS compatible FVC. The AD652 is a synchronous VFC, implying that its transfer function is governed by an external clock, in this case an OCXO at 10 MHz, divided by 4. A laser servo based on this scheme has been shown to produce a fractional frequency instability of for s, where is the integration time Rey2019 . Apart from the flexibility provided by locking to the comb, the FVC-comb lock is also extremely robust.
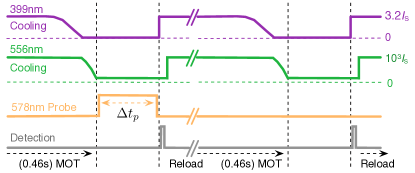
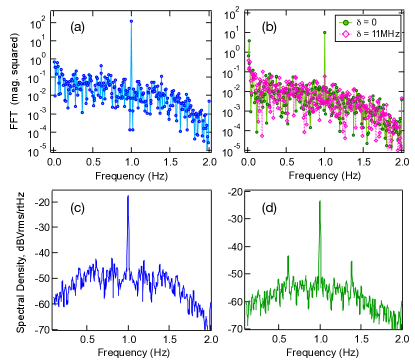
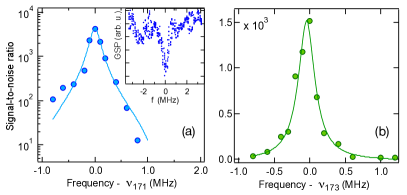
The event sequence is presented in Fig. 3. Each cycle has a duration of 0.5 s, the majority of which is used to load atoms into the MOT. The 399 nm light is ramped down over 20 ms during which time the second stage cooling with 556 nm light takes effect. The 556 nm intensity is also ramped down to reduce the temperature of the atoms and minimize the ac Stark shift. The magnetic quadrupole field is held fixed with a -axis gradient of 0.42 Tm-1. The yellow 578 nm light pulse has a period of 40 ms to interact with the atoms, after which the 399 nm is switched back on and detection of the ground state atoms is made (and MOT loading recommences). Unless otherwise stated, the maximum intensity of the 578 nm light was 5 kWm-2 with a corresponding Rabi frequency, , of 4 kHz (representing 1/50th of the transition linewidth). A 1 Hz modulation in the population transfer arises by applying the 578 nm light every second cycle. Fluorescence at 399 nm is filtered both spatially and spectrally before detection with a photomultiplier tube (PMT, Hamamatsu H10492-001) Kos2014 . The PMT signal is received by a boxcar averager (BCA, SRS SR250), which outputs to an Agilent 34970A unit for data acquisition. The BCA is triggered by the main control sequence program so that detection is made within 300 s of the 399 nm light resuming. A single measurement involves logging samples of the BCA output every 0.25 s, such that the total acquisition time gives an integer number of modulation cycles. A FFT of the time record (with Igor Pro software) reveals a signal at the modulation frequency if the probe laser frequency is on resonance. The upper panel of Fig. 4 shows examples of FFTs (magnitude squared) for the (a) 171Yb and (b) 173Yb clock transitions, where in both cases (over 125 s). These are maximum strength signals recorded very close to line center. The SNR at the 1 Hz modulation is approximately for 171Yb and just under for 173Yb (we will denote this ‘or’ for on-resonance). The number of atoms in the 556 nm MOT generating the signal was and , respectively (the transfer fraction to was %). The Yb oven was deliberately set at a relatively low temperature of 380∘C. In an alternative means of obtaining the spectrum, the BCA output was sent to a FFT spectrum analyser (HP89410A) set with a resolution bandwidth of 10 mHz and a Hanning window. The lower panel of Fig. 4 shows the resultant spectra. Figures 4(c) and 4(d) are for 171Yb and 173Yb, respectively. In (d) the oven was at a higher temperature of 410∘C. The SNRs at 1 Hz are consistent with those in the upper panel. The signals at 0.61 Hz and 1.38 Hz are unrelated to the 578 nm light. The 1.38 Hz modulation appears to originate from the Ti:sapphire laser and the 0.61 Hz is the same modulation shifted in frequency through aliasing.
A full line spectrum of the transition is produced by stepping the frequency of AOM-1 (with a fixed frequency for each time record) and extracting the SNR from the FFTs. Figures 5(a) and 5(b) show the line spectra for the 171Yb and 173Yb, respectively. Each data point is determined from a separate FFT. Figure 5(a) is shown with a logarithmic scale to illustrate the sensitivity in the wings of the profile. The absolute frequency is determined from Eq. 1. The frequencies subtracted from the line centers are kHz BIPM2017 and kHz Hoy2005 . The inset of Fig. 5(a) shows the spectrum by use of a conventional frequency sweep for 171Yb with a similar number of atoms. In this case the 578 nm pulse is applied every cycle of the event sequence, unlike in Fig. 3. Here the total sampling time was 140 s with the BCA set to 3-sample averaging. Note, the noise here is not white frequency noise.
To compare the detection sensitivity of the two methods we introduce a sensitivity index , where is the mean of the signal level, is the mean of the noise level, and is the standard deviation of the noise Wic2002 . Here corresponds to the on-resonance signal. For the FFT approach the units are magnitude-squared, therefore, . In the case of the conventional sweep we obtain , hence ; or in power units, the gain in sensitivity is 27 dB. Hence the means of detecting the transition over similar time scales is very much enhanced through the FFT approach.
The spectra in Figs. 5(a) and Fig. 5(b) have their own SNR. In this case we do not use the noise floor of the FFT to set the noise level. More appropriate is the rms of the residuals to the line shape fits. Here the SNR is 38 and 16 for 171Yb and 173Yb, respectively. The conventional scan for 173Yb produced no evident transition over the 140 s of sampling, due to the lower number of atoms trapped. The total sample time for Figs. 5(a) and Fig. 5(b) was 1500 s and 1300 s, respectively, so while there is a significant gain in SNR, the total sampling time increased by 10 fold.
From the Lorentzian line shape fits (to suit the wings) the FWHM for traces (a) and (b) are 210 kHz and 290 kHz, respectively. The width for 171Yb is consistent with the temperature of the atoms determined by imaging of ballistic expansion, K Kos2014 . For 173Yb there may be a linewidth contribution from laser noise Rey2019 , since the FVC lock to the comb was used rather than the ultrastable cavity.
Figure 6(a) shows the on-resonance 1 Hz SNR versus the number of atoms contributing to the signal for 171Yb with kHz and kHz (varied through 578 nm intensity). The number of atoms is determined by use of , where is the dc voltage from the PMT (background subtracted), is Planck’s constant, is the frequency of the 399 nm light, is the gain of the PMT (V/W), is the collected fraction of fluorescence, and is the photon scattering rate. The scattering rate follows from: , where is the 399 nm intensity normalized by the saturation intensity, , is the frequency detuning and is the natural linewidth of the transition Met1999 . The atom number was varied by changing the current through the Zeeman slower coils. With atoms a Fourier signal dB SNR remains apparent when kHz. The sensitivity increases with 578 nm intensity. Note, our fluorescence collection efficiency is only 0.55 %.
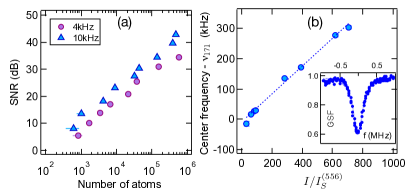
Once an atomic line is found, the modulated BCA output can aid optimization, such as improving the probe beam overlap with the atom cloud. An example of the 171Yb clock line recorded with the conventional scan is shown in the inset of Fig. 6(b) after such an optimization (and ∘C). The green light intensity during the 578 nm pulse was . By repeating with different levels of 556 nm light the ac-Stark shift becomes evident, as seen in Fig. 6(b). The line center for zero light intensity is within 9 kHz of previous reports of the transition frequency Lud2015 ; BIPM2017 . The gradient of the line fit for the ac-Stark shift is 0.19(3) kHzWm2, where the uncertainty is dominated by that of the light intensity.
In summary, we have demonstrated a sensitive method of detecting weak optical transitions in cold atoms that rely on cyclic routines. In terms of detecting the presence of a transition, the sensitivity index is increased 20-fold compared to conventional line scanning for similar measurement times. One can detect (and resolve) a clock transition in an optical lattice with atoms Yi2011 , but to our knowledge the detection of such a transition with atoms in a MOT has not been previously demonstrated. With regard to line spectra, the increased SNR comes at the expense of a 10-fold increase in sampling time, which places a restriction on (mentioned in the opening). An upper limit for may be 20 for practical purposes, but it depends on factors such as cycle time and how well search procedures can be automated.
Acknowledgements.
This work was supported by the Australian Research Council’s grant CE170100009. J. S. acknowledges support from the University of Western Australia’s Winthrop Scholarship, and St Catherine’s College. We thank F. van Kann and L. Nenadović for proofreading the manuscript.Data Availability
The data that support the findings of this study are available from the corresponding author upon request.
References
References
- (1) V. V. Flambaum, A. J. Geddes, and A. V. Viatkina, “Isotope shift, nonlinearity of King plots, and the search for new particles,” Phys. Rev. A 97, 032510 (2018).
- (2) I. Counts, J. Hur, D. P. L. Aude Craik, H. Jeon, C. Leung, J. C. Berengut, A. Geddes, A. Kawasaki, W. Jhe, and V. Vuletić, “Evidence for nonlinear isotope shift in search for new boson,” Phys. Rev. Lett. 125, 123002 (2020).
- (3) C. Solaro, S. Meyer, K. Fisher, J. C. Berengut, E. Fuchs, and M. Drewsen, “Improved isotope-shift-based bounds on bosons beyond the standard model through measurements of the interval in ,” Phys. Rev. Lett. 125, 123003 (2020).
- (4) M. Takamoto, F.-L. Hong, R. Higashi, and H. Katori, “An optical lattice clock,” Nature 435, 321 (2005).
- (5) A. Ludlow, M. Boyd, J. Ye, E. Peik, and P. Schmidt, “Optical atomic clocks,” Rev. Mod. Phys. 87, 637–701 (2015).
- (6) P. T. Greenland, “Laser isotope separation,” Contemporary Physics 31, 405–424 (1990).
- (7) H. Park, D.-H. Kwon, Y. H. Cha, T.-S. Kim, J. Han, K.-H. Ko, D.-Y. Jeong, and C.-J. Kim, “Stable isotope production of 168Yb and 176Yb for industrial and medical applications,” Journal of Nuclear Science and Technology 45, 111–116 (2008).
- (8) U. Köster, W. Assmann, C.-O. Bacri, T. Faestermann, P. Garrett, R. Gernhäuser, and I. Tomandl, “Electromagnetic isotope separation of gadolinium isotopes for the production of 152,155Tb for radiopharmaceutical applications,” Nuclear Instruments and Methods in Physics Research Section B 463, 111 – 114 (2020).
- (9) C. Hoyt, Z. Barber, C. Oates, T. Fortier, S. Diddams, and L. Hollberg, “Observation and absolute frequency measurements of the optical clock transition in neutral ytterbium,” Phys. Rev. Lett. 95, 083003–1 (2005).
- (10) N. Hinkley, J. A. Sherman, N. B. Phillips, M. Schioppo, N. D. Lemke, K. Beloy, M. Pizzocaro, C. W. Oates, and A. D. Ludlow, “An atomic clock with instability,” Science 341, 1215 (2013).
- (11) R. Zinkstok, E. J. van Duijn, S. Witte, and W. Hogervorst, “Hyperfine structure and isotope shift of transitions in Yb I using UV and deep-UV cw laser light and the angular distribution of fluorescence radiation,” J. Phys. B 35, 2693–2701 (2002).
- (12) J. Weiner, V. S. Bagnato, S. Zilio, and P. S. Julienne, “Experiments and theory in cold and ultracold collisions,” Rev. Mod. Phys. 71, 1–85 (1999).
- (13) S. Tojo, M. Kitagawa, K. Enomoto, Y. Kato, Y. Takasu, M. Kumakura, and Y. Takahashi, “High-resolution photoassociation spectroscopy of ultracold ytterbium atoms by using the intercombination transition,” Phys. Rev. Lett. 96, 153201–1 (2006).
- (14) S. G. Porsev and A. Derevianko, “Hyperfine quenching of the metastable states in divalent atoms,” Phys. Rev. A 69, 042506 (2004).
- (15) N. Poli, Z. Barber, N. Lemke, C. Oates, L. Ma, J. Stalnaker, T. Fortier, S. Diddams, L. Hollberg, J. Bergquist, A. Brusch, S. Jefferts, T. Heavner, and T. Parker, “Frequency evaluation of the doubly forbidden 1SP0 transition in bosonic 174Yb,” Phys. Rev. A 77, 050501 (2008).
- (16) T. Akatsuka, M. Takamoto, and H. Katori, “Three-dimensional optical lattice clock with bosonic 88Sr atoms,” Phys. Rev. A 81, 023402 (2010).
- (17) X. Baillard, et al., “Accuracy evaluation of an optical lattice clock with bosonic atoms”, Opt. Lett., 32, 1812 (2007).
- (18) M. Yasuda, T. Kishimoto, M. Takamoto, and H. Katori, “Photoassociation spectroscopy of 88Sr: reconstruction of the wave function near the last node,” Phys. Rev. A 73, 11403 – 1 (2006).
- (19) T. Zelevinsky, M. M. Boyd, A. D. Ludlow, T. Ido, J. Ye, R. Ciurylo, P. Naidon, and P. S. Julienne, “Narrow line photoassociation in an optical lattice,” Phys. Rev. Lett. 96, 203201 (2006).
- (20) K. M. Jones, E. Tiesinga, P. D. Lett, and P. S. Julienne, “Ultracold photoassociation spectroscopy: Long-range molecules and atomic scattering,” Rev. Mod. Phys. 78, 483 (2006).
- (21) N. Nemitz, F. Baumer, F. Munchow, S. Tassy, and A. Gorlitz, “Production of heteronuclear molecules in an electronically excited state by photoassociation in a mixture of ultracold Yb and Rb,” Phys. Rev. A 79, 061403 (2009).
- (22) A. Guttridge, S. A. Hopkins, M. D. Frye, J. J. McFerran, J. M. Hutson, and S. L. Cornish, “Production of ultracold Cs*Yb molecules by photoassociation,” Phys. Rev. A 97, 063414 (2018).
- (23) Lower temperature may be obtained with optimal MOT beam alignment.
- (24) F. C. Reynolds and J. J. McFerran, “Optical frequency stabilization with a synchronous frequency-to-voltage converter,” Appl. Opt. 58, 3128–3132 (2019).
- (25) L. Nenadović and J. McFerran, “Clock and inter-combination line frequency separation in 171Yb,” J. Phys. B 49, 065004 (2016).
- (26) J. I. Thorpe, K. Numata, and J. Livas, “Laser frequency stabilization and control through offset sideband locking to optical cavities,” Opt. Express 16, 15980 – 90 (2008).
- (27) N. Kostylev, E. Ivanov, M. Tobar, and J. McFerran, “Sub-Doppler cooling of ytterbium with the transition including 171Yb (I=1/2),” J. Opt. Soc. Am. B 31, 1614 (2014).
- (28) T. D. Wickens, Elementary Signal Detection Theory, Oxford University Press (2002).
- (29) H. J. Metcalf and P. van der Straten, Laser Cooling and Trapping, Springer (1999).
- (30) www.bipm.org/en/publications/mises-en-pratique/standard-frequencies.html
- (31) L. Yi, S. Mejri, J. J. McFerran, Y. Le Coq, and S. Bize, “Optical lattice trapping of 199Hg and determination of the magic wavelength for the ultraviolet 1SP0 clock transition,” Phys. Rev. Lett. 106, 073005 (2011).