Electrical detection of the spin reorientation transition in antiferromagnetic TmFeO3 thin films by spin Hall magnetoresistance
Abstract
TmFeO3 (TFO) is a canted antiferromagnet that undergoes a spin reorientation transition (SRT) with temperature between 82 K and 94 K in single crystals. In this temperature region, the Néel vector continuously rotates from the crystallographic -axis (below 82 K) to the -axis (above 94 K). The SRT allows for a temperature control of distinct antiferromagnetic states without the need for a magnetic field, making it apt for applications working at THz frequencies. For device applications, thin films of TFO are required as well as an electrical technique for reading out the magnetic state. Here we demonstrate that orthorhombic TFO thin films can be grown by pulsed laser deposition and the detection of the SRT in TFO thin films can be accessed by making use of the all electrical spin Hall magnetoresistance (SMR), in good agreement for the temperature range where the SRT occurs. Our results demonstrate that one can electrically detect the SRT in insulators.
I Introduction
Antiferromagnets (AFMs) are a key focus of current spintronic research [1, 2, 3]. Due to their fast spin dynamics and stability against external perturbations, AFMs are promising candidates for THz emitters [4, 5] and next generation data storage devices [6]. The insulating canted antiferromagnet TmFeO3 (TFO) has recently gathered significant interest because of the possibility to coherently switch its spin state by with a THz pulse [7] in the proximity of the temperature-driven spin reorientation transition (SRT) in bulk single crystals.
The detection of the switching was achieved by the Faraday effect in a transmission geometry. However, not only are bulk crystals inappropriate for back-end integration into devices, but the requirements of writing and reading out by THz laser pulses necessitates large external power sources. Moving towards applications then requires high quality thin films possessing similar antiferromagnetic properties to their bulk counterparts and integrated mechanisms for controlling and reading the antiferromagnetic Néel vector. The growth of different antiferromagnetic thin films can be achieved via several techniques including sputtering [8] and pulsed laser deposition [9]. Meanwhile, current-induced control of the Néel vector has recently been shown in antiferromagnetic insulators [10], whilst the electrical read out has been achieved making use of the spin Hall magnetoresistance (SMR) between a heavy metal and an antiferromagnetic insulator [10, 11].
With respect to TFO thin films, growth has been achieved in the hexagonal phase when deposited on Al2O3 (0001), Pt (111) [12, 13] and YSZ (111) [14] substrates. This hexagonal phase has different properties compared to the orthorhombic phase, like multiferroicity and low magnetic ordering temperature [15]. Canted antiferromagnetism with the spin reorientation transition is so far only reported for the orthorhombic phase. Until now, there has only been one report of TFO thin films grown on SrTiO3 (STO) substrates that describes the structure as the standard perovskite structure, without characterization of their magnetic properties [14]. It is then at present not clear if thin films present a similar spin structure and SRT as found in the bulk, but understanding this is a key requirement in view of applications.
Here, we demonstrate that TFO grows in fact in the bulk-like orthorhombic phase on STO, not in the cubic perovskite phase. Our thin films are of high crystallographic quality exhibiting oriented growth. We detect a canted moment and the spin reorientation transition similar to the bulk. Furthermore, we ascertain the direction of the Néel vector (N) and canted moment (M) in TFO thin films using SMR. We show how the spin reorientation can be read-out electrically, thus being promising in view of applications such as, as a source of monochromatic THz radiation or data storage devices.
II Results and Discussion
Using the deposition parameters detailed in the Methods section IV.1, 200 nm thick TFOo films were deposited on (001)p oriented STO substrates. The subscripts and indicate the directions in an orthorhombic and perovskite unit cell, respectively. The crystallographic structure was investigated by making use of x-ray diffraction (XRD). An out-of-plane XRD scan in the range of for a typical TFO sample is shown in FIG. 1 (a).
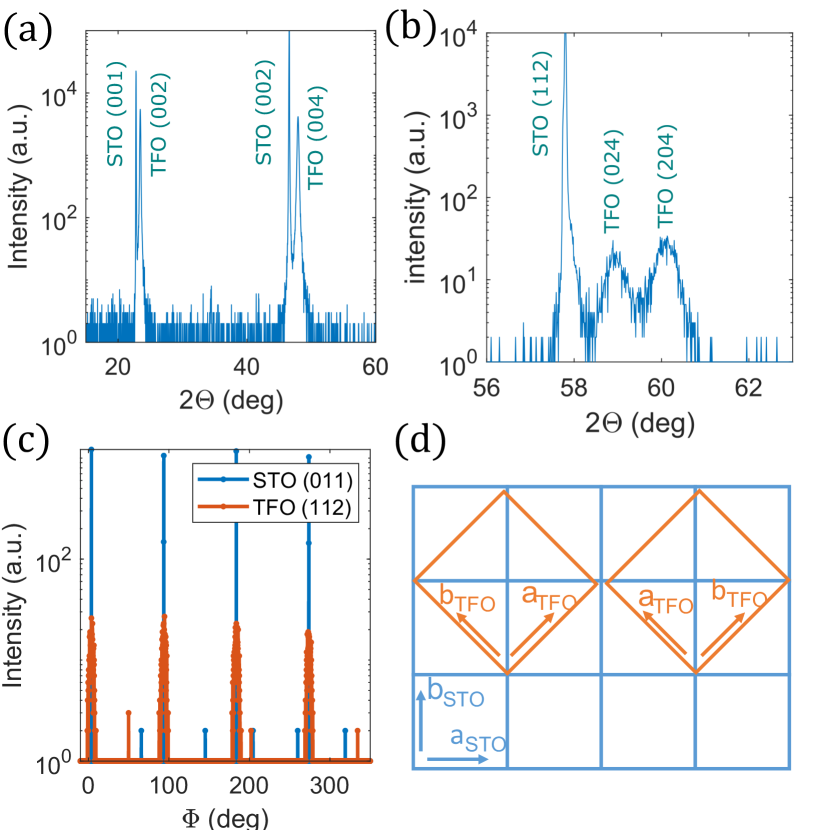
We observe (001)p and (002)p substrate and (002)o and (004)o TFO peaks with no additional impurity phase present. We calculate an out-of-plane lattice constant of 7.58 Å, which corresponds to the value of the bulk orthorhombic TFO -axis ( Å, Å, Å) [16]. The other lattice parameters are determined by in-plane XRD measurements. A 2 scan along the (112)p direction gives the diffraction pattern shown in FIG. 1 (b). Besides the (112)p STO substrate peak we find the (024)o TFO peak at and the (204)o TFO peak at . To calculate the lattice parameters we use the standard textbook formula for orthorhombic unit cells: , where d is the spacing of diffraction planes calculated from the peak angle , and Miller indices and the lattice constant calculated from the out-of-plane XRD scan. We find Å and Å. The presence of both (024)o and (204)o diffraction peaks in one scan leads to the conclusion that there are two crystallographic domains with different in-plane order present. The orthorhombic -axis of TFO is along the of STO in one domain, along the in another. The domains are separated by a 90∘ in-plane rotation of the unit cells. This is confirmed by scans as shown in FIG. 1 (c). We find that the (112)o peaks in direction have a FWHM of and reveal a four-fold in-plane symmetry not consistent with the two-fold symmetry expected from a single orthorhombic crystallographic domain. The (204)o peak on the other hand has a FWHM of , also revealing a four-fold in-plane symmetry (not shown). The smaller width of the (204)o peaks compared to the (112)o peaks in the scans indicate that the orthorhombic and axes align with the STO diagonals leading to a distribution of orientations of the orthorhombic diagonal. The relative orientations are schematically shown in FIG. 1 (d) for the unit cell of TFO (orange) atop the in-plane structure of the substrate (blue). Knowing the growth orientation of the TFO on STO we determine a lattice mismatch of for the TFO -axis and for the TFO -axis each corresponding to the diagonal of the STO -plane. The sketch is made to scale so one can see that the TFO -axis fits well the STO diagonal. Our thin films clearly show the orthorhombic structure of bulk samples, which has not been reported before for thin films.
Having demonstrated the high quality growth of TFO films in the orthorhombic phase on STO substrates, our attention now turns to the magnetic properties of the TFO thin films, which we investigated using superconducting quantum interference device (SQUID) magnetometry. FIG. 2 (a) shows a field cooled curve and a field warming curve for which the sample has been measured in out-of-plane (oop) and in-plane (ip) configuration along the orthorhombic axes, respectively. Details of the method can be found in the appendix IV.3. The green region depicts the bulk spin reorientation region as measured in single crystals ( K and K [17]), where the Néel vector N smoothly rotates between the two magnetic states [18]. Above the SRT N is in-plane along the orthorhombic -axis ( phase). Since two crystallographic domains are present N should lie in both possible in-plane directions corresponding to the STO axes. In both cases M is pointing along the -axis, which can be easily aligned in one direction using a magnetic field. Below the SRT the spins align along the -axis and so N reorients out of the plane ( phase). M can be directed in any of the 4 in-plane directions of the TFO -axis. These two possible configurations are shown for their respective temperature ranges in FIG. 2 (d).
Focusing first on the SQUID oop measurement, the measured magnetization at high temperatures corresponds to the canted moment of the TFO which increases slightly with decreasing temperature as can be explained by the parallel alignment of the paramagnetic Tm moments [19] or an increased canting angle. While the first effect is observed in bulk, the latter effect is not [20], but could occur in thin films due to temperature dependent strain arising from different thermal expansion coefficients of TFO and STO.
Across the SRT, both N and M rotate smoothly to a new equilibrium position. Indeed, we note that the oop magnetization reaches a maximum around K, which we attribute to the start of the SRT.
As we continue to reduce the temperature, we note that the oop magnetization continues to decrease as M no longer lies along this direction. We reach a minimum for the magnetization at around 50 K, which stems from a superposition of the decreasing projection of M in -direction and paramagnetic components increasing the signal at low temperatures.
Therefore we make use of an ip measurement to determine the edge of the SRT. We observe a decreasing magnetic moment along the -axis above K when measuring along the substrate diagonal, which we attribute to the end of the SRT.
These measurements indicate that the SRT is present in our thin films. This shows that they exhibit the desired magnetic properties as the SRT is similar to bulk samples.
We note that K and K deviate slightly from the bulk values K and K. The extension of the SRT to K and K in near surface regions has been reported in Ref. [21] for bulk samples. A further increase of the SRT region may stem from the small size of the TFO grains and the resulting enlarged surface area. There is also the probability that strain induced by the thin film growth alters the key magnetic anisotropies along the and axes responsible for the transition, as has been demonstrated for SmFeO3 [22].
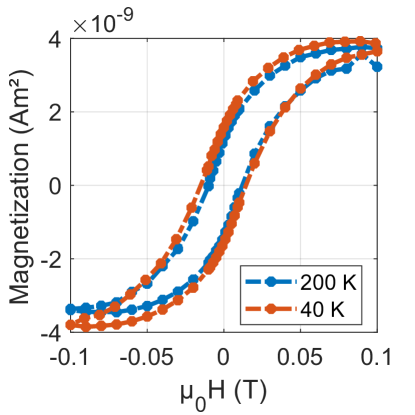
To confirm our observations, we next perform measurements of the magnetization as a function of the applied magnetic field at a constant temperature above (200 K) and below (40 K) our observed SRT. Once the background from the diamagnetic substrate and paramagnetic components has been subtracted (see FIG. 2 (b)), we observe a curve consisting of two contributions for an oop magnetic field at 200 K: a broad hysteresis with a coercive field of 1.8 T and a soft hysteresis at very low magnetic fields. For the 40 K curve, the soft hysteresis around 0 T is still present. A second contribution to the signal has adopted a shape more reminiscent of a hard axis ferromagnetic loop than an easy axis as expected.
From low amplitude hysteresis loops discussed in the appendix section IV.4 we observe that the soft-magnetic contribution is temperature independent and therefore not linked to the magnetic structure of the orthorhombic TFO.
Subtracting the soft magnetic contribution, the saturation magnetization at 200 K is found to be around B/f.u., which is lower than what was recently reported on TFO bulk samples also using measurements [23]. The magnitude of the saturation magnetization has two contributions: the paramagnetic Tm moments being polarized by the local crystal field generated by the Fe atoms and the canting of the Fe sublattices, which is related to the strength of the antisymmetric exchange interaction (Dzyaloshinskii Moriya interaction, DMI) present in all rare earth orthoferrites [20]. The crystallographic distortion due to strain affects the crystal field, thus leading to deviations of the DMI through higher order terms of the spin-orbit coupling. Therefore, a deviation between magnetization values of bulk and thin films samples is not surprising.
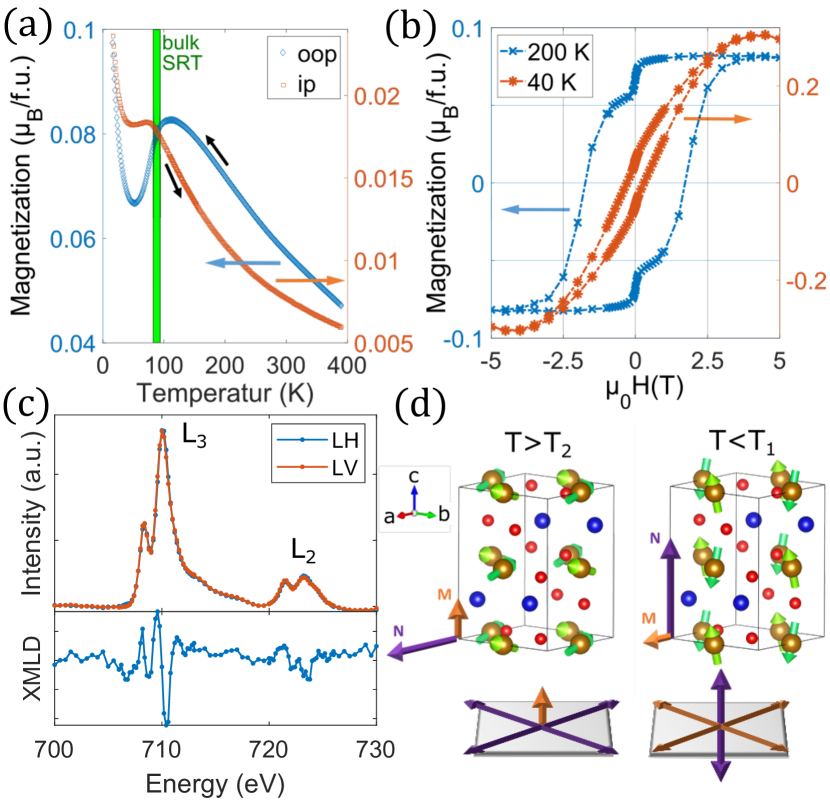
We have demonstrated by SQUID measurements that our films have a measurable SRT signal. We have assumed that our samples fulfill the model of a canted antiferromagnet. However, we have yet to show that our films possess actually antiferromagnetic ordering to rule out the possibility that the SQUID signals stem from ferromagnetic impurities. In order to confirm that they are antiferromagnetic, x-ray absorption spectra were measured for circular and linear polarized photons around the Fe L2 and L3 edge at the Diamond Light Source I06 beamline. The magnetic circular dichroism (XMCD) and x-ray magnetic linear dichroism (XMLD) were calculated. Details on the method and the XMCD spectrum are given in the appendix section IV.5. We note that there is no clear XMCD signal measured when using circularly polarized x-rays. The lack of XMCD means that in the near-surface region we do not observe evidence of a ferromagnetic phase or the canted moment. The missing of the latter is likely due the sensitivity limit of the technique. This is not surprising given its small magnitude and the finite sensitivity of the setup, as well as the difficulties in measuring out of plane magnetism with x-rays having a grazing incidence angle of . In order to demonstrate antiferromagnetic nature of our films, we take x-ray absorption spectra (XAS) for horizontal and vertical linear polarized x-rays. The XMLD is calculated as XMLD=, where and are the XAS of for horizontal and vertical linear polarization, respectively. The parallel (perpendicular) component of the Néel vector will give rise to a decrease (increase) of the XAS spectrum. We show in FIG. 2 (c) the XAS and XMLD spectra calculated at 300 K, where clear dichroism is visible at both the Fe L2 and L3 edges. The clear presence of XMLD and absence of XMCD demonstrates that our films are indeed antiferromagnetic. The investigation of our TFO/STO thin films have shown that TFO grows in the orthorhombic phase like bulk crystals. These films show the typical TFO features like antiferromagnetic ordering and a SRT. However, we have so far used bulk techniques to detect this ordering. Device applications necessitate the all-electrical, on-chip detection of the AFM ordering and SRT, for which we turn to spin Hall magnetoresistance [25].
Using lithographic methods, we define Pt Hall bars as detailed in the methods section IV.1 in order to electrically investigate the reorientation of the magnetic structure with temperature. The Hall bars are aligned parallel to the STO -axis, and thus make a angle to the film - and -axes. is perpendicular to the Hall bar out of the plane, which coincides with the orthorhombic -direction (see FIG. 3 (c)).
We pass a charge current along through the Pt, which leads to a spin accumulation at the Pt/TFO interface polarized along , whilst capturing a longitudinal and transverse resistivity as a function of the magnetic field applied along . The interaction between and the magnetic order parameters, which can be N [26, 10] or M [27], leads to a modulation of the Pt resistance due to the spin Hall magnetoresistance (SMR). Changes in the orientation of N and M, then lead to an electrically detectable response. The longitudinal resistivity can be plagued by numerous additional effects like ordinary magnetoresistance [28], Hanle magnetoresistance [29] and sensitivity to small temperature changes, which may be comparable to, or even mask, the small effect of the SMR.
On the other hand, the interpretation of the transverse resistivity data is more straight forward to interpret. With a field applied in direction, has two key contributions: the ordinary Hall effect (OHE) [30] and the spin Hall anomalous Hall effect (SHAHE), which is related to the -component of the magnetization of the material in contact with the conductor [31].
Other effects like planar Hall effect [32], anomalous Hall effect [30], magnetic SHE [33] and topological Hall effect [34] are only relevant for magnetic conductors and can be discarded here where we consider an antiferromagnetic insulator.
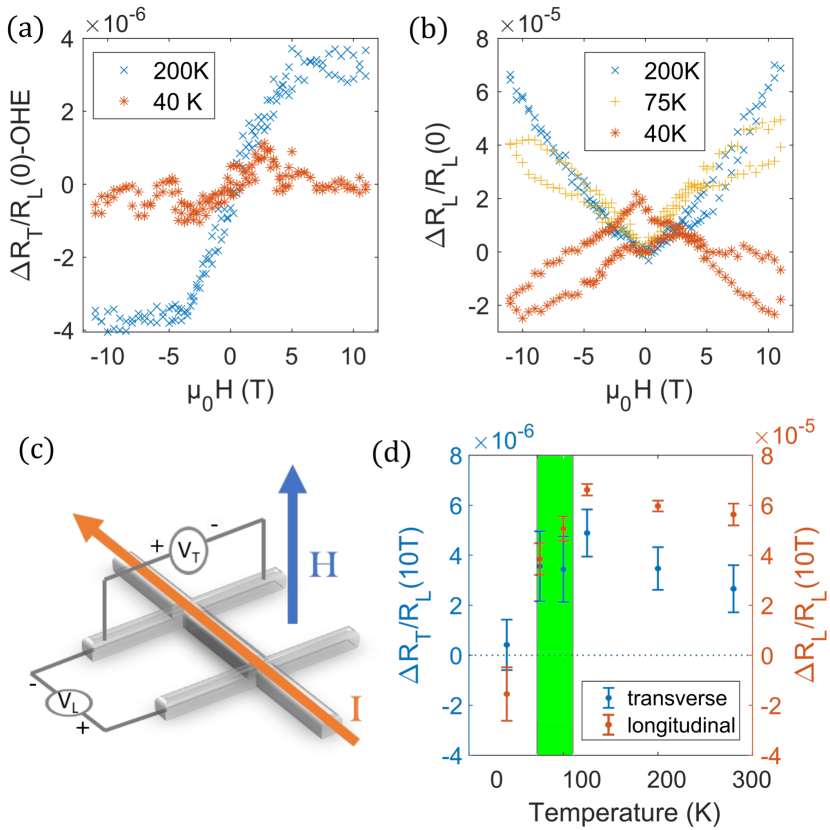
The OHE arises as a linearly increasing change of resistance with magnetic field making it simple to account for. In the case of an antiferromagnet without a significant canted moment, only the OHE is expected. However, we observe a distinct hysteresis in the transverse resistivity beneath the linear contribution from the OHE at 200 K (FIG. 3 (a)). We note that the hysteresis saturates at a similar magnetic field as the hysteresis observed previously by SQUID. To determine further whether this hysteresis originates from the TFO films, we cool below the SRT to 40 K, where the canted moment now lies in-plane. While the contribution from OHE remains unchanged, the hysteresis disappears, confirming that this signal originates from the net magnetic moment of the TFO films. This is shown in FIG. 3 (a).
Given that, ignoring the Néel vector, the transverse resistivity is proportional to the component of the magnetization [31, 35], we attribute this hysteresis to the spin Hall anomalous Hall effect (SHAHE) [31, 36] of the canted moment M oriented along .
Unlike in the SQUID measurements (FIG: 2 (b)), a remnant magnetization in is not observed above the SRT. A fundamentally different spin configuration at the surface layer compared to bulk is not expected since previous experiments on bulk samples underline the similarity of surface sensitive and bulk measurements [37, 21, 38]. The absence of a remnant signal may arise from the broken inversion symmetry at the TFO/Pt interface competing with the bulk DMI, reducing the canted moment at the interface. The soft hysteresis, which may stem from a maghemite phase, has no obvious impact on the measurement.
We also note that the signal has the same symmetry as proximity induced AHE. However, we do not expect proximity effect in our samples as also not observed in other Pt/AFM heterostructures [39] given the lack of a large net magnetic moment and stray fields.
We therefore suggest that the transverse signal is dominated by the orientation of M, specifically the component, reminiscent of the SHAHE observed in ferromagnets. The dominance of the magnetic spin mixing conductance in the transverse signal would indicate that the magnetic spin mixing conductance should also dominate the longitudinal response FIG 3 (b).
In fact, we do see a significant change in the longitudinal resistivity as a function of magnetic field when going though the SRT. The amplitude clearly decreases with decreasing temperature around the SRT. Within the transition we see an intermediate state which might indicate the magnetic field induced reorientation of M and N [40]. This would indicate a -dependence on M, having a positive magnetoresistive (MR) effect together with a decrease of and an increase of the contribution. Assuming this dependence and ignoring other effects, one would expect no MR effect at 200 K, because M does not have a -contribution above the SRT. However, we observe a large positive MR that could be explained by the dependence of in N. Therefore, clearly identifying the dependence of on M or N is challenging and need more measurements, also to identify the contributions from temperature and other MR effects, i.e. OMR and Hanle MR, which have the same symmetry as SMR in our measurement geometry.
In summary, we observe a strong change of both and through the SRT. The dependence of the signal amplitude with temperature is shown in FIG.3 (d).
The amplitude of follows our expectations centered around a dominant contribution from and the associated SHAHE, however, as discussed previously, the dependence of cannot be explained through the component of either N or M. Instead, the behaviour appears to be in a certain sense related to the out of plane component of the magnetization. However, this is not consistent with the description of SMR [25, 31] and would require further study of the SMR in canted AFMs with a significant DMI that goes beyond the scope of this work.
III Conclusion
We have successfully grown samples of oriented orthorhombic TmFeO3 thin films on SrTiO3 substrates by pulsed laser deposition. We observe a four-fold symmetry of the in-plane ordering due to the cubic symmetry of the substrate resulting in crystallographic twinning. The samples exhibit antiferromagnetic ordering, a canted moment and a spin reorientation transition (SRT), as confirmed by SQUID magnetometry and XMLD. The SRT is shifted compared to bulk samples due to strained growth altering the local crystal field. To detect the SRT electrically, we utilize spin Hall magnetoresistance (SMR). We can ascertain the different magnetic phases utilizing SHAHE and also observe anomalies in the longitudinal SMR signal going through the SRT. The surface sensitive nature of SMR overcomes the need for bulk measurements that can, for thinner films, be difficult due to the small volume and substrate contributions. Our results demonstrate, that one can electrically detect the spin reorientation transition of canted antiferromagnetic orthoferrites, which is important for future spintronic applications such as memory devices and canted antiferromagnetic nanooscillators.
Acknowledgments
The authors gratefully acknowledge funding by the Deutsche Forschungsgemeinschaft (DFG, German Research Foundation) – project number 35867137. This work was supported by the Max Planck Graduate Center with the Johannes Gutenberg-Universität Mainz (MPGC) as well the Graduate School of Excellence Material Science in Mainz (GSC266). Funded by the Deutsche Forschungsgemeinschaft (DFG, German Research Foundation) – TRR 173–268565370 and KAUST COSR-2019-CR68-4048.2. L.B acknowledges the European Union’s Horizon 2020 research and innovation program under the Marie Skłodowska-Curie grant agreement ARTES number 793159. We acknowledge Diamond Light Source for time on beam line I06 under proposal MM23819-1.
IV Appendix
IV.1 Methods
A TmFeO3 target has been prepared by standard solid state reaction out of Tm2O3 and Fe2O3 powder. Thin films have been prepared by pulsed laser deposition (PLD) on SrTiO3 (001) substrates using a KrF Compex Pro 205 excimer laser and a vacuum chamber with a base pressure of mbar.
| Parameter | value |
|---|---|
| Deposition temperature (∘C) | 630 |
| O2 pressure (mbar) | 0.2 |
| Substrate-target distance (cm) | 5.5 |
| Laser energy per pulse (mJ) | 130 |
| Laser spot size (mm2) | 9 |
| Laser pulse frequency (Hz) | 10 |
| Cooling rate after dep. (K/min) | 25 |
| Growth rate (nm/min) | 1.6 |
The structural properties of the samples have been investigated using x-ray diffraction (XRD) and a Bruker D8 four circle diffractometer. The temperature dependent magnetic properties have been analyzed using a superconducting quantum interference device (SQUID) from Quantum Design. The surface morphology has been imaged using atomic force microscopy (AFM) with a Digital Instruments 3100 Dimension equipped with a NanoScope IV controller. As probes, Bruker SNL-10 have been used. For plotting the images and calculating the grain size Gwyddion software [41] was utilized.
For the transport measurements, platinum Hall bars have been defined by lithographic methods, with Pt deposited using DC magnetron sputtering at room temperature and a lift-off process. The dimensions of the Hall bars are m in width, 7 nm in thickness and m in length. The arms are separated by m and have a width of m. Electrical measurements at a Hall bar have been performed in a cryostat equipped with a variable temperature insert. Magnetic fields up to 11 T and temperatures in the range of 5 K to 300 K can be accessed. An identical sample as utilized for transport measurements was covered by 2 nm of Pt in order to prevent charging and measured at DIAMOND beam line I06. Before measuring the x-ray absorption spectra (XAS) the sample has been put in a magnetic field of 5 T applied in -direction. XAS have been measured around the L3 and L2 iron absorption edge.
IV.2 AFM
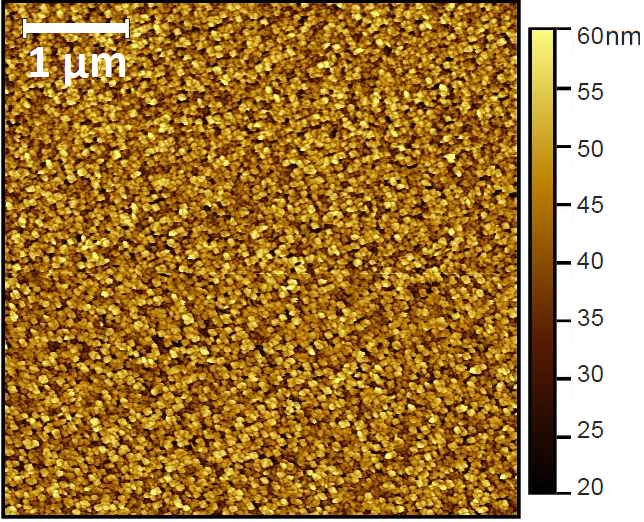
The surface of the sample has been investigated by atomic force microscopy. The data of a 5-by-5 m scan has been analyzed with Gwyddion software [41]. An image of the topography is shown in FIG. 4. We determine an overall root mean square (RMS) roughness () of around 8 nm for a film thickness of 200 nm. The size of the surface grains has been calculated by masking the grains using a height threshold of 43%, resulting in a mean grain size of 42 nm. We suggest that the grain size could be increased by making use of substrates without the cubic symmetry of STO to prevent the formation of twinned domains (e.g. DyScO3, NdGaO3, YAlO3 or related orthorhombic materials). Whilst this is not of relevance for the work here, where the transport measurements are integrating over areas far larger than the individual grain size, other branches of antiferromagnetic spintronics can benefit from a reduction in grain and magnetic domain boundaries [42].
IV.3 SQUID M vs T curves
The measurement of the SRT has been performed in the SQUID, measuring the temperature dependent magnetization along the TFO - and -axis as shown in the main text. For the oop measurement (along the -axis) the sample was heated up to 390 K. At this temperature a field magnitude of 5 T was briefly applied along the -axis to align M of the domains. Then a field of 30 mT was applied and the temperature dependent magnetization was measured during cool-down at a rate of 2 K/min. For the ip measurement, a magnetic field of 5 T was applied along the TFO axis, to the STO axes, at a temperature of 20 K for a short period of time, again to saturate the canted moment. The sample was then heated in a magnetic field of 50 mT at 2 K/min. Here, a larger magnetic field has been chosen because at lower fields ferro-, para- and diamagnetic contributions compensate at some point in the measurement range. This leads to the measurement software not being able to fit the raw signal which further leads to jumps in the curve that are not originating from the sample’s properties.
IV.4 SQUID minor loops
We investigate the soft magnetic phase by taking minor loops around 0 T so as to exclude the high field contributions. This is done by first applying a field of -5 T to the sample for a short period of time. Then the loop is measured with T starting from positive values. We observe a hysteresis that has a coercive field of 12 mT (18 mT) and a maximum magnetic moment of Am2 ( Am2) at a temperature of 200 K (40 K). This contribution does not change significantly with temperature as shown in FIG. 5. Note that the values for the magnetization are not normalized because the volume of the soft magnetic phase is unknown. Hysteresis curves with a soft and hard magnetic contribution are in literature referred to as wasp-waisted hysteresis loops. They have already been reported for other oxides like CoFe2O4 thin films [43, 44, 45] and Fe3O4/CoO bilayers [46]. For polycristalline orthoferrite thin films (not TFO), there are reports of strange phases leading to a soft hysteresis [47, 48]. Possible phases which are named are a garnet phase, magnetite (Fe3O4) and rare earth oxide. For TFO the corresponding garnet phase is Tm3Fe5O12 (TIG), an insulating ferrimagnet, whose magnetization changes by a factor of around 3 between 200 K and 40 K [49]. Magnetite possesses a phase transition at 125 K below witch the coercivity increases drastically [50] and Tm2O3 is a paramagnetic material [51]. So none of these candidates seem to explain the similarity of the soft magnetic contributions at 40 K and 200 K in our TFO thin films. For hematite (-Fe2O3), a related component to orthoferrites, thin films possess a thin maghemite (-Fe2O2) layer at the substrate interface [52]. If we assume such a layer in our sample the magnetic signal corresponds to a maghemite volume fraction of 0.2% of the whole TFO layer thickness.
We cannot exclude the presence of this phase from XRD measurements since the count rate of such a small volume is around the noise level in our setup, even if it was well oriented.
Nevertheless, we see that the impact on electric measurements by the soft magnetic phase, whether maghemite or not, is negligible for our studies.
IV.5 XMLD
In order to confirm that our TFO thin films are antiferromagnetic, x-ray absorption spectra (XAS) where captured at the Fe edge for linear horizontal (LH) and vertical (LV) polarization as well as positive (C+) and negative circular (C-) polarization. The sample has been aligned with the orthorhombic axes in the reflection plane. The incident angle of the beam is . The data was processed as following: The reflected intensity was divided by the incident intensity of the x-ray beam to account for modulation of the incoming intensity. The background away from the and peak was subtracted to shift the baseline to zero of each curve. A correction factor has been multiplied to LH and C+ to align LH and LV as well as C+ and C- curves. XMLD and XMCD are calculated by XMLD= and XMCD=. The XMCD spectrum is shown in FIG. 6, while the XMLD spectrum is shown in the main text.
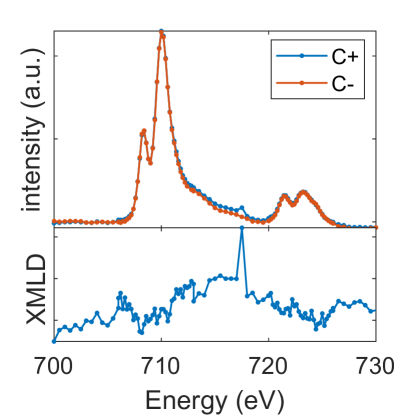
While for the XMLD spectrum we observe a clear signal around the edge, there is no clear signal to be identified in the XMCD spectrum. The lack of XMCD means that in the near-surface region we do not observe evidence of a ferromagnetic phase or the canted moment.
References
- Baltz et al. [2018] V. Baltz, A. Manchon, M. Tsoi, T. Moriyama, T. Ono, and Y. Tserkovnyak, Antiferromagnetic spintronics, Rev. Mod. Phys. 90, 015005 (2018).
- Jungwirth et al. [2016] T. Jungwirth, X. Marti, P. Wadley, and J. Wunderlich, Antiferromagnetic spintronics, Nature Nanotechnology 11, 231 (2016).
- Jungwirth et al. [2018] T. Jungwirth, J. Sinova, A. Manchon, X. Marti, J. Wunderlich, and C. Felser, The multiple directions of antiferromagnetic spintronics, Nature Physics 14, 200 (2018).
- Sulymenko et al. [2017] O. R. Sulymenko, O. V. Prokopenko, V. S. Tiberkevich, A. N. Slavin, B. A. Ivanov, and R. S. Khymyn, Terahertz-frequency spin hall auto-oscillator based on a canted antiferromagnet, Phys. Rev. Applied 8, 064007 (2017).
- Stremoukhov et al. [2019] P. Stremoukhov, A. Safin, M. Logunov, S. Nikitov, and A. Kirilyuk, Spintronic terahertz-frequency nonlinear emitter based on the canted antiferromagnet-platinum bilayers, Journal of Applied Physics 125, 223903 (2019).
- Wadley et al. [2016] P. Wadley, B. Howells, J. elezny, C. Andrews, V. Hills, R. P. Campion, V. Novak, K. Olejnik, F. Maccherozzi, S. S. Dhesi, S. Y. Martin, T. Wagner, J. Wunderlich, F. Freimuth, Y. Mokrousov, J. Kune, J. S. Chauhan, M. J. Grzybowski, A. W. Rushforth, K. W. Edmonds, B. L. Gallagher, and T. Jungwirth, Electrical switching of an antiferromagnet, Science 351, 587 (2016).
- Schlauderer et al. [2019] S. Schlauderer, C. Lange, S. Baierl, T. Ebnet, C. P. Schmid, D. C. Valovcin, A. K. Zvezdin, A. V. Kimel, R. V. Mikhaylovskiy, and R. Huber, Temporal and spectral fingerprints of ultrafast all-coherent spin switching, Nature 569, 383 (2019).
- Jourdan et al. [2015] M. Jourdan, H. Bräuning, A. Sapozhnik, H.-J. Elmers, H. Zabel, and M. Kläui, Epitaxial Mn2Au thin films for antiferromagnetic spintronics, Journal of Physics D: Applied Physics 48, 385001 (2015).
- Mix and Jakob [2013] C. Mix and G. Jakob, Multiferroic and structural properties of BiFeO3 close to the strain induced phase transition on different substrates, Journal of Applied Physics 113, 17D907 (2013).
- Baldrati et al. [2019] L. Baldrati, O. Gomonay, A. Ross, M. Filianina, R. Lebrun, R. Ramos, C. Leveille, F. Fuhrmann, T. R. Forrest, F. Maccherozzi, S. Valencia, F. Kronast, E. Saitoh, J. Sinova, and M. Kläui, Mechanism of Néel order switching in antiferromagnetic thin films revealed by magnetotransport and direct imaging, Phys. Rev. Lett. 123, 177201 (2019).
- Moriyama et al. [2018] T. Moriyama, K. Oda, T. Ohkochi, M. Kimata, and T. Ono, Spin torque control of antiferromagnetic moments in NiO, Scientific Reports 8, 14167 (2018).
- Ahn et al. [2014] S.-J. Ahn, J.-H. Lee, H. M. Jang, and Y. K. Jeong, Multiferroism in hexagonally stabilized TmFeO3 thin films below 120 K, J. Mater. Chem. C 2, 4521 (2014).
- Jin et al. [2019] L. Jin, Y. He, D. Zhang, H. Zhang, M. Wei, and Z. Zhong, Near-ultraviolet photodetector based on hexagonal TmFeO3 ferroelectric semiconductor thin film with photovoltaic and pyroelectric effects, APL Materials 7, 121105 (2019).
- Bossak et al. [2004] A. A. Bossak, I. E. Graboy, O. Y. Gorbenko, A. R. Kaul, M. S. Kartavtseva, V. L. Svetchnikov, and H. W. Zandbergen, XRD and HREM studies of epitaxially stabilized hexagonal orthoferrites RFeO3 (R = Eu-Lu), Chemistry of Materials 16, 1751 (2004).
- Akbashev et al. [2011] A. R. Akbashev, A. S. Semisalova, N. S. Perov, and A. R. Kaul, Weak ferromagnetism in hexagonal orthoferrites RFeO3 (r = lu, er-tb), Applied Physics Letters 99, 122502 (2011).
- Marezio et al. [1970] M. Marezio, J. P. Remeika, and P. D. Dernier, The crystal chemistry of the rare earth orthoferrites, Acta Crystallographica Section B 26, 2008 (1970).
- Leake et al. [1968] J. Leake, G. Shirane, and J. Remeika, The magnetic structure of thulium orthoferrite, TmFeO3, Solid State Communications 6, 15 (1968).
- Wolfe et al. [1967] R. Wolfe, R. D. Pierce, S. E. Haszko, and J. P. Remeika, Temperature-induced spin reorientation in rare earth orthoferrites — hysteresis loop studies, Applied Physics Letters 11, 245 (1967).
- White [1969] R. L. White, Review of recent work on the magnetic and spectroscopic properties of the rare-earth orthoferrites, Journal of Applied Physics 40, 1061 (1969).
- Treves [1965] D. Treves, Studies on orthoferrites at the Weizmann institute of science, Journal of Applied Physics 36, 1033 (1965).
- Staub et al. [2017] U. Staub, L. Rettig, E. M. Bothschafter, Y. W. Windsor, M. Ramakrishnan, S. R. V. Avula, J. Dreiser, C. Piamonteze, V. Scagnoli, S. Mukherjee, C. Niedermayer, M. Medarde, and E. Pomjakushina, Interplay of Fe and Tm moments through the spin-reorientation transition in TmFeO3, Phys. Rev. B 96, 174408 (2017).
- Kuroda et al. [2018] M. Kuroda, N. Tanahashi, T. Hajiri, K. Ueda, and H. Asano, Strain effect on magnetic property of antiferromagnetic insulator SmFeO3, AIP Advances 8, 055814 (2018).
- Zhou et al. [2020] J.-S. Zhou, L. G. Marshall, Z.-Y. Li, X. Li, and J.-M. He, Weak ferromagnetism in perovskite oxides, Phys. Rev. B 102, 104420 (2020).
- Momma and Izumi [2011] K. Momma and F. Izumi, VESTA3 for three-dimensional visualization of crystal, volumetric and morphology data, Journal of Applied Crystallography 44, 1272 (2011).
- Nakayama et al. [2013] H. Nakayama, M. Althammer, Y.-T. Chen, K. Uchida, Y. Kajiwara, D. Kikuchi, T. Ohtani, S. Geprägs, M. Opel, S. Takahashi, R. Gross, G. E. W. Bauer, S. T. B. Goennenwein, and E. Saitoh, Spin Hall magnetoresistance induced by a nonequilibrium proximity effect, Phys. Rev. Lett. 110, 206601 (2013).
- Lebrun et al. [2019] R. Lebrun, A. Ross, O. Gomonay, S. A. Bender, L. Baldrati, F. Kronast, A. Qaiumzadeh, J. Sinova, A. Brataas, R. A. Duine, and M. Kläui, Anisotropies and magnetic phase transitions in insulating antiferromagnets determined by a Spin-Hall magnetoresistance probe, Communications Physics 2, 50 (2019).
- Hajiri et al. [2019] T. Hajiri, L. Baldrati, R. Lebrun, M. Filianina, A. Ross, N. Tanahashi, M. Kuroda, W. L. Gan, T. O. Menteş, F. Genuzio, A. Locatelli, H. Asano, and M. Kläui, Spin structure and spin Hall magnetoresistance of epitaxial thin films of the insulating non-collinear antiferromagnet SmFeO3, Journal of Physics: Condensed Matter 31, 445804 (2019).
- Isasa et al. [2016] M. Isasa, S. Vélez, E. Sagasta, A. Bedoya-Pinto, N. Dix, F. Sánchez, L. E. Hueso, J. Fontcuberta, and F. Casanova, Spin Hall magnetoresistance as a probe for surface magnetization in Pt/CoFe2O4 bilayers, Phys. Rev. Applied 6, 034007 (2016).
- Vélez et al. [2016] S. Vélez, V. N. Golovach, A. Bedoya-Pinto, M. Isasa, E. Sagasta, M. Abadia, C. Rogero, L. E. Hueso, F. S. Bergeret, and F. Casanova, Hanle magnetoresistance in thin metal films with strong spin-orbit coupling, Phys. Rev. Lett. 116, 016603 (2016).
- Karplus and Luttinger [1954] R. Karplus and J. M. Luttinger, Hall effect in ferromagnetics, Phys. Rev. 95, 1154 (1954).
- Chen et al. [2016] Y.-T. Chen, S. Takahashi, H. Nakayama, M. Althammer, S. T. B. Goennenwein, E. Saitoh, and G. E. W. Bauer, Theory of spin Hall magnetoresistance (SMR) and related phenomena, Journal of Physics: Condensed Matter 28, 103004 (2016).
- Taskin et al. [2017] A. Taskin, H. F. Legg, F. Yang, S. Sasaki, Y. Kanai, K. Matsumoto, A. Rosch, and Y. Ando, Planar hall effect from the surface of topological insulators, Nature communications 8, 1 (2017).
- Kimata et al. [2019] M. Kimata, H. Chen, K. Kondou, S. Sugimoto, P. K. Muduli, M. Ikhlas, Y. Omori, T. Tomita, A. H. MacDonald, S. Nakatsuji, and Y. Otani, Magnetic and magnetic inverse spin Hall effects in a non-collinear antiferromagnet, Nature 565, 627 (2019).
- Binz and Vishwanath [2008] B. Binz and A. Vishwanath, Chirality induced anomalous-hall effect in helical spin crystals, Physica B: Condensed Matter 403, 1336 (2008).
- Vlietstra et al. [2013] N. Vlietstra, J. Shan, V. Castel, J. B. Youssef, G. E. W. Bauer, and B. J. van Wees, Exchange magnetic field torques in YIG/Pt bilayers observed by the spin-Hall magnetoresistance, Applied Physics Letters 103, 032401 (2013).
- Chen et al. [2013] Y.-T. Chen, S. Takahashi, H. Nakayama, M. Althammer, S. T. B. Goennenwein, E. Saitoh, and G. E. W. Bauer, Theory of spin hall magnetoresistance, Phys. Rev. B 87, 144411 (2013).
- E.A. Balykina [1987] G. K. E.A. Balykina, E.A. Gan’shina, Magnetooptic properties of rare-earth orthoferrites in the region of spin reorientation transitions, Journal of Experimental and Theoretical Physics 66, 1073 (1987).
- Gorodetsky et al. [1981] G. Gorodetsky, S. Shaft, and J. P. Remeika, Propagation of surface magnetoelastic waves in TmFeO3 at the spin reorientation, Journal of Applied Physics 52, 7353 (1981).
- Shang et al. [2016] T. Shang, Q. F. Zhan, H. L. Yang, Z. H. Zuo, Y. L. Xie, L. P. Liu, S. L. Zhang, Y. Zhang, H. H. Li, B. M. Wang, Y. H. Wu, S. Zhang, and R.-W. Li, Effect of NiO inserted layer on spin-Hall magnetoresistance in Pt/NiO/YIG heterostructures, Applied Physics Letters 109, 032410 (2016).
- LeCraw et al. [1968] R. C. LeCraw, R. Wolfe, E. M. Gyorgy, F. B. Hagedorn, J. C. Hensel, and J. P. Remeika, Microwave absorption near the reorientation temperature in rare earth orthoferrites, Journal of Applied Physics 39, 1019 (1968).
- Nečas and Klapetek [2012] D. Nečas and P. Klapetek, Gwyddion: an open-source software for SPM data analysis, Central European Journal of Physics 10, 181 (2012).
- Ross et al. [2019] A. Ross, R. Lebrun, O. Gomonay, D. A. Grave, A. Kay, L. Baldrati, S. Becker, A. Qaiumzadeh, C. Ulloa, G. Jakob, F. Kronast, J. Sinova, R. Duine, A. Brataas, A. Rothschild, and M. Kläui, Propagation length of antiferromagnetic magnons governed by domain configurations, Nano Letters 20, 306 (2019).
- Horng et al. [2004] L. Horng, G. Chern, M. Chen, P. Kang, and D. Lee, Magnetic anisotropic properties in Fe3O4 and CoFe2O4 ferrite epitaxy thin films, Journal of Magnetism and Magnetic Materials 270, 389 (2004).
- Rigato et al. [2009] F. Rigato, J. Geshev, V. Skumryev, and J. Fontcuberta, The magnetization of epitaxial nanometric CoFe2O4 (001) layers, Journal of Applied Physics 106, 113924 (2009).
- Zhang et al. [2008] Y. Zhang, C. Deng, J. Ma, Y. Lin, and C.-W. Nan, Enhancement in magnetoelectric response in CoFe2O4–BaTiO3 heterostructure, Applied Physics Letters 92, 062911 (2008).
- Rodewald et al. [2019] J. Rodewald, J. Thien, T. Pohlmann, M. Hoppe, F. Timmer, F. Bertram, K. Kuepper, and J. Wollschläger, Formation of ultrathin cobalt ferrite films by interdiffusion of Fe3O4/CoO bilayers, Phys. Rev. B 100, 155418 (2019).
- Schmool et al. [1999a] D. S. Schmool, N. Keller, M. Guyot, R. Krishnan, and M. Tessier, Magnetic and magneto-optic properties of orthoferrite thin films grown by pulsed-laser deposition, Journal of Applied Physics 86, 5712 (1999a).
- Schmool et al. [1999b] D. Schmool, N. Keller, M. Guyot, R. Krishnan, and M. Tessier, Evidence of very high coercive fields in orthoferrite phases of PLD grown thin films, Journal of Magnetism and Magnetic Materials 195, 291 (1999b).
- Pauthenet [1958] R. Pauthenet, Spontaneous magnetization of some garnet ferrites and the aluminum substituted garnet ferrites, Journal of Applied Physics 29, 253 (1958).
- Özden Özdemir et al. [2002] Özden Özdemir, D. J. Dunlop, and B. M. Moskowitz, Changes in remanence, coercivity and domain state at low temperature in magnetite, Earth and Planetary Science Letters 194, 343 (2002).
- Gondek et al. [2010] Ł. Gondek, D. Kaczorowski, and A. Szytuła, Low temperature studies on magnetic properties of Tm2O3, Solid State Communications 150, 368 (2010).
- Barbier et al. [2005] A. Barbier, R. Belkhou, P. Ohresser, M. Gautier-Soyer, O. Bezencenet, M. Mulazzi, M.-J. Guittet, and J.-B. Moussy, Electronic and crystalline structure, morphology, and magnetism of nanometric Fe2O3 layers deposited on Pt(111) by atomic-oxygen-assisted molecular beam epitaxy, Phys. Rev. B 72, 245423 (2005).