TOI 540 b: A Planet Smaller than Earth Orbiting a Nearby Rapidly Rotating Low-mass Star
Abstract
We present the discovery of TOI 540 b, a hot planet slightly smaller than Earth orbiting the low-mass star 2MASS J05051443-4756154. The planet has an orbital period of days ( 170 ms) and a radius of R⊕, and is likely terrestrial based on the observed mass-radius distribution of small exoplanets at similar insolations. The star is 14.008 pc away and we estimate its mass and radius to be M☉ and R☉, respectively. The star is distinctive in its very short rotational period of hours and correspondingly small Rossby number of 0.007 as well as its high X-ray-to-bolometric luminosity ratio of based on a serendipitous XMM-Newton detection during a slew operation. This is consistent with the X-ray emission being observed at a maximum value of as predicted for the most rapidly rotating M dwarfs. TOI 540 b may be an alluring target to study atmospheric erosion due to the strong stellar X-ray emission. It is also among the most accessible targets for transmission and emission spectroscopy and eclipse photometry with JWST, and may permit Doppler tomography with high-resolution spectroscopy during transit. This discovery is based on precise photometric data from TESS and ground-based follow-up observations by the MEarth team.
1 Introduction
Obtaining a representative sample of rotation periods in planet-hosting M dwarfs is important due to the established link between rotation rate and stellar activity. Stars exhibit continual angular momentum loss due to magnetic braking, which subsequently decreases the strength of the stellar magnetic dynamo, leading to a decrease in activity (Skumanich, 1972). Consequently, rapidly rotating stars tend to have higher levels of coronal X-ray emission (Wright et al., 2018). Elevated X-ray and UV emission are known tracers of increased magnetic activity (Gronoff et al., 2020) and will have profound consequences on the atmospheric mass loss and potential habitability of any terrestrial planets in the system (e.g. Garcia-Sage et al., 2017).
The vast majority of recent discoveries of terrestrial planets orbiting M dwarfs are in systems with relatively inactive host stars, characterized by stellar rotation periods longer than 100 days. Rapidly rotating stars present observational challenges for planet detection. Rotational broadening of spectral lines significantly degrades radial velocity (RV) precision, and irregularities of emitted flux from starspots and faculae that are rapidly shifting in and out of view across the stellar surface can imprint complicated modulations in the star’s observed flux, hampering transit detection. In addition, rapid rotation in M dwarfs also correlates with more frequent flare emission (Davenport, 2016, and references therein), further contaminating the light curve. In particular, the current sample of terrestrial planet hosts within 15 pc of the Sun includes no red dwarfs with rotation periods less than a day, and only one ultracool dwarf with a rotation period below 10 days: TRAPPIST-1, which has an estimated days (Gillon et al., 2016) or days (Luger et al., 2017).
Transiting planets with radii around or less than 1R⊕ are of special interest since they are likely to be terrestrial even in the absence of mass constraints from precise RV or transit-timing variation (TTV) data. Weiss & Marcy (2014) and Rogers (2015) identified two distinct regimes in the mass-radius relation for small exoplanets: planets below a threshold radius of 1.5R⊕ tend to have bulk densities consistent with a rocky composition whereas those above that threshold possess a large fraction of volatiles by volume. These results were based on numerous RV studies that had obtained masses for small transiting planets around G and K dwarfs such as Kepler-10 (Batalha et al., 2011), Kepler-78 (Howard et al., 2013; Pepe et al., 2013), and Kepler-93 (Dressing et al., 2015). Recent RV measurements have established rocky bulk composition for many small planets orbiting M dwarfs as well, including L 98-59 (Cloutier et al., 2019), LHS 1140 (Ment et al., 2019), LTT 3780 (Cloutier et al., 2020a), and TRAPPIST-1 (Grimm et al., 2018). Consistent with the interpretation of two distinct planet populations, Fulton et al. (2017) noticed a deficit of planets with radii 1.5-2R⊕ (a ”radius valley”). The radius valley likely arises as a result of photoevaporation (Lopez & Fortney, 2013; Owen & Wu, 2013, 2017; Lopez & Rice, 2018), core-powered mass loss (Ginzburg et al., 2018), or formation in a gas-poor environment (Lee et al., 2014; Lopez & Rice, 2018). Its existence was demonstrated specifically for K and M dwarfs by Cloutier & Menou (2020) using K2 photometry.
Upcoming exo-atmospheric studies with state-of-the-art instruments such as the James Webb Space Telescope (JWST) and ground-based 30-meter telescopes will primarily focus on the planets orbiting M dwarfs closest to the Solar System. This is due to photon statistics as well as the relative size of the planet compared to the star that make both transmission and emission spectroscopy tractable (Morley et al., 2017). There are currently (as of April 2020) only ten stars within 15 pc of the Sun that are known to host transiting planets: the M dwarfs LTT 1445 A (Winters et al., 2019), GJ 357 (Luque et al., 2019), GJ 436 (Butler et al., 2004; Gillon et al., 2007), L 98-59 (Kostov et al., 2019), TRAPPIST-1 (Gillon et al., 2016, 2017a), GJ 1132 (Berta-Thompson et al., 2015; Bonfils et al., 2018), GJ 1214 (Charbonneau et al., 2009), LHS 3844 (Vanderspek et al., 2019), LHS 1140 (Dittmann et al., 2017; Ment et al., 2019), and the K dwarfs 55 Cnc A (McArthur et al., 2004; Winn et al., 2011) and HD 219134 (Motalebi et al., 2015; Vogt et al., 2015; Gillon et al., 2017b); only two of those systems (L 98-59 and TRAPPIST-1) are known to host planets smaller than 1R⊕. Four of the planetary systems described above (LTT 1445, GJ 357, L 98-59, and LHS 3844) were discovered with the Transiting Exoplanet Survey Satellite (TESS; Ricker et al., 2015).
This article presents the discovery of TESS Object of Interest (TOI) 540 b, a 0.9R⊕ planet on a 1.24-day orbit discovered by TESS. With a rotation period of 17.4 hours, TOI 540 is rotating more rapidly than TRAPPIST-1, the only other rapidly rotating planet host within 15 pc. We complement TESS photometry with ground-based follow-up photometry from MEarth, confirming the planetary nature of the candidate. In addition, we present RV measurements from CHIRON and HARPS, speckle imaging from SOAR, and X-ray data from XMM-Newton and ROSAT.
2 Properties of the host star
TOI 540, otherwise known as 2MASS J05051443-4756154 (Cutri et al., 2003; Skrutskie et al., 2006) and UCAC4 211-005570 (Finch et al., 2014), is a nearby main-sequence M dwarf. Based on the parallax measurement of reported in Gaia DR2 (Gaia Collaboration et al., 2018; Lindegren et al., 2018), we calculate a distance of pc from Earth. TOI 540 has a low proper motion for a nearby star ( mas yr-1, mas yr-1) which likely prevented it from being widely identified as a nearby star before Gaia. The proper motion is also too low to enable ruling out the presence of background stars from archival images (in Section 3.4, we present high-angular-resolution images that rule out the presence of other bright stars in the immediate vicinity). To obtain an estimate for the mass of the star, we use the mass-luminosity relationship for main-sequence M dwarfs in Benedict et al. (2016) and the -band apparent magnitude of 8.900 0.021 from 2MASS. This yields a stellar mass of M☉. We determine the stellar radius by using two different mass-radius relations: one determined from optical interferometry of single stars in Boyajian et al. (2012), and another from eclipsing binary measurements in Bayless & Orosz (2006). The former yields R☉, and the latter produces R☉. We then calculate a weighted average of the two estimates, obtaining R☉. We note that this is also consistent with the radius-luminosity relation in Mann et al. (2015), which predicts R☉. Informed by these relationships, we refine our estimate of the stellar radius using transit geometry in Section 4 and report the final value in Table 3.
In order to determine the color indices of TOI 540, we adopt the -, -, and -band magnitudes from 2MASS (Skrutskie et al., 2006), and we obtained -photometry from RECONS***REsearch Consortium On Nearby Stars (www.recons.org). The -photometry was collected on the night of 20 Aug 2019, with exposure times of 300, 180, and 75 seconds, respectively. The RECONS fluxes were extracted using a 4″ radius aperture to minimize contamination from a nearby background star, described in Section 2.1. The VRI magnitudes for TOI 540 are reported in Table 3.
The luminosity of TOI 540 can be estimated from bolometric corrections (). In particular, interpolating between the values as a function of in Table 5 of Pecaut & Mamajek (2013) yields a bolometric correction of , corresponding to a luminosity of L☉. Alternatively, using the derived third-order polynomial fit between and in Mann et al. (2015, and its erratum), we obtain , which gives us a luminosity of L☉. Finally, we use the relationship between and in Leggett et al. (2001) to produce and L☉. We take as our final value the mean and the standard deviation of the three luminosity estimates, L☉. This allows us to use the Stefan-Boltzmann law to determine the effective stellar temperature via , yielding K. We adopted the solar values of mag and K cited in Mamajek (2012).
Due to the slow evolution of M dwarfs in their rapid rotation stage, we are unable to place tight constraints on the age of the system. However, we note that TOI 540 is not overluminous (based on the observed color and luminosity), and therefore it is likely to be on the main sequence, implying an age greater than 100 Myr (Baraffe et al., 2002). Based on the galactic space velocity and established age-velocity relations, and the observed rapid stellar rotation, we can place an upper limit of 2 Gyr on the system (Newton et al., 2016). We also estimate the average equivalent width of H emission from the four CHIRON spectra described in Section 3.3 to be Å, consistent with TOI 540 not being a pre-main sequence star. Finally, we use BANYAN (Gagné et al., 2018) to investigate TOI 540’s potential membership of young stellar associations based on its location in XYZUVW space (calculated from the coordinates, proper motion, and RV values), and rule out 27 well-characterized young associations within 150 pc with 99.9% confidence.
TOI 540 is a highly magnetically active star as indicated by the photometric modulation due to stellar spots and the numerous flares present in each sector of TESS data. Measuring how often TOI 540 flares is essential to understanding the environment in which its planet resides. The flare frequency distribution describes the rate of flares as function of energy and follows the probability distribution (Lacy et al., 1976, equation 2) where is the slope of the power law and is a normalization constant. Using the methods outlined in Medina et al. (submitted†††Medina, A. A., Winters, J. G., Irwin, J. M., & Charbonneau, D., submitted), we find and measure a rate of 0.12 flares per day above an energy of ergs in the TESS bandpass. Medina et al. find that TOI 540 has a flare rate that is consistent with other stars of a similar mass and rotation period.
2.1 A neighboring star 6″ away
Our efforts are complicated by a neighboring background star at a distance of 6″ from TOI 540. We first noticed this background source in MEarth follow-up photometry (described in Section 3.2) and subsequently identified it in Gaia DR2. It has a Gaia ID of 4785886975670558336 and is 2.26 magnitudes fainter than the main target in the passband. While both the neighboring star and TOI 540 occupy the same TESS pixel, we are able to resolve the two stars using MEarth photometry and confirm that the planet does indeed transit TOI 540. In particular, we extract the light curve of TOI 540 using variable aperture sizes and find that the transit persists with a similar depth down to an aperture of 2.5″, a size small enough to exclude the neighboring star.
3 Observations
3.1 TESS photometry
TESS collected photometry of TOI 540 in observation sectors 4, 5, and 6, with the observations spanning a nearly three-month period from 19 October 2018 to 6 January 2019. The star was included in the TESS Input Catalog (TIC) with a TIC ID of 200322593 as well as the TESS Candidate Target List (CTL; Stassun et al., 2018), and TESS Guest Investigator programs G011180 (PI: Courtney Dressing) and G011231 (PI: Jennifer Winters). We utilize the two-minute cadence Presearch Data Conditioning (PDCSAP; Smith et al., 2012; Stumpe et al., 2012, 2014) light curve reduced with the NASA Ames Science Processing Operations Center (SPOC) pipeline (Jenkins et al., 2016). The PDCSAP fluxes have been corrected for instrumental systematic effects as well as crowding: unresolved light from other nearby stars listed in the TIC v7. While the background source from Section 2.1 is listed in version 8 of TIC, it did not appear in version 7 that was used to reduce the TESS photometry presented in this work. Based on TIC v8, the background star is 4.46 magnitudes fainter than TOI 540 in the TESS bandpass. This leads to an error of 1.6% in the measured transit depth, or 0.8% in the planetary radius. The latter is much smaller than the final uncertainty of 5.8% derived in this work (Table 5). Therefore, we have not corrected the TESS light curve presented in Section 3.1 for the additional flux dilution due to this neighboring source.
A planetary candidate with an orbital period of 1.239 days was initially detected by SPOC in sector 4 Data Validation Reports (DVR; Twicken et al., 2018; Li et al., 2019) with a signal-to-noise ratio of 8.9, based on 16 transits. TESS ultimately observed 50 transits of TOI 540 b over the three sectors, with an average transit depth of 2168 172 ppm, yielding a signal-to-noise ratio of 15.6. However, the correct spectral type and stellar radius was undefined in the TIC (v7) and therefore assumed to be 1R☉ during the preparation of the DVR, leading to a substantially overestimated planetary radius of 5R⊕.
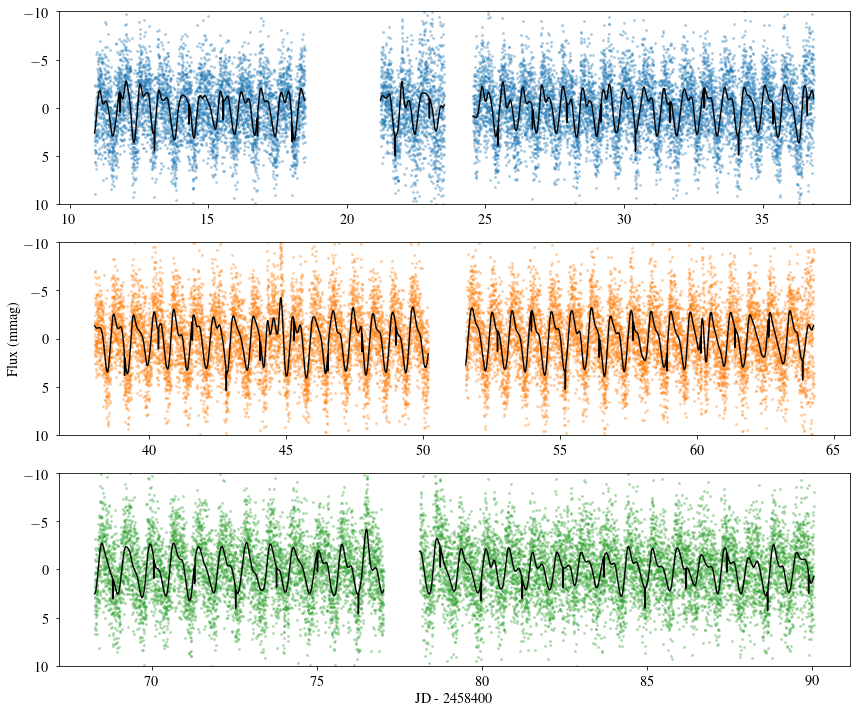
We make use of the full PDCSAP light curve from which we remove bright outliers (more than 0.02 mag brighter than the mean flux) that constitute 0.099% of the total TESS data and may be caused by contamination from flares. The data clipping is done to ensure consistency between the handling of TESS and MEarth data sets (see Section 3.2). The final TESS light curve consists of 48,445 individual data points, and can be seen in Figure 1. We note that per the TESS Data Release Notes of Sector 4‡‡‡https://archive.stsci.edu/missions/tess/doc/tess_drn/tess_sector_04_drn05_v04.pdf, an interruption in communications between the instrument and spacecraft resulted in an instrument turn-off for 2.7 days, during which no data were collected.
3.2 MEarth follow-up photometry
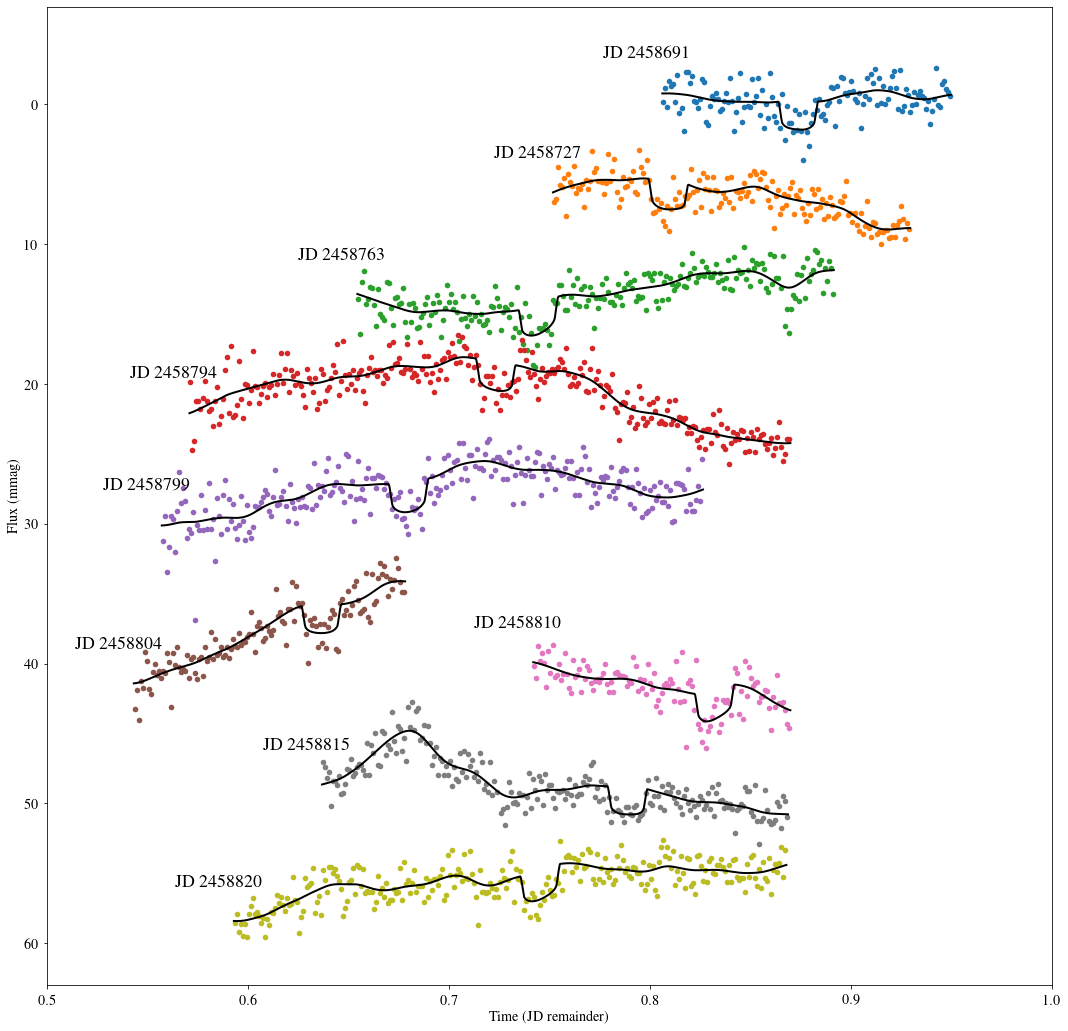
Using the eight 40cm aperture telescopes of the MEarth-South telescope array at the Cerro Tololo International Observatory (CTIO) in Chile (Nutzman & Charbonneau, 2008; Irwin et al., 2015), we conducted follow-up observations of TOI 540 to confirm the transits of the terrestrial planet. The MEarth-South telescopes employ a custom bandpass centered at the red end of the optical spectrum (similar to TESS). We observed 10 transits of TOI 540 b between 27 July 2019 and 8 December 2019, using an exposure time of 40 seconds per measurement. However, we discarded the data from the transit on Dec 8th due to a stellar flare shortly following the transit egress, which would have led to needless challenges in modeling the out-of-transit flux baseline. Therefore, we proceeded by including the data from the first 9 transits only. Aperture photometry was carried out in all images using a fixed aperture radius of 6 pixels, or 5.1″. After excluding outliers 0.02 mag brighter than the mean flux (0.068% of the data set), the MEarth light curve contains a combined 17,879 data points from all eight telescopes. The individual light curves from each visit are shown in Figure 2.
3.3 CHIRON and HARPS spectroscopy
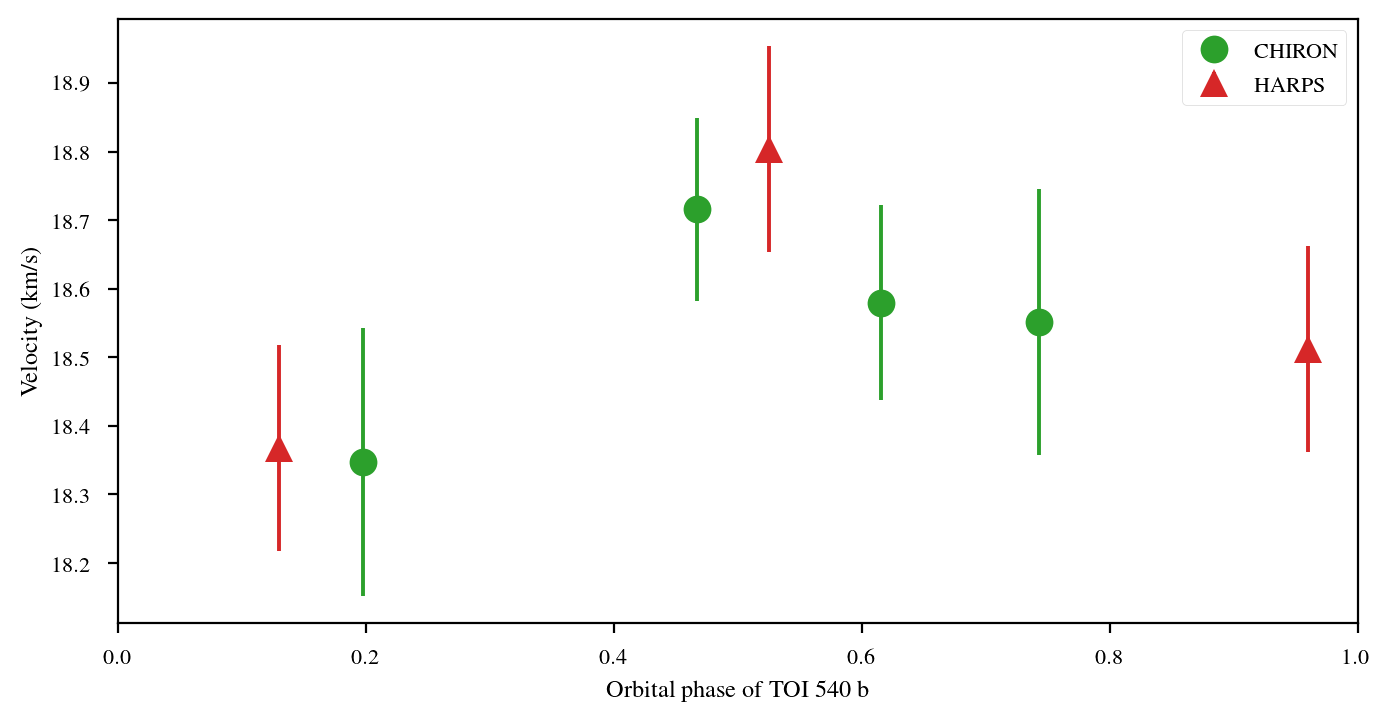
We gathered 4 reconnaissance spectra of TOI 540 with the CHIRON spectrograph (Tokovinin et al., 2013) mounted on the CTIO/SMARTS 1.5-meter telescope at CTIO. The spectra were accumulated as part of a nearly volume-complete spectroscopic survey of nearby mid-to-late M dwarfs. The methods by which we determined the radial velocities and rotation broadening, below, are described in Winters et al. (2020). The observations were carried out between Sep 2018 and Nov 2019 in 3x20-minute exposures per observation, employing the image slicer mode for a resolution of . We obtained multi-order RVs from 6 spectral orders (see Table 1) as well as an estimated projected rotation velocity of km s-1. In addition, we collected 3 spectra using the HARPS spectrograph (Mayor et al., 2003) mounted on the ESO 3.6-meter telescope at La Silla. The HARPS spectrograph has a measured spectral resolution of . The observations were carried out in April 2019 (ESO HARPS Program 0103.C-0442, PI: Díaz) with a 30-minute exposure time. We estimated the RVs by combining 21 spectral orders and calculated a of 12.93 km/s. The RVs are displayed in Figure 3.
| BJD (TDB) | RV | Uncertainty | Instrument |
|---|---|---|---|
| (km/s) | (km/s) | ||
| 2458385.8447 | 18.5791 | 0.142 | CHIRON |
| 2458576.5615 | 18.9040 | 0.1886 | HARPS |
| 2458578.5499 | 18.4817 | 0.1375 | HARPS |
| 2458579.5788 | 18.6201 | 0.1221 | HARPS |
| 2458607.4689 | 18.7156 | 0.133 | CHIRON |
| 2458801.6815 | 18.3476 | 0.195 | CHIRON |
| 2458803.5955 | 18.5508 | 0.194 | CHIRON |
We adopt the mean of the two rotation velocity estimates as our final value, obtaining km s-1. This yields a rotation period estimate of days, consistent with the photometrically-determined rotation period of 0.72610 days from Section 4 for , suggesting that the sky-projected stellar obliquity is likely close to 90°. The values were generated by applying appropriate rotational broadening to an observed M dwarf spectrum.
We note that our RV measurements have uncertainties greater than 100 m s-1, estimated from theoretical uncertainties for a rotating star (e.g. Bouchy et al., 2001) with inflation to account for RV scatter in between the spectral orders. The large uncertainties are driven by the low signal-to-noise ratios of the spectra (typically 5-10) due to the star being substantially redder than what is optimal for the spectrographs and settings that were used to collect these spectra. The HARPS spectra were gathered in the Simultaneous Reference mode using a Thorium-Argon lamp which significantly degrades the spectrum in the red orders. Rotational broadening of spectral lines also contributes to the degradation of RV precision. The reported errors are on a par with the RMS of the RVs (163 m s-1).
Employing the estimated mass of the planet from Section 5, the RV semi-amplitude for TOI 540 b corresponding to a circular orbit would be m/s. Therefore, the rapid rotation of the star makes direct mass measurements with RVs currently unfeasible. However, the RVs help rule out a close-in massive companion: the standard deviation of all 7 measurements is 167 m/s, close to the individual uncertainties, and there is no evidence of a trend. In particular, we are able to rule out a companion with a mass of at the orbital period of the transiting planet with 99.7% (3-sigma) confidence. This was estimated by fitting an RV model with the period, epoch, and eccentricity fixed to the values in Table 3, and calculating the appropriate semi-amplitude for which the CDF of the distribution has a -value below 0.0027.
3.4 SOAR speckle imaging
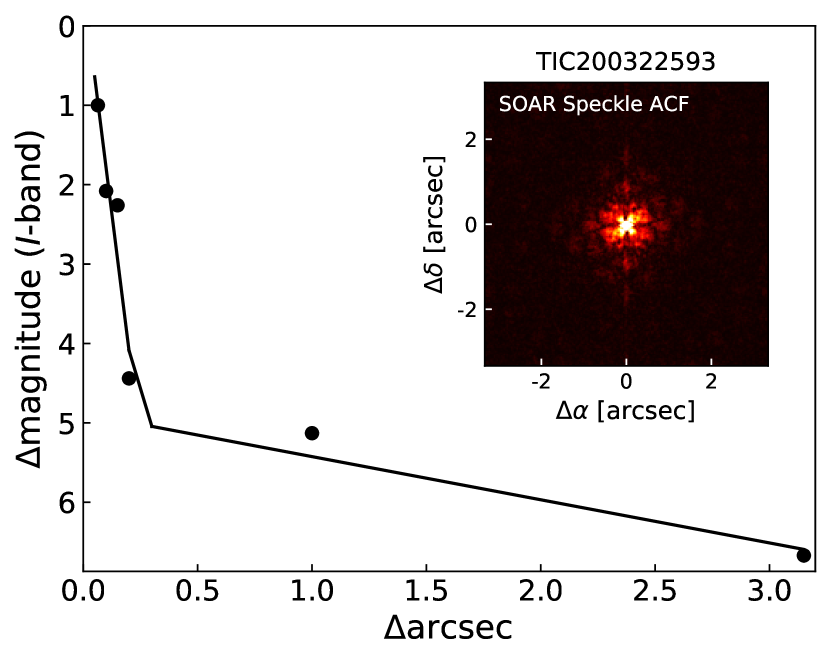
Nearby stars that fall within the same 21″ TESS pixel as the target can cause photometric contamination or be the source of an astrophysical false positive. We searched for nearby sources to TOI 540 with SOAR speckle imaging (Tokovinin, 2018) on 14 July 2019 UT, observing in the visible -bandpass. Details of the observation are available in Ziegler et al. (2020). We detected no nearby sources within 3″ of TOI 540, corresponding to a projected distance of 42 AU. The 5-sigma detection sensitivity and the speckle auto-correlation function (contrast curve) from the SOAR observation are plotted in Figure 4.
3.5 X-ray detections by XMM-Newton and ROSAT
A testament to its significant X-ray brightness, TOI 540 was detected by XMM-Newton during a slew operation on 27 July 2004. The detection appears in the XMM Slew 2 catalog with a source ID of XMMSL2 J050514.2-475618 (Slew Obs. ID 9084800002). The flux of the target is listed as ergs s-1 cm-2 in the soft 0.2-2 keV bandpass and ergs s-1 cm-2 in the total 0.2-12 keV bandpass. No detection is listed separately in the hard 2-12 keV bandpass. For consistency with Wright et al. (2018), we convert the soft bandpass flux into the ROSAT bandpass of 0.1-2.4 keV. We use the APEC§§§Astrophysical Plasma Emission Code, http://www.atomdb.org/ model at solar abundance and a plasma temperature of keV. The conversion is done using PIMMS¶¶¶The Portable Interactive Multi-Mission Simulator, https://heasarc.gsfc.nasa.gov/docs/software/tools/pimms.html and yields an X-ray flux of ergs s-1 cm-2 in the ROSAT bandpass. This corresponds to an X-ray-to-bolometric luminosity ratio of , consistent with measured by Wright et al. (2018) for rapidly rotating stars. The implications of this are further discussed in Section 5.
TOI 540 also appears in the second ROSAT all-sky survey source catalog (Boller et al., 2016) with a source name of J050514.2-475625. It was observed by ROSAT in August 1990 with a count rate of counts s-1 in the 0.1-2.4 keV energy band. Using the aforementioned APEC model leads to a somewhat lower X-ray flux estimate of ergs s-1 cm-2; however, the error on the count rate is substantial.
4 Modeling of TESS and MEarth light curves
We analyze the MEarth and TESS light curve data simultaneously with the Python package exoplanet (Foreman-Mackey et al., 2019), which is a framework built on the Hamiltonian Monte Carlo methods implemented in PyMC3 (Salvatier et al., 2016) via Theano (Theano Development Team, 2016) for computationally efficient sampling. Importantly, exoplanet extends the basic support for Gaussian Process (GP) modeling in PyMC3 by implementing Scalable GPs through celerite (Foreman-Mackey, 2018), which makes the otherwise notoriously slow GP modeling much more tractable. Our model has multiple components that are optimized simultaneously, described in the following sections.
We model the rotational modulation in the TESS photometry with a GP employing exoplanet’s Rotation kernel, which has a covariance function that is a sum of two stochastically-driven harmonic oscillators (SHO):
| (1) |
where the covariance function of a single SHO is given by:
| (2) |
with . Thus, the rotation kernel has five parameters: the quality factors and , the rotation period , the primary amplitude , and the amplitude ratio . We note that the two SHO components correspond to the first and second harmonics of the oscillation, with the latter having twice the frequency (or equivalently, half the period) of the former. This type of kernel has been shown to successfully model a range of complicated rotationally modulated signals (Haywood et al., 2014; Soto et al., 2018; Winters et al., 2019; Cloutier et al., 2020b). The parameters of the kernel are constrained with normal and uniform prior distributions, documented in Table 2. We obtain an initial estimate of 17.4 hours for by fitting a sum of two sinusoids to the TESS light curve, and we subsequently constrain with a normal prior distribution centered at that value. The prior for is centered at the value corresponding to the variance of the observed TESS light curve. We note that since will always be positive with this setup, the quality parameters and of both SHOs are guaranteed to remain above in Equation 2.
The MEarth follow-up photometry is modeled with a separate covariance kernel. This is due to the additional contribution from precipitable water vapor that induces strong non-linear trends into the individual light curves of each night. The form of the kernel is as follows:
| (3) |
which, for small values of , approximates the well-known Matérn-3/2 kernel:
| (4) |
Here, is fixed to a standard value of 0.01. The exact form of the Matérn-3/2 kernel (Eq. 4) cannot be implemented within the framework of celerite, and we therefore need to use the approximate form of Eq. 3. The timescale parameter is constrained with a Gaussian prior centered at 30 minutes, which we expect to be the typical minimum timescale for variations in precipitable water vapor in the atmosphere. The prior for is centered at the value corresponding to the variance of the observed MEarth light curve. We note that due to the estimated stellar rotation period of 17.4 hours, the kernel in Eq. 3 is also able to absorb the rotational modulation with the exponential decay timescale being much shorter than the rotation period, whereas a quasi-periodic kernel (such as Eq. 1) would be misled by the non-periodic changes in water vapor content. We did experiment with a kernel that combined both a quasi-periodic and a Matérn-3/2 term, but we ultimately found it impossible to decouple the effects of stellar rotation and water vapor variations in a statistically significant way. Thus, the Matérn-3/2 kernel is our preferred model to account for both periodic as well as non-periodic modulations in the high-cadence but short-baseline MEarth follow-up data.
Transits of TOI 540 b are modeled using the starry module (Luger et al., 2019) included in exoplanet. A single transit model is fitted simultaneously to TESS and MEarth photometry. While the model presented here does not account for the non-zero exposure times, we did test a model light curve that was oversampled and integrated over the different exposures (also with exoplanet) and found the differences to be negligible. The free parameters in the model are the transit midpoint , the orbital period , the planet-to-star radius ratio , and the impact parameter . The first two ( and ) are constrained relatively tightly with Gaussian priors since they can be pre-determined with good precision from the TESS data alone. The two dimensionless parameters ( and ) have uniform prior distributions. We also include quadratic limb darkening, with the appropriate coefficients adopted from Table 5 of Claret (2018) for the spherical PHOENIX-COND limb darkening model (Husser et al., 2013). In particular, we use and , corresponding to a local gravity of , an effective temperature of 3200 K, and the TESS bandpass. We separately estimated the limb darkening coefficients for the MEarth optical filter following the process outlined in Section 6.1 of Irwin et al. (2018). However, due to the similarity between the MEarth and TESS bandpasses, we found no meaningful difference between using either set of limb darkening coefficients: the resulting discrepancy in the modeled light curve was orders of magnitude smaller than the measurement uncertainty. Therefore, we decided to simplify the modeling by adopting the TESS limb darkening coefficients given above for both data sets.
In addition, we allow for a baseline flux as well as additional white noise (added in quadrature to each individual flux uncertainty) in the TESS and MEarth data as additional model parameters. They are loosely constrained with Gaussian prior distributions. The priors for excess white noise are centered at the values corresponding to the smallest individual flux uncertainties in the respective data sets. A comprehensive list of all model parameters is given in Table 2.
| Parameter | Explanation | Prior | Value | Units |
|---|---|---|---|---|
| TESS flux baseline | -0.025 0.025 | mmag | ||
| TESS excess white noise | -8.44 2.04 | mmag2 | ||
| MEarth flux baseline | -0.49 0.40 | mmag | ||
| MEarth excess white noise | 1.154 0.028 | mmag2 | ||
| Stellar mass | Table 3 | M☉ | ||
| Stellar radius | Table 3 | R☉ | ||
| Quality parameter | 1.07 0.19 | - | ||
| Quality parameter | 7.88 0.80 | - | ||
| Stellar rotation period | Table 3 | days | ||
| Covariance amplitude | 0.54 0.63 | mmag2 | ||
| Covariance amp. ratio | 0.54 0.25 | - | ||
| Covariance amplitude | 0.711 0.080 | mmag2 | ||
| Covariance decay timescale | 0.0463 0.0028 | days | ||
| Transit midpoint | Table 3 | BJD | ||
| Orbital period | Table 3 | days | ||
| Planet-star radius ratio | Table 3 | - | ||
| Impact parameter | Table 3 | - |
Note. — denotes a normal distribution. denotes a uniform distribution.
We note that our reported model assumes a circular orbit (zero eccentricity). Due to the short orbital period of the planet, it is reasonable to expect that tidal dissipation has damped any initial amount of orbital eccentricity to an undetectably small level. Based on the work of Goldreich & Soter (1966), the expected tidal circularization timescale is close to 150,000 years (assuming the estimated bulk density from Section 5 and a specific dissipation function of , which is appropriate for terrestrial planets), much shorter than the expected age of the system. Allowing the eccentricity and the angle of periastron passage to fluctuate produces a posterior probability distribution that is consistent with at the cost of significantly broadening the posterior distributions of several other parameters (such as the impact parameter ) that alter the light curve in a similar way. Since an eccentricity much greater than zero would be inconsistent with the tidal circularization timescale, we keep fixed to 0 to constrain the other parameters better.
We proceed to tune and sample the model posterior distributions with PyMC3. The MCMC sampling is done in parallel in 4 independent chains. Sampling from each chain begins with a burn-in phase of 1000 steps with an automatically tuned step size such that the acceptance fraction approaches 90%, which facilitates convergence in complicated posterior distributions. We draw 1000 samples from each chain, for a total of 4000 samples. The sample distributions from each chain can be compared to each other to detect possible issues related to convergence. We detect no such problems: the resulting parameter distributions from the four chains are all consistent with one another. We report the means and the standard deviations of the modeled transit parameters from the 4000 samples in Table 3 as well as the rest of the parameters (including hyperparameters) in Table 2. The results of the modeling are described in detail in Section 5, and the modeled light curve can be seen overlaid on top of the TESS and MEarth raw data in Figures 1 and 2, respectively.
| Parameter | Values for TOI 540 | Sourceaa(1) Gaia Collaboration et al. (2018), (2) Skrutskie et al. (2006), (3) This work. |
|---|---|---|
| Stellar parameters | ||
| Right ascension (J2000) | 05h 05min 14.4s | (1) |
| Declination (J2000) | -47∘ 56’ 15.5” | (1) |
| Proper motion (mas yr-1) | (1) | |
| Apparent brightness (mag) | (3) | |
| (3) | ||
| (3) | ||
| (2) | ||
| (2) | ||
| (2) | ||
| Distance (pc) | 14.0078 0.0088 | (1) |
| Mass (M☉) | 0.159 0.014 | (3) |
| Radius (R☉) | 0.1895 0.0079 | (3) |
| Luminosity (L☉) | 0.00346 0.00021 | (3) |
| Fractional X-ray luminosity | 0.0028 | (3) |
| X-ray fluxbbThe X-ray flux is given in the ROSAT bandpass of 0.1-2.4 keV. (ergs s-1 cm-2) | (3) | |
| Effective temperature (K) | 3216 83 | (3) |
| Age (Gyr) | 0.1-2 Gyr | (3) |
| Rotational period (days) | 0.72610 0.00039 | (3) |
| Projected rotation velocity (km/s) | 13.5 1.5 | (3) |
| Parameter | Values for TOI 540 b | |
| Modeled transit parameters | ||
| Orbital period (days) | 1.2391491 0.0000017 | |
| Eccentricity | 0 (fixed) | |
| Time of mid-transit (BJD) | 2458411.82601 0.00046 | |
| Impact parameter | 0.772 0.029 | |
| Planet-to-star radius ratio | 0.0436 0.0012 | |
| ratio | 13.90 0.72 | |
| Derived planetary parameters | ||
| Radius (R⊕) | 0.903 0.052 | |
| Semi-major axis (AU) | 0.01223 0.00036 | |
| Inclination (deg) | 86.80 0.28 | |
| incident flux (S⊕) | 23.4 2.1 | |
| Equilibrium temperatureccThe equilibrium temperature assumes a Bond albedo of 0. For an albedo of , the reported temperature has to be multiplied by . (K) | 611 23 | |
5 Discussion and conclusion
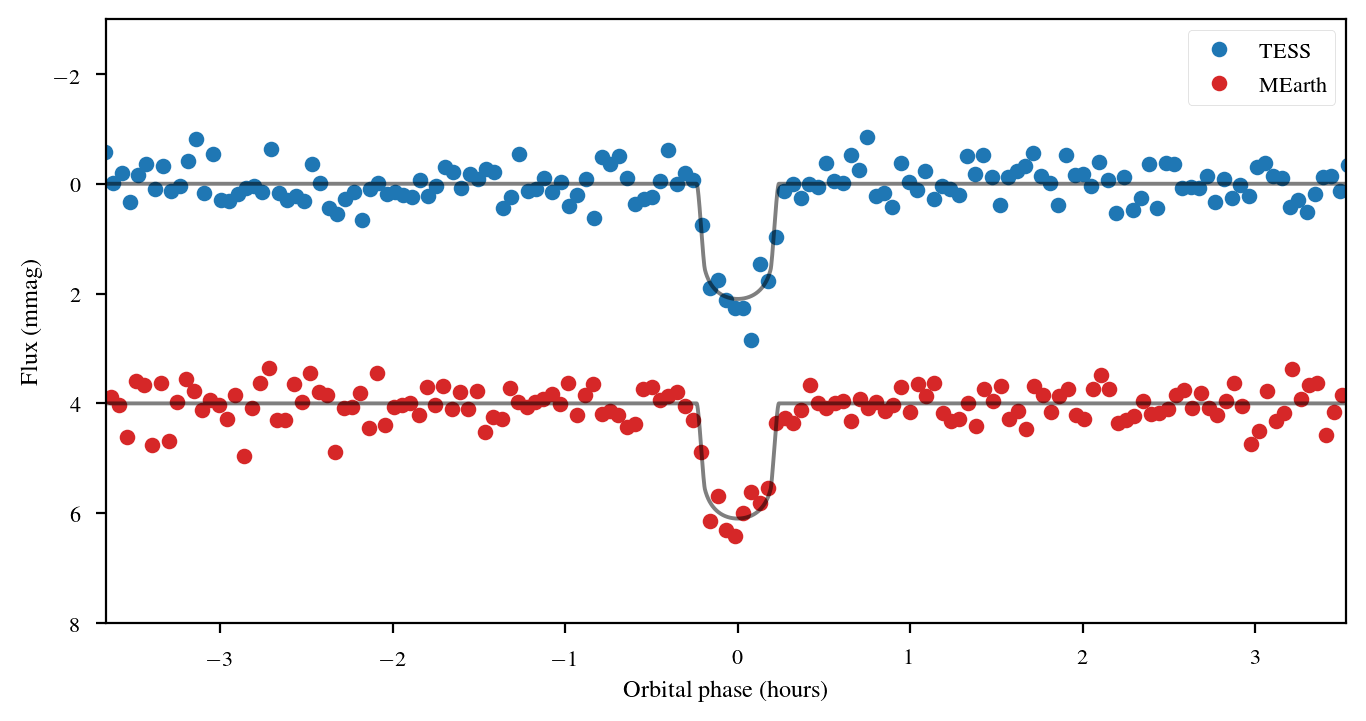
TOI 540 b completes a trip around its rapidly rotating host star once every days ( ms). The transits are not grazing with an impact parameter of , corresponding to an inclination angle of . The planet has a radius of R⊕, slightly less than that of Venus. Based on its small radius, the planet is likely to be terrestrial for the reasons outlined in Section 1. Using Earth’s core mass fraction and a semi-empirical mass-radius relation for rocky planets by Zeng et al. (2016) yields an estimated mass of M⊕ and a bulk density of g cm-3. This corresponds to a surface gravity of m s-2. Figure 5 displays the predicted transits overlaid on detrended and co-added MEarth and TESS data; the transit depth is consistent within 1 in either data set, and the residual noise levels are comparable.
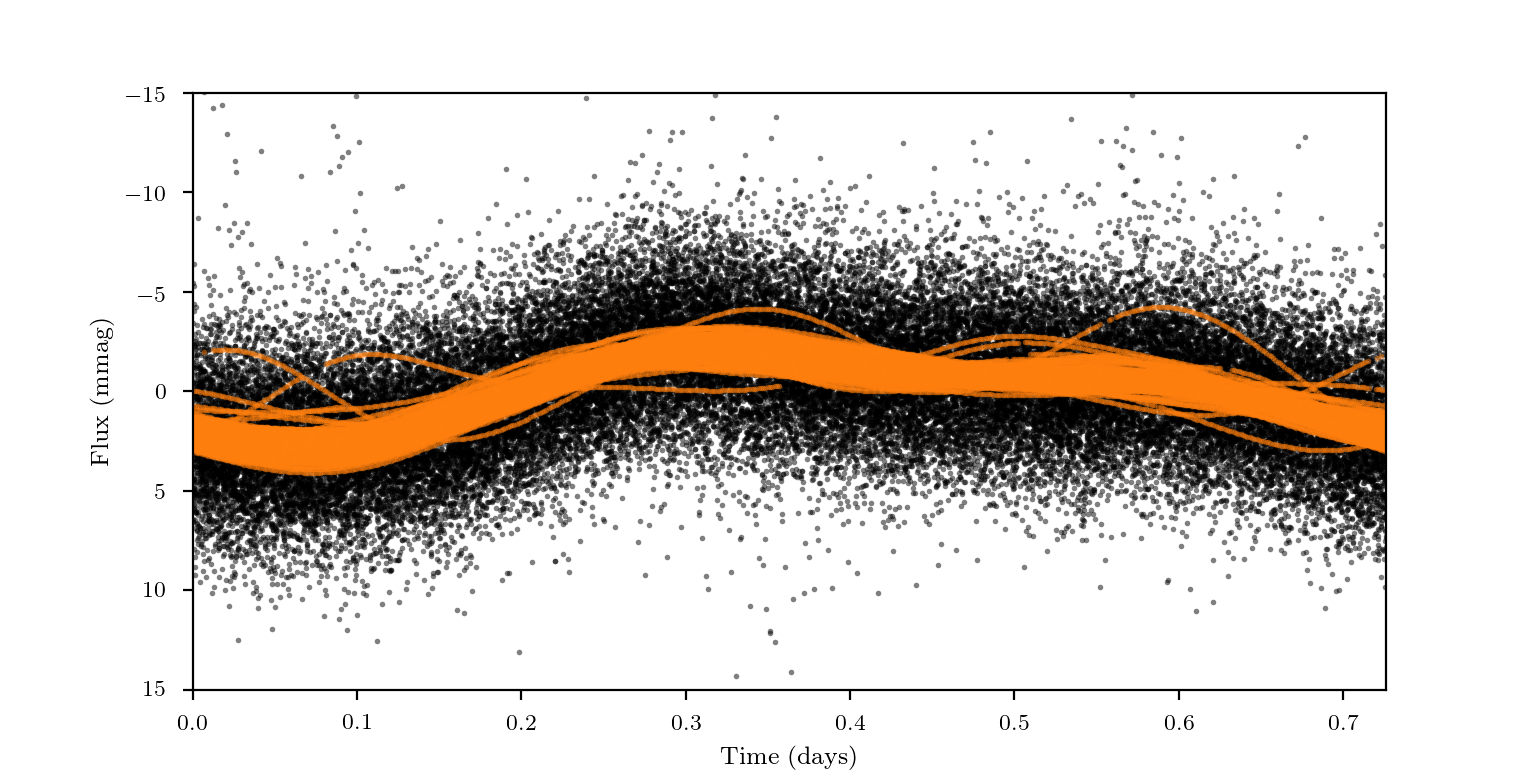
The mass and radius of the star are not well constrained by the time series photometry alone and are almost entirely dictated by the prior distributions. The model finds a well-defined stellar rotation period of hours. Even though the periodicity of the rotation can be established with great precision, the photometric modulation itself has multiple peaks per rotation, pointing to a heterogeneous distribution of spots across the photosphere. The shape of the modulation imprinted onto the TESS light curve can be seen in Figure 6. However, there is no visual evidence of substantial evolution of the modulated signal over the two and a half months of data collection, facilitating the modeling necessary to isolate the transits of TOI 540 b.
The combination of a slowly evolving starspot distribution and a short orbital period that allows for the observation of a large number of transits provides a rare opportunity to make use of TOI 540 to study the atmospheric composition and escape in small planets orbiting active M dwarfs. Out of the known planet systems within 15 pc of the Sun, similar conditions may perhaps be found only in the TRAPPIST-1 system (TRAPPIST-1 has been estimated to spin with a period of 1.4 or 3.3 days; Gillon et al., 2016; Luger et al., 2017) - however, TOI 540 is nearly 2 magnitudes brighter in the J band (and even more so towards the visible). In particular, rapidly rotating M dwarfs have more flares and CMEs, stronger stellar winds, and higher levels of X-ray and UV emission compared to slowly rotating M dwarfs, which likely lead to extensive atmospheric erosion (Vida et al., 2017; Newton et al., 2018, and references therein). Wright et al. (2018) demonstrate a clear relationship between a star’s Rossby number (the ratio of the rotation period to the convective turnover time) and its coronal X-ray emission as a fraction of the bolometric luminosity. For stars with , this relationship has a power-law slope, with smaller Rossby numbers corresponding to higher X-ray luminosities. Stars with (rapid rotators) have the highest levels of X-ray emission that remains saturated at a constant level of . Using an empirically calibrated relation based on the color, we can calculate the convective turnover time of TOI 540 to be close to days (Wright et al., 2018, Eq. 5). This corresponds to a Rossby number of , suggesting that TOI 540 is in the saturated high X-ray emission regime with an X-ray-to-bolometric luminosity ratio of . This hypothesis is consistent with the X-ray detection of TOI 540 by XMM-Newton that yields . Of the transiting planet hosts listed in Section 1, the only other star likely to be in the saturated regime is TRAPPIST-1 with . This is based on an estimated convective turnover time days that may be inaccurate as it was derived from stars with (Wright et al., 2018) whereas TRAPPIST-1 is substantially redder with (Gillon et al., 2017a). The bright X-ray flux of TOI 540 could present an opportunity to study transits in the X-ray to search for atmospheric loss, although we note that the atmospheric signature would likely be much smaller than the similar detection for HD 189733 b by Poppenhaeger et al. (2013).
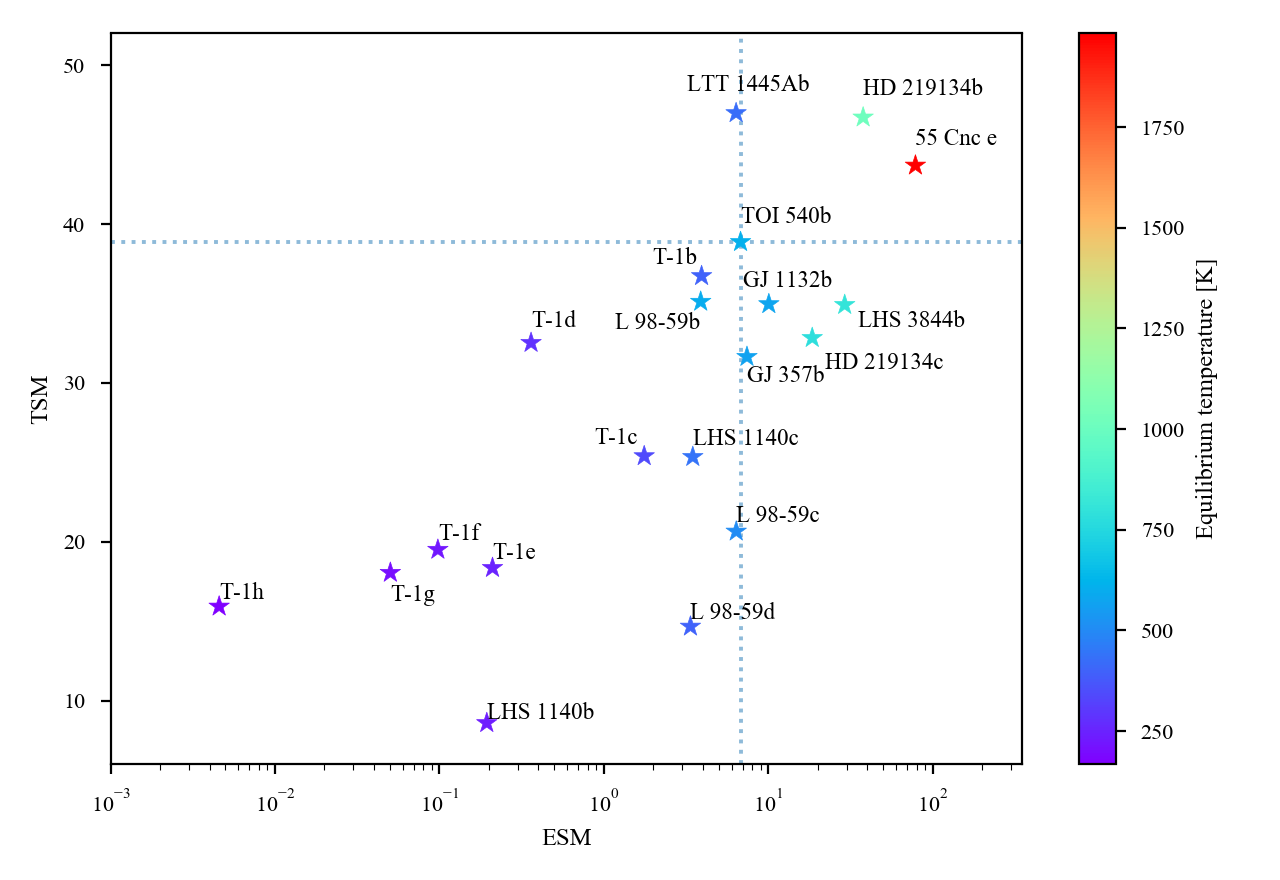
The planet is likely to be hot: it receives 23.4 times the total radiation from its host star than Earth does from the Sun (and 3.5 times more than Mercury does), equating to a zero-albedo equilibrium temperature of K. The high temperature, however, may make it more amenable to transmission and emission spectroscopy measurements. We calculate the transmission spectroscopy metric (TSM) and emission spectroscopy metric (ESM) from Kempton et al. (2018) for all of the nearby transiting terrestrial planets, listed in Section 1. The values are displayed in Figure 7. Crucially, the two best targets in the top right of Figure 7 (55 Cnc e and HD 219134 b) orbit larger K dwarfs and may not be detectable by JWST once a systematic noise floor is taken into account. Using the scale factors from Kempton et al. (2018), we obtain TSM = 38.9 and ESM = 6.8 for TOI 540 b. The TSM value is above the threshold of 10 suggested by Kempton et al. (2018) and exceeds the TSM values of all but one of the known planets orbiting M dwarfs in Figure 7. Therefore, TOI 540 b is a prime target for transmission spectroscopy to study a potential high mean molecular weight atmosphere, if indeed such an atmosphere can be retained in close proximity to an active M dwarf. Furthermore, the relatively high ESM value will likely qualify the planet for infrared photometry with JWST to detect or rule out the presence of atmosphere in as much as a single secondary eclipse (Koll et al., 2019). Finally, studies of the near-infrared or infrared phase curve could also tell us if TOI 540 has retained an atmosphere. A thermal phase curve study was used by Kreidberg et al. (2019) to rule out the presence of a thick atmosphere on LHS 3844 b, an ultra-short-period terrestrial planet orbiting a more evolved and less active M dwarf that has spun down to a rotation period of 128 days (Vanderspek et al., 2019) but has a mass similar to that estimated for TOI 540. A similar thermal phase curve study for TOI 540 is promising.
We also cannot rule out the presence of additional transiting planets in this active system. We carried out a Box-Least Squares analysis (Kovács et al., 2002; Burke et al., 2006) as implemented in Ment et al. (2019) on the TESS light curve, but did not find sufficient evidence for additional transiting planets, consistent with the results of the SPOC’s search for additional planets. Considering the orbital inclination angle of TOI 540 b, any co-planar transiting planets would be limited to orbital periods of 1.83 days or less, which would likely lead to dynamical instability given the orbital period of TOI 540 b. Therefore, any additional planets around TOI 540 are likely to be non-transiting, or have an inclination substantially closer to 90° than TOI 540 b. Given the cumulative occurrence rate of small planets (R⊕, d) per M dwarf (Dressing & Charbonneau, 2015) that was derived from the Kepler population, alternative methods such as transit timing variation (not detected for the 59 transits observed here) or RV studies (provided that enough observations can be accumulated to overcome the significant rotational broadening of spectral lines) may be fruitful to uncover more planets around TOI 540. In addition, high-resolution spectroscopy would allow for a precise modeling of line profiles during transit, yielding a direct measurement of stellar obliquity from Doppler tomography/the Rossiter-McLaughlin effect.
References
- Agol et al. (2019) Agol, E., Luger, R., & Foreman-Mackey, D. 2019, arXiv e-prints
- Astropy Collaboration et al. (2013) Astropy Collaboration, Robitaille, T. P., Tollerud, E. J., et al. 2013, A&A, 558, A33, doi: 10.1051/0004-6361/201322068
- Astropy Collaboration et al. (2018) Astropy Collaboration, Price-Whelan, A. M., Sipőcz, B. M., et al. 2018, AJ, 156, 123, doi: 10.3847/1538-3881/aabc4f
- Baraffe et al. (2002) Baraffe, I., Chabrier, G., Allard, F., & Hauschildt, P. H. 2002, A&A, 382, 563, doi: 10.1051/0004-6361:20011638
- Batalha et al. (2011) Batalha, N. M., Borucki, W. J., Bryson, S. T., et al. 2011, ApJ, 729, 27, doi: 10.1088/0004-637X/729/1/27
- Bayless & Orosz (2006) Bayless, A. J., & Orosz, J. A. 2006, ApJ, 651, 1155, doi: 10.1086/507981
- Benedict et al. (2016) Benedict, G. F., Henry, T. J., Franz, O. G., et al. 2016, AJ, 152, 141, doi: 10.3847/0004-6256/152/5/141
- Berta-Thompson et al. (2015) Berta-Thompson, Z. K., Irwin, J., Charbonneau, D., et al. 2015, Nature, 527, 204, doi: 10.1038/nature15762
- Boller et al. (2016) Boller, T., Freyberg, M. J., Trümper, J., et al. 2016, A&A, 588, A103, doi: 10.1051/0004-6361/201525648
- Bonfils et al. (2018) Bonfils, X., Almenara, J. M., Cloutier, R., et al. 2018, A&A, 618, A142, doi: 10.1051/0004-6361/201731884
- Bouchy et al. (2001) Bouchy, F., Pepe, F., & Queloz, D. 2001, A&A, 374, 733, doi: 10.1051/0004-6361:20010730
- Boyajian et al. (2012) Boyajian, T. S., von Braun, K., van Belle, G., et al. 2012, ApJ, 757, 112, doi: 10.1088/0004-637X/757/2/112
- Burke et al. (2006) Burke, C. J., Gaudi, B. S., DePoy, D. L., & Pogge, R. W. 2006, AJ, 132, 210, doi: 10.1086/504468
- Butler et al. (2004) Butler, R. P., Vogt, S. S., Marcy, G. W., et al. 2004, ApJ, 617, 580, doi: 10.1086/425173
- Charbonneau et al. (2009) Charbonneau, D., Berta, Z. K., Irwin, J., et al. 2009, Nature, 462, 891, doi: 10.1038/nature08679
- Claret (2018) Claret, A. 2018, A&A, 618, A20, doi: 10.1051/0004-6361/201833060
- Cloutier & Menou (2020) Cloutier, R., & Menou, K. 2020, AJ, 159, 211, doi: 10.3847/1538-3881/ab8237
- Cloutier et al. (2019) Cloutier, R., Astudillo-Defru, N., Bonfils, X., et al. 2019, A&A, 629, A111, doi: 10.1051/0004-6361/201935957
- Cloutier et al. (2020a) Cloutier, R., Eastman, J. D., Rodriguez, J. E., et al. 2020a, AJ, 160, 3, doi: 10.3847/1538-3881/ab91c2
- Cloutier et al. (2020b) Cloutier, R., Rodriguez, J. E., Irwin, J., et al. 2020b, AJ, 160, 22, doi: 10.3847/1538-3881/ab9534
- Cutri et al. (2003) Cutri, R. M., Skrutskie, M. F., van Dyk, S., et al. 2003, 2MASS All Sky Catalog of point sources.
- Davenport (2016) Davenport, J. R. A. 2016, ApJ, 829, 23, doi: 10.3847/0004-637X/829/1/23
- Dittmann et al. (2017) Dittmann, J. A., Irwin, J. M., Charbonneau, D., et al. 2017, Nature, 544, 333, doi: 10.1038/nature22055
- Dressing & Charbonneau (2015) Dressing, C. D., & Charbonneau, D. 2015, ApJ, 807, 45, doi: 10.1088/0004-637X/807/1/45
- Dressing et al. (2015) Dressing, C. D., Charbonneau, D., Dumusque, X., et al. 2015, ApJ, 800, 135, doi: 10.1088/0004-637X/800/2/135
- Ducati (2002) Ducati, J. R. 2002, VizieR Online Data Catalog
- Finch et al. (2014) Finch, C. T., Zacharias, N., Subasavage, J. P., Henry, T. J., & Riedel, A. R. 2014, AJ, 148, 119, doi: 10.1088/0004-6256/148/6/119
- Foreman-Mackey (2018) Foreman-Mackey, D. 2018, Research Notes of the American Astronomical Society, 2, 31, doi: 10.3847/2515-5172/aaaf6c
- Foreman-Mackey et al. (2017) Foreman-Mackey, D., Agol, E., Ambikasaran, S., & Angus, R. 2017, AJ, 154, 220, doi: 10.3847/1538-3881/aa9332
- Foreman-Mackey et al. (2019) Foreman-Mackey, D., Czekala, I., Luger, R., et al. 2019, dfm/exoplanet: exoplanet v0.2.1, doi: 10.5281/zenodo.3462740
- Fulton et al. (2017) Fulton, B. J., Petigura, E. A., Howard, A. W., et al. 2017, AJ, 154, 109, doi: 10.3847/1538-3881/aa80eb
- Gagné et al. (2018) Gagné, J., Mamajek, E. E., Malo, L., et al. 2018, ApJ, 856, 23, doi: 10.3847/1538-4357/aaae09
- Gaia Collaboration et al. (2018) Gaia Collaboration, Brown, A. G. A., Vallenari, A., et al. 2018, ArXiv e-prints. https://arxiv.org/abs/1804.09365
- Garcia-Sage et al. (2017) Garcia-Sage, K., Glocer, A., Drake, J. J., Gronoff, G., & Cohen, O. 2017, ApJ, 844, L13, doi: 10.3847/2041-8213/aa7eca
- Gillon et al. (2007) Gillon, M., Pont, F., Demory, B. O., et al. 2007, A&A, 472, L13, doi: 10.1051/0004-6361:20077799
- Gillon et al. (2016) Gillon, M., Jehin, E., Lederer, S. M., et al. 2016, Nature, 533, 221, doi: 10.1038/nature17448
- Gillon et al. (2017a) Gillon, M., Triaud, A. H. M. J., Demory, B.-O., et al. 2017a, Nature, 542, 456, doi: 10.1038/nature21360
- Gillon et al. (2017b) Gillon, M., Demory, B.-O., Van Grootel, V., et al. 2017b, Nature Astronomy, 1, 0056, doi: 10.1038/s41550-017-0056
- Ginzburg et al. (2018) Ginzburg, S., Schlichting, H. E., & Sari, R. 2018, MNRAS, 476, 759, doi: 10.1093/mnras/sty290
- Goldreich & Soter (1966) Goldreich, P., & Soter, S. 1966, Icarus, 5, 375, doi: 10.1016/0019-1035(66)90051-0
- Grimm et al. (2018) Grimm, S. L., Demory, B.-O., Gillon, M., et al. 2018, A&A, 613, A68, doi: 10.1051/0004-6361/201732233
- Gronoff et al. (2020) Gronoff, G., Arras, P., Baraka, S. M., et al. 2020, arXiv e-prints, arXiv:2003.03231. https://arxiv.org/abs/2003.03231
- Haywood et al. (2014) Haywood, R. D., Collier Cameron, A., Queloz, D., et al. 2014, MNRAS, 443, 2517, doi: 10.1093/mnras/stu1320
- Howard et al. (2013) Howard, A. W., Sanchis-Ojeda, R., Marcy, G. W., et al. 2013, Nature, 503, 381, doi: 10.1038/nature12767
- Husser et al. (2013) Husser, T. O., Wende-von Berg, S., Dreizler, S., et al. 2013, A&A, 553, A6, doi: 10.1051/0004-6361/201219058
- Irwin et al. (2015) Irwin, J. M., Berta-Thompson, Z. K., Charbonneau, D., et al. 2015, in Cambridge Workshop on Cool Stars, Stellar Systems, and the Sun, Vol. 18, 18th Cambridge Workshop on Cool Stars, Stellar Systems, and the Sun, 767–772. https://arxiv.org/abs/1409.0891
- Irwin et al. (2018) Irwin, J. M., Charbonneau, D., Esquerdo, G. A., et al. 2018, AJ, 156, 140, doi: 10.3847/1538-3881/aad9a3
- Jenkins et al. (2016) Jenkins, J. M., Twicken, J. D., McCauliff, S., et al. 2016, Society of Photo-Optical Instrumentation Engineers (SPIE) Conference Series, Vol. 9913, The TESS science processing operations center, 99133E, doi: 10.1117/12.2233418
- Kempton et al. (2018) Kempton, E. M. R., Bean, J. L., Louie, D. R., et al. 2018, PASP, 130, 114401, doi: 10.1088/1538-3873/aadf6f
- Koll et al. (2019) Koll, D. D. B., Malik, M., Mansfield, M., et al. 2019, ApJ, 886, 140, doi: 10.3847/1538-4357/ab4c91
- Kostov et al. (2019) Kostov, V. B., Schlieder, J. E., Barclay, T., et al. 2019, AJ, 158, 32, doi: 10.3847/1538-3881/ab2459
- Kovács et al. (2002) Kovács, G., Zucker, S., & Mazeh, T. 2002, A&A, 391, 369, doi: 10.1051/0004-6361:20020802
- Kreidberg et al. (2019) Kreidberg, L., Koll, D. D. B., Morley, C., et al. 2019, Nature, 573, 87, doi: 10.1038/s41586-019-1497-4
- Lacy et al. (1976) Lacy, C. H., Moffett, T. J., & Evans, D. S. 1976, ApJS, 30, 85, doi: 10.1086/190358
- Lee et al. (2014) Lee, E. J., Chiang, E., & Ormel, C. W. 2014, ApJ, 797, 95, doi: 10.1088/0004-637X/797/2/95
- Leggett et al. (2001) Leggett, S. K., Allard, F., Geballe, T. R., Hauschildt, P. H., & Schweitzer, A. 2001, ApJ, 548, 908, doi: 10.1086/319020
- Li et al. (2019) Li, J., Tenenbaum, P., Twicken, J. D., et al. 2019, PASP, 131, 024506, doi: 10.1088/1538-3873/aaf44d
- Lindegren et al. (2018) Lindegren, L., Hernández, J., Bombrun, A., et al. 2018, A&A, 616, A2, doi: 10.1051/0004-6361/201832727
- Lopez & Fortney (2013) Lopez, E. D., & Fortney, J. J. 2013, ApJ, 776, 2, doi: 10.1088/0004-637X/776/1/2
- Lopez & Rice (2018) Lopez, E. D., & Rice, K. 2018, MNRAS, 479, 5303, doi: 10.1093/mnras/sty1707
- Luger et al. (2019) Luger, R., Agol, E., Foreman-Mackey, D., et al. 2019, AJ, 157, 64, doi: 10.3847/1538-3881/aae8e5
- Luger et al. (2017) Luger, R., Sestovic, M., Kruse, E., et al. 2017, Nature Astronomy, 1, 0129, doi: 10.1038/s41550-017-0129
- Luque et al. (2019) Luque, R., Pallé, E., Kossakowski, D., et al. 2019, A&A, 628, A39, doi: 10.1051/0004-6361/201935801
- Mamajek (2012) Mamajek, E. E. 2012, ApJ, 754, L20, doi: 10.1088/2041-8205/754/2/L20
- Mann et al. (2015) Mann, A. W., Feiden, G. A., Gaidos, E., Boyajian, T., & von Braun, K. 2015, ApJ, 804, 64, doi: 10.1088/0004-637X/804/1/64
- Mayor et al. (2003) Mayor, M., Pepe, F., Queloz, D., et al. 2003, The Messenger, 114, 20
- McArthur et al. (2004) McArthur, B. E., Endl, M., Cochran, W. D., et al. 2004, ApJ, 614, L81, doi: 10.1086/425561
- Ment et al. (2019) Ment, K., Dittmann, J. A., Astudillo-Defru, N., et al. 2019, AJ, 157, 32, doi: 10.3847/1538-3881/aaf1b1
- Morley et al. (2017) Morley, C. V., Kreidberg, L., Rustamkulov, Z., Robinson, T., & Fortney, J. J. 2017, ApJ, 850, 121, doi: 10.3847/1538-4357/aa927b
- Motalebi et al. (2015) Motalebi, F., Udry, S., Gillon, M., et al. 2015, A&A, 584, A72, doi: 10.1051/0004-6361/201526822
- Newton et al. (2016) Newton, E. R., Irwin, J., Charbonneau, D., et al. 2016, ApJ, 821, 93, doi: 10.3847/0004-637X/821/2/93
- Newton et al. (2018) Newton, E. R., Mondrik, N., Irwin, J., Winters, J. G., & Charbonneau, D. 2018, AJ, 156, 217, doi: 10.3847/1538-3881/aad73b
- Nutzman & Charbonneau (2008) Nutzman, P., & Charbonneau, D. 2008, PASP, 120, 317, doi: 10.1086/533420
- Owen & Wu (2013) Owen, J. E., & Wu, Y. 2013, ApJ, 775, 105, doi: 10.1088/0004-637X/775/2/105
- Owen & Wu (2017) —. 2017, ApJ, 847, 29, doi: 10.3847/1538-4357/aa890a
- Pecaut & Mamajek (2013) Pecaut, M. J., & Mamajek, E. E. 2013, ApJS, 208, 9, doi: 10.1088/0067-0049/208/1/9
- Pepe et al. (2013) Pepe, F., Cameron, A. C., Latham, D. W., et al. 2013, Nature, 503, 377, doi: 10.1038/nature12768
- Poppenhaeger et al. (2013) Poppenhaeger, K., Schmitt, J. H. M. M., & Wolk, S. J. 2013, ApJ, 773, 62, doi: 10.1088/0004-637X/773/1/62
- Ricker et al. (2015) Ricker, G. R., Winn, J. N., Vanderspek, R., et al. 2015, Journal of Astronomical Telescopes, Instruments, and Systems, 1, 014003, doi: 10.1117/1.JATIS.1.1.014003
- Rogers (2015) Rogers, L. A. 2015, ApJ, 801, 41, doi: 10.1088/0004-637X/801/1/41
- Salvatier et al. (2016) Salvatier, J., Wiecki, T. V., & Fonnesbeck, C. 2016, PeerJ Computer Science, 2, e55
- Skrutskie et al. (2006) Skrutskie, M. F., Cutri, R. M., Stiening, R., et al. 2006, AJ, 131, 1163, doi: 10.1086/498708
- Skumanich (1972) Skumanich, A. 1972, ApJ, 171, 565, doi: 10.1086/151310
- Smith et al. (2012) Smith, J. C., Stumpe, M. C., Van Cleve, J. E., et al. 2012, PASP, 124, 1000, doi: 10.1086/667697
- Soto et al. (2018) Soto, M. G., Díaz, M. R., Jenkins, J. S., et al. 2018, MNRAS, 478, 5356, doi: 10.1093/mnras/sty1334
- Stassun et al. (2018) Stassun, K. G., Oelkers, R. J., Pepper, J., et al. 2018, AJ, 156, 102, doi: 10.3847/1538-3881/aad050
- Stumpe et al. (2014) Stumpe, M. C., Smith, J. C., Catanzarite, J. H., et al. 2014, PASP, 126, 100, doi: 10.1086/674989
- Stumpe et al. (2012) Stumpe, M. C., Smith, J. C., Van Cleve, J. E., et al. 2012, PASP, 124, 985, doi: 10.1086/667698
- Theano Development Team (2016) Theano Development Team. 2016, arXiv e-prints, abs/1605.02688. http://arxiv.org/abs/1605.02688
- Tokovinin (2018) Tokovinin, A. 2018, PASP, 130, 035002, doi: 10.1088/1538-3873/aaa7d9
- Tokovinin et al. (2013) Tokovinin, A., Fischer, D. A., Bonati, M., et al. 2013, PASP, 125, 1336, doi: 10.1086/674012
- Twicken et al. (2018) Twicken, J. D., Catanzarite, J. H., Clarke, B. D., et al. 2018, PASP, 130, 064502, doi: 10.1088/1538-3873/aab694
- Vanderspek et al. (2019) Vanderspek, R., Huang, C. X., Vanderburg, A., et al. 2019, ApJ, 871, L24, doi: 10.3847/2041-8213/aafb7a
- Vida et al. (2017) Vida, K., Kővári, Z., Pál, A., Oláh, K., & Kriskovics, L. 2017, ApJ, 841, 124, doi: 10.3847/1538-4357/aa6f05
- Vogt et al. (2015) Vogt, S. S., Burt, J., Meschiari, S., et al. 2015, ApJ, 814, 12, doi: 10.1088/0004-637X/814/1/12
- Weiss & Marcy (2014) Weiss, L. M., & Marcy, G. W. 2014, ApJ, 783, L6, doi: 10.1088/2041-8205/783/1/L6
- Winn et al. (2011) Winn, J. N., Matthews, J. M., Dawson, R. I., et al. 2011, ApJ, 737, L18, doi: 10.1088/2041-8205/737/1/L18
- Winters et al. (2019) Winters, J. G., Medina, A. A., Irwin, J. M., et al. 2019, AJ, 158, 152, doi: 10.3847/1538-3881/ab364d
- Winters et al. (2020) Winters, J. G., Irwin, J. M., Charbonneau, D., et al. 2020, arXiv e-prints, arXiv:2004.11225. https://arxiv.org/abs/2004.11225
- Wright et al. (2018) Wright, N. J., Newton, E. R., Williams, P. K. G., Drake, J. J., & Yadav, R. K. 2018, MNRAS, 479, 2351, doi: 10.1093/mnras/sty1670
- Zeng et al. (2016) Zeng, L., Sasselov, D. D., & Jacobsen, S. B. 2016, ApJ, 819, 127, doi: 10.3847/0004-637X/819/2/127
- Ziegler et al. (2020) Ziegler, C., Tokovinin, A., Briceño, C., et al. 2020, AJ, 159, 19, doi: 10.3847/1538-3881/ab55e9