e-mail: rcanameras@mpa-garching.mpg.de 22institutetext: Université Côte d’Azur, Observatoire de la Côte d’Azur, CNRS, Laboratoire Lagrange, France 33institutetext: European Southern Observatory, ESO Vitacura, Alonso de Cordova 3107, Vitacura, Casilla 19001, Santiago, Chile 44institutetext: Atacama Large Millimeter/submillimeter Array, ALMA Santiago Central Offices, Alonso de Cordova 3107, Vitacura, Casilla 763-0355, Santiago, Chile 55institutetext: Department of Space, Earth and Environment, Onsala Space Observatory, Chalmers University of Technology, 43992 Onsala, Sweden 66institutetext: Institut d’Astrophysique Spatiale, CNRS, Univ. Paris-Sud, Université Paris-Saclay, Bât. 121, 91405 Orsay France 77institutetext: Laboratoire AIM, CEA/DSM/IRFU, CNRS, Université Paris-Diderot, Bât. 709, 91191 Gif-sur-Yvette, France 88institutetext: Department of Physics and Astronomy, University of British Columbia, 6224 Agricultural Road, Vancouver 6658, British Columbia, Canada
Planck’s Dusty GEMS. VIII. Dense-gas reservoirs in the most active dusty starbursts at z3 ††thanks: Based on IRAM data obtained with programs S15CH and 108–14, and on ALMA data from program 2015.1.01518.
We present ALMA, NOEMA, and IRAM-30m/EMIR observations of the high-density tracer molecules HCN, HCO+, and HNC in three of the brightest lensed dusty star-forming galaxies at –3.5, part of the Planck’s Dusty Gravitationally Enhanced subMillimetre Sources (GEMS), with the aim of probing the gas reservoirs closely associated with their exceptional levels of star formation. We obtained robust detections of ten emission lines between and 6, as well as several additional upper flux limits. In PLCK_G244.8+54.9, the brightest source at , the HNC(5–4) line emission at 0.1″ resolution, together with other spatially-integrated line profiles, suggests comparable distributions of dense and more diffuse gas reservoirs, at least over the most strongly magnified regions. This rules out any major effect from differential lensing. This line is blended with CN(4–3) and in this source, we measure a HNC(5–4)/CN(4–3) flux ratio of 1.760.86. Dense-gas line profiles generally match those of mid- CO lines, except in PLCK_G145.2+50.8, which also has dense-gas line fluxes that are relatively lower, perhaps due to fewer dense cores and more segregated dense and diffuse gas phases in this source. The and line ratios in our sample are similar to those of nearby ultraluminous infrared galaxies (ULIRGs) and consistent with photon-dominated regions without any indication of important mechanical heating or active galactic nuclei (AGN) feedback. We characterize the dense-gas excitation in PLCK_G244.8+54.9 using radiative transfer models assuming pure collisional excitation and find that mid- HCN, HCO+, and HNC lines arise from a high-density phase with an H2 density of –, although important degeneracies hinder a determination of the exact conditions. The three GEMS are consistent with extrapolations of dense-gas star-formation laws derived in the nearby Universe, adding further evidence that the extreme star-formation rates observed in the most active galaxies at are a consequence of their important dense-gas contents. The dense-gas-mass fractions traced by HCN/[CI] and HCO+/[CI] line ratios are elevated, but not exceptional as compared to other lensed dusty star-forming galaxies at , and they fall near the upper envelope of local ULIRGs. Despite the higher overall gas fractions and local gas-mass surface densities observed at high redshift, the dense-gas budget of rapidly star-forming galaxies seems to have evolved little between and . Our results favor constant dense-gas depletion times in these populations, which is in agreement with theoretical models of star formation.
Key Words.:
galaxies: high redshift – galaxies: evolution – galaxies: star formation – galaxies: ISM – submillimeter: galaxies – ISM: molecules1 Introduction
Observational studies of the bright emission lines of 12CO have greatly improved our understanding of the global molecular gas content and relationship to star formation in galaxies from low (e.g., Kennicutt 1998) to high redshifts (e.g., Daddi et al. 2010b; Genzel et al. 2010; Carilli & Walter 2013). However, most of these lines are optically thick and do not probe the dense cloud cores that are unstable with regard to gravitational collapse and that directly fuel star formation. Characterizing molecular gas in this high-density phase is, therefore, fundamental to test star-formation models, as well as to constrain the main (radiative and non-radiative) feedback mechanisms driving turbulence in pre-stellar cores and slowing down the collapse of the gas. Rotational transitions of HCN, HCO+, and HNC are usually collisionally excited by H2 in environments with densities above –, about three orders of magnitude higher than 12CO for a given level, and have been extensively used to study the dense cores of molecular clouds in the Milky Way (e.g., Helfer & Blitz 1997). Despite their low brightness (with fluxes about one order of magnitude lower than for 12CO), these emission lines also hold a great potential for tightly constraining the dense-gas phase, its mass fraction, and the relation to on-going star formation in external galaxies (e.g., Gao & Solomon 2004a, b; García-Burillo et al. 2012). Recent hydrodynamical simulations of star-forming clouds confirm that these molecules are effective and versatile tracers of dense gas for environments with a range of star-formation rates (see, e.g., Onus et al. 2018, for HCN). In rare cases, ground-level emission of these molecules has also been detected at much lower densities (e.g., down to in the Orion A cloud, Kauffmann et al. 2017), however, Evans et al. (2020) point out that for starburst galaxies, this component should have a minor contribution to the overall emission line fluxes.
Observational studies of the dense-gas reservoirs in low-redshift star-forming galaxies started about three decades ago (e.g., Nguyen-Q-Rieu et al. 1992), followed by extended surveys of HCN line emission in luminous and ultra-luminous infrared galaxies (ULIRGs) and normal spirals (Gao & Solomon 2004a, b). Since then, HCN and HCO+ detections have been extensively used to characterize the dense interstellar medium (ISM) of local (U)LIRGs (e.g., Graciá-Carpio et al. 2008; Juneau et al. 2009; García-Burillo et al. 2012), including diagnostics for the physical conditions of the gas from line excitation modeling (see, e.g., Papadopoulos et al. 2014, for NGC 6240 and Arp 193) and spatially-resolved studies with the NOrthern Extended Millimeter Array (NOEMA) and Atacama Large Millimeter/submillimeter Array (ALMA) interferometers (Chen et al. 2017; König et al. 2018; Imanishi et al. 2019). The reliability of each molecule as a proxy of the overall dense-gas content was discussed in Papadopoulos (2007). Recently, valuable constraints on the dense-gas components of galactic outflows have also allowed us to peer into the embedded star-formation activity and its role as a positive or negative feedback mechanism (e.g., Walter et al. 2017; Michiyama et al. 2018; Aladro et al. 2018). Combining sub-arcsec resolution HCN and HCO+ maps with traditional CO lines provides particularly detailed pictures of complex molecular gas flows and triggering mechanisms, as demonstrated in the local barred Seyfert galaxy NGC 1068 (García-Burillo et al. 2014) and the Medusa (König et al. 2018).
Following expectations that HCN is emitted from regions with active star formation, early studies of local ULIRGs found a tight linear correlation between the total IR and HCN(1–0) line luminosities (Gao & Solomon 2004b) and unveiled the impact of variations in dense-gas fractions on the global Schmidt-Kennicutt law (Kennicutt 1998) in galaxies. Wu et al. (2005) demonstrated that this relation holds down to the small scales of dense Galactic cloud cores, thereby extending its validity over at least seven orders of magnitude in infrared luminosity (see also Wu et al. 2010; Stephens et al. 2016). Subsequent studies discussed the behavior of this linear correlation for various high-density tracer molecules, such as HCO+ (e.g., Papadopoulos 2007), for higher levels (e.g., Graciá-Carpio et al. 2008; Zhang et al. 2014), and for high-redshift galaxies (e.g., Gao et al. 2007). Most of these extragalactic studies have relied on galaxy-integrated measurements while focusing on central nuclear regions that host most of the dense gas under extreme ISM conditions. Tan et al. (2018) supplemented these results with spatially resolved, sub-kpc scale observations of HCN and HCO+ –3 in six of the brightest nearby LIRGs. They showed that lower surface-density regions over the disks are broadly consistent with relations on global scales. Theoretical models have suggested that the linear slopes observed for dense-gas star-formation laws (lower than for CO(1–0)) can be explained for transitions with critical densities much higher than the average ISM density (Krumholz & Thompson 2007). However, Zhang et al. (2014) later obtained slopes of unity for transitions with very high critical density as well.
These results have been interpreted as evidence that the star-formation activity of galaxies out to high redshift is essentially driven by the mass fraction of their dense molecular gas, with a roughly constant star-formation efficiency (SFE) per free-fall time in the dense-gas phase (Krumholz & Tan 2007). This is consistent with turbulence-regulated star-formation models (Krumholz & McKee 2005). Sub-kpc properties of local star-forming galaxies show that these dense-gas fractions are themselves strongly correlated with the average molecular gas-mass surface density of clouds since both quantities are inherited from the overall gas density distribution (Gallagher et al. 2018).
Furthermore, non-collisional processes can enhance the luminosities of HCN, HCO+, and HNC lines in regions with low dense-gas fractions and vice versa. For instance, HCN and HCO+ can be excited by IR-pumping (Aalto et al. 1995), and HCO+ emission drops for a high abundance of free electrons and is therefore highly sensitive to the ambient cosmic-ray fluxes (Papadopoulos 2007). Measuring line ratios helps to identify these processes. The HNC/HCN ratio provides valuable diagnostics of photo-dissociation regions (PDRs, Meijerink et al. 2007), X-ray-dominated regions (XDRs) and IR-pumping (Aalto et al. 2007), and shock-dominated regions (Loenen et al. 2008; Aladro et al. 2015). The HCO+/HCN line-intensity ratio is also widely used to discriminate between active galactic nuclei- (AGN) and starburst-dominated galaxies, given the apparent dichotomy between both populations (e.g., Krips et al. 2008; Imanishi & Nakanishi 2014; Imanishi et al. 2016; Izumi et al. 2016). Other studies, such as that of Privon et al. (2015), nonetheless find additional dependences on ISM density and the surrounding radiation fields (e.g., IR-pumping, Krips et al. 2008), and demonstrate that HCO+/HCN can strongly vary in LIRGs and ULIRGs experiencing both AGN and star formation feedback within their unresolved central regions. In NGC 1068, the HCO+/HCN ratio is even enhanced by the central AGN (García-Burillo et al. 2014).
The dense ISM components remain poorly characterized at high-redshift due to the difficulty in detecting these faint transitions, and most efforts have focused on powerful quasi-stellar objects (QSOs) such as the Cloverleaf (Wilner et al. 1995; Solomon et al. 2003; Riechers et al. 2006, 2010, 2011), or on extremely bright sub-millimeter galaxies (SMGs). Early efforts included upper HCN flux limits measured for two bright SMGs by Greve et al. (2006), and HCN detections in two SMGs and two QSOs from Gao et al. (2007). Many subsequent studies have benefited from the flux boosts due to strong lensing magnifications. In the Cosmic Eyelash, Danielson et al. (2011) obtained a detection of HCN that was combined with other tracers to probe the ISM conditions. Dense-gas diagnostics were also inferred from HCN, HCO+, and HNC in two H-ATLAS lensed SMGs at and (Oteo et al. 2017), from HCN, HCO+, HNC, and 13CO in five lensed SMGs at from the South Pole Telescope (SPT) sample (Béthermin et al. 2018), and from H2O and H2O+ emission lines (Yang et al. 2016). In addition, average line properties of 13CO, HCN, HNC, HCO+, CN, and H2O were measured in SPT lensed SMGs using a stacking analysis (Spilker et al. 2014).
| Source | Line(s) | Project ID | Observing dates | Beam size | rms | |||
| (GHz) | (hr) | (mK) | (Jy/K) | |||||
| NOEMA | ||||||||
| PLCK_G092.5+42.9 | HCN, HCO+ –4 | S15CH | 09/15 | 6.1″ 4.0″ | 105.03 | 3.9 | 0.83(∗) | … |
| PLCK_G145.2+50.9 | HCN, HCO+, HNC –4 | S15CH | 10/15 | 5.6″ 4.3″ | 98.25 | 3.9 | 0.75(∗) | … |
| PLCK_G244.8+54.9 | HCN, HCO+, HNC –4 | S19CU | 02/12/19 | 2.9″ 1.2″ | 112.20 | 6.0 | 0.66(∗) | … |
| ALMA | ||||||||
| PLCK_G244.8+54.9 | HCN –4 | 2015.1.01518 | 21/07/16 | 0.78″ 0.67″ | 110.63 | 1.2 | 0.2(∗) | … |
| HNC –4 (LR) | 2015.1.01518 | 21/07/16 | 0.78″ 0.67″ | 113.12 | 1.2 | 0.2(∗) | … | |
| HNC –4 (HR) | 2015.1.01518 | 23/10/15 | 0.12″ 0.08″ | 112.90 | 1.2 | 0.8(∗) | … | |
| IRAM-30m/EMIR | ||||||||
| PLCK_G092.5+42.9 | HNC –3 | 094–13 | 10/04/13 | 28″ 28″ | 89.40 | 2.4 | 1.03 | 5.9 |
| HCN, HCO+ –4 | 108–14 | 20, 21, 22, 23/06 & 17/09/14 | 23″ 23″ | 104.70 | 10.9 | 0.33 | 5.9 | |
| HNC –4 | 108–14 | 20, 21, 22, 23/06 & 17/09/14 | 23″ 23″ | 104.70 | 10.9 | 0.42 | 6.0 | |
| HCN, HCO+ –6 | 108–14 | 20, 21, 22, 23/06/14 | 17″ 17″ | 147.00 | 15.1 | 0.34 | 6.2 | |
| HNC –6 | 108–14 | 20, 21, 22, 23/06/14 | 17″ 17″ | 147.00 | 13.5 | 0.38 | 6.3 | |
| PLCK_G145.2+50.9 | HCN, HCO+ –4 | 223–13 & 108–14 | 18/04 & 19, 20/06 & 18/09/14 | 25″ 25″ | 97.80 | 13.2 | 0.31 | 5.9 |
| HNC –4 | 108–14 | 19, 20/06 & 18/09/14 | 25″ 25″ | 97.80 | 9.2 | 0.36 | 5.9 | |
| HCN, HCO+, HNC –6 | 108–14 | 19, 20/06 & 18/09/14 | 18″ 18″ | 137.50 | 11.2 | 0.35 | 6.1 | |
| PLCK_G244.8+54.9 | HCN, HCO+, HNC –3 | 108–14 | 17, 18, 19/06/14 | 27″ 27″ | 89.00 | 16.8 | 0.21 | 5.9 |
| HNC –4 | 094–13 & 223–13 | 06/06/13 & 30, 31/01/14 | 21″ 21″ | 114.80 | 3.2 | 1.78 | 6.0 | |
| HCN, HCO+, HNC –5 | 108–14 | 17, 18, 19/06/14 | 18″ 18″ | 134.00 | 16.2 | 0.24 | 6.1 | |
| PLCK_G045.1+61.1 | HCN, HCO+ –4 | 094–13 & 223–13 | 07, 10/06/13 & 21, 22/04/14 | 24″ 24″ | 101.90 | 2.2 | 1.00 | 5.9 |
| PLCK_G113.7+61.0 | HCN –3 | 094–13 | 09/04/13 | 24″ 24″ | 101.90 | 4.8 | 0.95 | 5.9 |
| HCO+, HNC –3 | 094–13 | 09/04/13 | 24″ 24″ | 101.90 | 2.4 | 1.12 | 5.9 | |
| PLCK_G138.6+62.0 | HCN, HCO+ –3 | 094–13 | 09/04/13 | 24″ 24″ | 101.90 | 3.2 | 1.23 | 5.9 |
| PLCK_G165.7+67.0 | HCN, HCO+ –5 | 223–13 | 31/01, 01, 03, 04/02/14 | 15″ 15″ | 164.57 | 2.5 | 0.53 | 6.5 |
| HNC –5 | 223–13 | 31/01, 01, 03, 04/02/14 | 15″ 15″ | 164.57 | 5.2 | 0.43 | 6.5 | |
| PLCK_G200.6+46.1 | HCN, HCO+ –3 | 094–13 | 08, 10/06/13 | 28″ 28″ | 89.40 | 3.0 | 0.63 | 5.9 |
Pursuing dense-gas studies of dusty star-forming galaxies (DSFGs) at high-redshift, without dominant AGN heating, is thus vital to improving our understanding of the mode of star formation governing the major phase of galaxy growth. Characterizing the physical properties and SFE of their dense-gas reservoirs addresses the ongoing debate on whether they are the analogues of nearby intensely star-forming galaxies, despite their much higher gas-mass and star-formation surface densities, or whether there is a distinct mode of star formation at high redshift (Daddi et al. 2010b; Genzel et al. 2010).
In this paper, we study the dense-gas components of Planck’s Dusty Gravitationally Enhanced subMillimetre Sources (GEMS) – a sample of 11 of the brightest gravitationally lensed DSFGs on the extragalactic sky, with (at most) minor AGN contributions to the far-IR (FIR) luminosity (Cañameras et al. 2015). Our extensive CO and [C i] emission-line survey with the Eight MIxer Receiver (EMIR) on the IRAM 30-m telescope from Cañameras et al. (2018, hereafter C18) and Nesvadba et al. (2019, hereafter N19) revealed a range of gas excitations, with CO spectral line energy distributions (SLEDs) peaking in the range of –7, and with a plateau up to , and demonstrated that the GEMS contain vast amounts of warm, dense molecular gas. Detailed excitation models have also shown evidence for an additional, fainter, and lower density gas phase in some sources. Here, we use observations of mid- HCN, HCO+, and HNC lines in eight GEMS with IRAM-30m/EMIR, NOEMA, and ALMA to probe their densest ISM phase, which is more representative of cloud cores than previous CO line detections. In particular, the primary focus of this paper is on the three brightest GEMS, namely, PLCK_G092.5+42.9, PLCK_G145.2+50.9, and PLCK_G244.8+54.9 (“the Ruby”), the latter being a maximal starburst222Forming most of its stellar mass within one to a few dynamical times, with star-formation intensities approaching the highest values expected for a vertically-supported, self-gravitating gas disk (e.g., Thompson et al. 2005). at with local star-formation intensities of up to , but rather moderate SFEs of 1–10%333Defined as the fraction of the available gas mass converted into stars per free-fall time. akin to giant molecular clouds in the Milky Way (Cañameras et al. 2017a). Our high-resolution PdBI, SMA, and ALMA 12CO and dust continuum interferometry indicate that PLCK_G092.5+42.9 and PLCK_G145.2+50.9 form giant arcs (Cañameras et al. 2015), while PLCK_G244.8+54.9 forms a partial Einstein ring (Cañameras et al. 2017b). These three GEMS are aligned with massive foreground galaxies at intermediate redshifts and our detailed strong-lensing models with Lenstool (Jullo et al. 2007) show that they are strongly magnified by factors of –22 ( C18, Cañameras et al., in prep.).
The outline of the paper is as follows. In Sect. 2, we summarize the observations and describe the data reduction procedures. In Sect. 3, we present the line properties. In Sect. 4, we discuss the diagnostics we use for the dense-gas reservoirs from line ratios and we then analyze the dense-gas star-formation law in Sect. 5. The detections and upper limits of 13CO from contiguous spectral windows will be presented in a future paper. In addition to lines of HCN, HCO+, and HNC, our observing setups generally cover the line of vibrationally-excited HCN, but the latter is not seen and also not expected to contribute significantly in non-AGN sources and, thus, we ignore it in our analysis. We adopt the best-fit flat CDM cosmology from Planck Collaboration XIII (2016), with , , and .
2 Observations, data reduction, and line extraction
2.1 Single-dish IRAM-30m/EMIR spectroscopy
We observed high-density tracer molecules in the GEMS with EMIR on the IRAM 30-m telescope (project 10814, PI Nesvadba). Observations were carried out in June and September 2014, mostly with average weather conditions. We inspected all individual scans by eye, in particular, those taken with the highest atmospheric opacity and precipitable water vapor (PWV) above 6 mm. We flagged scans with spikes near the line frequency or with unstable baselines. Most scans that were eventually discarded corresponded to high PWV values, but those taken at mm that had stable baselines were included.
We also searched for dense-gas emission lines falling in one of the sidebands during our previous observing runs with EMIR, which were mainly designed to survey the CO and [C i] emission lines in the E090 and E150 bands (see C18 and N19). We performed an automated search using the best source redshifts and the local oscillator frequencies listed in the file headers. The resulting additional scans cover numerous mid- lines of HCN, HCO+, and HNC; these are listed in Table 1 together with the corresponding project IDs. We resampled scans from different observing runs onto a common frequency grid and, finally, we coadded them.
The tuning frequencies, integration times, and rms noise levels per spectral channel are listed in Table 1. We mainly used the Wideband Line Multiple Autocorrelator (WILMA) backend, which offers more stable baselines,444In most cases, baseline breaks between the FTS units required us to apply baseline corrections and led to an increase in the spectrum rms. apart from lines exclusively observed with the Fast Fourier Transform Spectrometer (FTS; e.g., HNC(5–4) and HNC(7–6) in PLCK_G092.5+42.9). We subtracted the baselines with first-order polynomials. For non-detections, we computed the 3 upper limits on the flux, taking as the uncertainty on the line intensity defined in Eq. 1 of Young et al. (2011). In these cases, WILMA provided systematically more constraining upper limits than FTS thanks to the availability of better baselines. For each source, the fiducial full width at half maximum (FWHM) assumed for this calculation was the unweighted averaged FWHM of all detected CO transitions (see C18, ). The number of line channels was obtained as 2 FWHM/, with the channel width. We measured the spectrum rms in line-free regions, chosen using the best-fitting redshift of the mid- CO lines, and after masking baseline channels not covered by all frequency setups. We list the flux upper limits in Table 6 for all transitions with a total integration time above two hours, except for those with more constraining upper limits from NOEMA.
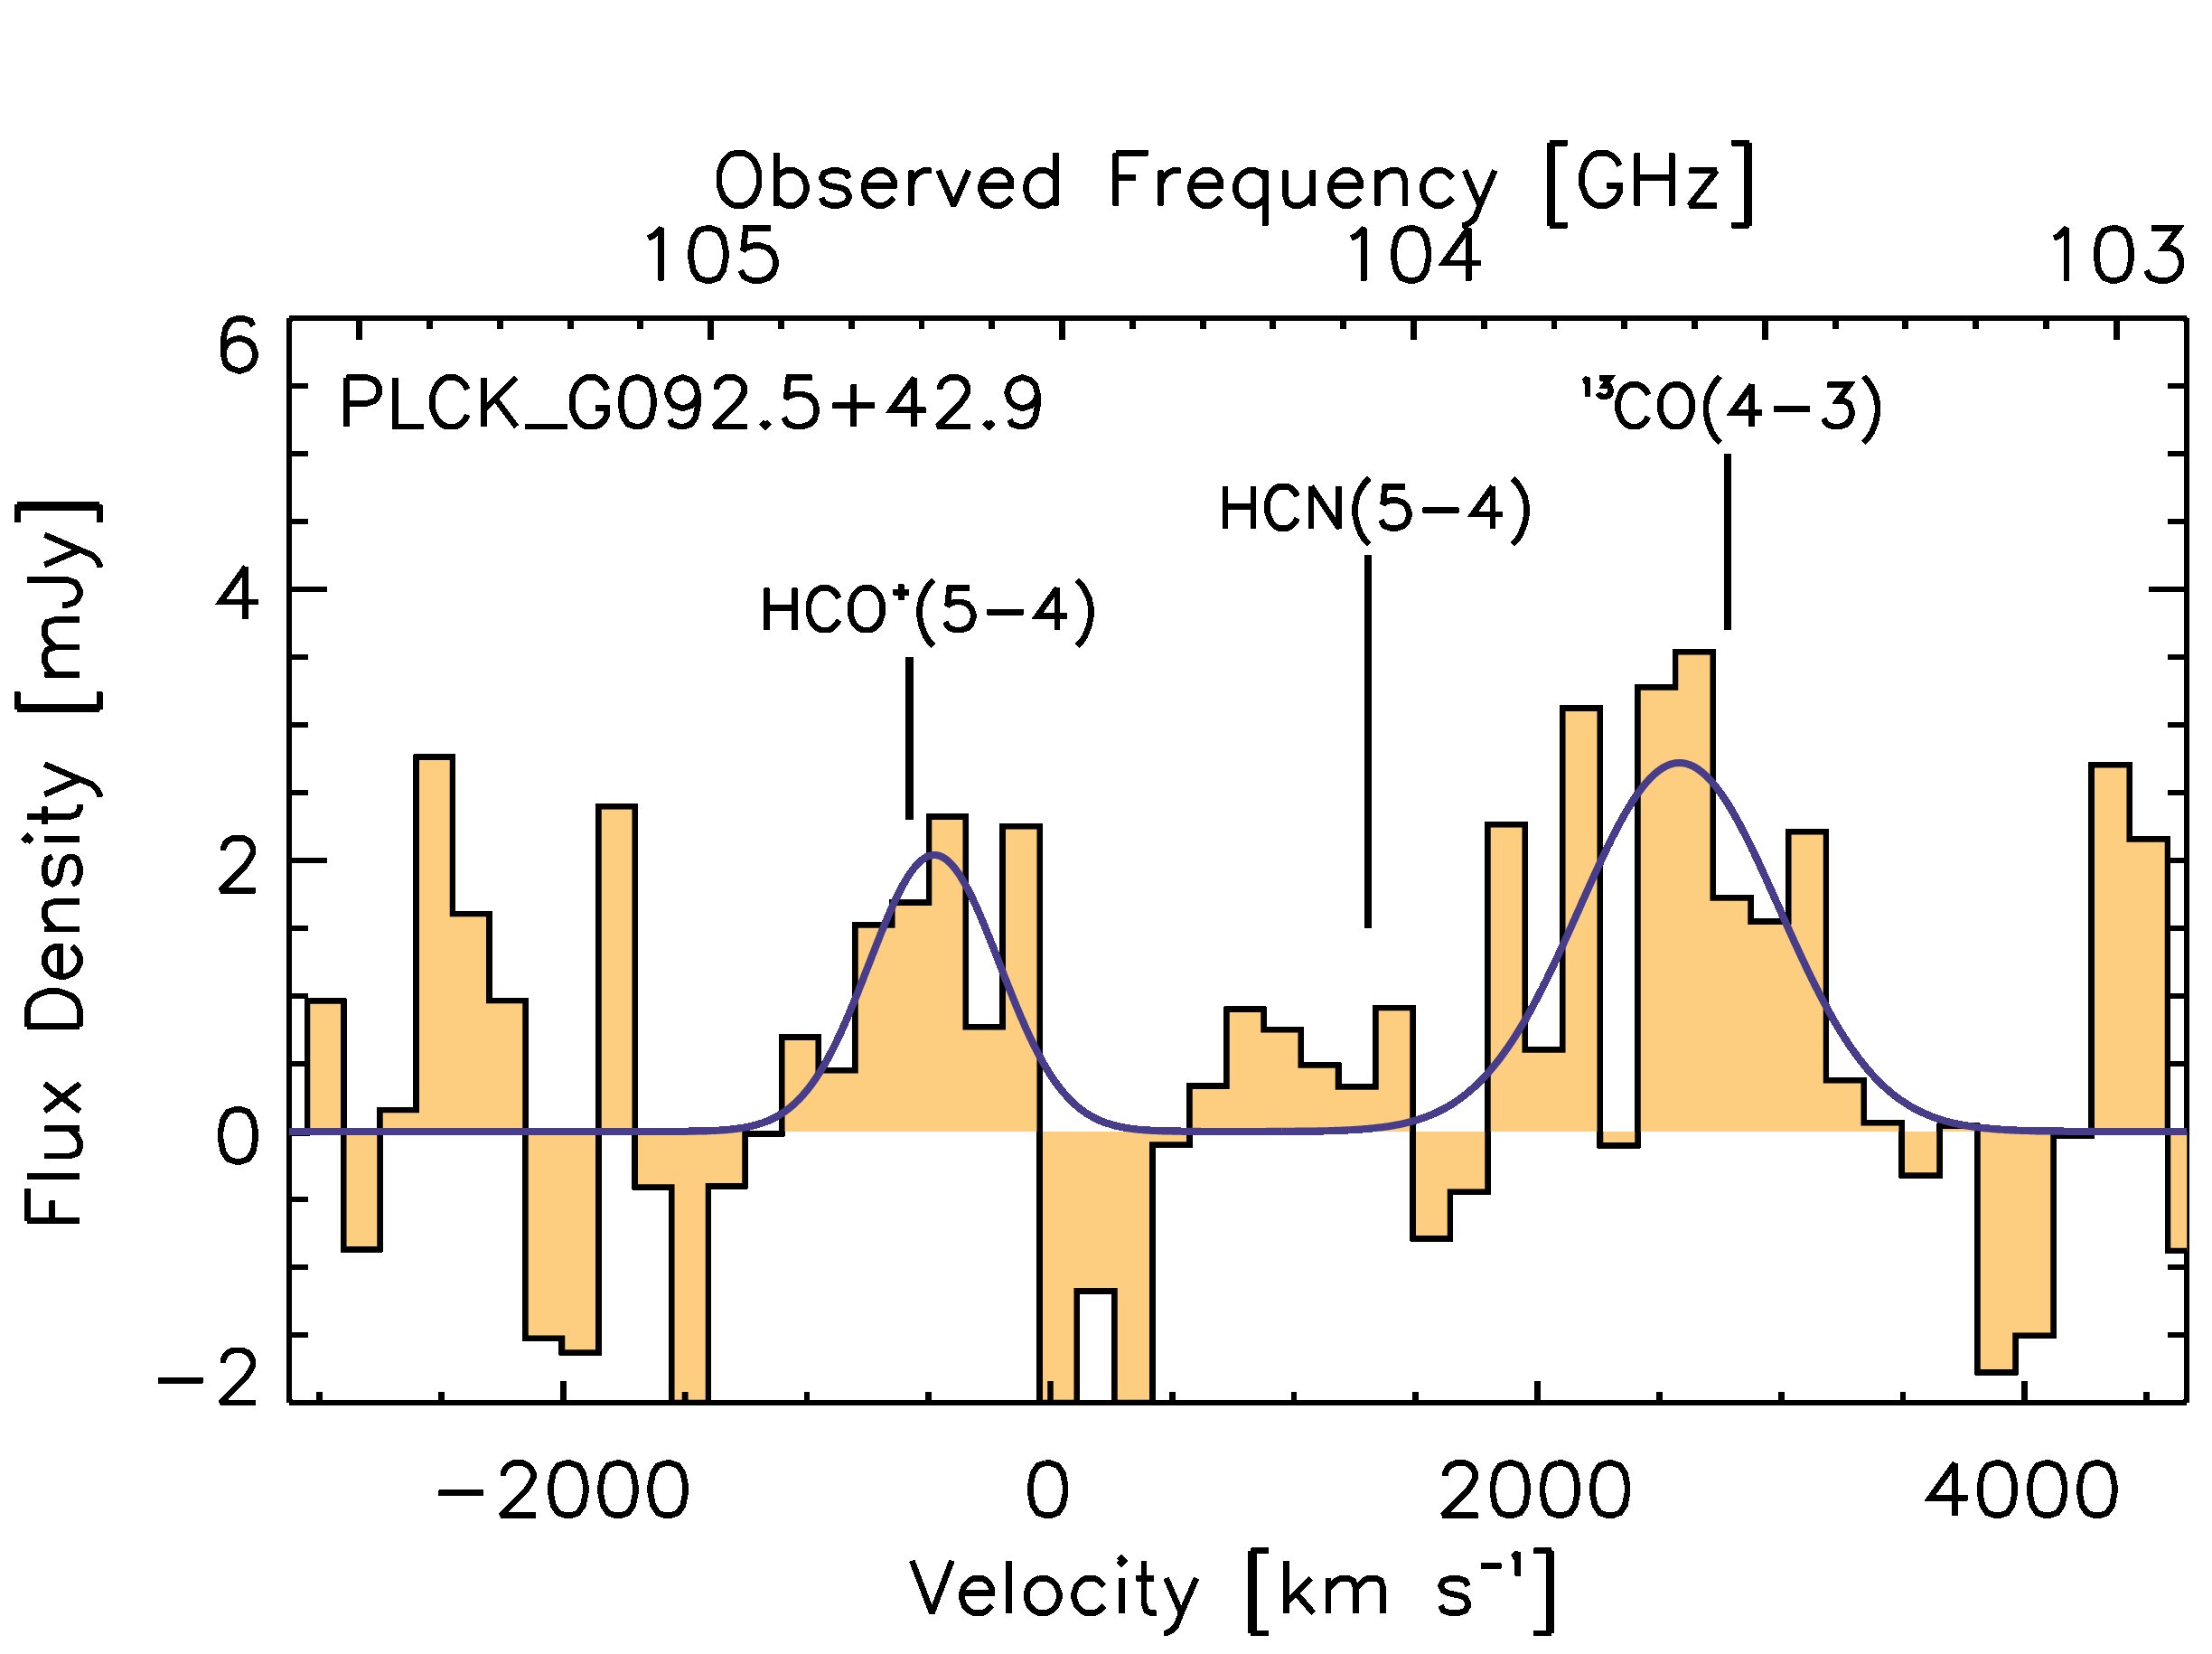
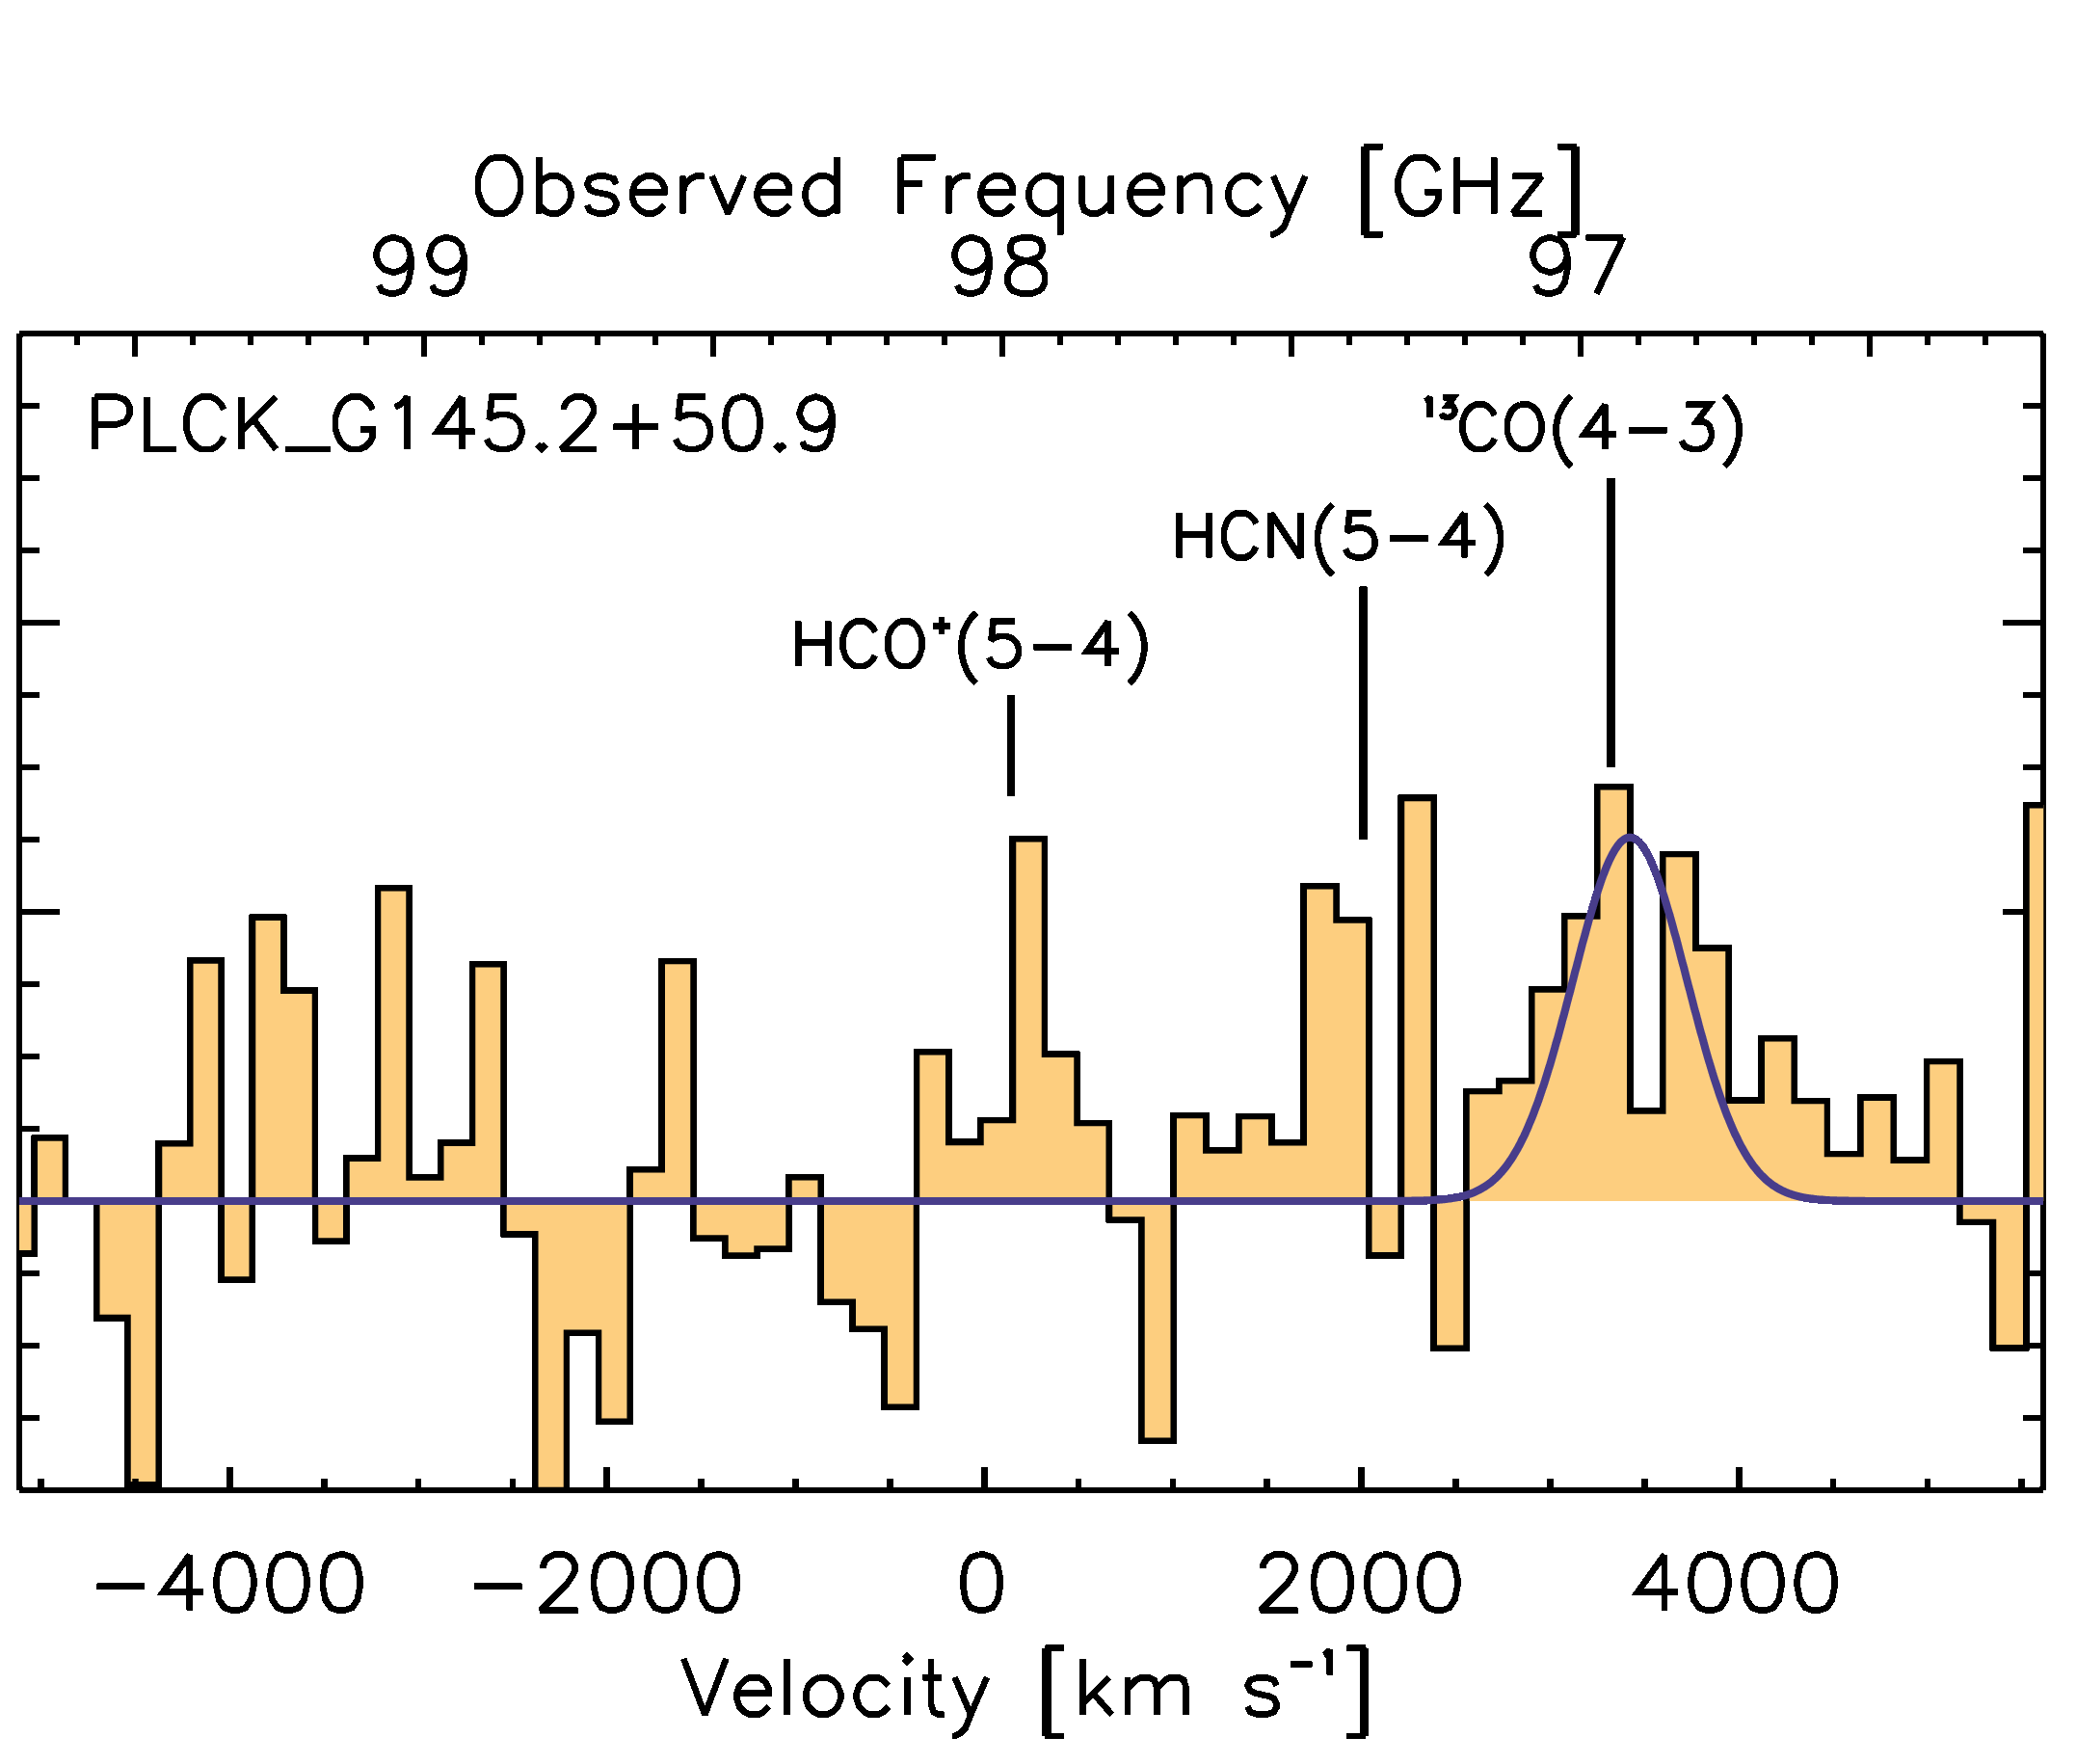
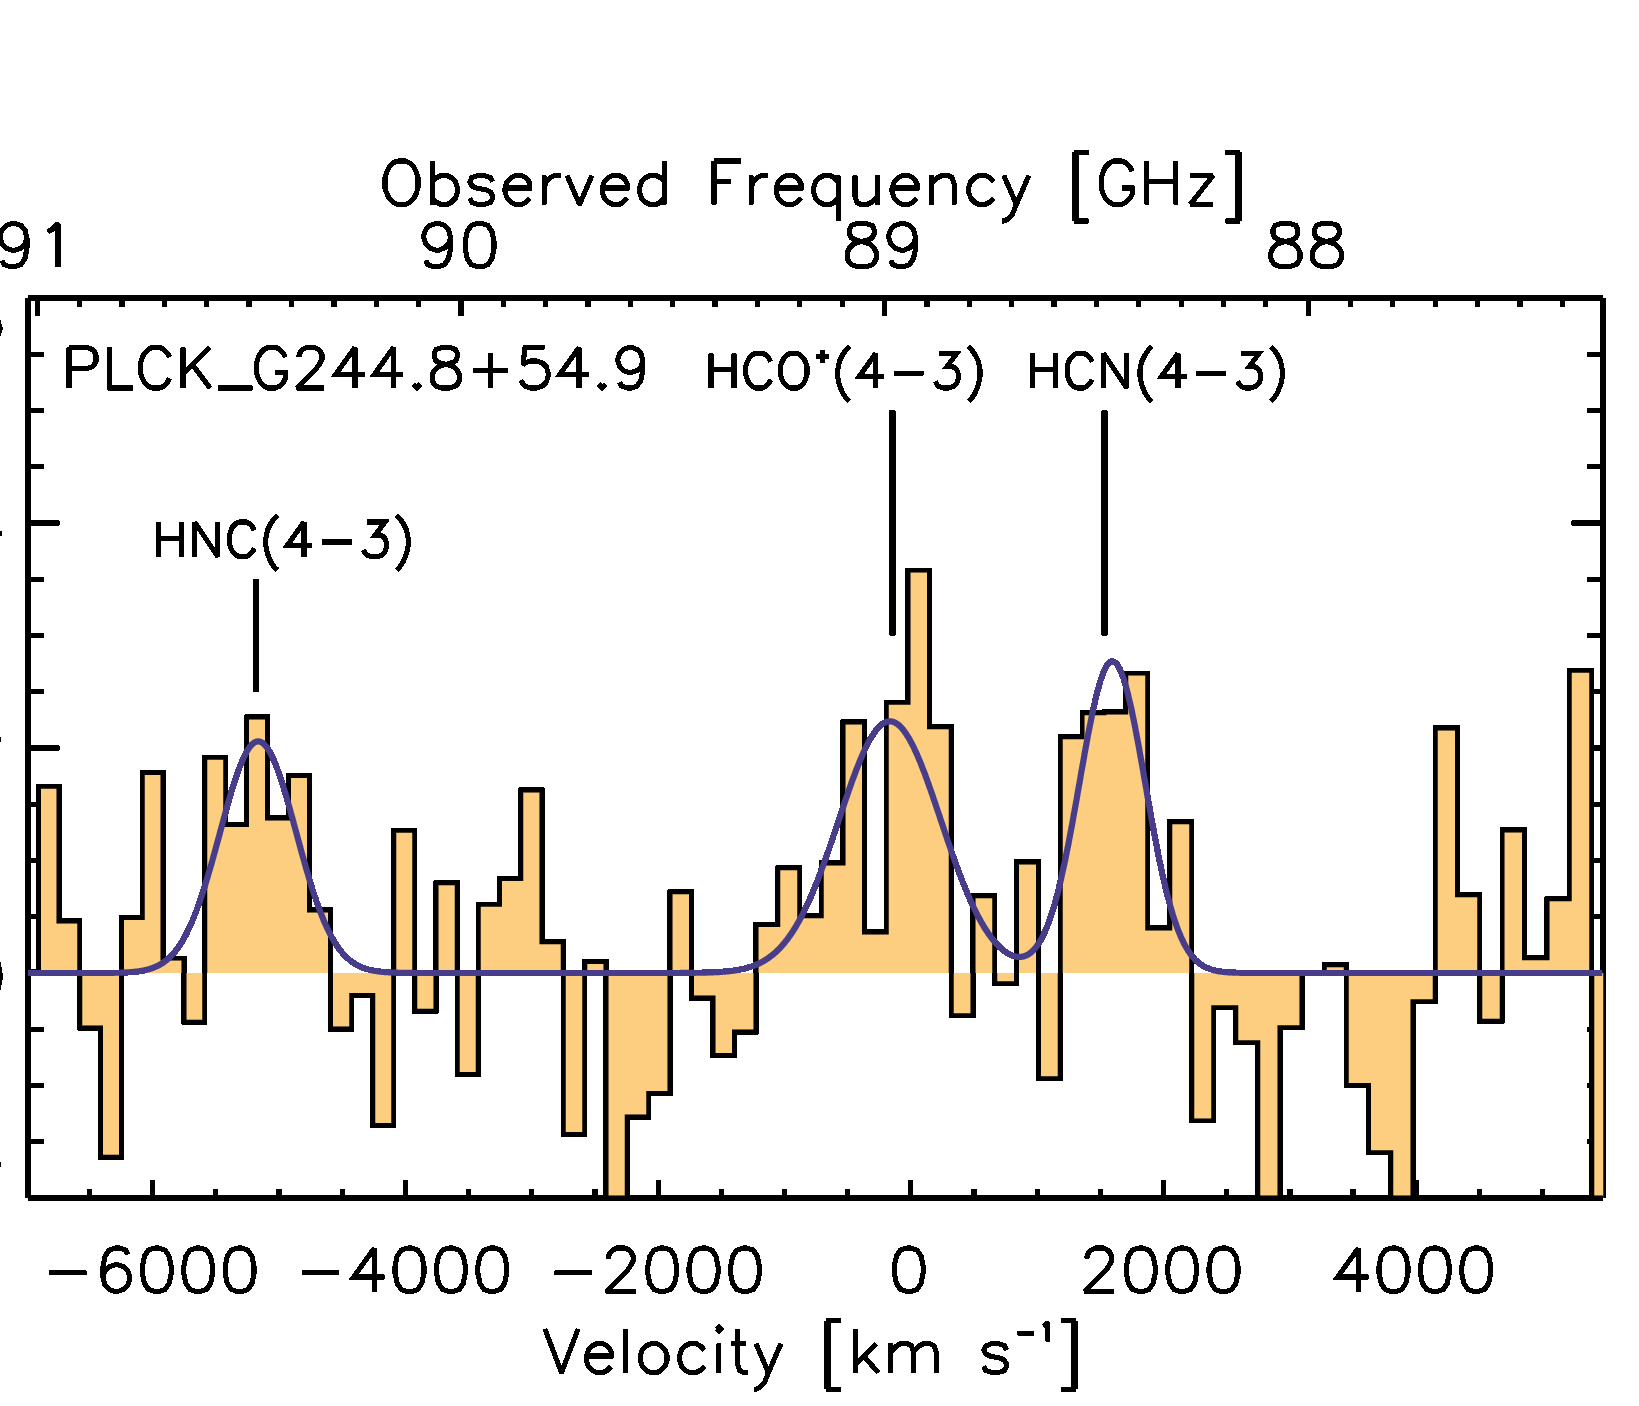
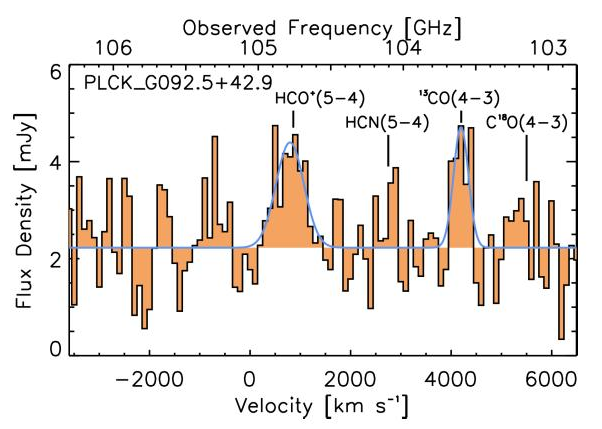
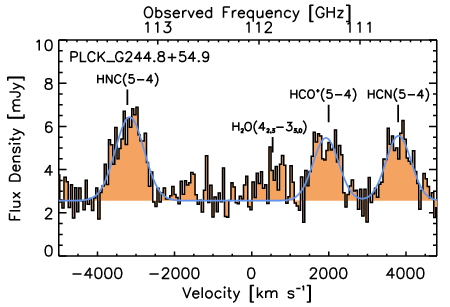
All lines detected at were fitted with single Gaussian functions using the CLASS software package from GILDAS (Gildas Team 2013)555http://www.iram.fr/IRAMFR/GILDAS. The marginal detection of HCO+(5–4) in PLCK_G092.5+42.9 at signal-to-noise ratio, , gives a velocity-integrated flux of , which is consistent with NOEMA. Most detections in PLCK_G244.8+54.9 have moderate S/N values of 3–5, and HNC(6–5) only reaches . These detections are, nevertheless, considered significant because they result from careful baseline subtractions and channel masking, and because they are systematically recovered when using subsets of the available spectral scans based on polarization or PWV. We also repeated the fit in spectral regions that were expected to be line-free and did not detect any line at similar levels. Reduced EMIR spectra are shown in Fig. 1. Finally, we also stacked EMIR spectra covering emission lines of HCN, HCO+, and HNC for the eight GEMS in Table 1 to determine whether or not this might provide more significant detections than for individual sources. The complete procedure is described in Appendix A. Only HCO+(5–4) and HCO+(6–5) have been robustly detected in the stacks and, consequently, we focus on line properties from individual sources in the rest of the paper.
| Source | Line | Telescope | Redshift | FWHMline | ||||
|---|---|---|---|---|---|---|---|---|
| (GHz) | () | () | (10) | (10) | ||||
| PLCK_G092.5+42.9 | HCN(5–4) | NOEMA | … | … | (500) | 0.79 | 7.1 | 2.5 |
| HCO+(5–4) | NOEMA | 104.75 0.05 | 3.257 0.007 | 742 68 | 1.86 0.16 | 16.8 1.4 | 5.9 0.5 | |
| HNC(4–3) | IRAM/EMIR | … | … | (500) | 4.48 | 32.7 | 21.5 | |
| HNC(5–4)(∗) | ″ | … | … | (500) | 1.84 | 16.8 | 5.6 | |
| HCN(7–6) | ″ | … | … | (500) | 1.52 | 19.0 | 2.5 | |
| HCO+(7–6) | ″ | … | … | (500) | 1.52 | 19.1 | 2.5 | |
| HNC(7–6) | ″ | … | … | (500) | 1.81 | 23.1 | 2.8 | |
| PLCK_G145.2+50.9 | HCN(5–4) | NOEMA | … | … | (500) | 0.71 | 7.3 | 2.6 |
| HCO+(5–4) | NOEMA | 98.02 0.05 | 3.549 0.008 | 271 135 | 0.84 0.20 | 8.7 2.1 | 3.1 0.7 | |
| HNC(5–4)(∗) | NOEMA | 99.60 0.05 | 3.551 0.008 | 429 134 | 0.63 0.19 | 6.6 2.0 | 2.3 0.7 | |
| HCN(7–6) | IRAM/EMIR | … | … | (500) | 1.57 | 22.6 | 3.0 | |
| HCO+(7–6) | ″ | … | … | (500) | 1.57 | 22.7 | 2.9 | |
| HNC(7–6) | ″ | … | … | (500) | 1.59 | 23.4 | 2.9 | |
| PLCK_G244.8+54.9 | HCN(5–4) | NOEMA | 110.61 0.01 | 3.006 0.001 | 759 47 | 2.40 0.20 | 18.9 1.6 | 6.9 0.6 |
| HCO+(5–4) | NOEMA | 111.31 0.01 | 3.006 0.001 | 768 33 | 2.41 0.16 | 19.0 1.3 | 6.9 0.5 | |
| HNC(5–4)(†) | ALMA | (113.16) | (3.005) | 535 101 | 2.24 0.49 | 18.0 3.9 | 6.0 1.3 | |
| CN(4–3)(†) | ALMA | (113.25) | (3.005) | 668 70 | 1.27 0.34 | 10.1 2.7 | 3.4 0.9 | |
| HCN(4–3) | IRAM/EMIR | 88.52 0.03 | 3.005 0.004 | 631 157 | 1.73 0.47 | 10.8 2.9 | 7.6 2.1 | |
| HCO+(4–3) | ″ | 88.99 0.04 | 3.009 0.005 | 822 376 | 2.25 0.70 | 14.2 4.4 | 9.8 3.0 | |
| HNC(4–3) | ″ | 90.51 0.04 | 3.007 0.005 | 769 252 | 1.63 0.53 | 10.4 3.4 | 6.9 2.2 | |
| HCN(6–5) | ″ | … | … | (650) | 1.80 | 17.2 | 3.1 | |
| HCO+(6–5) | ″ | … | … | (650) | 1.80 | 17.2 | 3.1 | |
| HNC(6–5) | ″ | (135.79) | (3.005) | (650) | 1.34 0.61 | 12.8 5.8 | 2.4 1.1 | |
| PLCK_G045.1+61.1 | HCN(5–4) | IRAM/EMIR | … | … | (650) | 4.54 | 44.0 | 15.8 |
| HCO+(5–4) | ″ | … | … | (650) | 4.54 | 44.3 | 15.6 | |
| PLCK_G113.7+61.0 | HCN(4–3) | ″ | … | … | (500) | 4.19 | 18.2 | 12.8 |
| HCO+(4–3) | ″ | … | … | (500) | 4.74 | 20.7 | 14.3 | |
| HNC(4–3) | ″ | … | … | (500) | 4.74 | 21.0 | 13.8 | |
| PLCK_G138.6+62.0 | HCN(4–3) | ″ | … | … | (500) | 5.35 | 23.6 | 16.6 |
| HCO+(4–3) | ″ | … | … | (500) | 5.35 | 23.8 | 16.4 | |
| PLCK_G165.7+67.0 | HCN(6–5) | ″ | … | … | (600) | 3.02 | 17.2 | 3.6 |
| HCO+(6–5) | ″ | … | … | (600) | 3.02 | 17.3 | 3.5 | |
| HNC(6–5) | ″ | … | … | (600) | 2.27 | 13.2 | 2.6 | |
| PLCK_G200.6+46.1 | HCN(4–3) | ″ | … | … | (450) | 2.60 | 16.0 | 11.2 |
| HCO+(4–3) | ″ | … | … | (450) | 2.60 | 16.1 | 11.1 |
2.2 Spectral-line interferometry
2.2.1 NOEMA
The two GEMS, PLCK_G092.5+42.9 and PLCK_G145.2+50.9, were observed with NOEMA in September and October 2015 (project S15CH, PI Cañameras). For each track, six antennas were included in the D configuration observations, with baselines between 24 m and 97 m. The phase centers of the observations were located at =16:09:17.76 and =+60:45:21.0 for PLCK_G092.5+42.9, and at =10:53:22.56 and =+60:51:49.0 for PLCK_G145.2+50.9. The 3-mm receivers were tuned to cover the sky frequencies of the HCN and HCO+ –4 lines for both GEMS. The WideX correlator was used as the backend, with its 3.6-GHz bandwidth at a spectral resolution of 1.95 MHz.
For PLCK_G092.5+42.9, MWC~349 and LkHa~101 were used for bandpass calibration, while the bright quasars 3C454.3, 0851+202, 1749+096, and 2013+370 were observed as primary flux calibrators, and we regularly observed the nearby quasars 1642+690 and 1637+574 for gain and phase calibration. For PLCK_G145.2+50.9, LkHa~101 and 3C84 were used for bandpass and flux calibration, while 1030+611 and 1044+719 were used for gain and phase calibration.
The data were calibrated and imaged within GILDAS/CLIC and MAPPING. To image the data, we applied natural weighting, resulting in beamsizes of 6.1″ 4.0″ at a position angle of 67.6° for PLCK_G092.5+42.9, and 5.6″ 4.3″ at a position angle of 118.9° for PLCK_G145.2+50.9. We produced data cubes of 35-MHz spectral resolution, with channel spacings of and for PLCK_G092.5+42.9 and PLCK_G145.2+50.9, respectively.
In addition, –4 lines of HCN, HCO+, and HNC for PLCK_G244.8+54.9 were observed in December 2019, with a beamsize of 2.9″ 1.2″ at a position angle of 14.2°, as part of a broader spectral window (project S19CU, PI Nesvadba). The corresponding line fluxes were added to our current analysis, while the overall data will be presented in a forthcoming paper.
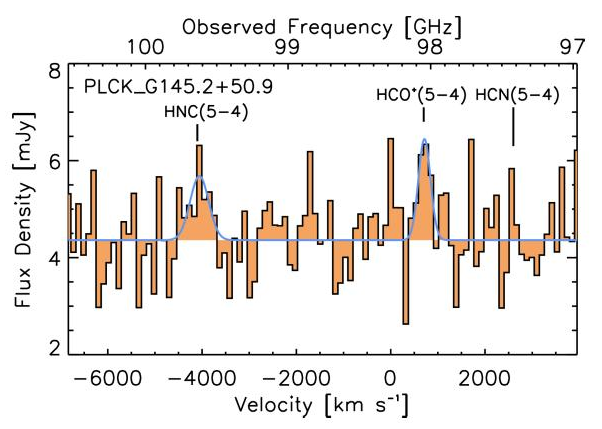
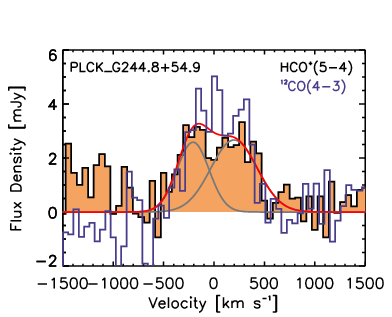
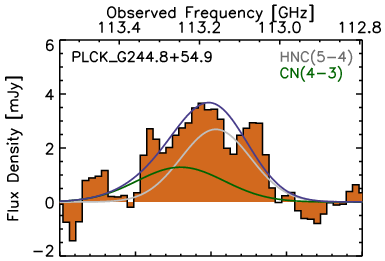
We derived spatially integrated spectra by coadding spatial pixels above 3 in velocity-integrated maps to maximize the S/N (see Fig. 2). All lines detected at more than 3 were fitted simultaneously with Gaussian profiles using the mpfit algorithm, together with the continuum. Their properties are listed in Table 6. We computed uncertainties using Monte Carlo simulations, by randomly drawing the flux in each spectral channel assuming flux uncertainties of 10% and reproducing the fitting procedure. Errors on the line parameters correspond to the mean and standard deviation of the distributions obtained after 1000 iterations.
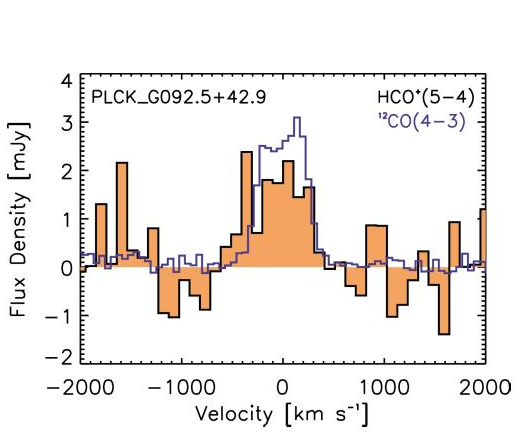
Defining the signal-to-noise ratios as , with the best-fitting peak flux density and its uncertainty, the detections of HCO+(5–4) and 13CO(4–3) in PLCK_G092.5+42.9 have S/N values of 9.5 and 9.0, respectively. In PLCK_G145.2+50.9, HNC(5–4) is detected at 3.8 and HCO+(5–4) at 3.5. These values are consistent with line fluxes measured on low S/N EMIR detections. Finally, in PLCK_G244.8+54.9, HCN(5–4), HCO+(5–4), and HNC(5–4) have S/N values of 14.3, 15.5, and 19.5, respectively. We also measure a 3-mm dust continuum of mJy at GHz in PLCK_G092.5+42.9, mJy at GHz in PLCK_G145.2+50.9, and mJy at GHz in PLCK_G244.8+54.9.
2.2.2 ALMA
For PLCK_G244.8+54.9, we also used ALMA data obtained in Cycle 3 (2015.1.01518.S, PI Nesvadba). These correspond to two science goals in Band 3, with lower and higher spatial resolution, respectively.
The lower-resolution data were taken on 21 July 2016, with 39 antennas (configuration C40-5) and specifically targeted dense-gas line tracers in three basebands, that is, HNC(5–4) centered at a redshifted frequency of 113.115 GHz, HCN(5–4) at 110.635 GHz, and 13CO(4–3) at 110.046 GHz. We used narrower basebands, of 1200 km s-1, than we had for the higher-resolution data. For the reduction, we used standard manual scripts with the Common Astronomy Software Application (CASA, McMullin et al. 2007). The bandpass and amplitude/flux calibrator was J1058+0133 and the phase calibrator was J1041+0610, 3.1° from PLCK_G244.8+54.9. Continuum subtraction was complicated by the fact that the ALMA bandwidth is almost completely covered by line emissions. We identified a part of the fourth ALMA baseband centered on 111.616 GHz as the most weakly contaminated range and used it as a spatial template with lowest line emission. However, we needed to correct the amplitude of the continuum template map by a factor 0.67 to account for the integrated line flux density of H2O(42,3–33,0) at 111.84 GHz based on the NOEMA spectrum of PLCK_G244.8+54.9 in Fig. 2. We produced the data cubes for the final analysis using CLEAN “Briggs” weighting with and the synthesized beamsize is at a position angle of °.
We used these lower angular resolution, continuum-subtracted line cubes to derive spatially-integrated spectra and line maps of HCN(5–4) and HNC(5–4), with a channel width of 15 MHz. We coadded frequency channels covering these emission lines to produce velocity-integrated maps and summed up pixels above 3 to obtain integrated spectra. Emission lines were fitted with single Gaussians and errors computed with flux uncertainties per spectral channel of 10%. The HCN(5–4) line flux of is consistent within 1 with that from NOEMA, and the HNC(5–4) flux matches those from the higher-resolution data cube and from NOEMA within 1. Line profiles are also comparable. Consequently, given that these uncertainties and the limited width of the HCN(5–4) and HNC(5–4) basebands () are insufficient for producing a robust characterization of the baseline levels and line profiles, we focus the following discussion on the highest S/N detections of HCN(5–4) and HNC(5–4) from NOEMA and from the higher-resolution ALMA data cube, respectively.
These higher resolution observations targeted the redshifted CO(4–3) line centered at 114.888 GHz (i.e., ) with high spectral resolution (see C17a); it also covered the HNC(5–4) line in a baseband centered at 112.897 GHz, with a channel width of 15.6 MHz. These data were taken on 23 October 2015, with 35 antennae (configuration C36-8) in good conditions with PWV of around 0.6–1.0 mm and high phase stability (95–100 m rms on baselines of 6500 m). We applied automatic and manual flagging of visibilities, calibrating bandpass and amplitude/flux with J1058+0133, and phase with J1044+0655, 2.4° from PLCK_G244.8+54.9. We used a “Briggs” weighting with and obtained a synthesized beam of at a position angle of 45.3°. Another source, J1038+0512, which is 2.3° from J1044+0655, was also included in the scan sequence to allow us to verify the quality of the transfer of the phase solutions from the phase calibrator. The rms in the data cube is , with a spectral channel width of .
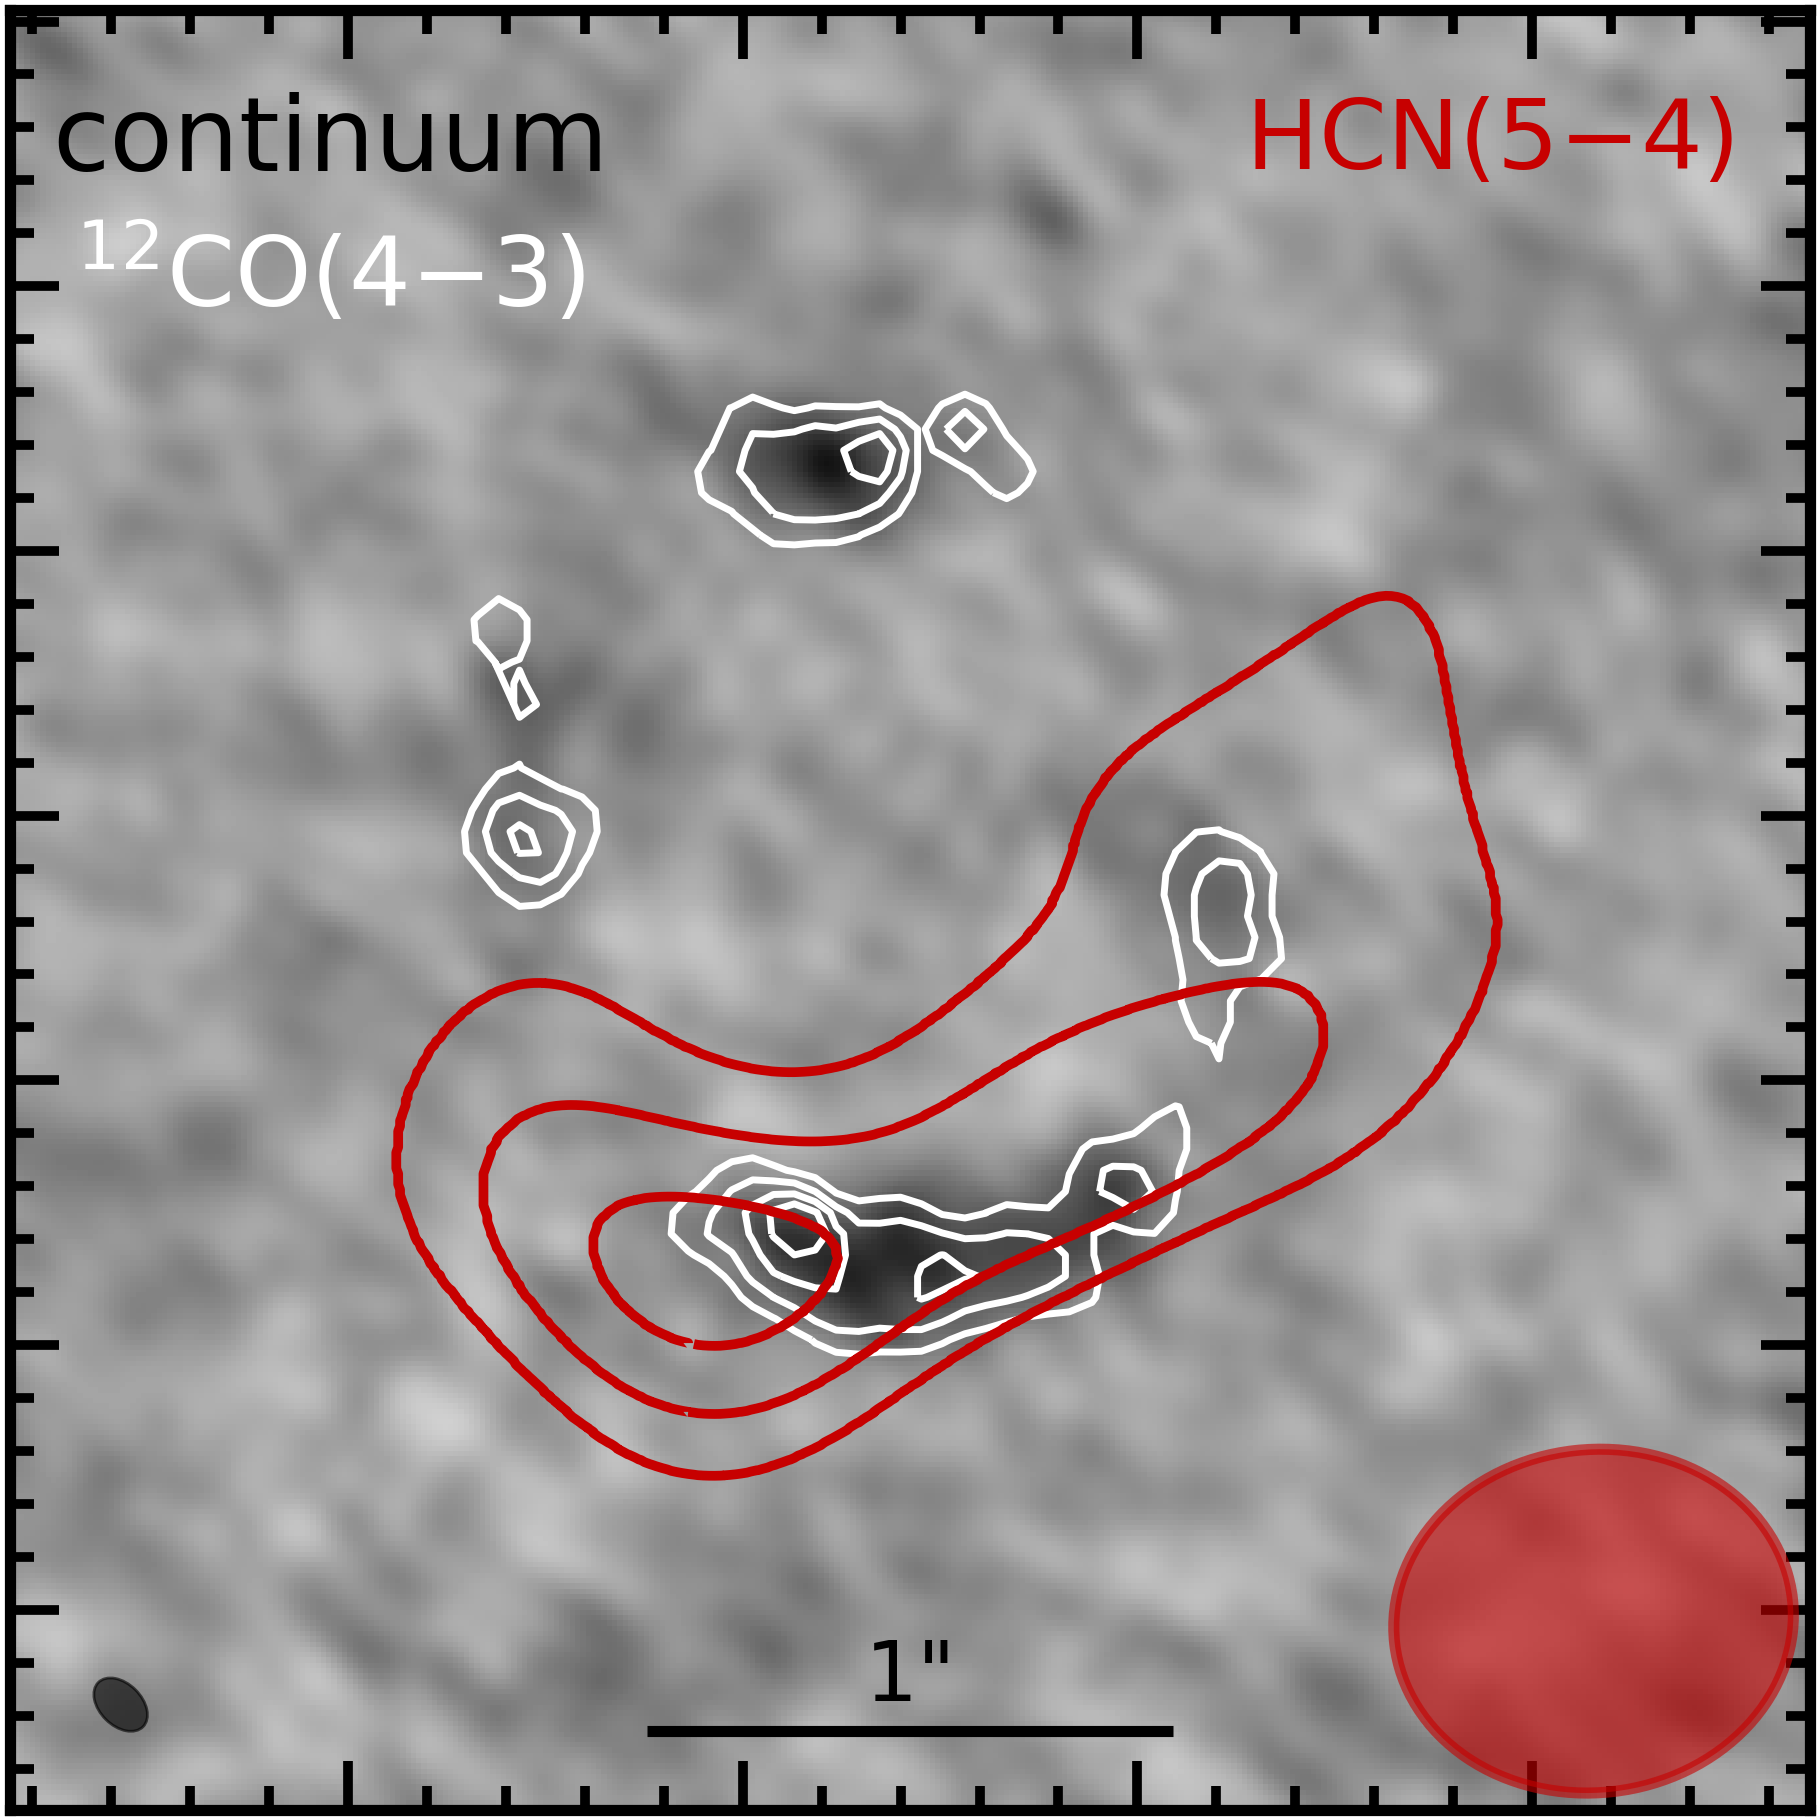
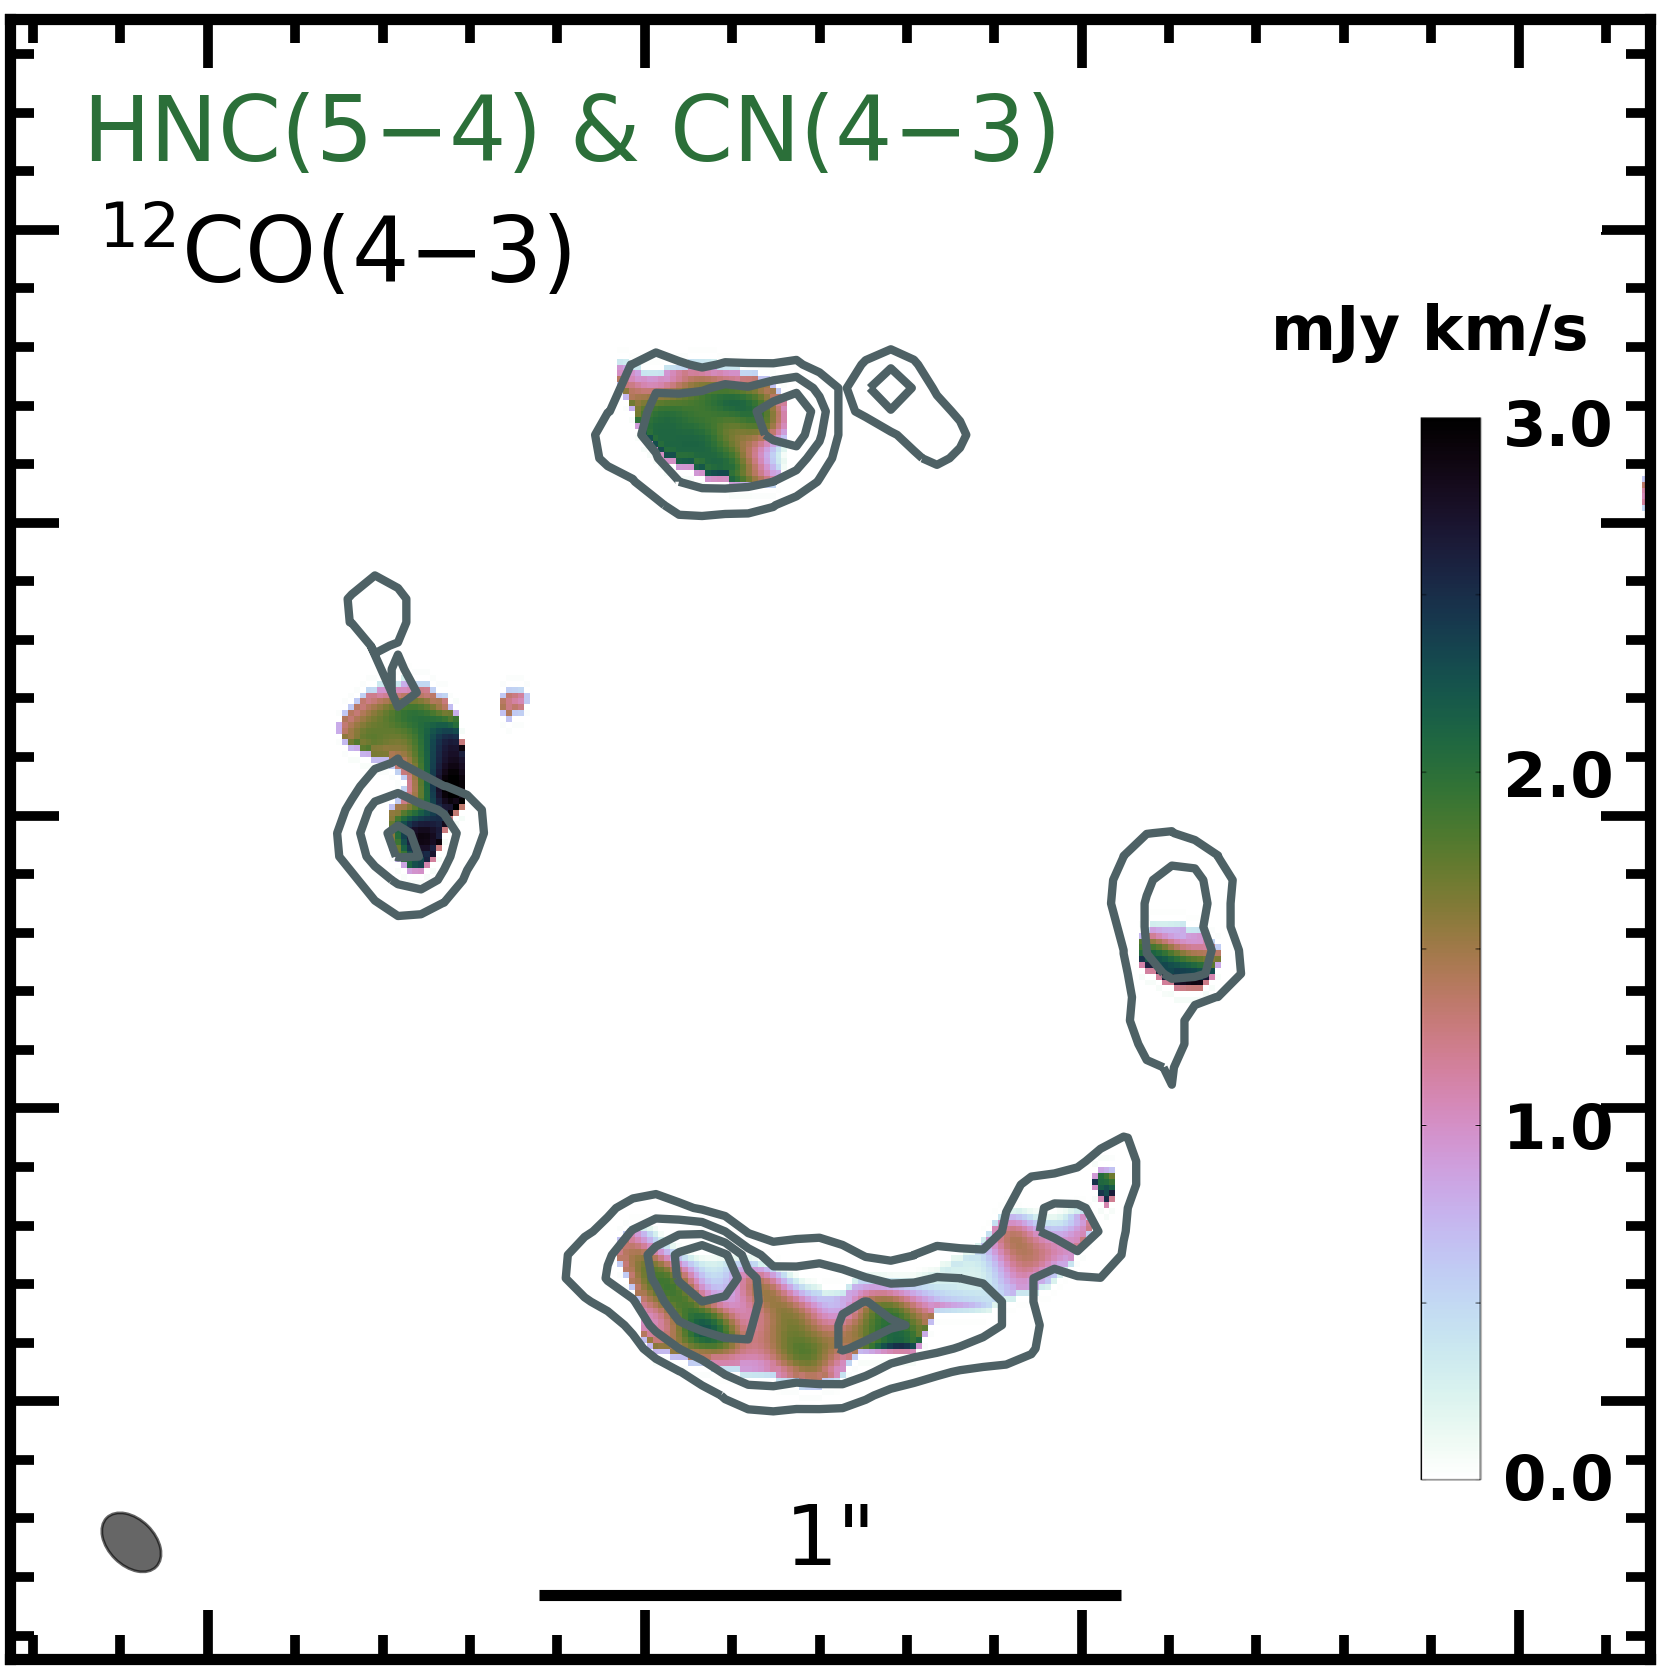
We created continuum and HNC(5–4) line-flux maps from the higher-resolution data cube by fitting the line profile in spectra extracted over circular apertures of 0.08″ diameter, which is slightly lower than the beamsize, in order to maximize the S/N without losing spatial information. For each pixel with on the velocity-integrated line map, we fitted a single Gaussian component using mpfit. Given the relatively low S/N per aperture, we fitted only the peak flux by keeping the line centroid and FWHM fixed to values measured on the integrated spectrum (see Table 6), and the continuum fixed to the average over the line-free channels. The resulting maps are shown in Fig. 3.
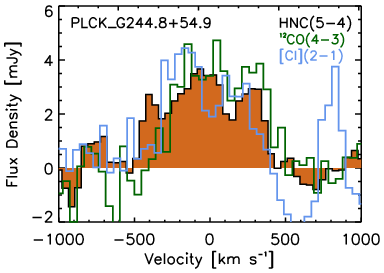
The HNC(5–4) line profile is characterized using a (,) tapered version of the higher-resolution data cube, with beamsize of at . This cube improves the spectrum S/N, spatially resolves the partial Einstein ring, and has an rms of per spectral channel. We created a velocity-integrated line map and summed up pixels above 3 from this map. The resulting source-integrated spectrum is shown in Fig. 4 and has a rms level of 0.5 mJy. Similarly to C17a, we recover about 70% of the source-integrated continuum flux density at 3-mm expected from our modified blackbody fit of the FIR/sub-mm spectral energy distribution in C15. The missing emission is likely from extended regions filtered out with this higher-resolution configuration and has been added to the observed HNC(5–4) line flux in Table 6.
3 Emission line properties
In Table 6, we list properties of all the emission lines from high-density tracer molecules observed with EMIR, NOEMA, and ALMA, including the line FWHMs, velocity-integrated fluxes, and luminosities obtained with single Gaussian fits (or the 3 upper limits). In the subsequent analysis and discussion, we only consider line properties and line ratios in PLCK_G092.5+42.9, PLCK_G145.2+50.9, and PLCK_G244.8+54.9 (which are the GEMS with the deepest integrations), while the others are not detected individually in dense-gas tracers. For these three sources, mK on EMIR spectra provide particularly tight flux upper limits.
3.1 Line profiles
Figures 1, 2, and 4 show the profiles of emission lines detected at more than 3 with the IRAM-30m/EMIR, NOEMA, and ALMA. All spectra except those showing the complete NOEMA spectral windows have been continuum subtracted using first-order polynomials fitted to line-free spectral channels. Due to their limited S/N, the EMIR spectra of dense-gas tracers cannot distinguish individual velocity components. Those for which we fitted the HCN, HCO+, and HNC line FWHMs suggest comparable line widths with those of 12CO (CO hereafter) in C18, despite large uncertainties. Line widths in PLCK_G244.8+54.9 are large but remain consistent with the range of 580– of high S/N lines across the CO ladder (–11)777For single Gaussian fits not listed in C18., suggesting that these tracers probe highly turbulent gas reservoirs with similar spatial distributions.
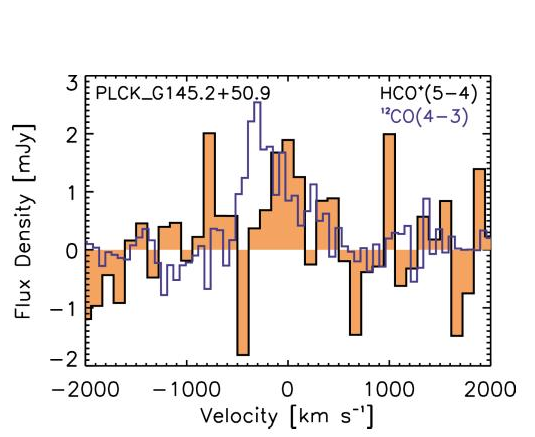
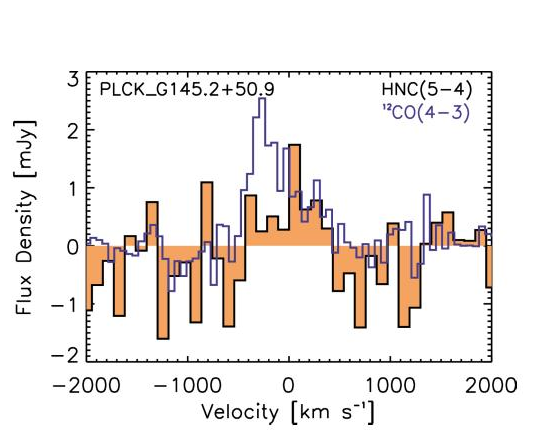
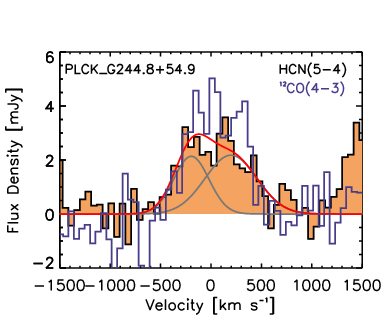
Emission lines detected with NOEMA and ALMA have higher S/N and better resolution than those observed with EMIR, and most of them are well fitted by single Gaussians. They are overplotted in Figs. 2 and 4 with the mid- CO transition from C18 with the highest S/N, shifted to the same frequency, rescaled arbitrarily, and rebinned to spectral resolutions of 100 and , respectively (rightmost panels of Fig. 2 and bottom panel of Fig. 4). The widths and centroids of dense-gas and CO transitions are similar in most cases, in line with previous findings for high-redshift SMGs (Oteo et al. 2017; Béthermin et al. 2018). For instance, the profiles of HCO+(5–4) and CO(4–3) in PLCK_G092.5+42.9 match reasonably well. For PLCK_G145.2+50.8, the HCO+(5–4) profile seems asymmetric and shifted by about with respect to CO(4–3) (akin to HCN(3–2) in the Cosmic Eyelash, Danielson et al. 2011), with a low FWHM of . These variations might be intrinsic, suggesting more compact dense-gas emitting regions than the bulk of the CO gas reservoirs, but we caution that the deficit of HCO+(5–4) emission near the CO(4–3) peak needs to be confirmed with a higher S/N spectrum.
The HCN(5–4) and HCO+(5–4) emission lines in PLCK_G244.8+54.9 also have similar widths and centroids to those of mid- and high- CO, for single Gaussian fits; Fig. 2 illustrates how well-matched these profiles are. It is worth noting that these spatially-integrated spectra also closely resemble that of HNC(5–4) from ALMA in Fig. 4, when excluding the blue emission tail from to (likely due to contamination of HNC(5–4) by CN(4–3), as demonstrated in Sect. 3.3). HCN, HCO+, and HNC should therefore probe nearly co-spatial regions in PLCK_G244.8+54.9, which is consistent with recent studies on the inner regions of local star-forming galaxies (e.g., HCN and HCO+ –3 in the central few kpc of NGC 253, NGC 1068, IC 342, M 82, M 83, and NGC 6946, Tan et al. 2018). Moreover, the similarity between dense-gas and CO lines in PLCK_G244.8+54.9 suggests that the strongly magnified region of 1 kpc source-plane size (C17a) is fairly homogeneous in line properties, in spite of its outstanding star formation and gas-mass surface densities. This region likely hosts enough dense gas to sample the same velocity profile as seen in CO. This argues for a genuine multiphase medium, with ongoing mass exchange between dense and more diffuse gas driven by turbulence.
Overall, we obtained the lowest dense-gas line fluxes and the most significant differences between line profiles in PLCK_G145.2+50.8. This could mean that gas phases are better mixed in PLCK_G244.8+54.9 (and perhaps in PLCK_G092.5+42.9) than in PLCK_G145.2+50.8, where our data may cover fewer dense cores and more diffuse gas.
3.2 Individual spectral components
For the three GEMS in the current analysis, CO lines covered in C18 exhibit double-peaked profiles with individual spectral components offset by 300 to 450 km s-1 and with 50% variations in their flux ratios (see description in C18, ). We cannot directly measure the dense-gas emission associated with each of these components for PLCK_G092.5+42.9 and PLCK_G145.2+50.9 using EMIR and NOEMA. However, for PLCK_G092.5+42.9, Fig. 2 qualitatively suggests that intensity ratios between dense tracers and CO are comparable in the red and blue spectral features separated by . For PLCK_G145.2+50.9, NOEMA spectra point towards lower HCO+(5–4)/CO(4–3) and HNC(5–4)/CO(4–3) in the blue kinematic component, but these have low S/N.
For PLCK_G244.8+54.9, the NOEMA spectra of HCN(5–4) and HCO+(5–4) are reasonably well fitted with single Gaussians but show a common excess around (Fig. 2). This suggests double-peaked profiles with line components separated by , akin to all spatially integrated CO spectra with –10 (C18) for this source and to the CO(4–3) line profiles in multiple images across the source from our high-resolution study (C17a). We fitted these two kinematic components by fixing their central velocity to the average CO line centroids over the SLED of and . The blue and red spectral components of HCO+(5–4) have and mJy, and and mJy, respectively. The red component is broader by a factor of approximately 1.6, which is in excellent agreement with FWHM ratios in the range 1.4–1.9 measured on single-dish spectra of mid- and high- CO lines (C18); the red component is also brighter. The blue spectral component of HCN(5–4) has and mJy, while the red component is 1.3 times broader, with and mJy. We did not attempt to fit the components separately for HNC(5–4), which is blended with CN(4–3). The similar FWHM and flux ratios found between these individual Gaussians indicate that mid- CO lines, HCN, and HCO+ do not trace gas reservoirs with fundamentally different kinematics in PLCK_G244.8+54.9. This also suggests that line-emitting regions are nearly collocated in the source plane within the rotating disk probed in CO(4–3) (C17a).
| Source | |||||||
|---|---|---|---|---|---|---|---|
| PLCK_G092.5+42.9 | 0.022 | 0.052 0.007 | 0.031 | 0.10 | 0.24 0.09 | 0.059 | 0.14 0.04 |
| PLCK_G145.2+50.9 | 0.015 | 0.018 | 0.008 | 0.11 | 0.12 | 0.05 | 0.06 0.03 |
| PLCK_G244.8+54.9 | 0.064 0.023 | 0.084 0.034 | 0.061 0.025 | 0.40 0.23 | 0.52 0.30 | 0.07 | 0.09 |
| 0.071 0.009 | 0.072 0.008 | 0.066 0.018 | 0.56 0.22 | 0.56 0.21 | 0.10 | 0.10 |
3.3 Deblending HNC(5–4) and CN(4–3)
The HNC(5–4) emission line is blended with the –3 transition of the cyanide radical CN (CN(4–3) hereafter), with a velocity offset of about . Here, CN(4–3) has multiple components due to fine and hyperfine splitting, and its two most prominent components are within and have comparable intensities (Guélin et al. 2007). At high redshift, HNC(5–4) and CN(4–3) have been detected in the stacked spectrum of SPT lensed SMGs (Spilker et al. 2014), albeit with spectral resolution that was too limited to directly measure the individual line fluxes. While HNC(5–4) is expected to be brighter (see also below), significant contamination was previously measured in a few high-redshift sources, including the lensed quasar APM 08279+5255 (Guélin et al. 2007) and two high- lensed SMGs (Béthermin et al. 2018). This demonstrates the need to perform a careful deblending of these lines.
For PLCK_G244.8+54.9, the HNC(5–4) line shown in Fig. 4 is broad and exhibits an excess of blueshifted emission around , which is not observed in the [C i](2–1) and CO(4–3) line profiles and does not match the expected velocities of the independent red and blue spectral components (offset by around from each other, see C18). The flux excess rather corresponds to the redshifted frequency of CN(4–3), similarly to Guélin et al. (2007), suggesting that CN(4–3) makes a non-negligible contribution to the combined line flux.
We deblended the two emission lines using our highest S/N ALMA spectrum (Fig. 4) by fitting them simultaneously, with peak frequencies fixed to our best redshift estimate from CO (C18).999We obtained consistent results using the HNC(5–4)+CN(4–3) detection from NOEMA with lower S/N. To derive robust constraints on the line FWHMs and fluxes, we fitted each transition with a single Gaussian without considering neither independent velocity components in this source, nor the individual CN(4–3) components. The resulting line FWHMs are similar to those of –4 and –3 transitions of high-density tracers in PLCK_G244.8+54.9 (see Table 6), and we obtained flux uncertainties of about 20%. The HNC(5–4)/CN(4–3) integrated flux ratio is 1.760.86, remarkably similar to measurements from the literature, including the APM 08279+5255 quasar (around 1.7, Guélin et al. 2007), and individual strongly lensed SPT SMGs at –3.0 (around 1.6, Béthermin et al. 2018). Given that for PLCK_G145.2+50.9, the spectrum S/N is too low to estimate individual line fluxes, we used the same ratio to infer an HNC(5–4) flux of 0.40 Jy km s-1 from the blended line flux given in Table 6.
3.4 Discussion on differential lensing
High-density tracer molecules are expected to reside in the inner core of giant, star-forming molecular clouds and could potentially probe an ISM component that is distinct from that probed in the low-to-mid- CO, or [C i] lines. Different spatial distributions have been observed in low-redshift (U)LIRGs (see, e.g., Scoville et al. 2015, 2017; König et al. 2018), where dense regions are located within the starburst cores and embedded in diffuse, colder gas reservoirs. High-redshift lensed SMGs could also have such configurations and, in this case, spatially integrated emission line fluxes and profiles could be strongly affected by differential magnification (Hezaveh et al. 2012; Serjeant 2012), introducing high uncertainties on the diagnostics from line ratios.
We used the high-spatial resolution HNC(5–4) cube from ALMA for PLCK_G244.8+54.9 to compare the intensity-weighted magnification factor of this line with that of CO(4–3) (from C17a, ). These exquisite data allow us to directly study the spatial distribution of molecular gas phases probed by the two transitions, for the first time at high redshift, thanks to the extraordinary brightness of this maximal starburst (C17a). Since those lines were observed at the same time with the same array configuration, they are perfectly suited to measure magnification factors, independent of beamsize variations. Figure 3 shows that CO(4–3) and HNC(5–4) (blended with CN(4–3)) are nearly cospatial in the image plane, with only small spatial offsets of 0.1–0.2″ between the emission peaks. Line emission on the southern arc presents similar clumpiness in both tracers. Finding similar distributions of both tracers along the partial Einstein ring already gives strong evidence that they probe nearly the same regions in the source plane. As in C18, we used the amplification maps from our best-fit lens model of PLCK_G244.8+54.9 (Cañameras et al. 2017b) and the ALMA line-imaging in Fig. 4 to compute the luminosity-weighted magnification factor of HNC(5–4). We found , lower than the factor for CO(4–3) (C18). This difference is higher than the 1 noise uncertainties and the 5% systematics expected from the strong lensing model (C18), but remains comparable to other measurement uncertainties. The different values might correspond to the small spatial offsets seen in Fig. 3. Alternatively, could also be subject to other systematics from the line fitting (see Sect. 2.2) or from local variations of the CN(4–3) line contamination, rather than differential magnification.
Moreover, the aforementioned FWHM and flux ratios of the blue and red line components in PLCK_G244.8+54.9 provide further evidence that differential lensing does not strongly affect these velocity components, which are likely to be tracing rotational motions in a fragmenting gaseous disk (C17a). As shown previously, we measured similar line widths for these velocity components, over CO transitions from –2 to –9 and HCN(5–4), which span four orders of magnitude in critical densities, . This would not be the case in the presence of strong differential magnification between CO-emitting gas and higher-density gas phases traced by HCO+(5–4) and HCN(5–4). In that scenario, variations in the line FWHMs would indicate that each tracer probes distinct regions in the source that sample the velocity fields differently. On the contrary, our component separation procedure suggests that we probe intrinsic regions with similar levels of turbulence with both emission lines. Although we cannot rule out different spatial distributions on galaxy-wide scales, this favors a multi-phase ISM over regions most strongly magnified by gravitational lensing that dominate the observed line emission. Our finding of dense-gas line FWHMs within 1 of CO in PLCK_G092.5+42.9 and PLCK_G145.2+50.9 (see Table 6) is also consistent with this scenario. Together with small differences in our direct estimates of and , this leads us to ignore the impact of differential lensing in PLCK_G244.8+54.9, as well as in PLCK_G092.5+42.9 and PLCK_G145.2+50.9.
4 Properties of the dense-gas reservoirs
4.1 Diagnostics from line ratios
In this section, we compare the line ratios involving high-density tracer molecules in the GEMS with samples of low- and high-redshift sources in the literature.
4.1.1 Ratios between dense gas and 12CO
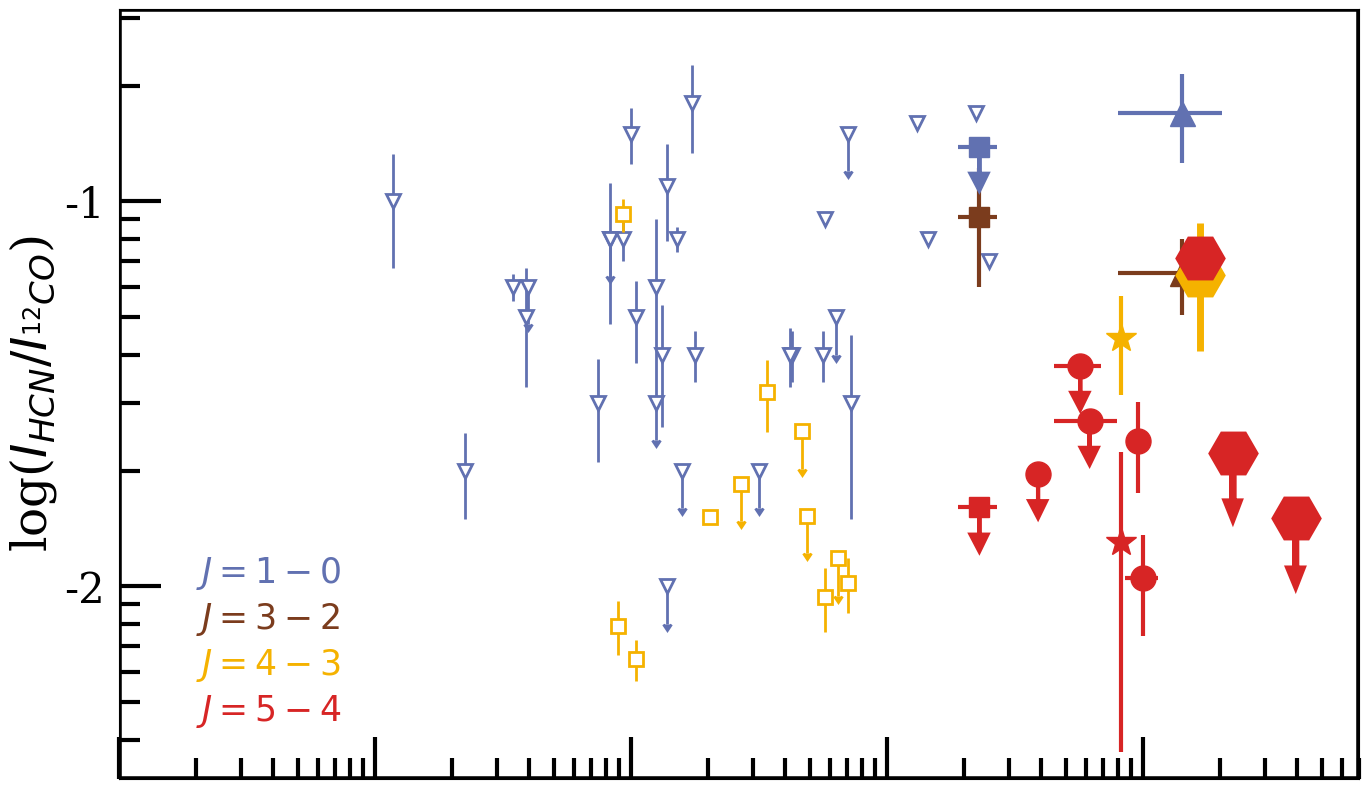
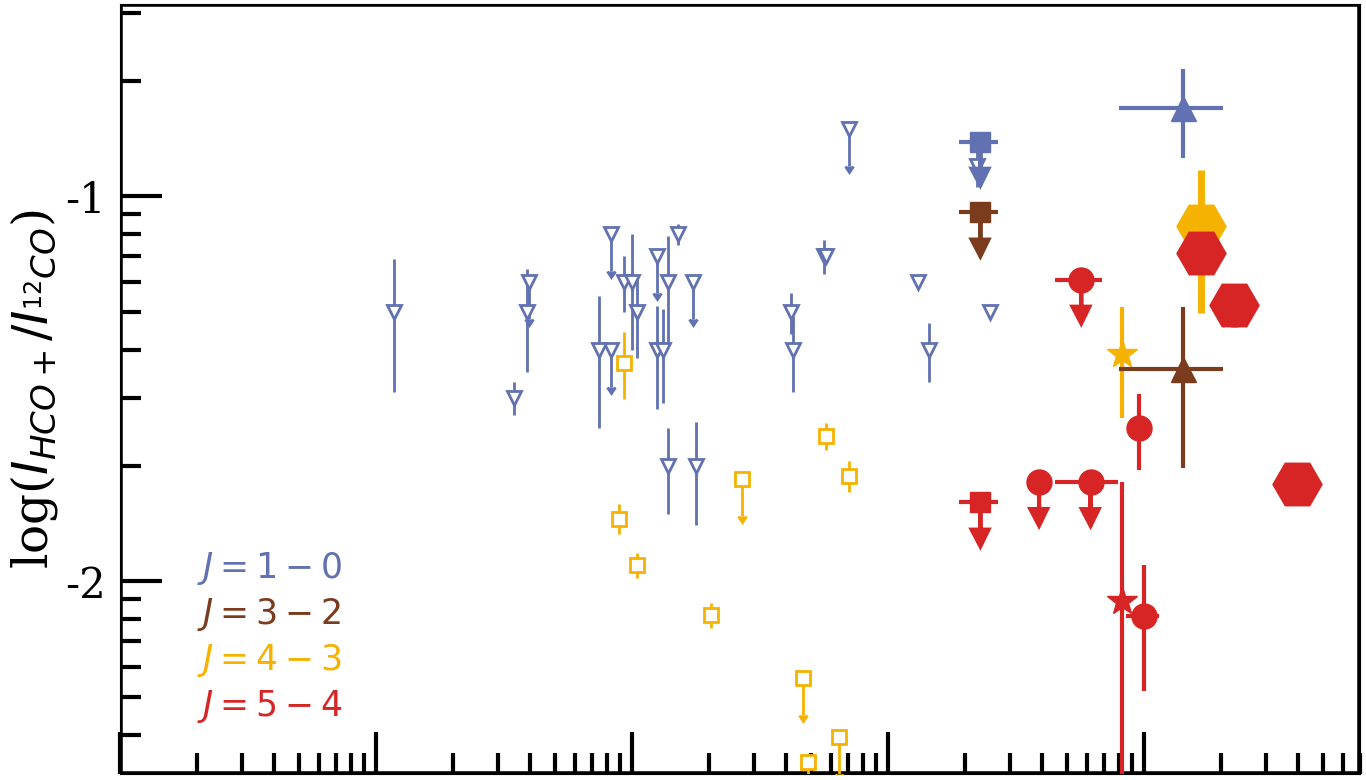
We computed the flux ratio of dense gas to CO lines presented in C18 using the same rotational level for both transitions as is traditionally done in the literature. For sources without CO line measurements at the corresponding level, we used extrapolated fluxes from the best-fit large velocity gradient (LVG) models from C18. Our measurements are listed in Table 8 and plotted in Fig. 5, together with values from the literature. Comparison samples include nearby LIRGs and ULIRGs (Baan et al. 2008; Zhang et al. 2014) and high-redshift lensed SMGs (Oteo et al. 2017; Béthermin et al. 2018), either in the ground or mid- transitions. In particular, the line ratios of SPT SMGs from Béthermin et al. (2018) are given in terms of –4, by converting the CO(4–3) fluxes to CO(5–4) using the average ratio over this sample (see the stacking analysis in Spilker et al. 2014).
When measured on the ground rotational level, ratios of high-density tracer molecules to CO are valuable proxies of the mass fraction of dense gas over the bulk of the molecular gas reservoirs. Several studies in the past decade have characterized these ratios for populations of active star-forming galaxies, LIRGs, and ULIRGs at low redshift, finding significant variations of the ratios HCN/CO, HCO+/CO, and HNC/CO, over a broad range from 0.01 to 0.15 (Graciá-Carpio et al. 2008; Baan et al. 2008; Costagliola et al. 2011). Ratios inferred for local normal spiral galaxies are significantly lower (Jiménez-Donaire et al. 2019), even when focusing on their inner regions, with galactocentric radii kpc, which host more massive dense-gas reservoirs. On average, Jiménez-Donaire et al. (2019) obtain HCN/CO 0.025, HCO+/CO 0.018, and HNC/CO 0.011 over nine spiral disks, while Baan et al. (2008) find about 0.078, 0.052, and 0.043 for these ratios in LIRGs and ULIRGs.
These line ratios decrease gradually when using higher energy levels for both molecules (e.g., Juneau et al. 2009). For nearby LIRGs and ULIRGs, the average HCN/CO –0 ratios of Baan et al. (2008), when both transitions are detected, are around 0.078, while the fluxes from Zhang et al. (2014) and Rosenberg et al. (2015) lead to HCN/CO 0.025 in –3. PLCK_G092.5+42.9 and PLCK_G145.2+50.9 have comparably low HCN/CO and HNC/CO ratios in the –4 transition (Table 8) and their dense-gas SLEDs likely peak at lower levels than those of CO. However, for PLCK_G244.8+54.9, the –3 and –4 ratios are consistent within 1, suggesting very excited SLEDs in this extreme source. Variations in the line ratios demonstrate the need to carefully account for the excitation of high-density tracer molecules in order to obtain a deep understanding of the gas phase directly fueling star formation. We emphasize that since line emissions are not resolved in our dataset, these ratios are consistently probing source-averaged quantities.
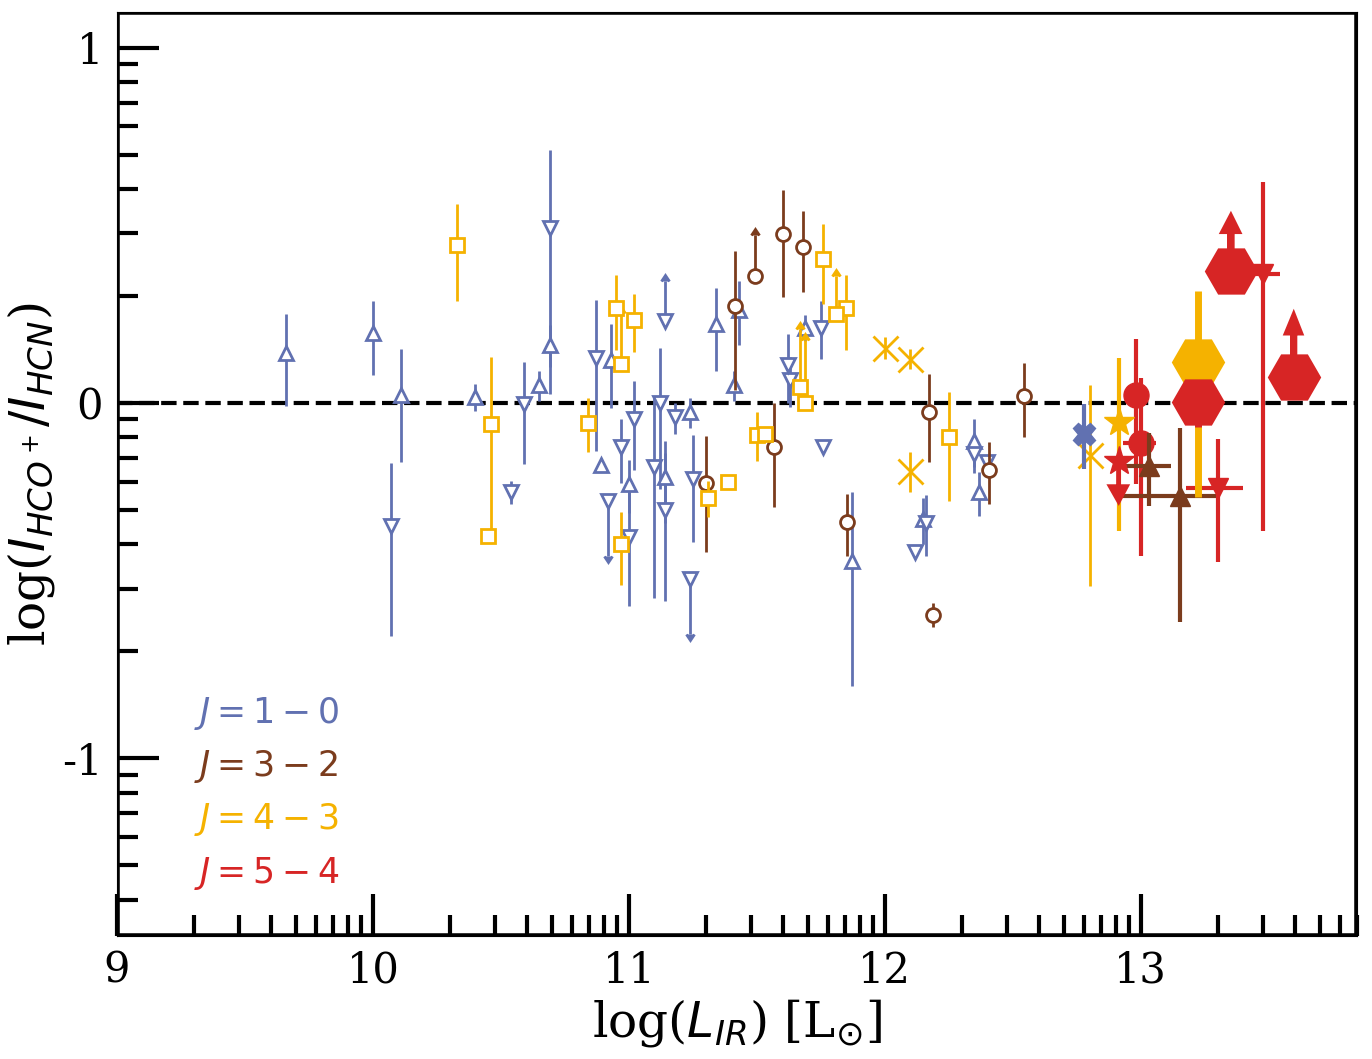
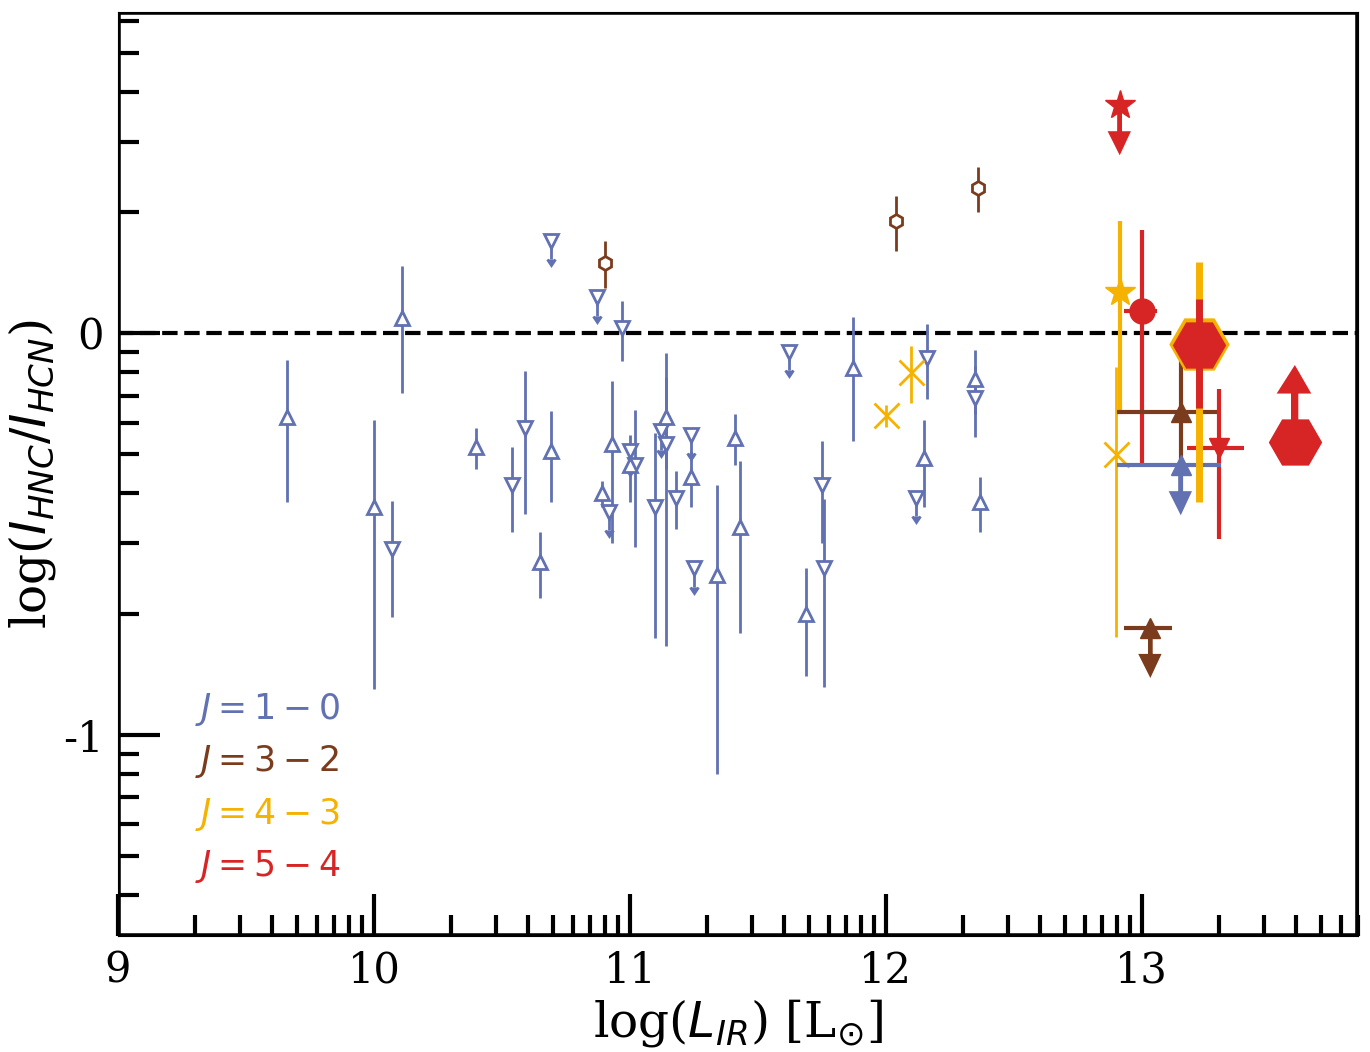
Figure 5 shows that for each rotational level, line ratios in the three GEMS broadly agree with previous studies of lensed SMGs. In general, HCN/CO and HCO+/CO for and 5 are slightly higher than the stack of SPT SMGs (Spilker et al. 2014). Only upper limits for PLCK_G092.5+42.9 and PLCK_G145.2+50.9 approach the low HCN/CO(5–4) ratio of 0.013 in the stack. Danielson et al. (2011) and Oteo et al. (2017) obtain higher HCN/CO and HCO+/CO ratios in the Cosmic Eyelash, SDP9, and SDP11 than for the GEMS; this is not surprising since these studies use –2 and –0 ratios, which, in low-redshift ULIRGs, are generally higher than for due to the rapid decrease of the dense-gas SLEDs at (Papadopoulos et al. 2014). The spatially-integrated HNC/CO ratio in PLCK_G244.8+54.9 is remarkably similar to the SPT stack, and it drops in PLCK_G092.5+42.9 and PLCK_G145.2+50.9 closer to the value of 0.01 in SPT055150 (uncorrected for the CN(4–3) contribution, Béthermin et al. 2018). For each tracer, PLCK_G145.2+50.9 exhibits the lowest ratios among the GEMS.
In PLCK_G244.8+54.9, the blue and red spectral components exhibit HCN/CO(5–4) ratios of 0.0740.020 and 0.0620.019, respectively, using the CO line fitting from C18, which is consistent with the ratio of 0.0710.009 obtained from integrated line fluxes. These minor variations suggest similar distributions of gas phases traced by CO and HCN across the gaseous disk of this maximal starburst. The velocity-integrated HCN(5–4) map of Fig. 3 broadly confirms that nearly 100% of the dense-gas emission arises from the southern arc, which also emits 65% of the CO(4–3) emission. In addition, the HNC(5–4) (Fig. 3) and CO(4–3) (C17a) maps at a common resolution of 0.1″ are well suited to compare both phases. The emission line regions have very similar distributions, with 0.1–0.2″ offsets between local peaks. Assuming a constant CN(4–3) line contamination, the local variations of HNC/CO along the Einstein ring remain within a factor of two for all clumps identified in CO. The ratios are therefore comparable over star-forming regions that are strongly magnified in PLCK_G244.8+54.9, despite nearly four orders of magnitude difference in critical density between the two transitions. Finally, we also find higher HCN/CO and HCO+/CO integrated –3 ratios in PLCK_G244.8+54.9 compared to the low-redshift galaxies from Zhang et al. (2014), which could either indicate higher dense-gas fractions or different excitations of the gas reservoirs probed by each molecule. We explore both hypotheses in Sects. 4 and 5 by using low-density ISM tracers to better constrain the dense-gas fraction and probe its impact on extreme star formation.
4.1.2 Ratios between high-density tracer molecules
| Source | |||
|---|---|---|---|
| PLCK_G092.5+42.9 | 2.35 | 1.68 | |
| PLCK_G145.2+50.9 | 1.18 | 0.54 | 2.21 1.19 |
| PLCK_G244.8+54.9 | 1.30 0.76 | 0.94 0.56 | 1.38 0.88 |
| 1.00 0.15 | 0.93 0.28 | 1.08 0.31 |
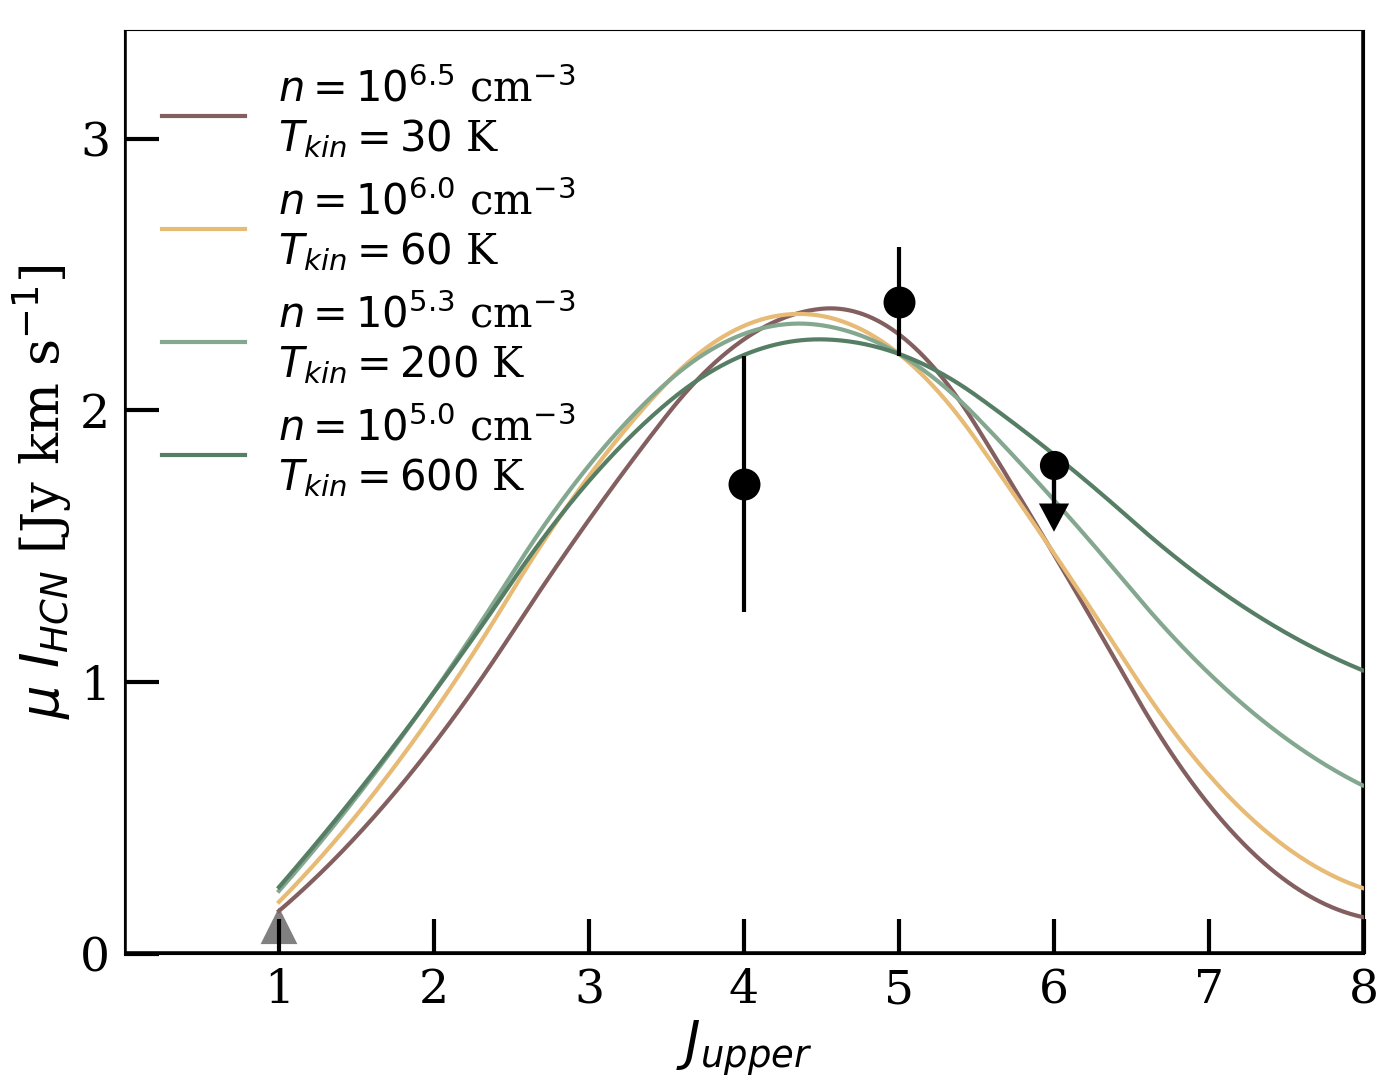
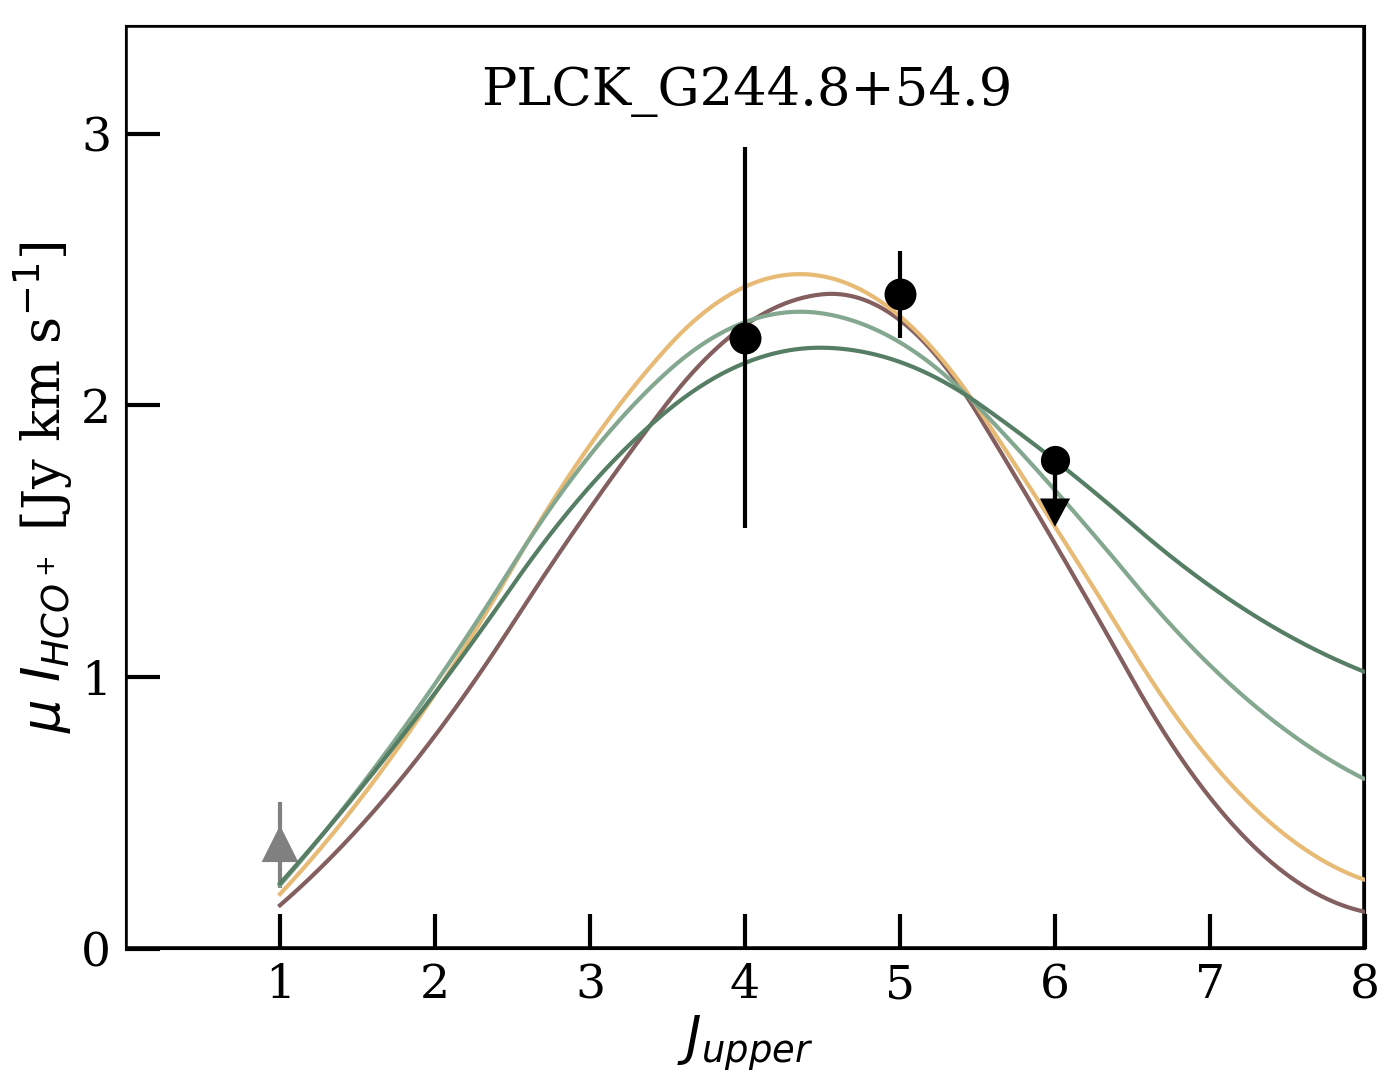
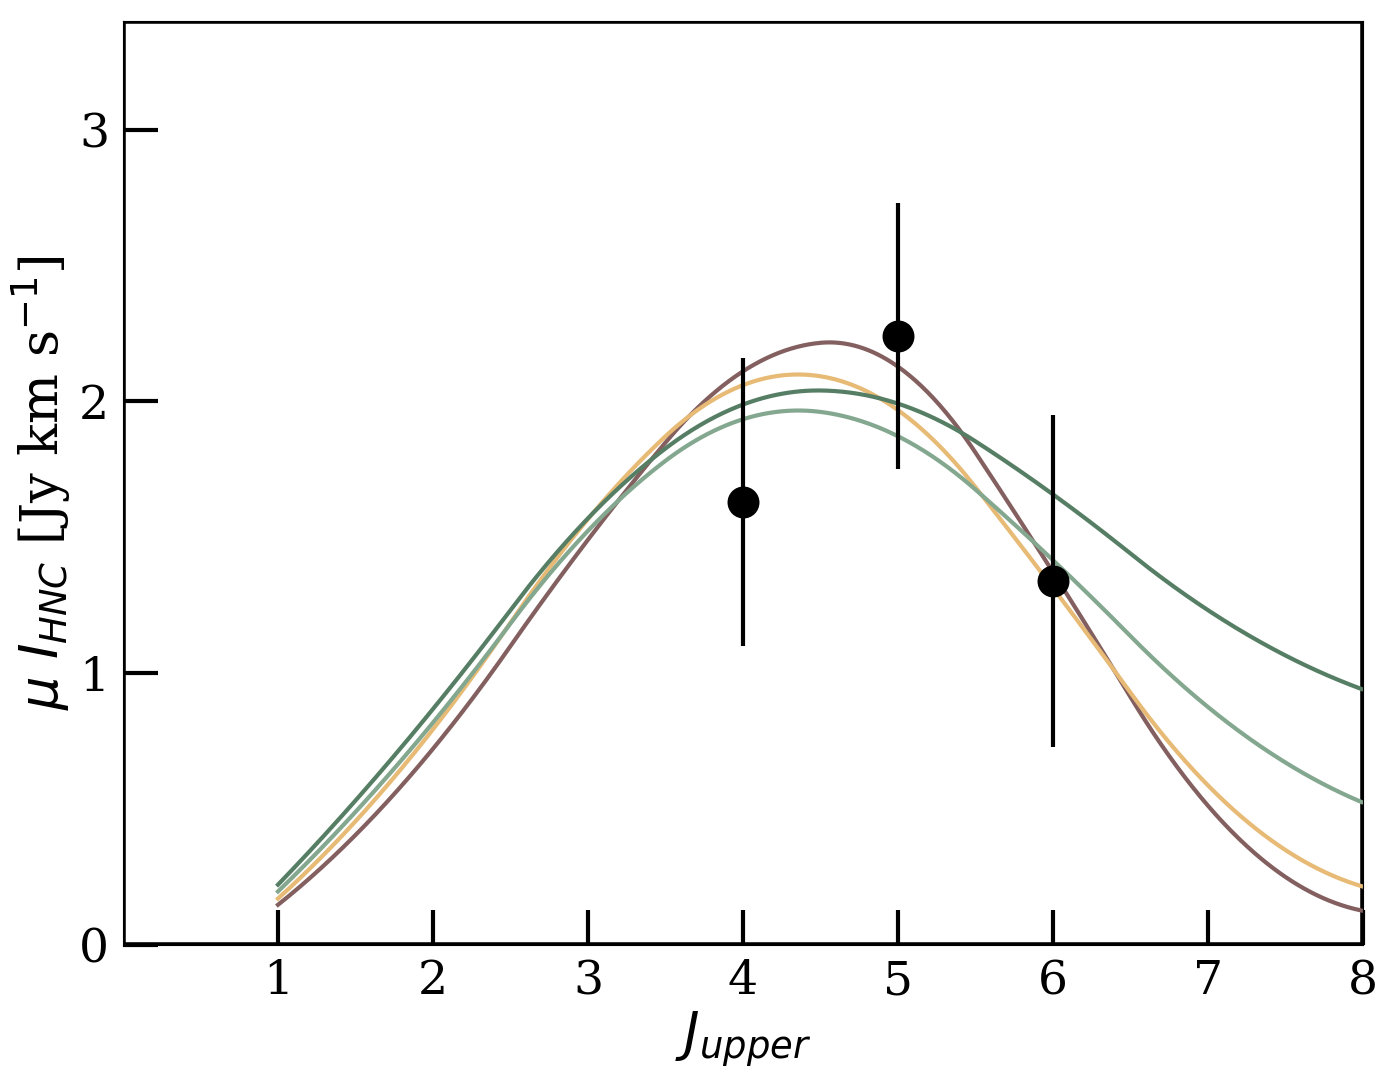
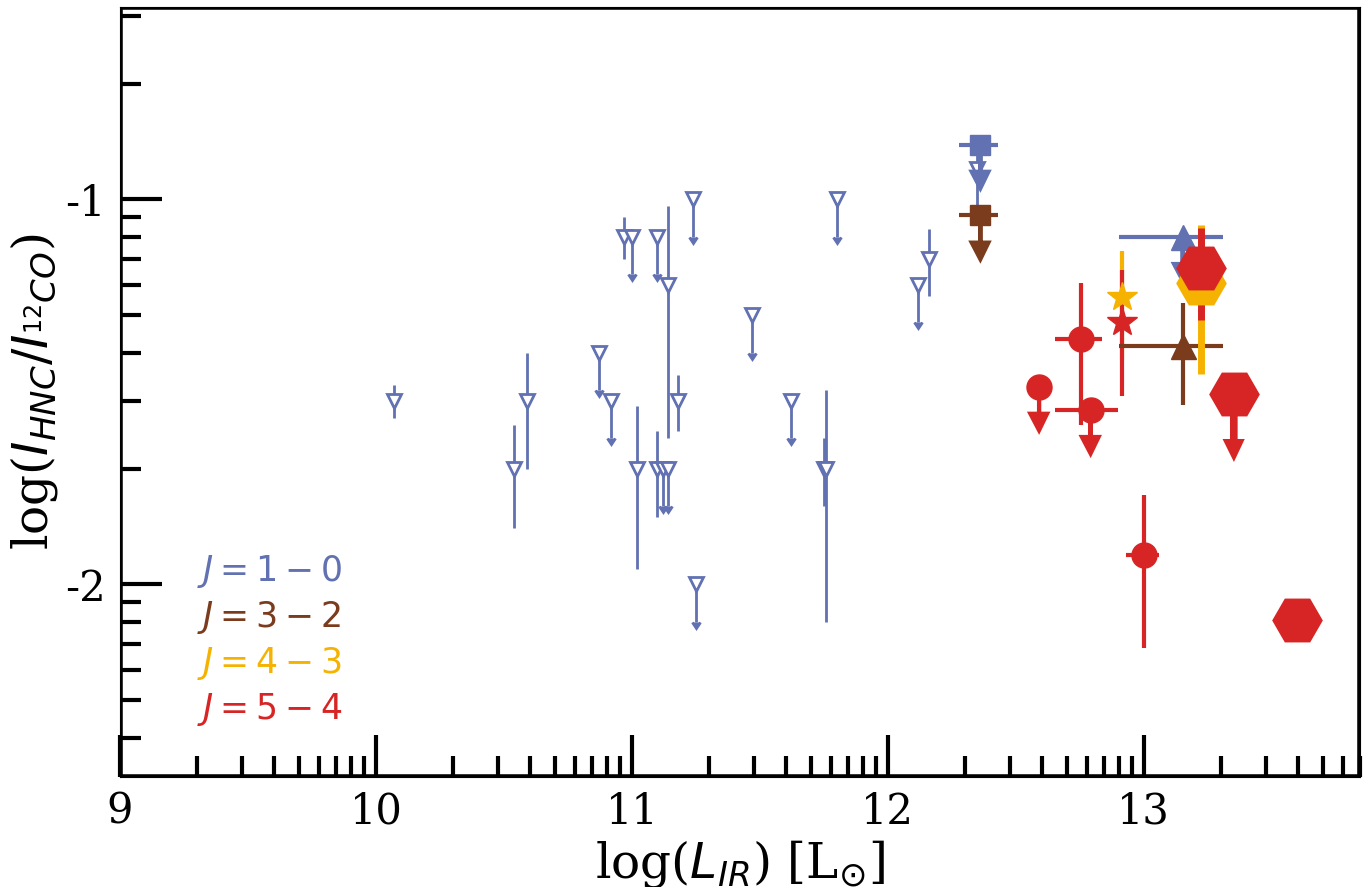
Table 10 and Fig. 6 illustrate the variations of HCO+/HCN and HNC/HCN in the GEMS and other samples of low- and high-redshift sources in the literature, covering four orders of magnitude in . For PLCK_G244.8+54.9, –3 and –4 ratios are consistent within 1, as expected in the presence of collisional excitation, given the similar critical densities of –3 and –4 transitions for both molecules. This similarity also suggests that our deblending of HNC(5–4) and CN(4–3) in Sect. 3 is robust. Our comparison includes nearby gradually or more intensely star-forming galaxies from different surveys that also include LIRGs and ULIRGs (Graciá-Carpio et al. 2008; Baan et al. 2008; Costagliola et al. 2011; Zhang et al. 2014), as well as high-redshift lensed SMGs (with corrected for lensing magnifications), together with the Cloverleaf QSO (Riechers et al. 2006). These populations do not show obvious systematic variations of the HCO+/HCN line ratio for different rotational levels over the range –5 (color-coded in Fig. 6), implying that both molecules have similar spatially-integrated SLEDs over a large variety of active galaxies. Evidence remains scarce for the HNC/HCN ratio, which has been little studied for levels in the local Universe. The ratio found by Costagliola et al. (2011) for the ground level in a sample of Seyferts, starbursts, and LIRGs, may suggest significant differences in both SLEDs when compared with the ratio measured in Arp 220, Mrk 231, and NGC 4418 for –2 (Aalto et al. 2007). However, this would benefit from a more systematic study of HNC excitation for a larger sample.
Firstly, we measure an HCO+/HCN(5–4) ratio of in PLCK_G244.8+54.9, the only one of the GEMS with both lines detected, and for PLCK_G092.5+42.9 and PLCK_G145.2+50.9, observed in –4. These values are compatible with the regime of luminous star-forming galaxies in the local Universe. They are generally higher than at , although PLCK_G244.8+54.9 remains within 1 of some high-redshift sources in Fig. 6. Lower limits are near the upper regime of SMGs, and more comparable to the elevated ratio in G09v1.97 (Yang 2017), a strongly lensed major merger of two ULIRGs at , characterized at high angular resolution by Yang et al. (2019). Secondly, we obtain similar brightness levels for HNC and HCN lines in the GEMS. In PLCK_G244.8+54.9 where both lines are detected, the HNC/HCN ratio is consistent with unity both for –3 and –4, which is particularly close to the values for the SPT stack (Spilker et al. 2014) and for SPT0551-50 (Béthermin et al. 2018). Other high-redshift sources have lower ratios, down to the upper limit in SDP11 (Oteo et al. 2017). HNC/HCN in PLCK_G244.8+54.9 is higher than average values over the sample of Costagliola et al. (2011) for –0, while for PLCK_G145.2+50.9, we measure .
Both HCO+/HCN and HNC/HCN line ratios in the GEMS are also higher than the average values of and obtained for more gradually star-forming, spiral galaxies in the local Universe (–0 line detections, Jiménez-Donaire et al. 2019). If there is indeed no dependence on the level, together with the scaling relations in Sect. 5.1, this adds further evidence for lower HCN line fluxes in the GEMS relative to local galaxies. In Sect. 4.3, we use these two ratios to probe the main heating mechanisms within the densest molecular gas phase in the GEMS.
4.2 Excitation of high-density tracers at high-redshift
Detailed analyses of high-density tracer molecule SLEDs are very rare, and most studies of the dense-gas ladder have focused on bright local starbursts or (U)LIRGs (e.g., Papadopoulos et al. 2014; Saito et al. 2018). At high-redshift, the most detailed excitation analyses have been conducted for the brightest QSOs, where HCN and HCO+ rotational lines maintain exceptional fluxes up to transitions with upper levels to 6, due to the competition of radiative and collisional excitation mechanisms. For instance, Riechers et al. (2010) used the –5 transitions of HCN, HCO+, and HNC in APM 08279+5255 at , combined with HCN(5–4) and CO line fluxes (Weiß et al. 2007), to highlight the major contribution of IR-pumping to the gas excitation in this strongly lensed quasar. The diagnostics remain hardly accessible for SMGs at –4, even for the brightest and most strongly magnified samples. Spilker et al. (2014) obtained detections for one or two different mid- levels by stacking ALMA spectra of 22 strongly lensed DSFGs from the SPT survey and found elevated gas densities and temperatures using LVG models. In general, gas excitation for individual SMGs remains accessible only for the most extreme lensed sources, such as the GEMS.
We derived radiative transfer models of HCN, HCO+, and HNC line emission in PLCK_G244.8+54.9, the only GEMS with multiple rotational levels detected for these molecules. Figure 7 shows the corresponding SLEDs, together with mid- to –0 line ratios in Arp 220 (Imanishi et al. 2007; Greve et al. 2009), an intense local starburst with comparable but slightly lower CO excitation (C18). The fluxes and upper limits in –5 suggest that our dense-gas data cover the turnover in the SLEDs around –4, at lower energy levels than CO (which is at to 7, C18). This corresponds to higher dense-gas excitation than in the well-studied low-redshift merger NGC 6240 (Papadopoulos et al. 2014), one of the rare local starbursts with detailed analyses of the HCN and HCO+ ladders peaking at (shock heating also plays a major role, Wang et al. 2014).
We inferred the average gas properties over star-forming cloud cores by assuming pure collisional excitation and ignoring other processes (discussed in Sect. 4.3). Observed line ratios were compared with those predicted by the RADEX code (van der Tak et al. 2007), which solves the statistical equilibrium equations for a uniform medium. RADEX is a non-LTE code using the LVG method to compute the escape probability of emitted photons as a function of gas physical conditions and to predict the line intensities. Constraints were exclusively taken from the to 6 HCN, HCO+, and HNC lines, which have comparable and can be assumed to be cospatial.111111In contrast, the to 10 CO transitions have times lower and can arise from warmer environments with different conditions (e.g., the outer layers of giant molecular clouds, where HCN is dissociated, Boger & Sternberg 2005). High- CO emission could also be influenced by mechanical feedback and not directly related to the star formation rate (Greve et al. 2014). Including these transitions in the excitation analysis would thus induce major uncertainties. We produced grids of line-intensity ratios with RADEX for a range of molecular hydrogen number densities – and gas kinetic temperatures to K, for an expanding sphere geometry, and using H2 as the main collision partner of high-density tracers with collision rates from Flower (1999) and Dumouchel et al. (2010). The column densities per unit velocity gradient were fixed to . This is consistent with our expectations that PLCK_G244.8+54.9 is highly obscured, with akin to local ULIRGs such as Arp 220 (e.g., Wilson et al. 2014), and hosts HCN, HCO+, and HNC abundances relative to H2 of 10-9 to a few , comparable to local galaxies (Omont 2007) and Galactic giant molecular clouds (GMCs, Bergin et al. 1996; Helfer & Blitz 1997). This is also consistent with the linewidths in Table 6. Moreover, these dense-gas column densities agree with the best-fit values of 1017.5– in C18 for [HCN/CO]10-4 (e.g., Omont 2007). The models adopt a single gas excitation component and a background radiation temperature of 10.9 K, equal to at . We then computed the goodness-of-fit values between the measured and predicted line ratios for each combination of and .
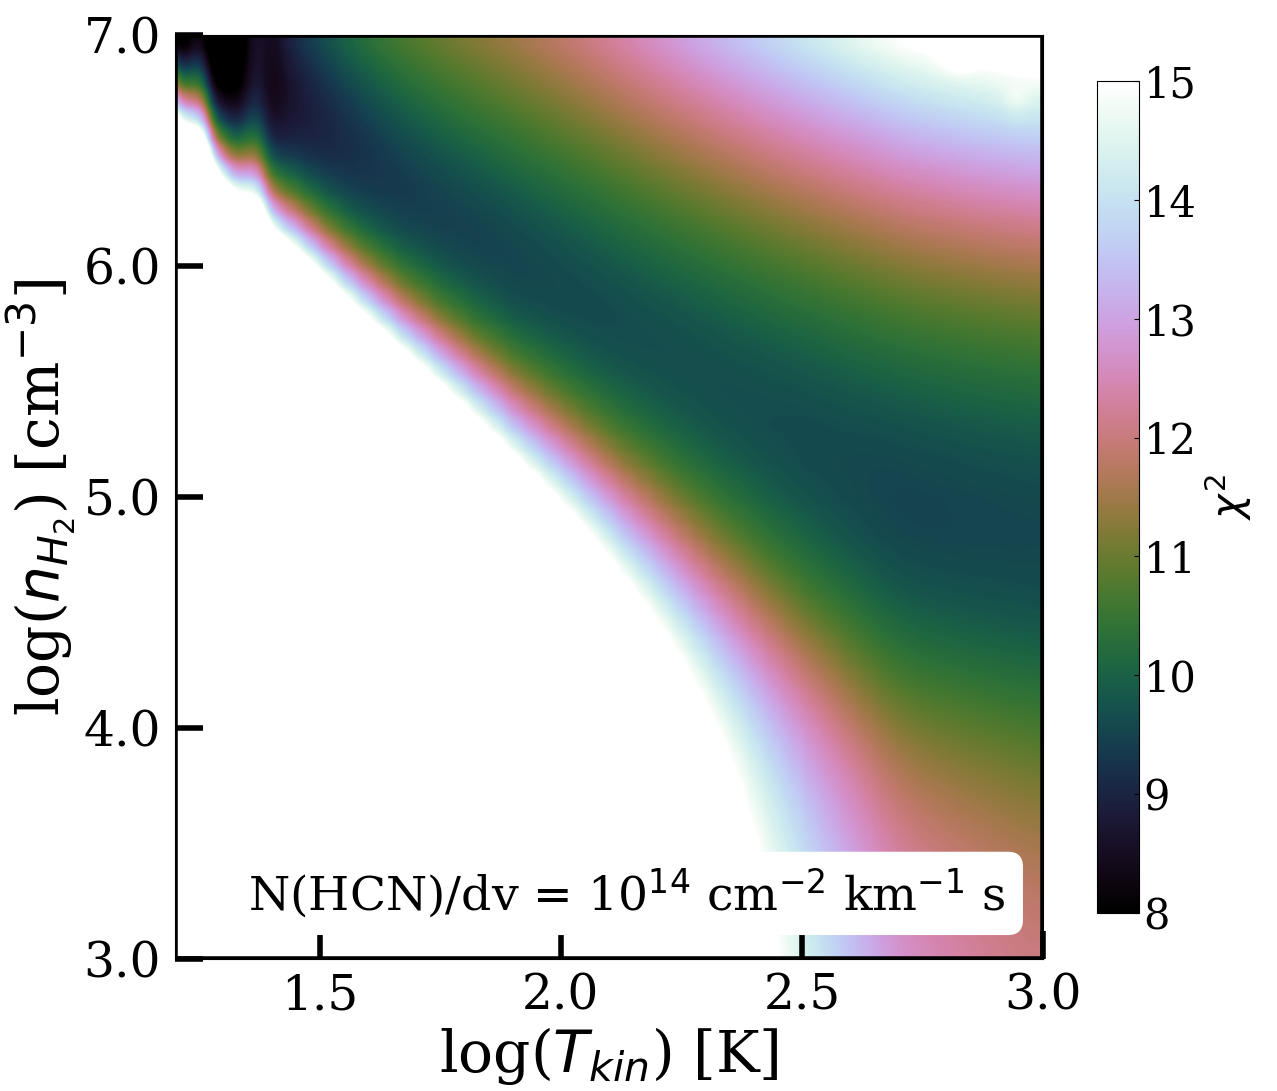
Figure 8 shows the resulting distribution as a function of and and illustrates the strong parameter degeneracies that prevent us measuring the exact gas conditions. The minimum (for four degrees of freedom) is obtained for and K, which would correspond to (C15), but similar fits are also obtained for solutions with and –100 K, or with and –600 K. Figure 7 shows the SLEDs for representative solutions, and suggests that, even though the lines are moderately optically thick (see, e.g., local ULIRGs, Scoville et al. 2015), lowering flux uncertainties and covering additional transitions around and above the peak would significantly reduce parameter degeneracies.121212More than adding –0 line fluxes, if our simple modeling assumptions hold over the entire energy range. In any case, ground-level observations of HCN and HCO+ remain essential to firmly constrain the mass fraction of molecular gas in the highest density phase. Our diagnostics combining all line ratios are in agreement with those for individual molecules, showing no evidence that HCN, HCO+, or HNC trace very different gas conditions (in contrast to Arp 220, Imanishi et al. 2010). Overall, the models robustly exclude average molecular gas densities of and confirm that PLCK_G244.8+54.9 hosts significant reservoirs of very dense gas with –. This is similar to the value cm-3 estimated in the dense cores of the Arp 220 nuclei (Scoville et al. 2015), as also shown in Fig. 7 through the agreement between our LVG model extrapolations and line ratios in Arp 220.
Interestingly, we obtain a common solution when adding the CO lines (dominated by the warm and compact CO-emitting phase identified in C18) to the excitation analysis. This demonstrates that at least part of the high-excitation CO gas emission in PLCK_G244.8+54.9 arises from environments dense enough to be detected in HCN, HCO+, and HNC. This could correspond to a multiphase ISM, with one or multiple very dense () and spatially-concentrated nuclear cores emitting HCN, HCO+, and HNC lines and hosting the Eddington-limited starburst identified in C17a, which is distributed over an extended, gas-rich and lower surface brightness disk-like component dominating the low- to mid- CO emission. Such ISM structures are common in low-redshift ULIRGs and a similar scenario has been recently proposed by Yang et al. (2020) for a SMG with dense-gas conditions probed by H2O lines.
4.3 Constraints on individual heating mechanisms
Non-collisional processes can enhance the HCN, HCO+, and HNC line emissions in regions with moderate dense-gas fractions, and vice versa, and can have important roles on the heating of gas deeply embedded within star-forming clouds. This complicates our interpretation of the dense-gas star-formation law. In this section, we determine whether intrinsic line ratios of HCN, HCO+, and HNC in the GEMS indicate an influence of such excitation mechanisms, from X-ray heating and IR-pumping (e.g. Krips et al. 2008), to mechanical heating from gas outflows or supernova explosions (e.g., Loenen et al. 2008).
4.3.1 Diagnostics from HCO+/HCN
Recent studies of nearby galaxies have highlighted that is sensitive to the presence of XDRs, which are generally produced by a nearby AGN rather than star formation. Radiative transfer models suggest that HCO+ emission is enhanced in XDRs while HCN remains unaffected by the elevated ionization rates in these environments, making the HCO+/HCN –0 and –3 ratios higher in XDRs than in PDRs (Meijerink & Spaans 2005; Meijerink et al. 2007). In NGC 1068, García-Burillo et al. (2014) indeed measure a factor two increase of the ratio close to the nucleus compared to the circumnuclear disk. In reality, these dense regions are nonetheless more complex than simple XDRs and other processes certainly contribute (e.g., mechanical heating through shocks, Tafalla et al. 2010).
Low-redshift studies show that spatially-integrated ratios actually tend to be lower in AGN-dominated than in star-formation dominated sources (e.g., Imanishi et al. 2016; Izumi et al. 2016), suggesting that the increase due to XDRs is rather a local effect in the most extreme AGN environments. For instance, Tan et al. (2018) obtained lower ratios for galaxies with strong AGN contributions in their sample of six nearby star-forming galaxies. Using -pc resolution ALMA line interferometry of nearby ULIRGs, Imanishi et al. (2019) found a 15–20% decrease of HCO+/HCN –2 ratios over compact regions located mainly in the central nuclear cores, and systematically lower integrated HCO+/HCN ratios 1 for those galaxies showing hints of strong dust-obscured AGN. Generally, therefore seems to indicate AGN-dominated systems (in agreement with ratios of García-Burillo et al. 2014, integrated over large radii).131313On average, since a few individual nearby AGNs exhibit integrated close to or even above unity (Imanishi & Nakanishi 2014; Imanishi et al. 2016) as seen in Fig. 6.
In this context, HCO+/HCN ratios and lower limits measured in PLCK_G092.5+42.9 and PLCK_G145.2+50.9 (see Table 10) are consistent with star-formation dominated systems, as expected from the lack of a strong AGN contribution to dust heating (C15). The ratios of PLCK_G244.8+54.9 are more ambiguous as they lie just at the limit between the two regimes. While this also corroborates the lack of XDR imprints on the high-to-low- CO line ratios in C18, we emphasize that an enhanced is not sufficient to firmly rule out the presence of XDRs (see Privon et al. 2015). The elevated cosmic-ray fields expected from the intense star-formation activity of the GEMS may also play an important role in setting the HCO+/HCN ratios in dense cloud cores shielded from UV fields, as argued for instance by Schirm et al. (2016) for the Antennae overlap region. The abundance of HCO+ is most strongly affected by variations in the cosmic-ray ionization rates and the resulting abundance of free electrons, but could be either enhanced or decreased according to the literature (e.g., Papadopoulos 2007). Given this ongoing debate and the possible influence of metallicity (Braine et al. 2017) or additional mechanisms (see discussion in Oteo et al. 2017), the HCO+/HCN ratio unfortunately cannot provide definitive ISM diagnostics for the GEMS.
4.3.2 Diagnostics from HNC/HCN
The characterization of HNC/HCN provides additional constraints, in particular, regarding the identification of PDRs and XDRs. Detailed analyses of Galactic molecular cloud cores acting as typical PDRs find –1.0 (Hirota et al. 1998) and, more recently, Hacar et al. (2020) obtained a similar range in Orion and highlighted that this line ratio strongly decreases for higher gas kinetic temperatures. Interestingly, mid- HNC/HCN ratios are systematically below unity in classical PDR models (Meijerink et al. 2007). Loenen et al. (2008) and Costagliola et al. (2011) proposed that additional mechanical heating from supernova explosions might be needed to explain the lowest range, . The lower limit in PLCK_G145.2+50.9 and the ratios in PLCK_G244.8+54.9 are thus consistent with the regime where PDRs dominate (see Fig. 6). We compared these values with the PDR models of Kazandjian et al. (2015) that predict strong variations in the presence of mechanical heating, especially for a highly enriched ISM and strong incident far-UV fields. We find that ratios in the GEMS are close enough to unity to match expectations for classical PDR models without significant mechanical heating. Additional transitions, ideally from the ground level, would be required to quantify the influence of this process.
To explain the ratio seen in Arp 220, NGC 4418, and Mrk 231, Aalto et al. (2007) invoked the influence of XDRs with enhanced HNC abundance, or mechanisms such as IR-pumping affecting HNC excitation more efficiently than HCN141414Because HNC can be pumped by continuum radiation at 21.5 , making the process more efficient in environments with intermediate gas temperatures than for HCN, which is pumped by 14.0 photons.. Following this interpretation, finding in PLCK_G244.8+54.9 for –3 and –4 does not necessarily indicate XDRs, a scenario that has already been disfavored on the basis of HCO+/HCN and high-to-low- CO line ratios in this source. Observations of the Galactic circumnuclear disk show that both molecules can be excited by mid-IR radiation fields, but only HCN in star-forming clumps with elevated dust temperatures above 100 K (Mills et al. 2013). High-redshift DSFGs with K, such as PLCK_G244.8+54.9, therefore cover an intermediate regime where only HNC transitions could be efficiently pumped, thereby increasing the overall HNC/HCN ratios. Similarly, Riechers et al. (2010) suggested that radiative excitation from infrared pumping contributes to setting extreme ISM conditions in the quasar APM 08279+5255.
5 Probing the dense-gas star-formation law
5.1 Scaling relations between dense-gas line and infrared luminosities
At low redshift, the star-formation rates of galaxies are tightly correlated with their total dense-gas content, with a power-law index of 1.0 (Gao & Solomon 2004b), lower than the index of 1.4 obtained from CO measurements (Kennicutt 1998). The linear relation extends to Galactic dense cores (Wu et al. 2005; Liu et al. 2016), down to – and to other high-density tracer molecules (Zhang et al. 2014), suggesting that they are better proxies of the SFE than CO. Previous studies proposed this indicates that the star-formation rates of low-redshift galaxies are driven by their dense-gas fractions, with a roughly constant SFE. The nature of the dense-gas star-formation law nonetheless remains debated, with some studies finding shallow sub-linear relations (e.g., Bussmann et al. 2008). Further diagnostics at high-redshift are particularly important to pursue the characterization of this – relation across various galaxy classes.
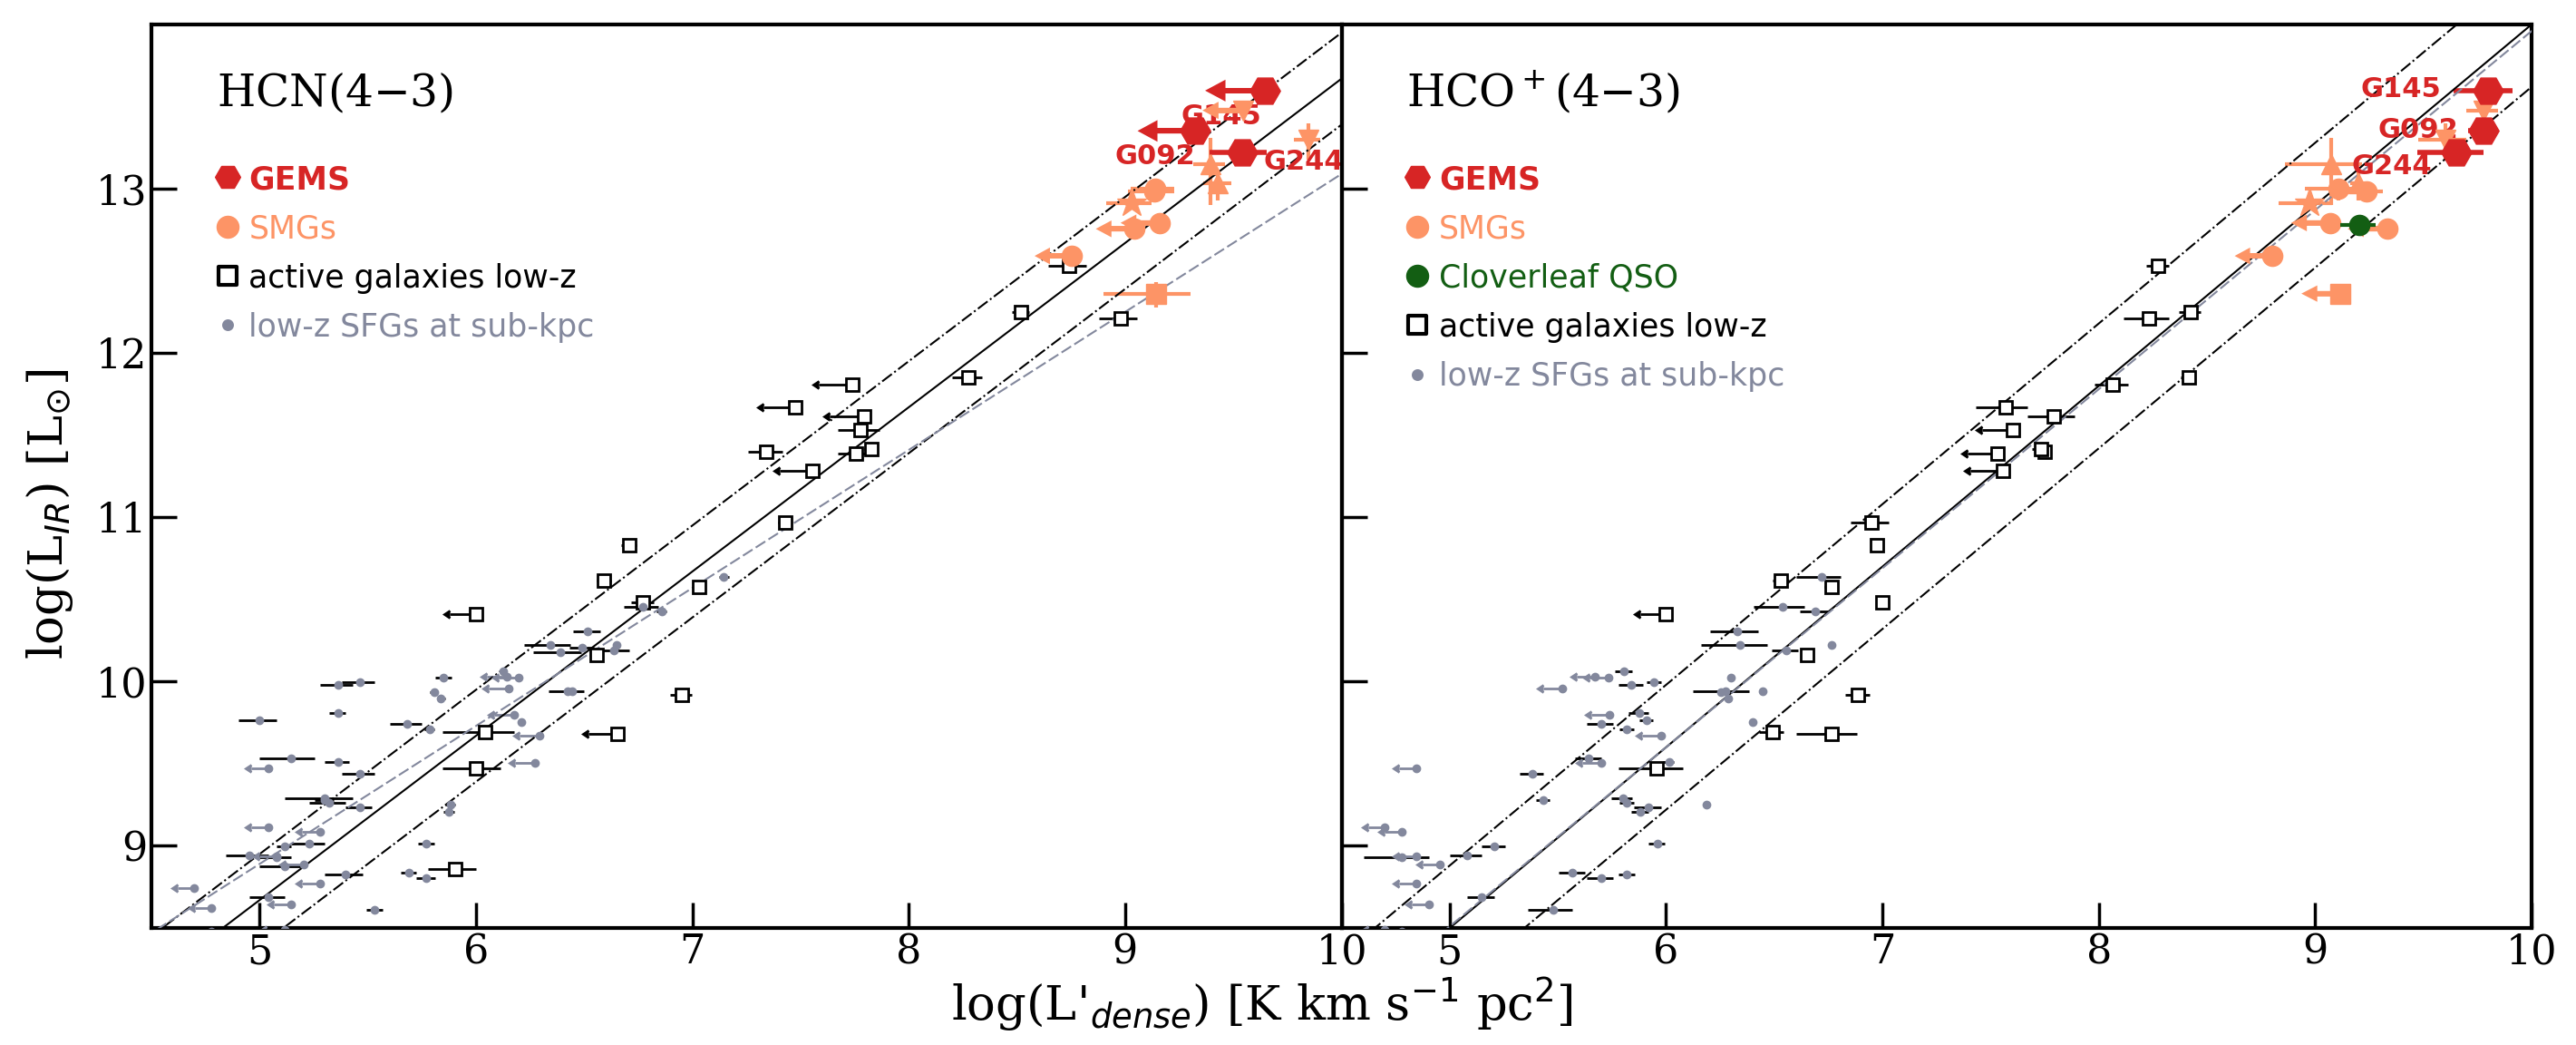
Given the rarity of HCN and HCO+ detections at high redshift, we place the GEMS on extrapolations of the scaling relations inferred in the local Universe. These scaling relations are directly compared for –3 to avoid relying on uncertain conversion factors between mid- and ground rotational levels and to take direct advantage of the recent line surveys covering this transition in low-redshift star-forming galaxies and ULIRGs. Due to the scarcity of active galaxies with detailed constraints on the dense-gas SLEDs, we converted the –2 or –4 line luminosities of sources without –3 observations, using ratios measured in the Milky Way. Mills et al. (2013) present the most comprehensive excitation analysis of these molecules in the Galactic central circumnuclear disk by fitting three transitions up to with non-LTE radiative transfer models. The luminosities are taken as the average over the four regions across the gaseous disk modeled by Mills et al. (2013) and, for HCN, this corresponds to and . We emphasize that uncertainties in applying these ratios to high-redshift environments are likely significant, but comparable to alternative conversions, and that is consistent with the value measured in PLCK_G244.8+54.9. The line luminosities in Table 6 are derived following the method of Solomon et al. (1997), and are integrated over 8–1000 m in the rest-frame, from the best-fit mid-infrared to submillimetre composite template of each GEMS (see C15, ).
The high-redshift comparison sample is dominated by the bright strongly lensed sub-millimeter galaxies from SPT (Spilker et al. 2014; Béthermin et al. 2018) and H-ATLAS surveys (Oteo et al. 2017; Yang 2017),151515HCN and HCO+ data for NCv1.143 and G09v1.97 are taken from C. Yang’s PhD thesis (Yang 2017) available at https://tel.archives-ouvertes.fr/tel-01661478/document in addition to the Cosmic Eyelash (Danielson et al. 2011), and spans . The published line luminosities were converted to and , and corrected for the magnification factors listed in the corresponding papers (for the SPT stack we used the average over the sample). In addition, we added the Cloverleaf at , the only high-redshift quasar with high-density tracer molecules detected for –3 (Riechers et al. 2011). The GEMS fall on the upper envelope of luminosities measured in these high-redshift sources, close to H-ATLAS strong lenses.
In Fig. 9, we set PLCK_G092.5+42.9, PLCK_G145.2+ 50.9, and PLCK_G244.8+54.9 (corrected for from C18) relative to extrapolations of relations for nearby galaxies. Firstly, the GEMS are compared to relations from Zhang et al. (2014) drawn from –3 line detections in the central regions of diverse nearby galaxies, from normal blue star-forming galaxies to starbursts and ULIRGs, including a fraction of sources with significant AGN contribution. Secondly, we juxtapose the scaling relations in the central regions of nearby star-forming galaxies at 0.2–1.0 kpc resolution from the MALATANG survey (also for HCN(4–3) and HCO+(4–3), Tan et al. 2018). For HCO+, Tan et al. (2018) find good agreement with lower resolution observations, both at low and high redshift, but for HCN, they find significantly lower, sublinear slopes (see Fig. 9).
The GEMS fall near the best-fitting relations from Zhang et al. (2014), and PLCK_G244.8+54.9 is fully consistent with their 1 scatter. However, upper limits of 2.1 and for PLCK_G092.5+42.9 and PLCK_G145.2+50.9, respectively, suggest a significant deficit of HCN(4–3) emission compared to expectations from the local Universe. Interestingly, we found minor, but non-zero AGN contributions to dust heating for these two GEMS in C15. Correcting for this possible contribution and using purely star-formation-driven would bring these points closer to the low-redshift relation. If not intrinsic, this HCN deficit in PLCK_G092.5+42.9 and PLCK_G145.2+50.9 could well be due to differences in between Galactic environments and more extreme starbursts (see, e.g., Papadopoulos et al. 2014). The relation of Tan et al. (2018) better reproduces the elevated HCN line luminosity in the Cosmic Eyelash (Danielson et al. 2011), but not the position of the GEMS, probably because it is drawn from less active galactic regions covering a smaller range in .
The three GEMS fall below the best-fit relation, near the two H-ATLAS sources of Yang (2017). These sources and other SMGs suggest there could be a trend towards lower values of log()/log() for the brightest high-redshift galaxies. Offsets for the GEMS even exceed the 1 scatter of the Zhang et al. (2014) relation when replacing the values in Fig. 9 by purely star-formation-driven . This suggests that the GEMS favor slightly lower slopes than from Zhang et al. (2014). Although we could not rule out radiative excitation via IR pumping or mechanical heating in PLCK_G244+54.9 and PLCK_G145.2+50.9 in Sect. 4.3, it is also possible that elevated traces variations in the degree of ionization of molecular gas at high-redshift. HCO+ abundances depend on the formation of H and the abundance of free electrons in dense cloud cores, which are mainly affected by cosmic-ray ionization (Papadopoulos 2007). Enhanced fields should in principle increase the abundance of free electrons and reduce the abundance of HCO+ molecules. Hence, Fig. 9 could possibly indicate lower cosmic-ray fields than expected in highly star-forming environments as in the GEMS.
In summary, given the larger scatter of low-redshift relations and uncertainties in interpreting HCO+ emission, the GEMS are consistent with a unique dense-gas star-formation law, suggesting that their extreme star-formation rates are primarily driven by massive reservoirs of dense gas. We did not attempt to characterize since this relation remains hardly constrained at low redshift and it would be affected by uncertainties in deblending HNC(5–4) and CN(4–3) in the GEMS on local and global scales.
5.2 The dense-gas fractions
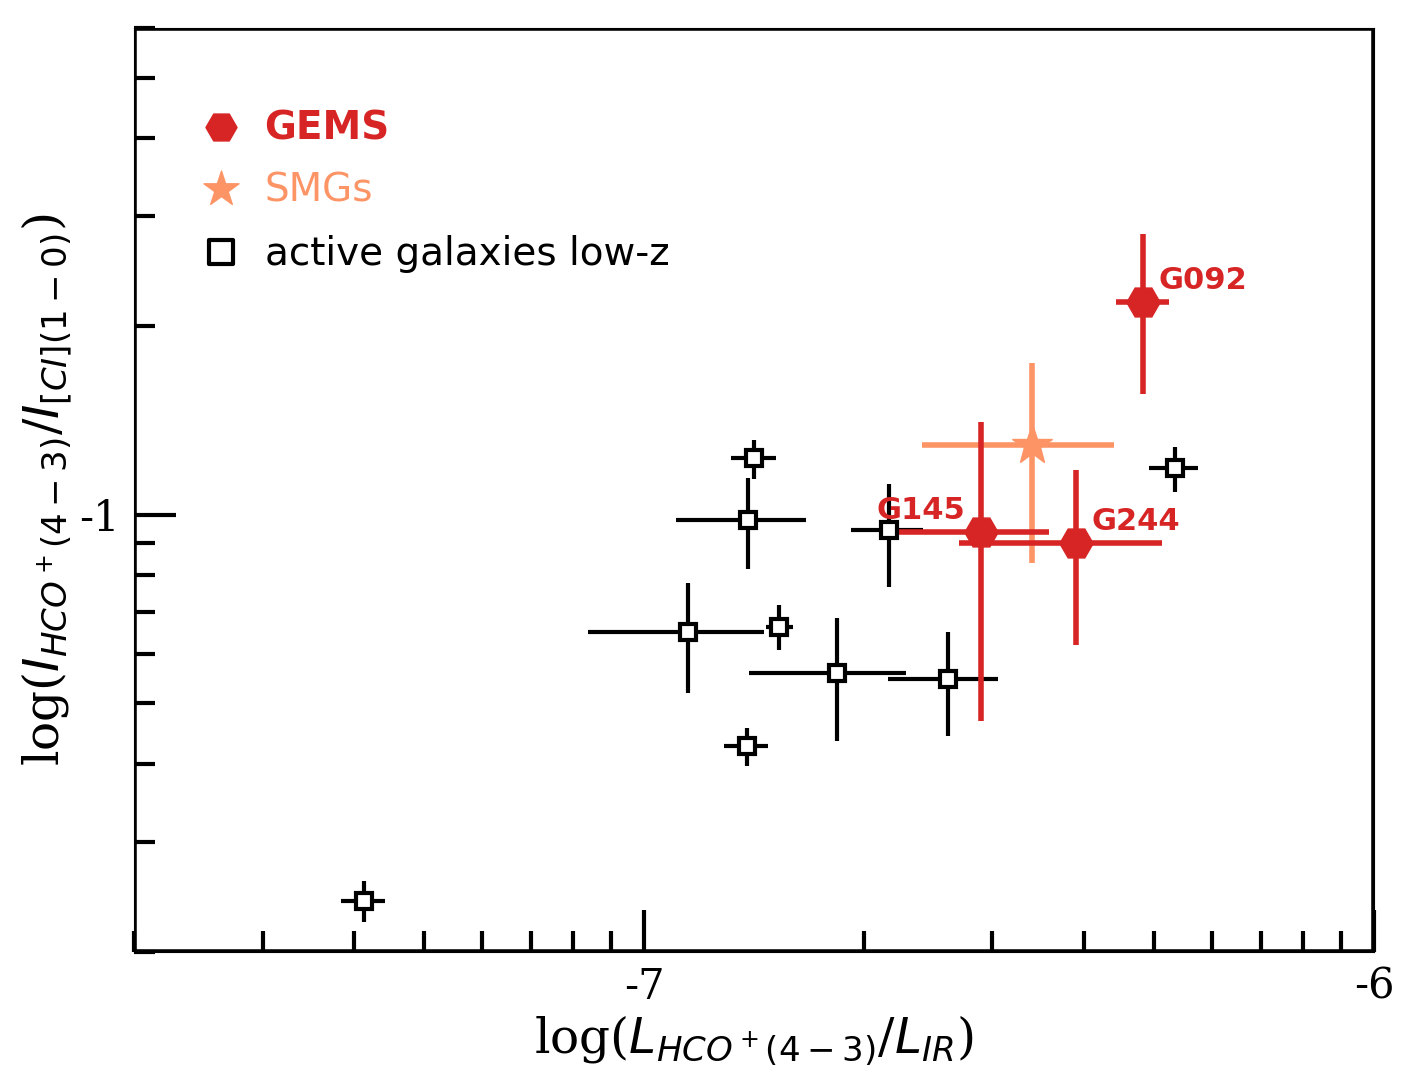
An increase of the mass fraction of gas in the dense phase has been previously invoked to explain the outstanding star-formation activities of high-redshift starbursts such as the GEMS (Daddi et al. 2010a). To study the evolution of this fraction at high redshift, we use the ratios of mid- dense-gas emission lines from the current analysis to CO(1–0) from Harrington et al. (2018) or [C i](1–0) from N19. Molecular gas masses derived from these two emission lines in PLCK_G092.5+42.9, PLCK_G145.2+50.9, and PLCK_G244.8+54.9 are roughly consistent with each other and suggest that these are two reliable tracers of the bulk of the gas reservoirs in the GEMS (\al@canameras18b,nesvadba19; \al@canameras18b,nesvadba19). Directly using the –3 or –4 emission lines of HCN and HCO+ allows us to compare their line ratios to CO(1–0) and [C i](1–0) with those obtained in low-redshift active galaxies for the same transitions; this should be independent of the conversion factors to the ground rotational levels, which are not well constrained by our LVG models (see Sect. 4.2 and the range of acceptable models in Fig 7). These modeling uncertainties and the subthermal excitation of HCN and HCO+ at mid- prevent us from estimating dense-gas masses from extrapolations to –0, as usually done for local ULIRGs (e.g., Gao & Solomon 2004b); however, we can still infer valuable diagnostics on the dense-gas fractions in the GEMS.
The line-intensity ratios are summarized in Table 8. For PLCK_G244.8+54.9, we used the average [C i](2–1) to [C i](1–0) ratio of 0.86 in three other GEMS from N19 to predict the [C i](1–0) line flux. For PLCK_G145.2+50.9, no CO(1–0) detection is available and we converted from mid- CO using the average ratio in the GEMS from C18. The flux ratios listed in Table 8 cover the range 0.05–0.50 and do not list uncertainties when the [C i] or CO line flux is converted from another transition. In Fig. 10, we plot the HCO+(4–3)/[C i](1–0) ratios, which are available both for the three GEMS (after converting from –4 to –3 for PLCK_G092.5+42.9 and PLCK_G145.2+50.9 as above), and for the large sample of low-redshift star-forming galaxies and (U)LIRGs of Zhang et al. (2014). This ratio is plotted as a function of , a proxy of the depletion time of the dense-gas reservoirs.
The line-intensity ratios in the GEMS fall near the upper range of values in local LIRGs, taken from the HCO+(4–3) and [C i](1–0) line detections from Zhang et al. (2014) and Rosenberg et al. (2015), and near the stack of SPT lensed SMGs from Spilker et al. (2014). As expected, such ratios between dense and total gas tracers are 1–2 orders of magnitude higher than in more gradually star-forming environments in the local Universe (see comparison with Tan et al. 2018, in CO(1–0)). Provided that the GEMS and their most active low-redshift equivalents have comparable HCO+ excitations, as already suggested by our analysis of PLCK_G244.8+54.9 in Sect. 4.2, and that HCO+/[C i] is free of other systematics, obtaining similar ratios in Fig. 10 rules out very different dense-gas budgets in these two populations. Consequently, the dense-gas fraction in galaxies hosting the most violent starburst episodes seems to have moderately evolved between and , despite much higher global gas fractions and local gas-mass surface densities at high redshift. Measurements of a few other high-redshift SMGs (Oteo et al. 2017; Béthermin et al. 2018) have led to marginally higher ratios, insufficient to establish a systematic difference. Finding important but not outstanding dense-gas reservoirs in the GEMS could indicate they host GMC-like environments, over larger regions than the very compact nuclear cores of low-redshift galaxies (e.g., 10%, Bemis & Wilson 2019). This scenario is entirely consistent with the similar spatial distributions of HNC(5–4) gas reservoirs and less dense, CO-bright reservoirs in PLCK_G244.8+54.9 (Fig. 4). Further tests with a thorough analysis of local line ratios over clump and intraclump regions in the GEMS would be beneficial, but are beyond the scope of this paper.
In the local Universe, the dense-gas depletion time shows little variation over a large range in , for galaxies on global (Gao & Solomon 2004a) and sub-kpc scales (Tan et al. 2018), and for Milky Way GMCs (Wu et al. 2005). In theoretical models, a range of processes are usually invoked for interpreting the positions of sources in the Schmidt-Kennicutt diagram, which do not require intrinsic variations in the dense-gas depletion time (Krumholz et al. 2012). Moreover, concerning the GEMS, our high-resolution study of the star-formation law and cloud stability in PLCK_G244.8+54.9 (C17a) did not show any evidence for an increase in the local SFE as traced by CO. The lack of significant horizontal offset for the GEMS in Fig. 10 is not, therefore, surprising and further suggests that the SFE in the dense-gas phase remains roughly constant over cosmic history. These conclusions would remain globally unchanged for HCN and CO(1–0), despite small differences in the relative positions of the three individual GEMS. Finally, we note that Fig. 10 is consistent with the lack of a significant correlation between the dense-gas fraction and the dense-gas depletion time in local populations of star-forming galaxies (Tan et al. 2018, also for mid- HCN, HCO+ levels).
6 Conclusions
In this paper, we use the high-density tracer molecules HCN, HCO+, and HNC to characterize the ISM phase closely associated with on-going star formation in three of the brightest dusty starburst galaxies at –3.5, part of Planck’s Dusty GEMS sample. Our detections of ten mid- lines in these sources with ALMA, NOEMA, and IRAM-30m/EMIR, together with additional upper flux limits, significantly extend current diagnostics of dense molecular cloud cores at high redshift.
With ALMA, we resolve HNC(5–4) line emission down to 0.1″ in PLCK_G244.8+54.9, which allows us to infer unprecedented constraints on the spatial distribution of dense molecular gas at high redshift and to rule out a major impact of differential lensing between HNC and mid- CO in this extreme starburst. The similarity between these line morphologies in PLCK_G244.8+54.9, and between spatially-integrated profiles of HCN, HCO+, HNC, [C i], and mid- CO lines in the three sources suggests comparable distributions of very dense and more diffuse gas reservoirs in starbursts, at least over the regions that are most strongly magnified by gravitational lensing.
In two sources, PLCK_G092.5+42.9 and PLCK_G244.8+ 54.9, we obtain a good match between profiles of dense-gas and mid- to high- CO lines. The lowest dense-gas line fluxes and the most significant differences in line profiles arise in the third source, PLCK_G145.2+50.8, although at lower S/N. This suggests that dense and more diffuse gas are better mixed in the first two GEMS than in PLCK_G145.2+50.8, where our line detections may probe fewer dense cores and more intraclump gas.
The measured line ratios of and in the GEMS are akin to nearby ULIRGs and can be used to characterize the gas-heating mechanisms. Despite unavoidable degeneracies in theoretical models, similar diagnostics in Milky Way GMCs and nearby galaxies show consistency with PDRs in star-formation-dominated environments. The measured ratios do not require us to invoke significant mechanical heating or AGN feedback in the GEMS. Moreover, the dense-gas to CO line ratios differ in our sample. These variations highlight the importance of constraining the excitation of high density tracer molecules to improve our understanding on the gas phase directly fueling star formation.
The extraordinary brightness of PLCK_G244.8+54.9 offers a unique opportunity to characterize the HCN, HCO+, and HNC excitation from to 6 lines covering the turnover in the SLEDs. Radiative transfer LVG models of integrated line emission show that these transitions arise from a high-density phase with H2 number densities –, although important degeneracies prevent us measuring the exact ISM conditions in these environments. Mid- to –0 dense-gas excitation in PLCK_G244.8+54.9 is not very different from the intense local ULIRG Arp 220, which could indicate similar ISM structures and density distributions, as already proposed for other high-redshift SMGs.
The three GEMS are consistent with extrapolations of dense-gas star-formation laws derived in the nearby Universe, adding further evidence that the exceptional star-formation rates observed in the most active galaxies at are a consequence of their massive reservoirs of dense gas. This extends diagnostics of relations beyond the luminosities of previous high-redshift samples. Moreover, dense-gas-mass fractions in the GEMS inferred from mid- dense-gas emission lines to [C i](1–0) are not exceptional, but are close to other lensed SMGs and near the upper envelope of local ULIRGs. Hence, despite the higher global gas fractions and local gas-mass surface densities observed at high redshift, the dense-gas budget of rapidly star-forming galaxies seems to have evolved little between and . Our results do not suggest important variations in the dense-gas depletion times of these populations, as also predicted by theoretical models of star formation, and consistent with the local ISM conditions in PLCK_G244.8+54.9.
This study highlights the need for pursuing investigations of the dense-gas properties and star-formation law near the peak of the cosmic star-formation history. In particular, further observations of HCN, HCO+, and HNC lines are needed to determine which molecule best traces the overall dense-gas contents of DSFGs at high redshift and to derive precise diagnostics of the densities, temperatures, and chemical abundances in cloud cores that are directly fueling star formation. Extending the coverage of dense-gas SLEDs and probing larger samples will be highly valuable and achievable with ALMA for the brightest –4 galaxies.
Acknowledgements
We would like to thank the anonymous referee for comments that helped improve the paper. We thank A. Omont for useful discussions and feedback about this work, and the staff at the IRAM 30-m telescope for their excellent support during observations. C.Y. acknowledges support from an ESO Fellowship. This paper is based on observations carried out under project number 108–14 with the IRAM 30-m telescope, and project S15CH with the IRAM NOEMA Interferometer. IRAM is supported by INSU/CNRS (France), MPG (Germany), and IGN (Spain). This paper makes use of the following ALMA data: ADS/JAO.ALMA#2015.1.01518.S. ALMA is a partnership of ESO (representing its member states), NSF (USA) and NINS (Japan), together with NRC (Canada), NSC and ASIAA (Taiwan), and KASI (Republic of Korea), in cooperation with the Republic of Chile. The Joint ALMA Observatory is operated by ESO, AUI/NRAO and NAOJ.
References
- Aalto et al. (1995) Aalto, S., Booth, R. S., Black, J. H., & Johansson, L. E. B. 1995, A&A, 300, 369
- Aalto et al. (2007) Aalto, S., Spaans, M., Wiedner, M. C., & Hüttemeister, S. 2007, A&A, 464, 193
- Aladro et al. (2018) Aladro, R., König, S., Aalto, S., et al. 2018, A&A, 617, A20
- Aladro et al. (2015) Aladro, R., Martín, S., Riquelme, D., et al. 2015, A&A, 579, A101
- Baan et al. (2008) Baan, W. A., Henkel, C., Loenen, A. F., Baudry, A., & Wiklind, T. 2008, A&A, 477, 747
- Bemis & Wilson (2019) Bemis, A. & Wilson, C. D. 2019, AJ, 157, 131
- Bergin et al. (1996) Bergin, E. A., Snell, R. L., & Goldsmith, P. F. 1996, ApJ, 460, 343
- Béthermin et al. (2018) Béthermin, M., Greve, T. R., De Breuck, C., et al. 2018, A&A, 620, A115
- Boger & Sternberg (2005) Boger, G. I. & Sternberg, A. 2005, ApJ, 632, 302
- Braine et al. (2017) Braine, J., Shimajiri, Y., André, P., et al. 2017, A&A, 597, A44
- Bussmann et al. (2008) Bussmann, R. S., Narayanan, D., Shirley, Y. L., et al. 2008, ApJ, 681, L73
- Cañameras et al. (2017a) Cañameras, R., Nesvadba, N., Kneissl, R., et al. 2017a, A&A, 604, A117
- Cañameras et al. (2015) Cañameras, R., Nesvadba, N. P. H., Guery, D., et al. 2015, A&A, 581, A105
- Cañameras et al. (2017b) Cañameras, R., Nesvadba, N. P. H., Kneissl, R., et al. 2017b, A&A, 600, L3
- Cañameras et al. (2018) Cañameras, R., Yang, C., Nesvadba, N. P. H., et al. 2018, A&A, 620, A61 (C18)
- Carilli & Walter (2013) Carilli, C. L. & Walter, F. 2013, ARA&A, 51, 105
- Chen et al. (2017) Chen, H., Braine, J., Gao, Y., Koda, J., & Gu, Q. 2017, ApJ, 836, 101
- Costagliola et al. (2011) Costagliola, F., Aalto, S., Rodriguez, M. I., et al. 2011, A&A, 528, A30
- Daddi et al. (2010a) Daddi, E., Bournaud, F., Walter, F., et al. 2010a, ApJ, 713, 686
- Daddi et al. (2010b) Daddi, E., Elbaz, D., Walter, F., et al. 2010b, ApJ, 714, L118
- Danielson et al. (2011) Danielson, A. L. R., Swinbank, A. M., Smail, I., et al. 2011, MNRAS, 410, 1687
- Dumouchel et al. (2010) Dumouchel, F., Faure, A., & Lique, F. 2010, MNRAS, 406, 2488
- Evans et al. (2020) Evans, Neal J., I., Kim, K.-T., Wu, J., et al. 2020, ApJ, 894, 103
- Flower (1999) Flower, D. R. 1999, MNRAS, 305, 651
- Gallagher et al. (2018) Gallagher, M. J., Leroy, A. K., Bigiel, F., et al. 2018, ApJ, 868, L38
- Gao et al. (2007) Gao, Y., Carilli, C. L., Solomon, P. M., & Vanden Bout, P. A. 2007, ApJ, 660, L93
- Gao & Solomon (2004a) Gao, Y. & Solomon, P. M. 2004a, ApJS, 152, 63
- Gao & Solomon (2004b) Gao, Y. & Solomon, P. M. 2004b, ApJ, 606, 271
- García-Burillo et al. (2014) García-Burillo, S., Combes, F., Usero, A., et al. 2014, A&A, 567, A125
- García-Burillo et al. (2012) García-Burillo, S., Usero, A., Alonso-Herrero, A., et al. 2012, A&A, 539, A8
- Genzel et al. (2010) Genzel, R., Tacconi, L. J., Gracia-Carpio, J., et al. 2010, MNRAS, 407, 2091
- Gildas Team (2013) Gildas Team. 2013, GILDAS: Grenoble Image and Line Data Analysis Software
- Graciá-Carpio et al. (2008) Graciá-Carpio, J., García-Burillo, S., Planesas, P., Fuente, A., & Usero, A. 2008, A&A, 479, 703
- Greve et al. (2006) Greve, T. R., Hainline, L. J., Blain, A. W., et al. 2006, AJ, 132, 1938
- Greve et al. (2014) Greve, T. R., Leonidaki, I., Xilouris, E. M., et al. 2014, ApJ, 794, 142
- Greve et al. (2009) Greve, T. R., Papadopoulos, P. P., Gao, Y., & Radford, S. J. E. 2009, ApJ, 692, 1432
- Guélin et al. (2007) Guélin, M., Salomé, P., Neri, R., et al. 2007, A&A, 462, L45
- Hacar et al. (2020) Hacar, A., Bosman, A. D., & van Dishoeck, E. F. 2020, A&A, 635, A4
- Harrington et al. (2018) Harrington, K. C., Yun, M. S., Magnelli, B., et al. 2018, MNRAS, 474, 3866
- Helfer & Blitz (1997) Helfer, T. T. & Blitz, L. 1997, ApJ, 478, 233
- Hezaveh et al. (2012) Hezaveh, Y. D., Marrone, D. P., & Holder, G. P. 2012, ApJ, 761, 20
- Hirota et al. (1998) Hirota, T., Yamamoto, S., Mikami, H., & Ohishi, M. 1998, ApJ, 503, 717
- Imanishi & Nakanishi (2014) Imanishi, M. & Nakanishi, K. 2014, AJ, 148, 9
- Imanishi et al. (2016) Imanishi, M., Nakanishi, K., & Izumi, T. 2016, AJ, 152, 218
- Imanishi et al. (2019) Imanishi, M., Nakanishi, K., & Izumi, T. 2019, ApJS, 241, 19
- Imanishi et al. (2007) Imanishi, M., Nakanishi, K., Tamura, Y., Oi, N., & Kohno, K. 2007, AJ, 134, 2366
- Imanishi et al. (2010) Imanishi, M., Nakanishi, K., Yamada, M., Tamura, Y., & Kohno, K. 2010, PASJ, 62, 201
- Izumi et al. (2016) Izumi, T., Kohno, K., Aalto, S., et al. 2016, ApJ, 818, 42
- Jiménez-Donaire et al. (2019) Jiménez-Donaire, M. J., Bigiel, F., Leroy, A. K., et al. 2019, ApJ, 880, 127
- Jullo et al. (2007) Jullo, E., Kneib, J. P., Limousin, M., et al. 2007, New Journal of Physics, 9, 447
- Juneau et al. (2009) Juneau, S., Narayanan, D. T., Moustakas, J., et al. 2009, ApJ, 707, 1217
- Kauffmann et al. (2017) Kauffmann, J., Goldsmith, P. F., Melnick, G., et al. 2017, A&A, 605, L5
- Kazandjian et al. (2015) Kazandjian, M. V., Meijerink, R., Pelupessy, I., Israel, F. P., & Spaans, M. 2015, A&A, 574, A127
- Kennicutt (1998) Kennicutt, Robert C., J. 1998, ApJ, 498, 541
- König et al. (2018) König, S., Aalto, S., Muller, S., et al. 2018, A&A, 615, A122
- Krips et al. (2008) Krips, M., Neri, R., García-Burillo, S., et al. 2008, ApJ, 677, 262
- Krumholz et al. (2012) Krumholz, M. R., Dekel, A., & McKee, C. F. 2012, ApJ, 745, 69
- Krumholz & McKee (2005) Krumholz, M. R. & McKee, C. F. 2005, ApJ, 630, 250
- Krumholz & Tan (2007) Krumholz, M. R. & Tan, J. C. 2007, ApJ, 654, 304
- Krumholz & Thompson (2007) Krumholz, M. R. & Thompson, T. A. 2007, ApJ, 669, 289
- Liu et al. (2016) Liu, T., Kim, K.-T., Yoo, H., et al. 2016, ApJ, 829, 59
- Loenen et al. (2008) Loenen, A. F., Spaans, M., Baan, W. A., & Meijerink, R. 2008, A&A, 488, L5
- McMullin et al. (2007) McMullin, J. P., Waters, B., Schiebel, D., Young, W., & Golap, K. 2007, Astronomical Society of the Pacific Conference Series, Vol. 376, CASA Architecture and Applications, ed. R. A. Shaw, F. Hill, & D. J. Bell, 127
- Meijerink & Spaans (2005) Meijerink, R. & Spaans, M. 2005, A&A, 436, 397
- Meijerink et al. (2007) Meijerink, R., Spaans, M., & Israel, F. P. 2007, A&A, 461, 793
- Michiyama et al. (2018) Michiyama, T., Iono, D., Sliwa, K., et al. 2018, ApJ, 868, 95
- Mills et al. (2013) Mills, E. A. C., Güsten, R., Requena-Torres, M. A., & Morris, M. R. 2013, ApJ, 779, 47
- Nesvadba et al. (2019) Nesvadba, N. P. H., Cañameras, R., Kneissl, R., et al. 2019, A&A, 624, A23 (N19)
- Nguyen-Q-Rieu et al. (1992) Nguyen-Q-Rieu, Jackson, J. M., Henkel, C., Truong, B., & Mauersberger, R. 1992, ApJ, 399, 521
- Omont (2007) Omont, A. 2007, Reports on Progress in Physics, 70, 1099
- Onus et al. (2018) Onus, A., Krumholz, M. R., & Federrath, C. 2018, MNRAS, 479, 1702
- Oteo et al. (2017) Oteo, I., Zhang, Z.-Y., Yang, C., et al. 2017, ApJ, 850, 170
- Papadopoulos (2007) Papadopoulos, P. P. 2007, ApJ, 656, 792
- Papadopoulos et al. (2014) Papadopoulos, P. P., Zhang, Z.-Y., Xilouris, E. M., et al. 2014, ApJ, 788, 153
- Planck Collaboration XIII (2016) Planck Collaboration XIII. 2016, A&A, 594, A13
- Privon et al. (2015) Privon, G. C., Herrero-Illana, R., Evans, A. S., et al. 2015, ApJ, 814, 39
- Riechers et al. (2011) Riechers, D. A., Walter, F., Carilli, C. L., et al. 2011, ApJ, 726, 50
- Riechers et al. (2006) Riechers, D. A., Walter, F., Carilli, C. L., et al. 2006, ApJ, 645, L13
- Riechers et al. (2010) Riechers, D. A., Weiß, A., Walter, F., & Wagg, J. 2010, ApJ, 725, 1032
- Rosenberg et al. (2015) Rosenberg, M. J. F., van der Werf, P. P., Aalto, S., et al. 2015, ApJ, 801, 72
- Saito et al. (2018) Saito, T., Iono, D., Espada, D., et al. 2018, ApJ, 863, 129
- Schirm et al. (2016) Schirm, M. R. P., Wilson, C. D., Madden, S. C., & Clements, D. L. 2016, ApJ, 823, 87
- Scoville et al. (2017) Scoville, N., Murchikova, L., Walter, F., et al. 2017, ApJ, 836, 66
- Scoville et al. (2015) Scoville, N., Sheth, K., Walter, F., et al. 2015, ApJ, 800, 70
- Serjeant (2012) Serjeant, S. 2012, MNRAS, 424, 2429
- Solomon et al. (2003) Solomon, P., Vanden Bout, P., Carilli, C., & Guelin, M. 2003, Nature, 426, 636
- Solomon et al. (1997) Solomon, P. M., Downes, D., Radford, S. J. E., & Barrett, J. W. 1997, ApJ, 478, 144
- Spilker et al. (2014) Spilker, J. S., Marrone, D. P., Aguirre, J. E., et al. 2014, ApJ, 785, 149
- Stephens et al. (2016) Stephens, I. W., Jackson, J. M., Whitaker, J. S., et al. 2016, ApJ, 824, 29
- Tafalla et al. (2010) Tafalla, M., Santiago-García, J., Hacar, A., & Bachiller, R. 2010, A&A, 522, A91
- Tan et al. (2018) Tan, Q.-H., Gao, Y., Zhang, Z.-Y., et al. 2018, ApJ, 860, 165
- Thompson et al. (2005) Thompson, T. A., Quataert, E., & Murray, N. 2005, ApJ, 630, 167
- van der Tak et al. (2007) van der Tak, F. F. S., Black, J. H., Schöier, F. L., Jansen, D. J., & van Dishoeck, E. F. 2007, A&A, 468, 627
- Walter et al. (2017) Walter, F., Bolatto, A. D., Leroy, A. K., et al. 2017, ApJ, 835, 265
- Wang et al. (2014) Wang, J., Nardini, E., Fabbiano, G., et al. 2014, ApJ, 781, 55
- Weiß et al. (2007) Weiß, A., Downes, D., Neri, R., et al. 2007, A&A, 467, 955
- Wilner et al. (1995) Wilner, D. J., Zhao, J. H., & Ho, P. T. P. 1995, ApJ, 453, L91
- Wilson et al. (2014) Wilson, C. D., Rangwala, N., Glenn, J., et al. 2014, ApJ, 789, L36
- Wilson et al. (2017) Wilson, D., Cooray, A., Nayyeri, H., et al. 2017, ApJ, 848, 30
- Wu et al. (2005) Wu, J., Evans, Neal J., I., Gao, Y., et al. 2005, ApJ, 635, L173
- Wu et al. (2010) Wu, J., Evans, Neal J., I., Shirley, Y. L., & Knez, C. 2010, ApJS, 188, 313
- Yang (2017) Yang, C. 2017, PhD thesis, Institut d’Astrophysique Spatiale, CNRS, Univ. Paris-Sud, Université Paris-Saclay, Bât. 121, 91405 Orsay Cedex, France; Purple Mountain Observatory, Chinese Academy of Sciences, Nanjing 210008, PR China
- Yang et al. (2019) Yang, C., Gavazzi, R., Beelen, A., et al. 2019, A&A, 624, A138
- Yang et al. (2020) Yang, C., González-Alfonso, E., Omont, A., et al. 2020, A&A, 634, L3
- Yang et al. (2016) Yang, C., Omont, A., Beelen, A., et al. 2016, A&A, 595, A80
- Young et al. (2011) Young, L. M., Bureau, M., Davis, T. A., et al. 2011, MNRAS, 414, 940
- Zhang et al. (2014) Zhang, Z.-Y., Gao, Y., Henkel, C., et al. 2014, ApJ, 784, L31
Appendix A Stacking analysis of EMIR spectra
We stacked EMIR spectra of each individual HCN, HCO+, and HNC transition in order to probe the average dense-gas properties and excitation over the sample, at a level below what is possible for individual galaxies. The eight GEMS listed in Table 1 were included, with continuum-subtracted spectra either from the WILMA or FTS backends. We performed the stacking following the method described in Spilker et al. (2014) and Wilson et al. (2017). Spectra were shifted to a common redshift of according to the best source redshift from CO (C18) because the dense-gas line redshifts are poorly constrained in most cases. Although using common redshifts might be problematic in the presence of separate components with strong velocity offsets, this assumption seems to hold true for dense-gas lines with centroids fitted independently (see Table 6). We then rescaled the flux densities per spectral channel of each source to the values they would have at using Eq. 1 from Spilker et al. (2014). For each transition, we created a reference velocity grid covering to and with resolution. The individual EMIR spectra were smoothed and interpolated to this new grid.
We first created mean stacks by computing the average flux density in each velocity bin. Between two and four GEMS were used in the stacks, depending on the transition, with a uniform coverage over the complete velocity range. The resulting baseline rms varies from 1.5 to 2.5 mJy per wide channel. We only obtained robust () detections of HCO+(5–4) and HCO+(6–5), with fluxes of about 1.6 and , respectively. PLCK_G092.5+42.9, PLCK_G145.2+50.9, and PLCK_G045.1+61.1 were used to stack HCO+(5–4) and, for the –5 transition, we combined PLCK_G165.7+67.0 and PLCK_G244.8+54.9. Computing median stacks for the same transitions provided fluxes and upper limits consistent with those from the mean stacks, showing that the previous results were not dominated by a few outliers. In addition, the average line properties over the sample are better described by a weighted mean stack, where individual spectra are scaled to a common luminosity. We normalized the spectra to the average total infrared luminosity of the GEMS using the source far-infrared luminosities obtained from modified blackbody fits in C15 (not corrected for lensing magnification), and created the weighted mean stacks. The results and number of detections are stable, except a 30% lower HCO+(5–4) line flux than in the mean stack. Given the low fraction of lines detected in these three versions of the stacks, we rather focus our analysis on line emission from the three brightest individual sources (PLCK_G092.5+42.9, PLCK_G145.2+50.9, and PLCK_G244.8+54.9).