The best place and time to live in the Milky Way
Abstract
Context. Counted among the most powerful cosmic events, supernovae (SNe) and ray bursts (GRBs) can be highly disruptive for life: Their radiation can be harmful for biota or induce extinction by removing most of the protective atmospheric ozone layer from terrestrial planets (TPs). Nearby high-energy transient astrophysical events have been proposed as possible triggers of mass extinctions on Earth.
Aims. We assess the habitability of the Milky Way (MW) throughout its cosmic history against potentially disruptive astrophysical transients with the aim of identifying the safest places and epochs within our Galaxy. We also test the hypothesis that one long GRB played a leading role in the late Ordovician mass-extinction event ( Myr ago).
Methods. We characterised the habitability of the MW throughout its cosmic history as a function of galactocentric distance of TPs. We estimated the dangerous effects of transient astrophysical events (long and short GRBs and SNe) with a model that connects their rate to the specific star formation and metallicity evolution within the Galaxy throughout its cosmic history. Our model also accounts for the probability that TPs form around FGK and M stars.
Results. Until about six billion years ago, the outskirts of the Galaxy were the safest places to live, despite the relatively low density of TPs. In the last about four billion years, regions between 2 and 8 kpc from the center, which had a higher density of TPs, became the best places for a relatively safer biotic life growth. We confirm the hypothesis that one long GRB played a leading role in the late Ordovician mass-extinction event. In the last 500 Myr, the safest neighborhood in the Galaxy was a region at a distance of 2 to 8 kpc from the Galactic center, whereas the MW outskirts were sterilized by two to five long GRBs.
Key Words.:
Gamma-ray-burst: general, Galaxy: evolution, Astrobiology1 Introduction
One of the primary goals of exoplanetary research is to find habitable worlds. In order to assess the very notion of ”habitable”, we must rely on our understanding of the reasons for the presence and absence of lifeforms in the Solar System. Several factors determined the appearance and development of life on planet Earth. In addition to particular intrinsic properties of the planet (e.g., geology and magnetic field) and solar characteristics (e.g., spectrum and irradiation), it is understood that a key requirement for the development of life on Earth is the presence of liquid water on the planetary surface. Potentially habitable exoplanets are identified based on their location within the circumstellar habitable zone (CHZ; e.g., Kasting et al., 1993; Kopparapu et al., 2013).
In addition to local factors, planetary habitability could also be affected by the galactic environment, for example, by astrophysical events outside the Solar System that can irradiate the planet. As many studies suggest (e.g., Ruderman, 1974; Thorsett, 1995; Dar et al., 1998; Gehrels et al., 2003; Melott & Thomas, 2011; Svensmark, 2012), high-energy transients such as supernovae (SNe) and gamma-ray bursts (GRBs) could be life-threatening and a potential cause of mass extinctions. A GRB, with a typical isotropic equivalent energy of erg located within 1 kpc from the Earth, would irradiate its atmosphere with a -ray (i.e., keV–MeV) fluence 100 kJ m-2 ( erg cm-2). This level of irradiation can produce stratospheric nitrogen compounds, which quickly destroy 90% of the ozone layer on average (Thomas et al., 2005a). As a first consequence, the higher solar UVB radiation that would reach the surface of Earth would be harmful to life. Intense UVB radiation could also be lethal to surface marine life such as phytoplankton, which is crucial for the food chain and oxygen production. Moreover, the opacity of the NO2 produced in the stratosphere would reduce the visible sunlight that reaches the surface, causing a global cooling. As argued by Herrmann & Patzkowsky (2002) and Herrmann et al. (2003), the late Ordovician mass-extinction event (445 Myr ago), which is one of the five great mass extinctions on Earth, has some climatic signatures that can be interpreted by invoking an extra-terrestrial cause such as a nearby GRB (Melott et al., 2005).
The lethality of transient astrophysical events depends on their energy released as high-energy radiation and their occurrence rate in the Galaxy: more powerful events can be lethal for a planet over larger distances, while a high event rate can also reduce the ability of the planet to recover from the environmental effects induced by the radiation of the event. Piran & Jimenez (2014) and Li & Zhang (2015) consistently found that long-duration GRBs (with an observed duration 2 s; LGRBs hereafter) are the most dangerous astrophysical events for the Earth, even more so than short-duration GRBs (lasting s; SGRBs hereafter) and SNe. This is mainly due to the high energy ergs (isotropic equivalent) released by LGRBs, which compared to SNe compensates for their lower intrinsic rate ( yr-1 per galaxy according to Wanderman & Piran 2010). In particular, the probability is non-neglibile (50% according to Piran & Jimenez 2014) that in the last 500 Myr the Earth could have been illuminated by one long lethal GRB (precisely 0.93 according to Li & Zhang 2015).
The rate of astrophysical events is linked to the properties (and their variation with cosmic time) of the environment in which they occur. The rate of LGRBs, which is connected to the end life of massive stars (e.g., Woosley, 1993), is expected to be proportional to the efficiency of converting gas into stars (i.e., the star formation rate, SFR). However, their progenitors are thought to have a low metallicity to conserve the angular momentum required to efficiently launch the jet (Woosley & Heger, 2006; Yoon et al., 2006). This argument roughly agrees with the observed preference of LGRB to occur in relatively low-metallicity host galaxies (e.g., Japelj et al., 2016; Palmerio et al., 2019). When the evolution of the rate of LGRBs within the Galaxy is computed, the possible evolution of the SFR and the gas metallicity with cosmic time and within the Galaxy therefore need to be accounted for.
The ever-increasing number of extrasolar planets (4330 at present) motivates the extension of these studies to the whole Galaxy. The outer regions of the MW appear to be the most favorable for preserving life (Piran & Jimenez, 2014; Li & Zhang, 2015; Vukotić et al., 2016) because the SFR is reduced. However, Piran & Jimenez (2014) and Li & Zhang (2015) scaled the cosmological rate of LGRBs in proportion to the stellar mass of the MW disk, assuming constant metallicity and a specific star formation rate (sSFR). In this work we account for the radial distribution and the inside-out evolution of metallicity and SFR within the Galaxy.
Gowanlock et al. (2011), Spitoni et al. (2014), and Vukotić et al. (2016) defined a Galactic habitable zone (GHZ) by considering only SNe as possible deleterious events and focused on TPs orbiting FGK stars. It is worth extending these studies by considering GRBs and M stars, which are the most powerful astrophysical events and the most abundant stellar population in the MW, respectively.
We examine the astrophysical constraints for life in the MW and for the first time consider all the most energetic transient events (SGRBs, LGRBs, and SNe). We link their rates to the sSFR within the Galaxy and to its variation with cosmic time through a semianalytical model describing the evolution of the MW. For LGRBs we consider the variation of the metallicity of the MW. Finally, with a similar method as was used by Spitoni et al. (2017), we account for the probability that TPs (also dependent upon metallicity) form around FGK and M stars (Zackrisson et al., 2016). Throughout the cosmic history of the MW we identify the safest (from an astrophysical perspective) locations. These are sites suitable for the presence of planets with long-lasting biospheres.
Our work is organized as follows. In §2 we present the methods for estimating the number of lethal events as a function of the position within the Galaxy and of the cosmic time. In §3 we present model assumptions and the model we adopted to compute the evolution of the star formation, metallicity, and planetary density within the MW. In §4 and §5 we present and discuss our results. In §6 we summarize our results. We adopt a CDM cosmological model with , and km s-1 Mpc-1.
2 Methods
2.1 Cosmic rate
For a generic population of astrophysical sources described by a function in the luminosity-redshift () space, the cosmic rate (number of events per unit comoving volume and time) at any cosmic epoch is
| (1) |
2.2 Scaling down to the Milky Way
In order to estimate the rate of a population of astrophysical sources within the MW, we rescaled its known cosmic rate at any cosmic epoch within the cosmological volume occupied by the Galaxy,
| (2) |
where V is the cosmological volume occupied by the MW at a given redshift, is the average stellar density as a function of redshift M⊙ Gpc-3 (Li & Zhang, 2015; Mortlock et al., 2015), and is the stellar mass of the evolving Milky Way (§3.2). is the probability that astrophysical sources (i.e., LGRB, SGRB, and SN) occur within the MW at a given cosmic epoch (the cosmic time is here represented as the redshift ). This probability depends on the cosmic evolution of the MW properties (e.g., sSFR and metallicity in the case of LGRBs), which can inhibit or favor the occurrence of the lethal transient sources under consideration.
2.3 Rate of lethal events within the MW
The fluence produced by astrophysical transients in a planetary atmosphere is the primary ingredient leading to possible lethal effects. Thomas et al. (2005a, b) estimated in a 2D atmospheric model that a –ray fluence of 10 kJ m-2 can on average induce a 68% depletion of the ozone layer at an altitude of 32 km on a timescale of a month. Higher fluences, for instance, 100 kJ m-2 and 1000 kJ m-2 , would produce depletions up to 91% and 98%, respectively. We consider a depletion of 91% of the ozone layer sufficient to produce mass extinctions (see also Thomas et al. 2005a, b; Li & Zhang 2015). We therefore define as astrophysical lethal events that are capable of illuminating a planetary atmosphere with a fluence (i.e., energy flux integrated over the event duration) F100 kJ/m2 (i.e., 108 erg cm2, Fc).
Given a population of astrophysical events, the lethal effect on a planet can be quantified by computing the rate of lethal events. At any cosmic time, the rate per unit time of lethal events (i.e., with a fluence ) for a planet at distance R from the Galactic center is
| (3) |
where (see §2.4) is the portion in mass of the Galaxy contained within the region where an event with energy E is lethal for a planet at R (i.e., the portion of the MW within a distance from ) and describes the probability that lethal events occur (i.e., with an energy and distance producing a fluence ) within the MW given its local properties. The integral is performed over the entire luminosity distribution.
2.4 Portion of the Galaxy
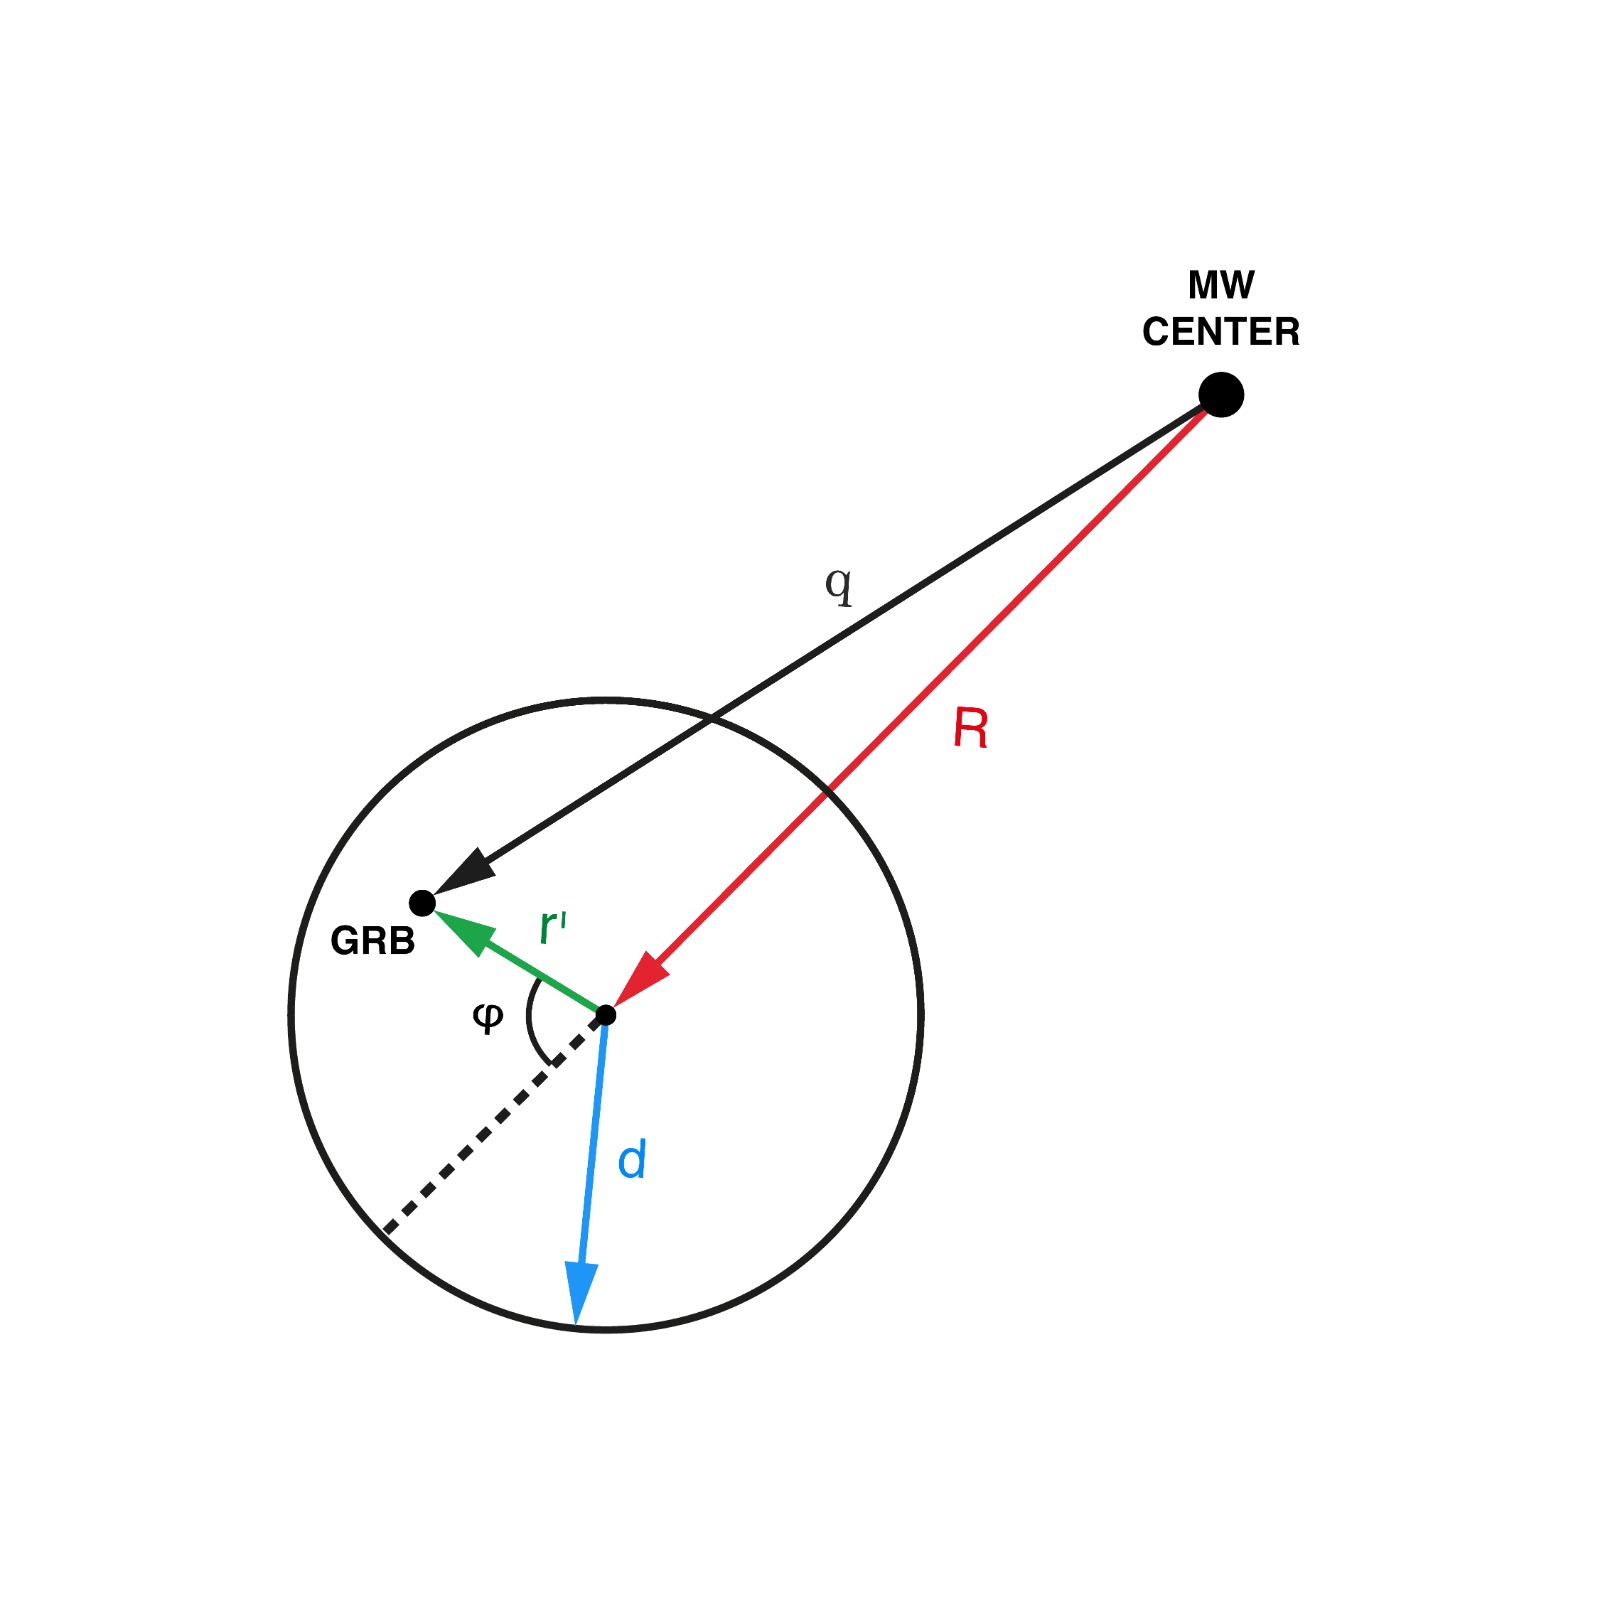
We define the hazard distance of an astrophysical event with energy as the (lethal) distance within which its fluence is higher than ,
| (4) |
Assuming that GRBs and SNe follow the stellar distribution within the Milky Way, at a given time t can be calculated by integrating the MW stellar surface density (see §3.5) within a distance from the position of the planet (),
| (5) |
We adopt a polar coordinate system (see Fig. 1), centered at the position at distance from the Galaxy center, to calculate ,
3 Model assumptions
For GRBs and SNe it is customary to factorize . Here describes the luminosity distribution of the event rate at , while the dimensionless function is its redshift evolution.
3.1 Luminosity function
We assume a broken power law for LGRBs (Wanderman & Piran, 2010; Salvaterra et al., 2012; Pescalli et al., 2016) and for SGRBs (Guetta & Piran, 2005; Wanderman & Piran, 2010; D’Avanzo et al., 2014; Ghirlanda et al., 2016), defined between and ,
| (6) |
where is the present-day (i.e., ) rate at the break luminosity . GRBs are jetted sources, thus only the GRB jets pointing at the planet can be harmful. Here is the observed rate (not corrected for collimation) and L is the isotropic equivalent luminosity (see §3.4 for details). n0 is the ratio between (i.e., the cosmological rate at z=0, Table 1) and the integral of with unit normalization. We assume that the LGRB and SGRB distributions have a characteristic duration centered on of 20s and 2s, respectively (Kouveliotou et al., 1993). The energy (necessary to calculate the fluence) is derived from the luminosity assuming that the burst with a duration has a triangular shape. This is a fairly good approximation for SGRBs but an oversemplification of the complexity of LGRB light curves. For long and short GRBs we adopt the parameter values reported in Table 1.
| [Gpc-3 yr-1] | [ergs s-1] | [ergs s-1] | [ergs s-1] | [s] | |||
| LGRB | 1.3 0.6 | 1.2 0.9 | 2.4 0.77 | 1052.5±0.2 | 1049 | 1054 | 20 |
| SGRB | 0.3 0.06 | 0.53 0.88 | 3.4 2.2 | (2.82.1) 1052 | 5 1049 | 1053 | 2 |
For SNe, we consider the cosmic rate at derived by Maoz & Mannucci (2012) and Li et al. (2011). The distribution of the energy output of SNe can be described as Gaussians (Hatano et al., 1997; Cappellaro et al., 1999; Richardson et al., 2002; Barris et al., 2004; Botticella et al., 2008; Yasuda & Fukugita, 2010) with parameter values reported in Table 2. We further distinguish between the three different classes of SNe Ia, Ibc, and IIp.
3.1.1 Redshift distribution
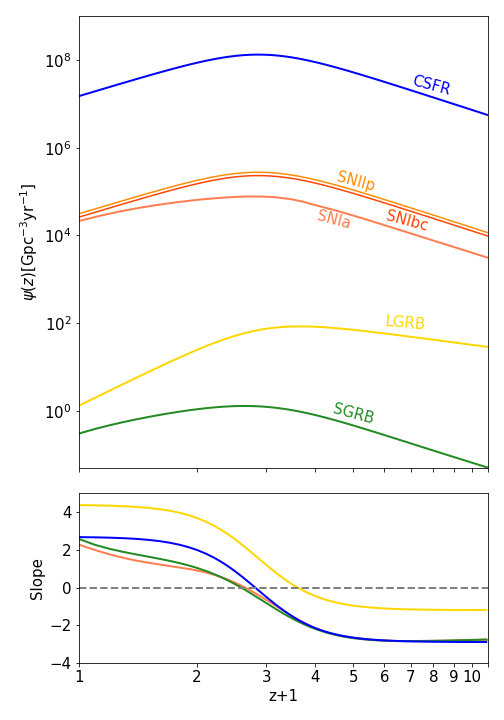
The association of LGRBs with envelope-stripped SNe (Galama et al., 1998; Stanek, 2003; Hjorth et al., 2003; Malesani et al., 2005; Pian et al., 2006; Campana et al., 2006; Sparre et al., 2011; Melandri et al., 2012; Xu et al., 2013) and the properties of their hosts (e.g., Fruchter et al., 2006) probe their origin from the core-collapse of rapidly rotating massive stars (Woosley, 1993; MacFadyen & Woosley, 1999). Because it is generated by the explosion of short-lived massive stars, the redshift distribution of LGRBs and SNIbc/IIp is expected to follow the cosmic star formation history (CSFR; e.g., Madau & Dickinson 2014; Hopkins & Beacom 2006),
| (7) |
which is represented by the blue line in Fig. 2. However, differently from SNIbc/IIp, the rate of LGRBs deviates from the CSFR (Firmani et al., 2004; Daigne et al., 2006; Le Floc’h et al., 2006; Guetta & Della Valle, 2007; Kistler et al., 2009; Virgili et al., 2011; Salvaterra et al., 2012). This corresponds to a steeper (with respect to the CSFR) increase in the GRB rate with increasing redshift (Pescalli et al., 2016) up to a peak corresponding to (i.e., higher than the CSFR peak at ). This could be interpreted as caused by the GRB bias (i.e., preference) for low-metallicity progenitors (Woosley & Heger, 2006). Studies of the host metallicity have suggested that GRBs in most cases occur in galaxies whose metallicity is lower than a threshold value (Vergani, 2018; Palmerio et al., 2019). Population studies (Bignone et al., 2017, 2018) suggest that this metallicity threshold lies in the range 0.3–0.6 . Assuming a threshold value (Bertelli et al., 1994; Virgili et al., 2011), we therefore modeled the LGRB population under this hypothesis and express their cosmic rate (orange line in Fig. 2) as
| (8) |
where is the fraction of stars with a metallicity lower than . We calculated by assuming that the metallicity of the local Universe has a mean value [Fe/H]0=-0.006 with a normal dispersion (Gallazzi et al., 2008; Madau & Dickinson, 2014). As we show in §3.3, the final rate of LGRBs within the MW does not depend on but only on its value at z=0.
SGRBs are thought to be produced by the mergers of compact objects, as recently proved by the multimessenger observations of the event GW/GRB170817 (Abbott et al., 2017a, b). It is expected that their redshift distribution does not directly follow the CSFR because of the delay between their formation as a binary and their merger. The delay-time distribution is a power law with slope between a few million and a few billion years (Guetta & Piran, 2005; Nakar & Gal-Yam, 2005; Guetta & Piran, 2006; Wanderman & Piran, 2015; Virgili et al., 2011). Ghirlanda et al. (2016) derived the SGRB formation rate from available observational constraints and found that it is indeed consistent with a delayed cosmic SFR history. We here adopt the parametric function obtained by their work (green line in Fig. 2),
| (9) |
For SNIa we assumed the redshift distribution derived by Maoz & Mannucci (2012). This function is derived by convolving the star formation history of Hopkins & Beacom (2006) with a power-law delay-time distribution (DDT ). This DDT, in addition to ensuring an excellent fit to the observed SN rates, supports the hypothesis of a double-degenerate progenitor origin (i.e., a merger of two white dwarfs) for SNe Ia (Webbink, 1984). The SNIa rate is shown with the red line in Fig.2.
The cosmic rates of the three classes of transients considered in this work are compared in Fig. 2. and peak at a lower redshift than because of the delay between their formation as a binary and their merger. peaks at a higher redshift because of the metallicity bias.
3.2 Star formation factor
In order to account for the preference of LGRBs and core-collapse SNe (Ib/Ic/IIp, CCSNe) to occur in regions characterized by a high SFR, we define (similarly to Li & Zhang 2015) the sSFR correction factor
| (10) |
that describes the fraction of the sSFR within the MW, , with respect to the specific cosmic star formation rate of the Universe at the same epoch . is estimated (§3.5) through a model (Naab & Ostriker, 2006, 2009) that describes the evolution of the radial profile of the star formation and stellar surface density of the MW. The local cosmic specific star formation rate is defined as the ratio of the local star formation rate (Madau & Dickinson, 2014) and the average stellar density as a function of redshift M⊙ Gpc-3 (Li & Zhang, 2015; Mortlock et al., 2015). As expected, when we combine eq. 8 and eq. 10, the terms cancel out (i.e., the global cosmological evolution of the SFR is irrelevant when we consider a specific galaxy), only the present-day value counts as a normalization factor.
3.3 Metallicity factor
In order to account for the preference of LGRBs to occur in low-metallicity environments, we define the correction factor
| (11) |
as the fraction of stars with a metallicity lower than (at any and ) in the MW divided by the fraction of stars with the same metallicity threshold in the local Universe. This definition is similar to what was adopted by Li & Zhang (2015), but we consider for the first time the metallicity profile and its time evolution within the MW.
As explained in , is elided with the same term as in Eq. 10. Eq. 8 becomes
| (12) |
The progenitor difference of SGRBs and LGRBs accounts for the preference of LGRBs to reside in environments of high star formation and low metallicity. Conversely, there is no evidence of a preference of SGRBs for environments of high star formation and low metallicity. For this reason, we assume = 1 and =1. The same holds for SNIa. For CCSNe we assume as calculated in Eq. 10 and =1 because for a progenitor with a mass 40 M⊙ , the formation of a SN is independent of metallicity (Heger et al., 2003). The rare case of SNe that originated in a progenitor with mass 40 M⊙ does not change our results significantly.
In order to account for the errors on the parameters of the luminosity functions, we implemented for the distribution of GRBs durations, SNe energies, and rates a Monte Carlo simulation with 1000 realizations for each type of lethal event. We calculated the number of lethal events during a time interval of 500 Myr as the median value of the distribution of realizations. For each simulation we extracted , , , , , and . For the first four parameters we assumed that they follow Gaussian distributions with characteristic values as reported in Table 1 and Table 2. For and we sampled a log-normal distribution with characteristic values as reported in Table 1 and 2.
3.4 Collimated emission from GRBs
In order to take the strong collimation of GRBs into account, we used the observed rate and the isotropic equivalent luminosity in our computations. in eq. 6 is the observed GRB rate (i.e., not corrected for collimation) at the break isotropic equivalent luminosity , hence it accounts for GRBs whose jets point toward the Earth. The true event rate, that is, the rate that includes the inferred large population of misaligned GRBs, can simply be calculated by dividing by the collimation factor , where is the jet half-opening angle. In practice, gives the fraction of jets pointing at Earth. When we wish to calculate the rate of GRBs that can cause a lethal event, we would need to multiply the true rate by the collimation factor. Therefore the collimation factor cancels out. Explicitly, we have
| (13) |
| SN type | Rate (z=0) | Burst energy |
|---|---|---|
| [erg] | ||
| Ia | 2.2 0.3 [a] | 1046±1 [c] |
| Ibc | 2.6 0.4 [b] | 1046±1 [d] |
| IIp | 3.1 0.5 [b] | 1044±1 [e] |
3.5 Galaxy model
In order to track the evolution and distribution of stellar surface density, SFR, and metallicity of the Galaxy, we used the inside-out formation model of Naab & Ostriker (2009), which reproduces several observable properties of the present-day MW (Table 3). In this model the authors incorporated the bulge, which instead was neglected in the 2006 version of the model (Naab & Ostriker, 2006). In the following we summarize this galaxy model.
Naab & Ostriker (2009) assumed that the formation and evolution of MW proceeds in two phases. In the first phase (i.e., for cosmic time t¡2.5 Gyr), the galaxy is still coupled to the hierarchical growth of the large-scale structure. In this phase, the infall gas loses its angular momentum more effectively as a result of shocks and tidal torques. The authors associated this phase of high infall rates with the formation epoch of the bulge: after Gyr, the baryonic mass (i.e., mainly gas during early stages) settles in the bulge with a steep exponential surface density profile,
| (14) |
with M⊙ pc-2, while R0.6 kpc. At this epoch, the DM halo reaches its present-day virial velocity and evolves in isolation. Then, the long and quiescent assembly (i.e., at low infall rate) of the disk can start. Naab & Ostriker (2009) assumed that the baryonic mass in the disk, starting from this time, evolves with an exponential profile,
| (15) |
where the central surface density is fixed at (400 M⊙ pc-2), while the scale lenght evolves as a fraction of the virial radius of the halo, up to the present-day value of 3.6 kpc,
| (16) |
In order to compute the surface stellar density and metallicity distributions, Naab & Ostriker (2006, 2009) adopted a simplified version of the chemical evolution recipe proposed by Ostriker & Tinsley (1975), neglecting radial gas flows. The model considered the instantaneous metal injection from massive stars (Kins), the delayed injection form low-mass stars (Klate) and the gas-infall rate (), and estimates the variation of surface density in gas and stars (see Naab & Ostriker 2006 for details),
| (17) | |||
| (18) | |||
In order to account for the different star formation histories of bulge and disk, a formulation derived by Kennicutt (1998) based on the local dynamical time (rotation period) of the system is assumed, that is,
| (19) |
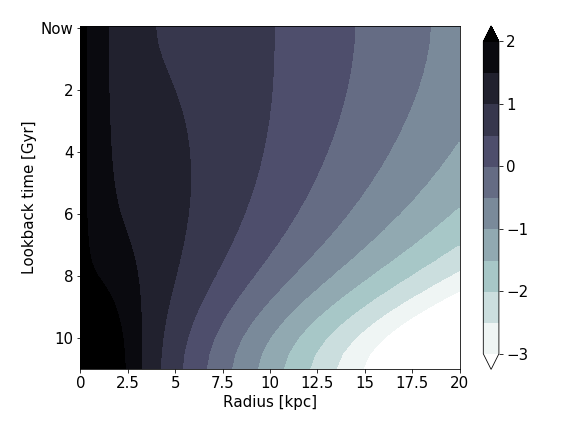
where is the star formation efficiency and the orbital period, with as the local circular velocity. Because of smaller radii, higher gas surface density, and higher circular velocity, the star formation in the bulge is initially very high (Fig.3), and most of its initial gas reservoir is then rapidly consumed.
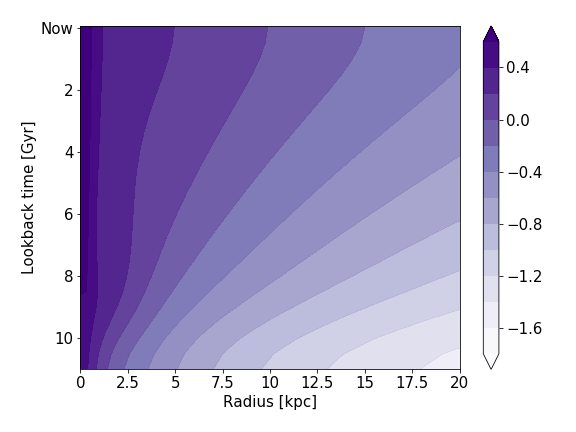
Fig.3 shows the SFR surface density as a function of the position within the Galaxy (i.e., galactocentric radius ) versus lookback-time. The density contours clearly show the increase in SFR surface density from the inner part of the Galaxy toward the peripheral regions (inside-out star formation): while the innermost part of the Galaxy shows little evolution of the star formation after the early stage, the outskirts experienced an increase by several orders of magnitude. Fig. 4 shows the evolution over cosmic time of the radial profile of the metallicity (on a lorgarithmic scale; left color bar). Consistently with the increase in star formation in the MW outskirts, the metallicity at larger distances from the Galaxy center also increased over the last Gyr.
| Propriety | Value |
|---|---|
| M⋆ | M⊙ |
| Mgas | M⊙ |
| M | |
| M | |
| SFR | M |
3.6 Planetary formation
TPs are typically defined as having a solid surface with radius and mass in the ranges and , respectively (where and are the radius and mass, respectively, of Earth). TPs might develop habitable conditions (Alibert, 2014). In order to estimate the surface number density of TPs within the MW as a function of cosmic time and galactocentric distance, we adopted the model of Zackrisson et al. (2016). As simulations and observations (radial velocity and transit surveys) suggest, close-orbit giants form in metal-enriched environments, while in a very low metallicity environment, planet formation is inhibited. The model, based on the assumption that close-orbit giants destroy the prospect of harboring TPs, assumes that the probabilities of forming TPs () and close-orbit giants () are functions of the metallicity of the environment. Following Lineweaver et al. (2004), the probability for a star to harbor a TP is defined as
| (20) |
Zackrisson et al. (2016) approximated the probability of forming close-orbit giants as a function of the metallicity and of the stellar mass (Gaidos & Mann, 2014),
| (21) |
where is a constant factor and the parameter values are for FGK (M) stars and (Gaidos & Mann, 2014). The probability of forming TPs is (Zackrisson et al., 2016)
| (22) |
with for FGK (M) stars. is a function with a cutoff at low-metallicity values,
Combining these equations with the Galaxy model of Naab & Ostriker (2009) (§3.2), we can compute accounting for the metallicity radial distribution and its evolution within the Galaxy. The number surface density of TPs as function of time in the MW was computed using the star formation surface density derived in §3.2 and assuming a Salpeter initial mass function: we computed the fraction of M stars (with masses in the range 0.1-0.6 ) and FGK stars (with masses in the range 0.6-1.2 ). Assuming an average mass for M stars of 0.35 and 0.9 for FGK stars, we derived the number surface density of TPs around M and FGK stars with the following equation:
| (23) |
where is the formation redshift of the MW in the model of Naab & Ostriker (2009).
4 Results
Figure 5 shows the number of lethal astrophysical transient events in the past 500 Myr as a function of distance from the Galactic center. At the position of Earth (8 kpc, vertical solid black line), the number of lethal events (predominantly LGRBs) is about one to two within the past 500 Myr. This agrees with the hypothesis ascribing the Ordovician mass-extinction event to a LGRB (Melott et al., 2005). The minimum in the solid red line (i.e., LGRBs+SGRBs+SNe) identifies a region between 2 and 8 kpc from the Galaxy center in which life in the past 500 Myr might have experienced 1 lethal events. In the outskirts (R10 kpc) and in the center (R1.5 kpc) of the MW the number of lethal event is 2. In the outskirts of the Galaxy, the predominant lethal events are LGRBs because of the low metallicity in the environment, while in the star-forming of the center, SGRBs and SNe occur predominantly. The outskirts of the MW are not favored to host life because only a few TPs are located there (dashed lines) and because lethal LGRBs are very frequent.
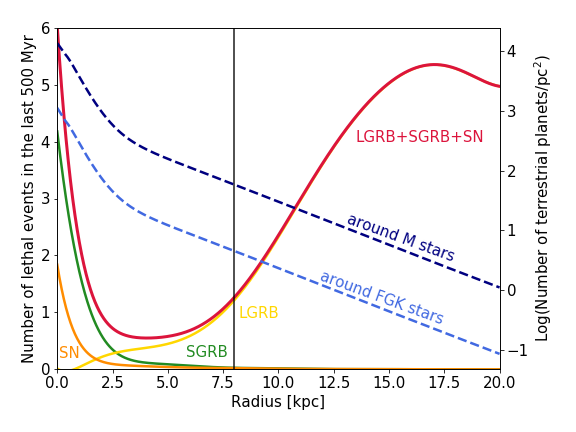
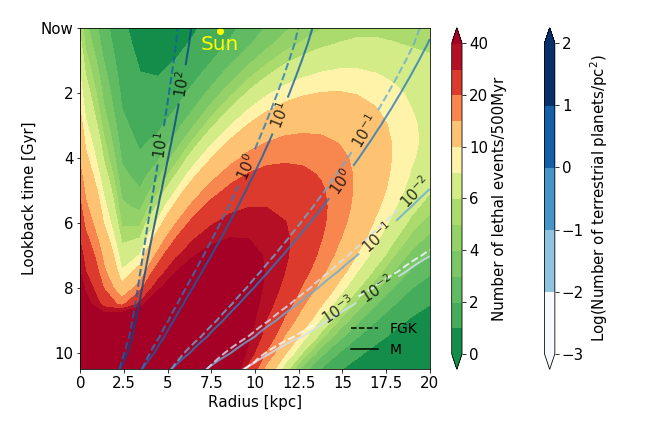
Figure 6 shows the number of lethal events (SGRBs+LGRBs+SNe) in bins of 500 Myr as a function of the distance from the Galactic center (x-axis) throughout the cosmic history of the Milky Way (y-axis). The line contours (corresponding to the blue-scale color bar) show the surface number density of TPs around M stars (solid lines) and FGK stars (dashed lines).
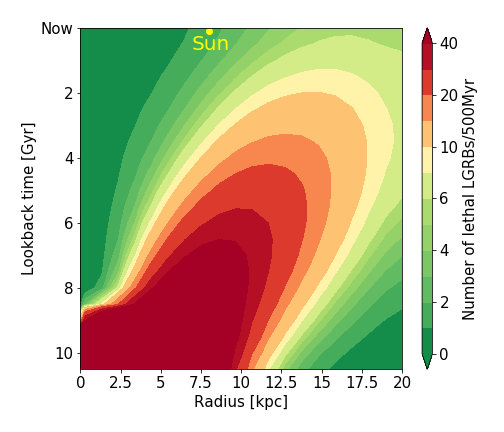
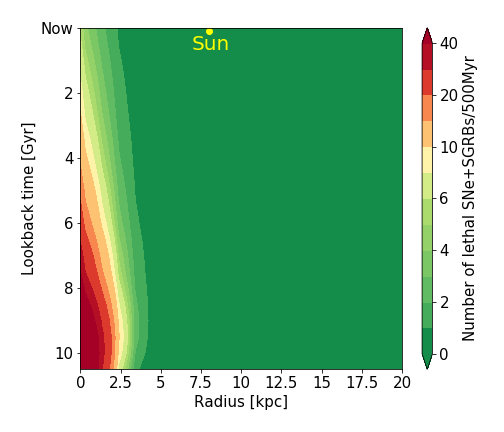
The individual contributions of SNe, SGRBs and LGRBs to Fig.6 are show in Fig.7 and Fig.8. SGRBs and SNe (Fig.8) are concentrated in the central regions of the Galaxy because the stellar density is high and their occurrence is independent of the metallicity of the environment. On the other hand, the incidence of LGRBs as lethal events (Fig.7) develops throuhout the MW history with an inside-out pattern: They dominate the rate of lethal events at the early stages of the MW evolution in the central regions, where most of the stars are formed, but are progressively suppressed by the increase in metallicity, and they become more prominent in the outskirts where the star formation is relatively higher and the metal pollution is not yet high.
There are two so-called green valleys within the MW disk and its cosmic history. The first is in the outer regions of the disk (i.e., kpc) that experienced a relatively low incidence of lethal events during the first 6 Gyr of Galaxy evolution. This region has the lowest TP surface density, however. Starting about 6 Gyr ago, LGRBs became the dominant lethal sources for life within the MW because of their energetics, with an increasing number of lethal events toward the Galaxy periphery (red to orange contours in Fig. 7). This is due to the increased conversion rate of gas relatively little polluted by metal into massive stars in the outer regions of the MW. This global trend determined the formation of an increasingly larger, safer region of the MW located at intermediate galactocentric distances kpc. In this second green valley, the main contribution of lethal events is still due to LGRBs, but the increase in metallicity due to the intense star formation suppresses the incidence of LGRBs. The higher density of TPs in this region makes it the most favorable region in the Galaxy for the development and resilience of life to ozone depletion induced by transient astrophysical events in the last 4 Gyr. In general, the early stages of the MW evolution (from its formation until 6 billion years ago) witnessed extremely poor conditions for life development because lethal events occurred throughout almost the entire Galactic disk ( kpc), in which TPs are present in a considerable number.
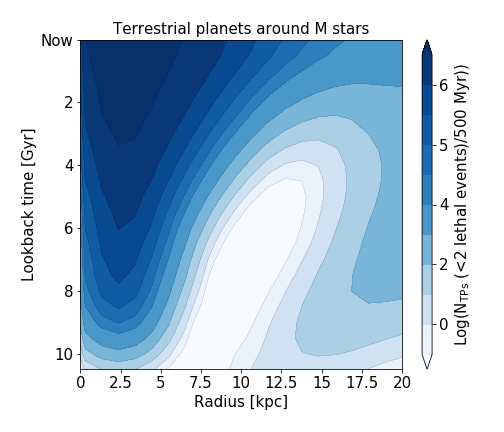
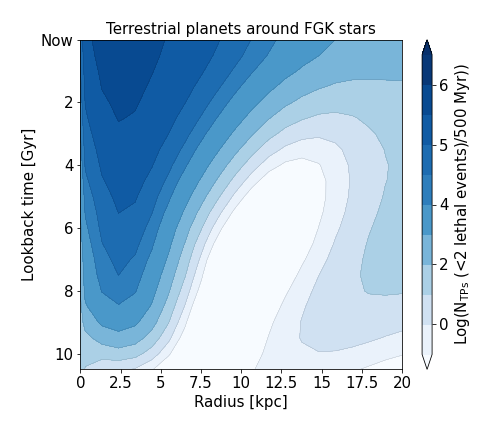
Although it is not clear how many mass extinctions can prevent the habitability of a planet, based on what happened to Earth, we consider that one lethal event within 500 Myr at most is a conservative tolerable rate of lethal events for life as we know it to survive. The number of terrestrial potentially habitable planets orbiting M and FGK stars as a function of Galactocentric distance and cosmic time is shown in fig. 9 and fig. 10, respectively. We first calculated the probability of having fewer than two life-threatening events in 500 Myr as a Poisson distribution, with mean the number of lethal events/500 Myr shown in Fig 6, and then multiplied by the number of TPs around M and FGK stars, obtained by integrating the planet surface density in annuli of constant width pc.
5 Discussion
We measured the lethal power of the three classes of transients considered from their energetics, event rates, and the surface density of TPs in the MW. We found that LGRBs are the dominant life-threatening transients for planets at kpc throughout the entire cosmic history of the MW (Fig.7). This is mainly due to their high energy ( ergs, isotropic equivalent), which compared to the energy of SNe compensates for their lower intrinsic rate. Instead, SGRBs (which compete with LGRBs in terms of energetics) and SNe dominate the counts of hazardous transients in the central regions of the MW, especially during the earliest evolution (Fig. 8), because their occurrence is mainly driven by stellar density and SFR. We discuss the effect of the many assumptions we made in our analysis in this section.
5.1 Transients
The fluence threshold we considered harmful for life (i.e., erg cm kJ m-2) would induce a % depletion of the ozone layer. This reduction can trigger mass extinctions (Thomas et al., 2005a). The choice of the threshold value affect the estimate of the rate of lethal events, but not on their spatial and temporal trends within the MW. If we were to consider the lower threshold fluence of 10 kJ m-2 (able to induce a 68% depletion of the ozone layer), for example, then there would be lethal events at larger distances, hence increasing the total rate at any and at any time. In contrast, a higher threshold fluence of 1000 kJ m-2 (98% depletion of the ozone layer), for instance, would select only the most powerful transients that explode closer to any given planet. These events are relatively rare given the corresponding steep luminosity function of LGRBs and SGRBs. The threshold adopted in our study is higher than the lethal dose typically considered for Earth biota, that is, 105 erg cm-2 for eucaryotic multicellular lifeforms (Scalo & Wheeler, 2002) and 107 erg cm-2 for prokaryotic microbes (Balbi & Tombesi, 2017). This allowed us to extend our results also to planets without an ozone layer.
The lethal impact of SGRB, which dominate the central regions of the Galaxy (Fig.8), was computed assuming the luminosity function derived by Ghirlanda et al. (2016). Alternatively, if we had considered a steeper faint-end of the SGRB luminosity function (such as in Wanderman & Piran 2015), the rate of low-luminosity SGRBs would be higher. These events, however, are characterized by relatively short hazard distances (Eq. 4) and our results would be practically unaltered.
We linked the LGRB and the formation rate of TPs to the metallicity evolution within the MW. We considered that LGRBs preferably form in evironments with (Bignone et al., 2017, 2018). Assuming a different metallicity threshold (Tab. 4) mainly affects the rate of lethal LGRBs in the outer regions of the Galaxy, where the metallicity is indeed close to the threshold we did adopt.
| 0.3 Z⊙ | 0.4 Z⊙ | 0.5 Z⊙ | |
|---|---|---|---|
| 8 kpc | 1.5 | 1.2 | 1.0 |
| 17 kpc | 2.9 | 5.3 | 7.4 |
We did not take the effect of cosmic rays into account. In a recent work, Marshall et al. (2020) suggested that the moderate extinction event at the end of the Devonian period (Hangenberg event, 360 Myr) was associated with ozone depletion and a consequent higher solar UV-B radiation on Earth. This may explain the discovery of malformed land-plant spores in terrestrial Devonian-carboniferous boundary sections from East Greenland. Although a GRB cannot be excluded as the cause of this extinction event, Fields et al. (2020) proposed cosmic rays, accelerated in a nearby SN and magnetically confined inside the SN remnant for 100 kyr, as the trigger of the ozone-layer depletion followed by the Devonian extinction.
5.2 UV flash
An effect we did not explicitly consider is the effect caused by UV flashes. Galante & Horvath (2007) and Martín et al. (2009) suggested that the UV flash resulting from the transmission of the -rays through the atmosphere could have important short-term effects on life forms, especially for planets with thin atmospheres. In contrast, Thomas (2009) argued that only long-term and extended effects on Earth-like life forms caused by ozone-layer depletion can trigger biological catastrophes of the type we considered here. A UV flash is indeed a very short-lived phenomenon, occurring on the timescale of the –ray event (1 s and 10 s for SGRB and LGRB, respectively), and it is localized on half of the planet surface. However, a short but strong kick could be much more harmful than constant pressure over years, such as that caused by the depletion of the ozone layer. Moreover, a UV flash (1-10 s) and ozone depletion (10 yr) are essentially instantaneous compared to the ecological timescales of recovery after extinctions (Kirchner & Weil, 2000).
Rodríguez-López et al. (2020) showed that a UV flash can reduce a significant fraction (20-60%) of phytoplankton biomass, the very basis of the ocean food chain and oxygen production. To estimate the UV flash effect, they considered an event able to hit the top of the atmosphere with a -ray fluence of 100 kJ/m2. Because this is the same critical fluence we assumed in our work, this effect of a UV flash can be added to that of the ozone-layer depletion. If a lower -ray fluence at the top of the atmosphere produces an UV flash that can trigger a mass extinction, the total rate of lethal events increases, but their spatial and temporal distribution within the MW (Fig. 6) remains unchanged.
5.3 Planets
As suggested by O’Neill et al. (2020), planets forming early on in the MW history tend to have low Fe/Si ratios and thus strong activity of the tectonic plates, which appears to be an important factor for the development of life as we know it. However, as we showed, planets were subject to a very high rate of possibly lethal events at the early stages of the Galaxy.
The adopted planet formation model (Zackrisson et al., 2016) implies that gas giants with orbital period yr (i.e., warm and hot Jupiters, see Gaidos & Mann, 2014) hinder the presence of TPs. However, this assumption is likely to overstate the effect of close-orbit giants on TPs, as there are examples of warm Jupiters in systems with rocky members (Steffen et al., 2012; Huang et al., 2016). Our estimate of the surface density of TPs should therefore be regarded as a lower limit.
5.4 The Galaxy
The Naab & Ostriker galaxy model does not take any azimuthal inhomogeneities into account. The innermost regions could be even more unfavorable to life if a galactic bar were present that would enhance the rate of lethal events (Fig 6, R¡ 4 kpc). The same applies to the regions contained within the spiral arms.
Neglecting the distinction between thin- and thick-disk stars is highly justified in our study, as the thick disk accounts for 10% of the stars in our galaxy, predominantly low-mass stars that do not produce the dominant lethal events (CCSNe and LGRBs). Moreover, the range (a few kiloparsec) of the dominant lethal events in the disk (led by LGRBs) is larger than the average thickness of the thick disk, and the segregation in metallicity between thick- and thin-disk stars (Yan et al. 2019) is likely marginal in the probability of planet formation.
We did not consider other aspects that were investigated in recent works in the context of Galactic habitability. For example, the combined action of tidal disruption events (Pacetti et al., 2020) and the active phase of the central black hole (Balbi & Tombesi, 2017) further reduce the habitability of the bulge. Moreover, a detailed evaluation of the habitability of the bulge should also account for the relatively higher probability of stellar encounters that can perturb planetary orbital configuration, but on the other hand, also favor lithopanspernia (Melosh, 1988; Wesson, 2010).
6 Conclusions
We have investigated the impact of the most energetic transient events on planetary habitability inside the MW and throughout its cosmic history. We considered LGRBs, SGRBs, and SNe (Ia, Ibc, and IIp). These are the most energetic transients and can irradiate a planetary atmosphere with a -ray fluence kJ m-2 (108 erg cm-2). Our main results are summarized below.
We confirmed that at the position of Earth, one LGRB may have occurred within the past 500 Myr. This may have played a leading role in the Ordovician mass extinction.
We demonstrated that the evolutionary pressure due to the considered astrophysical events is not negligible during the evolution of our Galaxy. The safest zone in the past 500 Myr is within about 2-8 kpc. Different from what has been claimed in recent works, we find that the outskirts are not favored to host life because they host few TPs (dashed lines in Fig.5) and many lethal LGRBs, which hinders the emergence of a long-lasting biosphere. SGRBs and SNe are the dominant lethal events only in the central regions of the Galaxy. Searches for exoplanets harboring life forms probably will have more chances of success in the direction of the Galactic center, within 5 kpc from the Sun, because of the combined effect of a high density of TPs (dashed line in Fig.5) and of the low occurrence of lethal transients (solid red line in Fig.5).
We identify two green valleys within the MW disk and its cosmic history (Fig.6). The first is located in the outskirts of the galactic disk (i.e., kpc). These regions experienced a relatively low incidence of lethal events during the first 6 Gyr of the Galactic evolution. However, the probability that life would emerge is hampered by the the low TP surface density. The other green valley is located at intermediate galactocentric distances kpc. Here the dominant lethal transients were LGRBs until 7-6 Gyr, but later on, the progressive increase in metallicity due to the intense star formation suppressed the lethal incidence of LGRBs. The higher density of TPs in this region makes it the most favorable place of the Galaxy for the resilience of life to mass extinction induced by transient astrophysical events over the last 4 Gyr. The inner region of the MW hosts most of the planets with the lowest probability to be at danger distance from more than one lethal event every 500 Myr (Fig 9 and Fig 10). This is due to the high stellar density and high metallicity, which inhibits the formation of LGRBs. This result is in agreement with Gowanlock & Morrison (2018).
In conclusion, the most powerful cosmic explosion jeopardized life within most of the Milky Way in the past, but no longer. In particular, until 6 Gyr ago, the entire Galaxy was very frequently sterilized by transient events. At the early stage of the Galaxy evolution, life as we know it must have been more resilient to high radiation irradiance in order to survive. When we exclude the green valley at the bottom right side of Fig. 6, which has the lowest TP surface density, the Galaxy overall is a safer place to live on a planet today than it was in the past. When we assume that the Sun did not significantly migrate along the galactocentric radius during its lifetime, the Earth, from its birth until today, experienced an ever lower rate of potential mass-extinction events and gradually became an increasingly safer place.
Finally, we note that the very existence of life on planet Earth today demonstrates that mass extinctions do not necessarily preclude the possibility of complex life development. On the contrary, mass extinctions occurring at the right pace could have played a pivotal role in the evolution of complex life forms on our home planet (Sepkoski, 1985; Raup, 1994; Jablonski, 2001; Krug & Jablonski, 2012; Stroud & Losos, 2016).
Acknowledgements.
R.S. acknowledges the Brera Observatory for the kind hospitality during the completion of this work. The authors thank F. Borsa for useful discussions. Funding support is acknowledged from Prin-INAF 1.05.01.88.06 “Towards the SKA and CTA era: discovery, localisation, and physics of transient sources”; 1.05.06.13 Premiale 2015 “FIGARO”; Accordo Attuativo ASI-INAF n.2017-14-H.0. We acknowledge support from PRIN-MIUR 2017 (grant 20179ZF5KS).References
- Abbott et al. (2017a) Abbott, B. P., Abbott, R., Abbott, T. D., et al. 2017, Phys. Rev. Lett., 119, 161101
- Abbott et al. (2017b) Abbott, B. P., Abbott, R., Abbott, T. D., et al. 2017, Phys. Rev. Lett., 119, 141101
- Alibert (2014) Alibert, Y. 2014, A&A, 561, A41
- Balbi & Tombesi (2017) Balbi, A. & Tombesi, F. 2017, Scientific Reports, 7, 16626
- Barris et al. (2004) Barris, B. J., Tonry, J. L., Blondin, S., et al. 2004, ApJ, 602, 571
- Bertelli et al. (1994) Bertelli, G., Bressan, A., Chiosi, C., et al. 1994, A&AS, 106, 275
- Bignone et al. (2017) Bignone, L. A., Tissera, P. B., & Pellizza, L. J. 2017, MNRAS, 469, 4921
- Bignone et al. (2018) Bignone, L. A., Pellizza, L. J., & Tissera, P. B. 2018, New A, 65, 73
- Botticella et al. (2008) Botticella, M. T., Riello, M., Cappellaro, E., et al. 2008, A&A, 479, 49
- Campana et al. (2006) Campana, S., Mangano, V., Blustin, A. J., et al. 2006, Nature, 442, 1008
- Cappellaro et al. (1999) Cappellaro, E., Evans, R., & Turatto, M. 1999, A&A, 351, 459
- Dar et al. (1998) Dar, A., Laor, A., & Shaviv, N. J. 1998, Phys. Rev. Lett., 80, 5813
- Daigne et al. (2006) Daigne, F., Rossi, E. M., & Mochkovitch, R. 2006, MNRAS, 372, 1034
- D’Avanzo et al. (2014) D’Avanzo, P., Salvaterra, R., Bernardini, M. G., et al. 2014, MNRAS, 442, 2342
- Fields et al. (2020) Fields, B. D., Melott, A. L., Ellis, J., et al. 2020, arXiv:2007.01887
- Firmani et al. (2004) Firmani, C., Avila-Reese, V., Ghisellini, G., et al. 2004, ApJ, 611, 1033
- Fruchter et al. (2006) Fruchter, A. S., Levan, A. J., Strolger, L., et al. 2006, Nature, 441, 463
- Gaidos & Mann (2014) Gaidos, E. & Mann, A. W. 2014, ApJ, 791, 54
- Galama et al. (1998) Galama, T. J., Vreeswijk, P. M., van Paradijs, J., et al. 1998, Nature, 395, 670
- Galante & Horvath (2007) Galante, D. & Horvath, J. E. 2007, International Journal of Astrobiology, 6, 19. doi:10.1017/S1473550406003545
- Gallazzi et al. (2008) Gallazzi, A., Brinchmann, J., Charlot, S., et al. 2008, MNRAS, 383, 1439
- Gehrels et al. (2003) Gehrels, N., Laird, C. M., Jackman, C. H., et al. 2003, ApJ, 585, 1169
- Ghirlanda et al. (2016) Ghirlanda, G., Salafia, O. S., Pescalli, A., et al. 2016, A&A, 594, A84
- Gowanlock et al. (2011) Gowanlock, M. G., Patton, D. R., & McConnell, S. M. 2011, Astrobiology, 11, 855
- Gowanlock (2016) Gowanlock, M. G. 2016, ApJ, 832, 38
- Gowanlock & Morrison (2018) Gowanlock, M. G. & Morrison, I. S. 2018, arXiv:1802.07036
- Guetta & Piran (2005) Guetta, D. & Piran, T. 2005, A&A, 435, 421
- Guetta & Piran (2006) Guetta, D. & Piran, T. 2006, A&A, 453, 823
- Guetta & Della Valle (2007) Guetta, D. & Della Valle, M. 2007, ApJ, 657, L73
- Hatano et al. (1997) Hatano, K., Fisher, A., & Branch, D. 1997, MNRAS, 290, 360
- Heger et al. (2003) Heger, A., Fryer, C. L., Woosley, S. E., et al. 2003, ApJ, 591, 288
- Herrmann & Patzkowsky (2002) Herrmann, A.D., & Patzkowsky, M.E. (2002) Astrobiology 2, 560-561
- Herrmann et al. (2003) Herrmann, A. D., Patzkowsky, M. E., & Pollard, D. 2003, Geology, 31, 485
- Hjorth et al. (2003) Hjorth, J., Sollerman, J., Møller, P., et al. 2003, Nature, 423, 847
- Höflich & Schaefer (2009) Höflich, P. & Schaefer, B. E. 2009, ApJ, 705, 483
- Hopkins & Beacom (2006) Hopkins, A. M. & Beacom, J. F. 2006, ApJ, 651, 142
- Huang et al. (2016) Huang, C., Wu, Y., & Triaud, A. H. M. J. 2016, ApJ, 825, 98. doi:10.3847/0004-637X/825/2/98
- Jablonski (2001) Jablonski, D. 2001, PNAS, 98, 5393-5398
- Japelj et al. (2016) Japelj, J., Vergani, S. D., Salvaterra, R., et al. 2016, A&A, 590, A129
- Kasting et al. (1993) Kasting, J. F., Whitmire, D. P., & Reynolds, R. T. 1993, Icarus, 101, 108
- Kennicutt (1998) Kennicutt, R. C. 1998, ApJ, 498, 541
- Kirchner & Weil (2000) Kirchner, J. W. & Weil, A. 2000, Nature, 404, 177. doi:10.1038/35004564
- Kistler et al. (2009) Kistler, M. D., Yüksel, H., Beacom, J. F., et al. 2009, ApJ, 705, L104
- Kopparapu et al. (2013) Kopparapu, R. K., Ramirez, R., Kasting, J. F., et al. 2013, ApJ, 765, 131
- Kouveliotou et al. (1993) Kouveliotou, C., Meegan, C. A., Fishman, G. J., et al. 1993, ApJ, 413, L101
- Krug & Jablonski (2012) Krug, A. Z. & Jablonski, D. 2012, Geology, 40, 731
- Le Floc’h et al. (2006) Le Floc’h, E., Charmandaris, V., Forrest, W. J., et al. 2006, ApJ, 642, 636
- Li & Zhang (2015) Li, Y. & Zhang, B. 2015, ApJ, 810, 41
- Li et al. (2011) Li, W., Leaman, J., Chornock, R., et al. 2011, MNRAS, 412, 1441
- Lineweaver et al. (2004) Lineweaver, C. H., Fenner, Y., & Gibson, B. K. 2004, Science, 303, 59
- MacFadyen & Woosley (1999) MacFadyen, A. I. & Woosley, S. E. 1999, ApJ, 524, 262
- Madau & Dickinson (2014) Madau, P. & Dickinson, M. 2014, ARA&A, 52, 415
- Malesani et al. (2005) Malesani, D., Moretti, A., Romano, P., et al. 2005, GRB Coordinates Network, Circular Service, No. 3087, #1 (2005), 3087
- Maoz & Mannucci (2012) Maoz, D. & Mannucci, F. 2012, PASA, 29, 447
- Marshall et al. (2020) Marshall, J. E. A., Lakin, J., Troth, I., et al. 2020, Science Advances, 6, eaba0768
- Martín et al. (2009) Martín, O., Galante, D., Cárdenas, R., et al. 2009, Ap&SS, 321, 161. doi:10.1007/s10509-009-0037-3
- Melandri et al. (2012) Melandri, A., Pian, E., Ferrero, P., et al. 2012, A&A, 547, A82
- Melosh (1988) Melosh, H. J. 1988, Nature, 332, 687
- Melott et al. (2005) Melott, A. L., Thomas, B. C., Hogan, D. P., et al. 2005, Geochim. Res. Lett., 32, L14808
- Melott & Thomas (2011) Melott, A. L. & Thomas, B. C. 2011, Astrobiology, 11, 343
- Mortlock et al. (2015) Mortlock, A., Conselice, C. J., Hartley, W. G., et al. 2015, MNRAS, 447, 2
- Naab & Ostriker (2006) Naab, T. & Ostriker, J. P. 2006, MNRAS, 366, 899
- Naab & Ostriker (2009) Naab, T. & Ostriker, J. P. 2009, ApJ, 690, 1452
- Nakar & Gal-Yam (2005) Nakar, E. & Gal-Yam, A. 2005, American Astronomical Society Meeting Abstracts
- Ostriker & Tinsley (1975) Ostriker, J. P. & Tinsley, B. M. 1975, ApJ, 201, L51
- O’Neill et al. (2020) O’Neill, C., Lowman, J., & Wasiliev, J. 2020, Icarus, 352, 114025
- Pacetti et al. (2020) Pacetti, E., Balbi, A., Lingam, M., et al. 2020, MNRAS, doi:10.1093/mnras/staa2535
- Palmerio et al. (2019) Palmerio, J. T., Vergani, S. D., Salvaterra, R., et al. 2019, A&A, 623, A26
- Pescalli et al. (2016) Pescalli, A., Ghirlanda, G., Salvaterra, R., et al. 2016, A&A, 587, A40
- Pian et al. (2006) Pian, E., Mazzali, P. A., Masetti, N., et al. 2006, Nature, 442, 1011
- Piran & Jimenez (2014) Piran, T. & Jimenez, R. 2014, Phys. Rev. Lett., 113, 231102
- Pescalli et al. (2016) Pescalli, A., Ghirlanda, G., Salvaterra, R., et al. 2016, A&A, 587, A40
- Raup (1994) Raup, D.M. 1994, PNAS, 91, 6758-6763
- Ruderman (1974) Ruderman, M. A. 1974, Science, 184, 1079
- Richardson et al. (2002) Richardson, D., Branch, D., Casebeer, D., et al. 2002, AJ, 123, 745
- Rodríguez-López et al. (2020) Rodríguez-López, L., Cardenas, R., González-Rodríguez, L., et al. 2020, arXiv:2011.08433
- Salvaterra et al. (2012) Salvaterra, R., Campana, S., Vergani, S. D., et al. 2012, ApJ, 749, 68
- Scalo & Wheeler (2002) Scalo, J. & Wheeler, J. C. 2002, ApJ, 566, 723
- Schawinski et al. (2008) Schawinski, K., Justham, S., Wolf, C., et al. 2008, Science, 321, 223
- Sepkoski (1985) Sepkoski, J. J. 1985, The Search for Extraterrestrial Life: Recent Developments, 112, 223
- Soderberg et al. (2008) Soderberg, A. M., Berger, E., Page, K. L., et al. 2008, Nature, 453, 469
- Sparre et al. (2011) Sparre, M., Sollerman, J., Fynbo, J. P. U., et al. 2011, ApJ, 735, L24
- Spitoni et al. (2014) Spitoni, E., Matteucci, F., & Sozzetti, A. 2014, MNRAS, 440, 2588
- Spitoni et al. (2017) Spitoni, E., Gioannini, L., & Matteucci, F. 2017, A&A, 605, A38. doi:10.1051/0004-6361/201730545
- Stanek (2003) Stanek, M. J. 2003, Acoustical Society of America Journal, 113, 1788
- Steffen et al. (2012) Steffen, J. H., Ragozzine, D., Fabrycky, D. C., et al. 2012, Proceedings of the National Academy of Science, 109, 7982. doi:10.1073/pnas.1120970109
- Stroud & Losos (2016) Stroud J.T. & Losos, J.N. 2016, Annual Review of Ecology, Evolution, and Systematics, 47, 507-532
- Svensmark (2012) Svensmark, H. 2012, MNRAS, 423, 1234
- Thomas et al. (2005a) Thomas, B. C., Jackman, C. H., Melott, A. L., et al. 2005, ApJ, 622, L153
- Thomas et al. (2005b) Thomas, B. C., Melott, A. L., Jackman, C. H., et al. 2005, ApJ, 634, 509
- Thomas (2009) Thomas, B. C. 2009, International Journal of Astrobiology, 8, 183. doi:10.1017/S1473550409004509
- Thorsett (1995) Thorsett, S. E. 1995, ApJ, 444, L53
- Vergani (2018) Vergani, S. D. 2018, Mem. Soc. Astron. Italiana, 89, 175
- Virgili et al. (2011) Virgili, F. J., Zhang, B., Nagamine, K., et al. 2011, MNRAS, 417, 3025
- Vukotić et al. (2016) Vukotić, B., Steinhauser, D., Martinez-Aviles, G., et al. 2016, MNRAS, 459, 3512
- Wanderman & Piran (2010) Wanderman, D. & Piran, T. 2010, MNRAS, 406, 1944
- Wanderman & Piran (2015) Wanderman, D. & Piran, T. 2015, MNRAS, 448, 3026
- Webbink (1984) Webbink, R. F. 1984, ApJ, 277, 355
- Wesson (2010) Wesson, P. S. 2010, Space Sci. Rev., 156, 239
- Woosley et al. (1993) Woosley, S. E., Langer, N., & Weaver, T. A. 1993, ApJ, 411, 823
- Woosley (1993) Woosley, S. E. 1993, ApJ, 405, 273
- Woosley & Heger (2006) Woosley, S. E. & Heger, A. 2006, ApJ, 637, 914
- Xu et al. (2013) Xu, D., de Ugarte Postigo, A., Leloudas, G., et al. 2013, ApJ, 776, 98
- Yasuda & Fukugita (2010) Yasuda, N. & Fukugita, M. 2010, AJ, 139, 39
- Yoon et al. (2006) Yoon, S.-C., Langer, N., & Norman, C. 2006, A&A, 460, 199
- Zackrisson et al. (2016) Zackrisson, E., Calissendorff, P., González, J., et al. 2016, ApJ, 833, 214