On the X-ray Spectral Energy Distributions of Star-Forming Galaxies: the 0.3–30 keV Spectrum of the Low-Metallicity Starburst Galaxy VV 114
Abstract
Binary population synthesis combined with cosmological models suggest that X-ray emission from star-forming galaxies, consisting primarily of emission from X-ray binaries (XRBs) and the hot interstellar medium (ISM), could be an important, and perhaps dominant, source of heating of the intergalactic medium prior to the epoch of reionization. However, such models rely on empirical constraints for the X-ray spectral energy distributions (SEDs) of star-forming galaxies, which are currently lacking for low-metallicity galaxies. Using a combination of Chandra, XMM-Newton, and NuSTAR observations, we present new constraints on the 0.3–30 keV SED of the low-metallicity starburst galaxy VV 114, which is known to host several ultra-luminous X-ray sources (ULXs) with luminosities above 1040 erg s-1. We use an archival Chandra observation of VV 114 to constrain the contributions to the X-ray SED from the major X-ray emitting components of the galaxy, and newly acquired, nearly simultaneous XMM-Newton and NuSTAR observations to extend the spectral model derived from Chandra to cover the 0.3–30 keV range. Using our best-fit galaxy-wide spectral model, we derive the 0.3–30 keV SED of VV 114, which we find is dominated by emission from the XRB population, and in particular ULXs, at energies 1.5 keV, and which we find to have an elevated galaxy-integrated X-ray luminosity per unit star formation rate relative to higher-metallicity star-forming galaxies. We discuss our results in terms of the effect of metallicity on XRB populations and the hot ISM, and the importance of X-ray emission from star-forming galaxies in the high redshift Universe.
1 Introduction
X-ray binaries (XRBs), systems in which a compact object (a black hole [BH] or neutron star [NS]) accretes material from a less evolved stellar companion, are important probes of stellar and binary evolution, compact object populations, and physical accretion mechanisms. Studies of XRB populations in nearby galaxies have revealed important scalings between XRB populations and host galaxy properties, including star formation rate (SFR), stellar mass, and metallicity (e.g., Prestwich et al., 2013; Lehmer et al., 2019). In particular, the galaxy-integrated emission from high-mass XRBs (HMXBs), systems in which the donor star is massive ( 8 ), has been shown to scale with SFR (e.g., Grimm et al., 2003; Fabbiano, 2006; Mineo et al., 2012a; Lehmer et al., 2010, 2019; Kouroumpatzakis et al., 2020), while the emission from low-mass XRBs (LMXBs), systems with low-mass donor stars, has been observed to scale with stellar mass (e.g., Colbert et al., 2004; Gilfanov, 2004; Boroson et al., 2011; Lehmer et al., 2010, 2019, 2020). These scalings can be explained by stellar evolution timescales: the high-mass donor stars in HMXBs die off rapidly ( 40 Myr) following a star forming episode, while the low-mass donors in LMXBs will live for billions of years following an episode of star formation.
These locally-derived scaling relations for galaxy-integrated with SFR and mass have also been shown empirically to evolve with redshift (Basu-Zych et al., 2013a; Lehmer et al., 2016; Aird et al., 2017), and very recently Fornasini et al. (2019, 2020) demonstrated that the increase of galaxy-integrated per unit SFR with increasing redshift is likely tied to the metallicity evolution of the Universe. This metallicity dependence of per unit SFR (/SFR) is supported by studies of HMXBs and ultra-luminous X-ray sources (ULXs), XRBs with 1039 erg s-1, whose galaxy-integrated /SFR has been shown to increase with decreasing metallicity (e.g., Prestwich et al., 2013; Douna et al., 2015; Brorby et al., 2014, 2016; Basu-Zych et al., 2013b, 2016). This metallicity scaling for HMXBs and ULXs is corroborated by theoretical binary population synthesis models (e.g., Linden et al., 2010; Fragos et al., 2013a; Wiktorowicz et al., 2017, 2019), which find order-of-magnitude differences in galaxy-integrated /SFR between environments at solar and 0.1 metallicities. The inverse correlation between XRB /SFR and metallicity is due to the effects of metallicity on stellar and binary evolution, namely the production of more massive BHs and/or more compact binaries, and therefore brighter systems, at lower metallicities (e.g., Mapelli et al., 2010; Linden et al., 2010).
A key implication of these empirically derived and theoretically corroborated scalings of with host galaxy properties is the importance of XRBs to normal galaxy emissivity across cosmic time. Theoretical binary population synthesis models, when coupled with prescriptions for the cosmic star formation history (SFH) and metallicity evolution of the Universe predict that HMXBs will begin to dominate normal galaxy emissivity over LMXBs at 1–2, and further that the normal galaxy emissivity due to XRBs may begin to dominate over active galactic nuclei (AGN) at 5–6 (e.g., Fragos et al., 2013a; Madau & Fragos, 2017).
The rising dominance of XRBs in the early Universe coupled with cosmological models suggests that emission from XRBs may provide a non-negligible heating source to the intergalactic medium (IGM) during the “epoch of heating” at 10–20, prior to reionization (e.g., Mesinger et al., 2013, 2014; Pacucci et al., 2014; Mirocha, 2014; Fialkov et al., 2014, 2017). This further suggests that XRBs could have a significant imprint on the 21-cm signal observed from these redshifts (e.g., Das et al., 2017). In the near future, 21-cm interferometers like the Hydrogen Epoch of Reionisation Array (HERA) and Square Kilometre Array (SKA) are expected to observe the signals from this epoch of heating, thus providing constraints on the ionizing properties of X-ray sources during this epoch (e.g., Greig & Mesinger, 2017; Park et al., 2019). However, interpreting the 21-cm results in the context of XRB populations, and further refining predictions from binary population synthesis models for the importance of XRBs at different epochs requires empirically constraining the metallicity dependence of the X-ray spectral energy distribution (SED). In particular, it is critical to constrain the X-ray SED for low-metallicity, star-forming galaxies, which serve as better analogs to the first galaxies, and in the rest frame soft band (0.5–2 keV), which is the energy band of interest for the photons that most strongly interact with the IGM at high redshift (e.g., McQuinn, 2012). In this work, we present the 0.3–30 keV SED of the low-metallicity, starburst galaxy VV 114, providing an important empirical benchmark for the metallicity dependence of the X-ray SED in both the soft (0.5–2 keV) and hard (2–30 keV) bands.
| Obs. Start Date | Obs. ID | Inst. | Eff. Exposure (ks) | PI |
|---|---|---|---|---|
| (1) | (2) | (3) | (4) | (5) |
| Chandra | ||||
| 2005-10-20 | 7063 | ACIS-S | 59 | T. Heckman |
| XMM-Newton | ||||
| 2019-01-10 | 0830440101 | EPIC-pn | 26 | B. Lehmer |
| 2019-01-10 | 0830440101 | EPIC-MOS1 | 30 | B. Lehmer |
| 2019-01-10 | 0830440101 | EPIC-MOS2 | 26 | B. Lehmer |
| NuSTAR | ||||
| 2019-01-19 | 50401001002 | FPMA | 205 | B. Lehmer |
| 2019-01-19 | 50401001002 | FPMB | 204 | B. Lehmer |
Note. — Col. (1): observation start date. Col. (2): observation ID. Col. (3): instrument. Col. (4): good time interval effective exposure times in ks after removing flared intervals. Col. (4): observation PI.
VV 114 is a prime target for calibrating the metallicity dependence of the X-ray SED as it is a relatively nearby ( = 88 Mpc222We calculate the distance for VV 114 taking from NED and assuming = 70 km s-1 Mpc-1, = 0.3, and = 0.7) Lyman break analog (LBA). LBAs are highly star-forming, yet relatively dust- and metal-poor galaxies at that resemble higher redshift () Lyman break galaxies (e.g., Heckman et al., 2005; Hoopes et al., 2007; Basu-Zych et al., 2009). With VV 114’s gas phase metallicity of 12+log(O/H) = 8.4333We calculate the gas-phase metallicity for VV 114 from the [O iii] 5007 and [N ii] 6584 emission line ratios taken from Moustakas & Kennicutt (2006), and using the method outlined in Pettini & Pagel (2004, “PP04 O3N2”). In what follows, we adopt a global metallicity of 0.51 for VV 114, assuming corresponds to 12+log(O/H) = 8.69 (Asplund et al., 2009)., global UV + IR SFR of 38 yr-1 as measured from GALEX and WISE, and stellar mass of log = 10.65 (Basu-Zych et al., 2013b), scaling relations dictate that it should host a substantial XRB population. With a specific star formation rate (SFR/) 10-10 yr-1, VV 114 is further expected to be dominated by HMXBs or ULXs, as opposed to LMXBs (e.g., Lehmer et al., 2010). Indeed, previous X-ray studies of VV 114 have revealed a galaxy with a well-populated X-ray luminosity function (XLF), comprised of six ULXs, which put VV 114 above the “normal” /SFR derived from nearby star-forming galaxies (Basu-Zych et al., 2013b, 2016). Thus, VV 114 offers a unique environment for studying the X-ray SED in that it is highly star forming, relatively low metallicity, and is known to host six ULXs (Basu-Zych et al., 2016).
In this paper, we use new nearly-simultaneous observations of VV 114 from XMM-Newton and NuSTAR coupled with archival Chandra data to characterize its 0.3–30 keV SED in terms of both the galaxy-wide X-ray emission and the resolved X-ray source population. This paper is organized as follows: Section 2 discusses the data sets in use, as well as the reduction procedures and spectral fitting techniques employed in the analysis of these datasets. Section 3 provides the results of the custom spectral modeling of both the point source population and galaxy-wide X-ray emission of VV 114 using all three data sets. Section 4 presents a discussion and interpretation of these results for the low-metallicity SED in the context of previous works, the theoretical scalings of XRB emission with SFR and metallicity, and future 21-cm measurements. Finally, in Section 5 we summarize this work, and discuss future directions.
2 Observations & Data Reduction
In this section we describe the observations, both archival (Chandra) and new (XMM-Newton and NuSTAR), used as part of this analysis, as well as an overview of the data reduction procedures.
2.1 Chandra Imaging & Spectra
We used archival Chandra data to assess the point source population in VV 114, as only Chandra has the required spatial resolution to resolve the galaxy-wide emission of VV 114 into individual point sources. The archival Chandra observation is listed in Table 1, where the observation was performed with ACIS-S in “Very Faint” (VFAINT) mode, and the listed effective exposure time includes only good time intervals (GTIs).
We reduced the archival Chandra observation using the standard reduction tools included with CIAO version 4.10 and CALDB version 4.8.1777http://cxc.harvard.edu/ciao/download/. The level=1 event files were reprocessed to level=2 event files using the latest calibration and script chandrarepro. We subsequently filtered the level=2 event files on GTIs determined from background light curves filtered with the task lcclean with default filtering parameters.
We then created an exposure map and point spread function (PSF) map using regions that encompassed 90% of the encircled energy of the PSF using the CIAO tools fluximage and mkpsfmap. We used the images from these procedures as input to wavdetect to determine positions and PSF-corrected extraction regions for each of the six point sources in the galaxy. We then extracted spectral files for each of the six point sources using the task specextract with the wavdetect-determined source positions and extraction regions and the flag psfcorr = yes. The specextract task produces not only source spectra, but also response matrix files (RMFs), ancillary response files (ARFs), and background spectra when provided with a background extraction region. We use this task for extracting all subsequent Chandra spectral products, as described next.
For extracting background spectra we chose regions encircling VV 114 free of point sources and uncontaminated by diffuse emission from the galaxy. We estimated the diffuse extent ( 13 kpc) of the galaxy visually using a combination of soft-band (0.3–1 keV and 1–2 keV) Chandra and optical HST images. We also extracted spectral products for the point-source-free diffuse emission using a region encompassing the diffuse extent as described above, but excluding the 90% encircled energy fraction regions for all six detected point sources. We likewise extracted spectral products for the galaxy-wide emission, including all six detected point sources, the diffuse emission, and any unresolved component. These Chandra spectral products are used in constraining the components of the galaxy-wide emission and compared with the XMM-Newton and NuSTAR data, for which the galaxy appears as a single source, as described in Section 3.1.
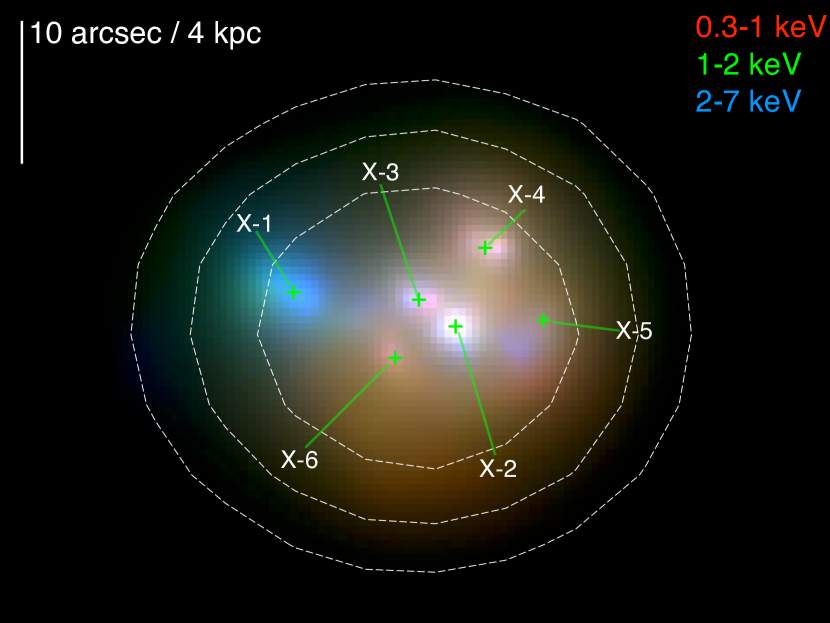
Finally, we created exposure-corrected images in the soft (0.3–1 keV), medium (1–2 keV), and hard (2–7 keV) bands using the task fluximage. We imposed a 1′′ 1′′ pixel binning (2 2 native pixels) on the resultant images, which we subsequently used to create a three-color, adaptively smoothed image using csmooth. The three-color, adaptively smoothed image is shown in Figure 1, and highlights the locations of each of the six Chandra-detected point sources (VV 114 X-1 to X-6), along with the hot, diffuse gas, which suffuses the galaxy.
2.2 XMM-Newton Imaging & Spectra
In addition to using the archival Chandra observation to measure the resolved components of VV 114, we obtained new XMM-Newton observations of the galaxy to provide additional constraints on the galaxy-wide emission. Observational data files (ODFs) for these new observations were processed using the XMM-Newton Science Analysis System (SAS version 17.0)888https://www.cosmos.esa.int/web/xmm-newton/sas. We created event lists from the ODFs for the EPIC-MOS (Turner et al., 2001) and EPIC-pn detectors (Strüder et al., 2001) using the SAS tasks emchain and epchain, respectively. We applied standard filters for the EPIC-MOS detectors to include single, double, and quadruple events (PATTERN 12 && flag== #XMMEAEM), and similarly applied standard criteria to include single and double events with conservative flagging for the EPIC-pn detector (PATTERN 4 && FLAG == 0).
With the filtered event lists for each detector, we next constructed X-ray light curves from the entire field, from which we determined the rate thresholds for filtering the event lists for background flaring events. For the MOS detectors we created 10 keV light curves, creating GTIs by filtering out periods with count rates 0.2 counts s-1, and for the pn camera we created a 10-12 keV light curve, filtering out periods with count rates 0.5 counts s-1. The effective exposures for each observation after filtering on these GTIs are listed in Table 1.
Following GTI correction, we performed source detection on images in five bands for each detector using the task edetectchain. We cross-correlated 29 of the detected point sources with counterparts from the Chandra observation to determine the translation shift between the observations, finding shifts of +025 in R.A. and +166 uncertainty in decl. necessary to bring the images into astrometric alignment.
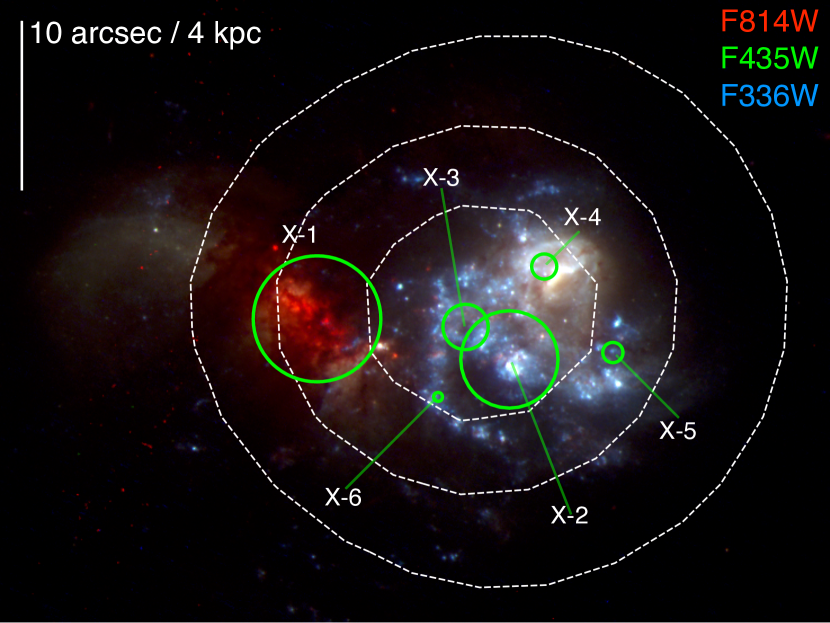
As VV 114 is consistent with being a single source in XMM-Newton, we determined the appropriate galaxy-wide spectral extraction region for VV 114 in the XMM-Newton observations by simulating the combination of the Chandra-detected point source PSFs on each XMM-Newton detector, using the point source physical positions determined from source detection after astrometric correction was applied. To determine the overall expected PSF of VV 114 in each XMM-Newton exposure we used the SAS task psfgen to simulate the PSF for each point source at its physical position on the XMM-Newton detectors, and then combined the simulated PSFs for each of the six point sources, accounting for the physical offsets between each source. The 80% encircled energy fraction spectral extraction regions in each EPIC exposure determined from this procedure were found to be in good agreement with the optical extent of VV 114 from HST imaging. In Figure 2, we show a three-color HST image of VV 114 with 0.3–12 keV intensity contours from XMM-Newton overlaid in white, where the contours approximate the extent of the galaxy-wide spectral extraction region constructed from the PSF simulation procedure.
We extracted source spectra for VV 114 for each detector with the task evselect using the source regions described above and a spectral bin size of five for the pn and 15 for the MOS exposures. For the pn detector we extracted a background spectrum using evselect from a source-free region at a similar RAWY position as VV 114 on the detector, while for both MOS detectors we chose background regions from source-free areas on the same CCD as VV 114. We produced the associated RMFs and ARFs for each spectrum using the tasks rmfgen and arfgen. These XMM-Newton spectral products are used in the analysis of the galaxy-wide spectrum of VV 114 as described in Section 3.2.
2.3 NuSTAR Imaging & Spectra
The NuSTAR data were reduced using HEASoft v6.24 and the NuSTAR Data Analysis Software NuSTARDAS v1.8.0 with CALDB version 20190627. We produced level 2 data products by processing the level 1 data files through nupipeline, which filters out bad pixels, screens for cosmic rays and high background intervals, and projects the detected events to proper sky coordinates.
The NuSTAR PSF has an 18′′ FWHM core and a 58′′ half power diameter (Harrison et al., 2013) resulting in all six point sources in VV 114 appearing blended as one source in the NuSTAR observations (see white, dashed contours, Figure 1). Given the extent of the NuSTAR PSF, we chose a 30′′ region for extracting the galaxy-wide source spectra to encompass most of the emission from VV 114 while minimizing background contamination. We defined a region for extraction of background spectra from a source-free area on the same detector as VV 114, but separated by at least 20′′ from the galaxy. We produced source and background spectra using these regions, as well as RMFs and ARFs for both the FPMA and FPMB using the task nuproducts, ensuring no background subtraction was performed on the source spectra during extraction. These spectral products were used in our analysis of the 3–30 keV spectrum of VV 114, as described in Section 3.2.
2.4 X-ray Spectral Fitting Technique
All spectral fitting was performed with XSPEC v12.10.0c (Arnaud, 1996) using the Cash statistic (Cash, 1979) as the fit statistic. Because the Cash statistic does not yield a straightforward way to evaluate goodness-of-fit (gof), we evaluated the gof of spectral models using the Anderson-Darling (ad) test statistic and the XSPEC Monte Carlo command goodness. For each model, we ran the goodness command for 1000 realizations with the ‘‘nosim’’ and ‘‘fit’’ options. This procedure simulates spectra based on the current best-fit model, fits these simulated spectra to the model, and then calculates the new test statistic. The goodness command returns the distribution of test statistics for the simulated data, which can then be compared to the test statistic for the actual data. Our reported “gof” for each model fit is the fraction of simulations returned from goodness with a test statistic as large, or larger (i.e., statistically worse fits) than the test statistic for the actual data (e.g., Maccarone et al., 2016). Therefore, gof = 0.5 is expected for data consistent with the model, and gof 1 can be interpreted as overfitting the data, since it implies nearly all simulations produced worse fits than the data itself. If all simulations returned smaller test statistics (better fits) than the actual data, the model is rejected (gof 10-3). It is important to note that the gof calculated in this way provides a measure of the confidence level with which a model can be rejected, not a probability for whether the model is correct. Errors on all free model parameters are reported as 90% confidence intervals, and are computed using the XSPEC error command using the output of the XSPEC mcmc routine. In all models we set abundances relative to solar using the Asplund et al. (2009) abundance tables.
All spectral fits were performed on the unbinned source spectra, without any background subtraction. To perform such fits, we must define a model for the background for each instrument. For each observation, we modeled the background with both a sky component, representing the contribution from the diffuse background and the unresolved cosmic X-ray background (e.g., Kuntz & Snowden, 2000; Lumb et al., 2002), as well as an instrumental component, representing the contribution from the instrumental continuum and detector lines. We describe the details of the sky and instrumental background components for each instrument below.
We modeled the sky background for both Chandra and XMM-Newton as an absorbed two-temperature thermal plasma (APEC) plus power-law. These model components represent the diffuse Galactic and extragalactic cosmic X-ray background, respectively, where we fix the photon index for the cosmic X-ray background to = 1.42 (Lumb et al., 2002). For NuSTAR, we modeled the sky background as an absorbed single temperature thermal plasma plus power-law, accounting for the “Solar” and cosmic X-ray background components, respectively (Wik et al., 2014a). For each sky background model we fixed the foreground Galactic absorption component (Tbabs) to = 1.20 1020 cm-2 (HI4PI Collaboration et al., 2016). From our best-fit background models to the background spectra we found sky background APEC temperatures of keV and keV for Chandra, and keV and keV for XMM-Newton. We set keV for NuSTAR following XMM-Newton.
The instrumental background for Chandra was modeled as a power-law continuum superposed with Gaussians, representing detector lines, with the energies and widths of the Gaussian lines fixed following Bartalucci et al. (2014), but line normalizations allowed to vary relative to the continuum. For all XMM-Newton detectors, the instrumental background was composed of a broken power-law for the continuum with detector fluorescence lines as described in Garofali et al. (2017). The NuSTAR instrumental background was modeled as a broken power-law overlaid with 29 Lorentzians following Wik et al. (2014a), where the line normalizations are allowed to vary relative to the continuum, and FPMA and FPMB were handled independently.
We fit the above described background models to the background spectra for each observation to determine the shape of the background at the location of VV 114 for each observation and detector. In subsequent fits to the source region, which includes source plus background data, we include this background as a model component, albeit with nearly all free parameters fixed to their best-fit values (e.g., plasma temperatures listed above), and the normalization fixed to the best-fit normalization for the background spectrum scaled by the ratio of the source to background extraction region areas. In this way, we fix the shape of the background in the fits to the source region based on the best-fit models for the background spectra, and constrain the contribution of the background to the source spectra via the known source and background spectral extraction region areas. Thus, we fit the spectra for the source region without performing any background subtraction while still minimizing the number of free parameters.
| log() | log() | ||||||||||||
|---|---|---|---|---|---|---|---|---|---|---|---|---|---|
| Source | Counts | C | (keV) | (10-5) | (1022 cm-2) | (keV) | (10-4) | (1022 cm-2) | (10-5) | (erg s-1) | (erg s-1) | gof | |
| (1) | (2) | (3) | (4) | (5) | (6) | (7) | (8) | (9) | (10) | (11) | (12) | (13) | (14) |
| diffusea | 2477 | 0.36 | 4.67 | 0.44 | 0.80 | 1.36 | 1.78 | 1.55 | 41.23 | 40.76 | 0.65 | ||
| X-1b | 519 | 0.18 | 2.11 | 2.20 | 1.01 | 0.97 | 41.01 | 41.05 | 0.06 | ||||
| X-2c | 744 | 0.04 | 0.22 | 2.02 | 2.44 | 40.92 | 40.75 | 0.14 | |||||
| X-3c | 293 | 0.03 | 0.03 | 1.53 | 0.55 | 40.57 | 40.45 | 0.27 | |||||
| X-4c | 545 | 0.14 | 0.18 | 2.50 | 1.09 | 40.61 | 40.14 | 0.98 | |||||
| X-5c | 178 | 0.06 | 0.25 | 2.17 | 0.28 | 40.16 | 39.76 | 0.72 | |||||
| X-6c | 196 | 0.09 | 0.10 | 2.34 | 0.19 | 40.16 | 39.55 | 0.09 |
Note. — Best-fit model parameters from spectral fits to the Chandra observation of each component of VV 114: hot gas and point sources VV 114 X-1 to X-6. Quoted uncertainties are 90% confidence intervals. Col. (1): source name, footnote describes the spectral model employed in XSPEC. Col. (2): total number of counts used in spectral fit. Col. (3): multiplicative constant modifying fixed diffuse model component. Col. (4): plasma temperature in keV of lower temperature APEC model component. Col. (5): normalization for lower temperature APEC component. Col. (6): column density in units of 1022 cm-2 for higher temperature APEC component. Col. (7): plasma temperature in keV for higher temperature APEC component. Col. (8): normalization for higher temperature APEC component. Col. (9): column density in units of 1022 cm-2 for power-law component. Col. (10): photon index for power-law component. Col. (11): normalization for power-law component. Col. (12): 0.5–8 keV luminosity, corrected for foreground Galactic absorption and assuming = 88 Mpc. Col. (13): 2–10 keV luminosity, corrected for foreground Galactic absorption and assuming = 88 Mpc. Col. (14): goodness-of-fit measure (see Section 2.4).
3 Results
To construct the galaxy-wide X-ray SED of VV 114 and estimate the XRB contribution, we use the archival Chandra observation of VV 114 in conjunction with the newly obtained, nearly-simultaneous XMM-Newton and NuSTAR observations. In Section 3.1, we present our overall spectral modeling approach and fit results for each major component of VV 114, including the point source population and the hot, diffuse gas component of the galaxy. As the Chandra observation was taken 13 yr prior to the newly obtained XMM-Newton and NuSTAR observations, we consider the potential impact of variability from the sources of compact emission in VV 114 (ULXs and possible AGN) on this analysis. To mitigate the impact of variability, we analyze separately the Chandra spectra from the XMM-Newton and NuSTAR observations, applying the constraints from the Chandra spectral fits, particularly for the non-time variable hot gas component of the galaxy, to the newly obtained XMM-Newton and NuSTAR data. In Section 3.2 we present a comparison of results between the different epochs, as well as the galxy-wide spectrum and associated X-ray SED for VV 114.
3.1 Chandra Point Source Decomposition
We began our investigation of the galaxy-wide SED of VV 114 through a spectral decomposition of the major galaxy components using the archival Chandra observation. With Chandra, VV 114 is resolved into six discrete point sources embedded in hot, diffuse gas (see Figure 1). All six point sources are ULXs with (3–110) 1039 erg s-1, and are detected with sufficient counts ( 200) for simple spectral fitting (Table 2). The brightest point source in the eastern region of the galaxy (VV 114 X-1) is a possible AGN (Iono et al., 2013; Saito et al., 2015), and we devote more attention to discussion of possible AGN contamination in Section 4.1. For each of the six point sources, as well as the point-source-free diffuse emission component we fit the unbinned source spectra with an appropriately scaled background model as described in Section 2.4. Below we describe the spectral models for each component resolved with Chandra.
We first assessed the point-source-free hot, diffuse gas component using an absorbed (foreground Galactic and intrinsic) two-temperature thermal plasma (APEC) model along with a power-law continuum to account for any unresolved XRB emission from undetected XRBs and the wings of the PSFs of X-ray detected point sources. Given the measured gas-phase metallicity for VV 114 (12 + log (O/H) = 8.4), we fixed the abundance for the APEC model components to 0.51 , a direct conversion assuming Asplund et al. (2009) abundances, where corresponds to 12 + log(O/H) = 8.69.
The choice of the two-temperature thermal plasma model with intrinsic absorption is physically motivated assuming the diffuse emission detected with Chandra is produced via a hot disk seen through an intrinsic obscuring column (higher temperature, absorbed APEC component), as well as a relatively unobscured hot halo (lower temperature, unabsorbed APEC component) (e.g., Martin et al., 2002; Strickland et al., 2004). Such a model is consistent with hot, diffuse emission produced by feedback from supernovae and stellar winds (e.g., Strickland et al., 2004; Grimes et al., 2005). The model choice is further motivated by previous empirical studies, which have found that a two-temperature thermal plasma with intrinsic absorption well-describes the diffuse emission in star-forming galaxies across a range of SFRs (e.g., Summers et al., 2003; Hartwell et al., 2004; Mineo et al., 2012b; Lehmer et al., 2015; Smith et al., 2018). The choice to fix the abundances of the APEC components to the measured gas-phase metallicity for VV 114 is supported by previous X-ray investigations of the hot interstellar medium (ISM) in star-forming galaxies, which have found spectral degeneracies when attempting to fit for metal abundances using X-ray spectra (e.g., Weaver et al., 2000; Dahlem et al., 2000), and further that the gas-phase metallicity is a good proxy for the metal abundance of the hot ISM (e.g., Ott et al., 2005a; Grimes et al., 2005, 2006).
The best-fit values for the free parameters from this diffuse component spectral model are listed in the first row of Table 2, with the XSPEC description of the model listed in the table notes. The diffuse gas in VV 114 is well described by 0.4 keV and 0.8 keV components, consistent with plasma temperatures measured for the hot ISM in other star-forming galaxies (e.g., Ott et al., 2005a; Grimes et al., 2005; Mineo et al., 2012b; Smith et al., 2018). Previous X-ray analysis of VV 114 using the same Chandra data was performed by Grimes et al. (2006), finding and keV. While the lower temperature component from Grimes et al. (2006) is consistent with our findings, the high temperature component of their model is inconsistent with our keV component. This inconsistency despite the same dataset may be due to differences in the spectral extraction and modeling approach. In particular, the Grimes et al. (2006) analysis did not explicitly separate the diffuse emission from the point source emission as we do here, and further employed a vmekal model for the hot gas, fitting for the abundances using the angr abundance tables (Anders & Grevesse, 1989) in XSPEC, while in this work we have employed the APEC model with fixed abundances relative to the Asplund et al. (2009) abundance tables.
In subsequent modeling of the six point sources, we included the diffuse gas component listed in Table 2 as a fixed component modified by a free multiplicative constant to account for any residual hot gas in the point source extraction regions. For the point sources themselves, we employed simple absorbed power-law models, appropriate for either XRBs or AGN. Each point source was therefore fit with four freely varying components for the source (i.e., diffuse gas normalization, intrinsic column density, photon index, and power-law normalization).
| log | log | |||||||||||
|---|---|---|---|---|---|---|---|---|---|---|---|---|
| Model | Inst. | C | C | C | (1022 cm-2) | (keV) | (10-5) | (erg s-1) | (erg s-1) | gof | ||
| (1) | (2) | (3) | (4) | (5) | (6) | (7) | (8) | (9) | (10) | (11) | (12) | (13) |
| pow + pow | Chandraa | 1.26 | 0.13 | 2.07 | 6.94 | 41.65 | 41.43 | 0.07 | ||||
| pow | Chandrab | 1.28 | 0.08 | 1.69 | 6.37 | 41.64 | 41.41 | 0.43 | ||||
| pow + pow | XMM+NuSTARa† | 0.97 | 0.56 | 41.60 | 41.30 | 10-3 | ||||||
| pow | XMM+NuSTARb‡ | 0.96 | 0.63 | 41.59 | 41.30 | 10-3 | ||||||
| bknpow | XMM + NuSTARc | 1.39 | 1.62 | 0.01 | 1.44 | 4.03 | 2.51 | 2.61 | 41.54 | 41.27 | 0.06 |
Note. — Best-fit model parameters from spectral fits to galaxy-wide Chandra, XMM-Newton, and NuSTAR spectra of VV 114. Quoted uncertainties are 90% confidence interval. Col. (1): model descriptor. Col. (2): instrument(s), footnote describe the spectral model employed in XSPEC. Col. (3): multiplicative constant for XMM-Newton spectra (XMM-Newton + NuSTAR fits only). Col. (4): multiplicative constant for NuSTAR spectra (XMM-Newton + NuSTAR fits only). Col. (5): multiplicative constant modifying the diffuse model component (Chandra fits only). Col. (6): column density in units of 1022 cm-2 for XRB power-law or broken power-law component. Col. (7): photon index for XRB power-law or first photon index for broken power-law component. Col. (8): break energy in keV for XRB broken power-law component. Col. (9): second photon index for XRB broken power-law component. Col. (10): normalization for XRB power-law or broken power-law component. Col. (11): galaxy-integrated 0.5–8 keV derived from the model, corrected for foreground Galactic absorption and assuming = 88 Mpc. Col. (12): galaxy-integrated 2–10 keV derived from the model, corrected for foreground Galactic absorption and assuming = 88 Mpc. Col. (13): goodness-of-fit measure (see Section 2.4).
Using the above described power-law-plus-hot-gas model for VV 114 X-2 to X-6, we find steep photon indices (), relatively low column densities modifying the power-law components, and minimal contributions from the surrounding hot gas, as indicated by the small values of the normalizations to the fixed diffuse gas components. The best-fit parameters and their associated uncertainties (90% confidence intervals) along with the 0.5–8 and 2–10 keV luminosities for each source from this model are summarized in Table 2. The models for point sources VV 114 X-2 to X-6 are consistent with their being either collections of unresolved XRBs or ULXs embedded in hot gas, indicative of recent star formation.
We initially applied the default power-law-plus-hot-gas model with fixed parameters to VV 114 X-1, but found gof = 0.03, suggesting the model could be improved. We next attempted to fit VV 114 X-1 with a simple absorbed power-law, but found the fit left residuals at energies 0.5 keV and at the location of emission line complexes between 1–2 keV, indicating the need to include one or more thermal components. Given these results and that the multiwavelength data available for VV 114 (e.g., Figure 2) indicates heavy obscuration in the eastern portion of the galaxy where VV 114 X-1 is located, we next adopted a slightly altered version of the default model. The new model for VV 114 X-1 consists of an unabsorbed APEC component (unobscured hot halo), as well as an absorbed APEC-plus-power-law component, representing the obscured emission from the hot disk and VV 114 X-1. In this model for VV 114 X-1 we fixed the APEC temperatures to the values from the default model ( = 0.36 keV and = 0.80 keV), but allowed the APEC normalizations to freely vary. We likewise allowed the intrinsic column density and power-law parameters to freely vary. The fit to VV 114 X-1 using this model yields gof = 0.06, a slight improvement over the default model, returning a high column density ( cm-2) modifying the power-law and higher temperature APEC components, and a photon index of . The best-fit values and associated uncertainties from this model are listed in the second row of Table 2. Importantly, the values for the column density and photon index from this model are consistent with values from Grimes et al. (2006) (their source VV 114E) using the same Chandra data, albeit a slightly different source model than the one employed here (see discussion in Section 4.1). This lends additional support for the adoption of this model for VV 114 X-1. We discuss the significance of this spectral fit result for VV 114 X-1 as a possible AGN in more detail in Section 4.1.
3.2 Galaxy-Wide Spectral Analysis
We extend the results from the spectral decomposition of VV 114 to construct a galaxy-wide spectral model and determine the dominant spectral component at higher energies. In fitting the Chandra observation of the galaxy-wide spectrum we consider all major spectral components as derived from the spectral decomposition described in Section 3.1, and then apply these spectral constraints as appropriate in building a galaxy-wide spectral model to be applied to the XMM-Newton and NuSTAR observations, in which VV 114 is consistent with being a single source (see contours in Figures 1–2). We note that it is not as straightforward to interpret the gof measure for the galaxy-wide fits as for the point source fits. This is because the goodness command simulates spectra assuming variance due only to counting statistics, whereas in fitting the galaxy-wide spectra we may be dominated by systematics. Thus, for the galaxy-wide fits, we caution against interpreting very low gof values as indicating the need for additional model components or free parameters, or interpreting gof 1 as “overfitting,” as proper inclusion of systematic error would likely serve to widen the distribution of test statistics for the simulated spectra.
We first fit the galaxy-wide Chandra spectrum of VV 114 using a model comprised of a hot gas component, an obscured AGN-like component, and an XRB population component (model: powXRB + powAGN). In this powXRB + powAGN model we fixed the hot gas component to the best-fit model for the point-source-free spectrum (first row of Table 2), allowing this component to be modified only by a freely varying multiplicative constant. We likewise fixed the obscured AGN-like component to the column density and power-law slope and normalization from the best-fit model to VV 114 X-1 (second row of Table 2), under the assumption X-1 is an AGN candidate distinct from the other detected point sources. We consider the XRB population component of VV 114 to consist of the known ULXs VV 114 X-2 to X-6 as well as the unresolved XRBs (e.g., the power-law component in the diffuse-only spectrum), for which the best-fit models return varying levels of intrinsic absorption and a range of photon indices and power-law normalizations. In all galaxy-wide models for VV 114 we therefore model the XRB population with a single absorbed power-law component to account for the combination of all known ULXs and the unresolved XRBs. The assumption of a single absorbed power-law for the XRB population is consistent with a fit to the stacked spectra of sources VV 114 X-2 to X-6. We allow all parameters associated with this absorbed power-law model (i.e., intrinsic absorption, photon index, normalization) to be freely varying in order to determine the best-fit parameters for the ensemble XRB population on the galaxy-wide emission.
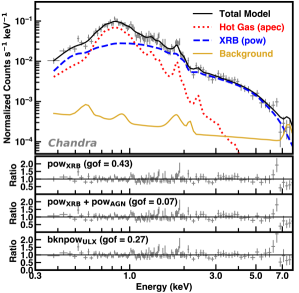
The results for the fit to the galaxy-wide Chandra spectrum using the powXRB + powAGN model are recorded in the first row of Table 3, where we list the best-fit values for the free parameters and their associated uncertainties, as well as the gof value for the model. The powXRB + powAGN model produces an acceptable fit (gof = 0.07) to the galaxy-wide Chandra spectrum (residuals in the bottom panel of Figure 3), returning a photon index for the XRB population power-law component, and a power-law normalization consistent with the summation of normalizations for the known ULXs and unresolved XRBs from the decomposition fits in Table 2. We also tested a simpler model consisting of the same hot gas component, with parameters fixed to the best-fit values from the point-source-free spectrum, but only a single absorbed power-law component with freely varying absorption, photon index, and normalization (model: powXRB). In this model, the single power-law represents the combination of all six point sources (ULXs and possible AGN) and unresolved XRBs. The results from this powXRB model fit to the galaxy-wide Chandra spectrum are listed in the second row of Table 3 and shown in the top panel of Figure 3, with associated residuals in the panel just below. The powXRB model returns a photon index of , consistent with expectations for a population of XRBs. The gof = 0.43 further suggests that this powXRB model is a somewhat more acceptable fit to the galaxy-wide Chandra spectrum, indicating that an additional power-law component describing VV 114 X-1 is not required to model the galaxy-wide X-ray emission.
We next applied these two models (i.e., powXRB + powAGN, and powXRB alone), to the XMM-Newton and NuSTAR spectra. To start, we simply applied each model to the joint XMM-Newton and NuSTAR spectra with the parameters of all model components fixed to the best-fit values from the fits to the Chandra spectrum, save for an overall multiplicative scaling constant for each instrument, which we allowed to vary to account for flux calibration differences or intrinsic variability. We record the results from applying these Chandra-derived models to XMM-Newton and NuSTAR in the third and fourth rows of Table 3, finding that neither model is consistent with the XMM-Newton and NuSTAR data (gof 10-3). We also attempted fitting the XMM-Newton and NuSTAR spectra with powXRB + powAGN and powXRB models with freely varying power-law parameters, i.e., without fixing these parameters to the Chandra-derived values, but found unacceptable fits in both cases (gof 10-3).
The residuals from the Chandra-derived powXRB + powAGN and powXRB models (bottom two panels of Figure 4) indicate a reasonable fit to the XMM-Newton + NuSTAR data at 2–3 keV, but an overestimate of the 2–3 keV emission (overall gof 10-3). These results suggest that the extension of an XRB-like + AGN-like power-law or a single XRB-like power-law to higher energies using parameters derived from fits to the Chandra data is inconsistent with the observed XMM-Newton and NuSTAR spectra. We discuss these results in the context of the potential AGN source VV 114 X-1 in Section 4.1.
| log | log | log | log | log | log | ||
|---|---|---|---|---|---|---|---|
| Inst. | Model | (erg s-1) | (erg s-1) | (erg s-1) | (erg s-1) | (erg s-1) | (erg s-1) |
| (1) | (2) | (3) | (4) | (5) | (6) | (7) | (8) |
| Chandra | pow | 41.06 | 41.04 | 41.09 | 41.50 | 39.98 | 41.39 |
| XMM-Newton + NuSTAR | bknpow | 41.09 | 40.87 | 41.13 | 41.33 | 40.01 | 41.25 |
Note. — Luminosities in three different bands of the components (hot gas and XRB population) comprising the galaxy-integrated of VV 114 from the best-fit spectral models to the Chandra and XMM-Newton and NuSTAR spectra. Col. (1): 0.5–2 keV luminosity of the hot gas component. Col. (2): 0.5–2 keV luminosity of the XRB population component. Col. (3): 0.5–8 keV luminosity of the hot gas component. Col. (4): 0.5–8 keV luminosity of the XRB population component. Col. (5): 2–10 keV luminosity of the hot gas component. Col. (6): 2–10 keV luminosity of the XRB population component.
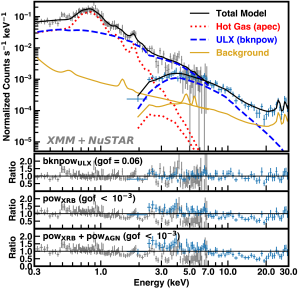
We next swapped the power-law component in the powXRB model for a broken power-law (model: bknpowULX), a component which is physically and observationally motivated assuming a ULX-dominated population (e.g., Gladstone et al., 2009; Wik et al., 2014b; Walton et al., 2013, 2015; Rana et al., 2015; Lehmer et al., 2015; Yukita et al., 2016). As in previous fits, we fixed all the diffuse gas model parameters to the best-fit values to the Chandra point-source-free spectrum, but allowed all broken power-law parameters as well as the overall multiplicative constant for each instrument to vary. This bknpowULX model yields a fit consistent with the XMM-Newton and NuSTAR observations (gof = 0.06), demonstrating that the data are consistent with a spectral turnover at 4 keV. We record the values for the free parameters and their associated uncertainties from the bknpowULX model in the last row of Table 3.
Given the success of this bknpowULX model in fitting the XMM-Newton and NuSTAR spectra, we test this model on the Chandra observation as well, allowing only the broken power-law normalization and intrinsic absorption to freely vary. We show the residuals for the bknpowULX as applied to the Chandra data in the middle panel of Figure 3, demonstrating that this model provides an acceptable fit (gof = 0.27) to the Chandra observation. However, as shown by the residuals in Figure 3, the quality of the Chandra data, particularly at energies 5 keV, is not sufficient to distinguish between the different models tested here. In fact, in order to obtain an acceptable fit to the Chandra spectrum with the bknpowULX model we must freeze the majority of the model parameters to the best-fit values obtained from fits to the XMM-Newton and NuSTAR spectra, indicating that the Chandra spectrum alone cannot constrain parameters such as the broken power-law photon indices and break energy. This underlines that, while Chandra is powerful for resolving point sources from the hot, diffuse emission in the galaxy, XMM-Newton and NuSTAR are critical for high energy ( 5 keV) constraints, where spectral turnover from a ULX population (or lack thereof) is more apparent.
We display the best-fit bknpowULX model and its associated components (hot, diffuse gas, broken power-law, and background) as applied to the XMM-Newton and NuSTAR spectra in the top panel of Figure 4, with the residuals for this model in the second panel from the top. The residuals from the Chandra-derived models (powXRB + powAGN and powXRB), which were poor fits to the XMM-Newton and NuSTAR observations, are shown in the bottom two panels of the same figure for reference. The preference for a broken power-law over power-law component(s) as constrained by the nearly-simultaneous XMM-Newton and NuSTAR spectra is consistent with the galaxy-wide emission of VV 114 being dominated by ULXs at energies 2 keV (e.g., Gladstone et al., 2009). We discuss this ULX-dominated interpretation as it relates to the possible AGN in VV 114, as well as metallicity effects, in Sections 4.1–4.3.
In columns 11–12 of Table 3 we list the galaxy-integrated total X-ray luminosity in the 0.5–8 keV and 2–10 keV bands (log and log ) corrected for foreground Galactic absorption from each of the spectral models applied to the Chandra and XMM-Newton + NuSTAR spectra. In Table 4 we likewise list the galaxy-integrated luminosities of the components which constitute , namely the luminosities of the hot, diffuse gas (log ) and XRB population (log ), in the 0.5–2 keV, 0.5–8 keV, and 2–10 keV bands derived from the best-fit model to the Chandra spectrum (powXRB) and the best-fit model to the XMM-Newton and NuSTAR spectra (bknpowULX).
The discrepancy between the model XRB component luminosities listed in Table 4 as measured with Chandra versus XMM-Newton + NuSTAR can be attributed to multiple factors, including flux calibration differences between instruments, model differences, and the different integration times and epochs between observations. In Table 4 we list XRB component luminosities derived from the best-fit models for each set of observations, thus some disagreement between Chandra and XMM-Newton + NuSTAR is expected given these observations are fit with different best-fit models (powXRB and bknpowULX, respectively). However, when we calculate the XRB from the bknpowULX model fit to the Chandra spectrum we find log = 41.47 0.02 and log = 41.33 0.02, still inconsistent with the XMM-Newton and NuSTAR derived XRB component luminosities listed in Table 4 using this same model. That the inconsistency is larger in the 0.5–8 keV band indicates that the depth of the observations is at least partly to blame for the discrepancy between luminosities. In particular, we use the XMM-Newton spectra to constrain the luminosity in the 0.5–8 keV band given its increased sensitivity across the entirety of the bandpass relative to NuSTAR; however, XMM-Newton is the shallowest of all observations used here, thus the XRB component luminosity in the 0.5–8 keV bandpass as constrained by XMM-Newton is likely systematically low compared to Chandra. By contrast, the discrepancy in the 2–10 keV band, where we use both NuSTAR and XMM-Newton to constrain the XRB component luminosity, is within the range expected due to flux calibration differences between instruments (Madsen et al., 2015). It is also possible that variability between epochs affects the derived luminosities, however, as we further demonstrate in Section 4.4 using a set of archival XMM-Newton observations, the inconsistency between Chandra and XMM-Newton + NuSTAR derived luminosities does not necessarily suggest substantial variability between epochs.
All luminosities listed in Tables 2–4 are calculated assuming = 88 Mpc for VV 114, and using the cflux convolution model in XSPEC as a component modifying either the overall model (luminosities in Table 2 and Table 3) or the appropriate model component (luminosities in Table 4). Therefore, all luminosities are based on fluxes corrected for Galactic extinction, but not intrinsic extinction. In the cflux model component, we fixed the minimum and maximum energy parameters to return the flux in the appropriate band, and likewise fixed the normalizations of any model component modified by cflux to the best-fit values from Tables 2–3. In refitting the models with cflux to produce a galaxy-integrated total or component flux, we allowed only the flux parameter of the cflux component and any free parameters excluding the component normalizations in the model to freely vary.
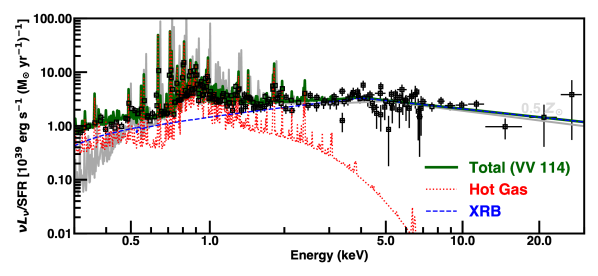
Finally, in Figure 5 we present the SFR-normalized, unfolded 0.3–30 keV SED of VV 114 derived from the best-fit bknpowULX spectral model to the XMM-Newton and NuSTAR spectra, where the solid green line in Figure 5 represents the total X-ray SED of VV 114, and the dotted red and dashed blue lines represent the contributions from the hot, diffuse gas and XRB population in the galaxy, respectively. On this same plot, we overlay the unfolded data points from the XMM-Newton and NuSTAR spectra, which have been binned to a minimum significance of ten per spectral bin and background subtracted for display purposes only. We display the data in this way to give a sense for the uncertainty associated with the galaxy SED, particularly at higher energies where the data become more highly background dominated.
4 Discussion
Previous studies of VV 114 have found an elevated galaxy-integrated /SFR relative to the average value of local star-forming galaxies (Basu-Zych et al., 2013b, 2016). In this section, we discuss the possible explanations for the elevated /SFR in VV 114, namely the potential presence of an AGN and the sub-solar metallicity of the galaxy, ultimately ruling out a significant contribution from an AGN to the galaxy-integrated in VV 114. We present a further discussion of the SFR-scaled 0.3–30 keV SED of VV 114 in the context of metallicity effects on XRB populations and future 21-cm measurements.
4.1 Potential AGN Contribution
Previous X-ray analyses of VV 114 have explored the possibility that the galaxy contains an AGN in its heavily obscured eastern region, but have been inconclusive as to the definitive presence of an accreting supermassive BH (e.g., Grimes et al., 2006; Basu-Zych et al., 2016). Multiwavelength analysis beyond X-rays offers evidence in favor of the AGN interpretation for VV 114 X-1. Using ALMA, Iono et al. (2013) and Saito et al. (2015) showed evidence of compact and broad molecular emission component coincident with the eastern nucleus of VV 114, where the high detected HCN (3–4)/ HCO+ (4–3) ratio is indicative of the presence of a dust-enshrouded AGN, possibly surrounded by compact star-forming regions. In the mid-IR, Le Floc’h et al. (2002) demonstrated that the strong continuum emission in the eastern portion of the galaxy may be indicative of a heavily obscured AGN. However, Basu-Zych et al. (2013b) used optical line ratio diagnostics to demonstrate that VV 114 lies squarely in the star-forming region of the Baldwin, Phillips, and Terlevich diagram (Baldwin et al., 1981), indicating that an AGN is unlikely to be the dominant source of ionizing photons in VV 114.
Using the same Chandra data as analyzed in this work, Grimes et al. (2006) performed a spectral fit to VV 114E (our source VV 114 X-1), finding that their fits required the addition of Gaussian line components centered at 1.39 and 1.83 keV superposed on the continuum emission, roughly line energies corresponding to enhanced Mg and Si, respectively. These authors note that such emission lines may be associated with the presence of a low-luminosity AGN, but are also consistent with emission features expected from a region of intense star formation.
Whereas the Grimes et al. (2006) spectral model for VV 114E (our source VV 114 X-1) consists of a single thermal plasma, Gaussian lines, and an absorbed power-law, our model for this source does not require additional Gaussian lines at 1.39 and 1.83 keV to produce an acceptable fit to the source. Rather, our model consists of a two-temperature thermal plasma plus absorbed power-law as summarized in the second row of Table 2. We find that adding the Gaussian lines at the energies included in Grimes et al. (2006) is degenerate with the features of our two-temperature thermal plasma with keV and keV. Furthermore, under the assumption that the hot gas component in VV 114 is associated with starburst activity, our model is strongly motivated by previous studies which have found that the hot gas component in star-forming galaxies is well-described by a two-temperature thermal plasma with characteristic temperatures 1 keV (e.g., Strickland et al., 2004; Ott et al., 2005a, b; Grimes et al., 2005; Tüllmann et al., 2006b, a; Mineo et al., 2012b; Smith et al., 2018). Despite these model differences for the hot gas component, we find a photon index and column density for the power-law component of our model for VV 114 X-1 that is consistent with the values found by Grimes et al. (2006) for VV 114E using the same Chandra data.
These fit results, both from this work as recorded in Table 2 and from Grimes et al. (2006) for the same Chandra data, demonstrate that VV 114 X-1 is unique relative to the other five point sources resolved by Chandra. In particular, VV 114 X-1 is consistent with a power-law spectrum with , while the point sources present in the western portion of the galaxy are consistent with power-law models with . This harder spectrum is to be expected given that VV 114 X-1 sits behind a much higher column density than any sources in the western region of the galaxy (see Figure 2). The photon index returned from our fit to the Chandra spectrum of VV 114 X-1 () differs from expectations for a population of HMXBs or a ULX (e.g., Remillard & McClintock, 2006; Berghea et al., 2008; Gladstone et al., 2009); however, within the upper range of the 90% confidence interval on the best-fit value the photon index is consistent with the power-law slope for a population of more heavily obscured XRBs or perhaps a single ULX (e.g., Lehmer et al., 2013).
Photon indices in the range , such as the best-fit value for VV 114 X-1, have been measured both for a subset of ULXs with 1040 erg s-1, possibly indicative of ULXs in the power-law dominated very high state (e.g., Berghea et al., 2008), as well as for some Compton-thick AGN (e.g., Winter et al., 2008). We cannot distinguish between these possibilities based on the Chandra data alone, though our measured column density for VV 114 X-1 does not support the interpretation of this source as a Compton-thick AGN. We note that Prestwich et al. (2015) find a similarly hard spectrum for the highly luminous source Haro 11 X-1 (), a source which they report is consistent with being a single compact accretor. It is possible that the photon index measured for VV 114 X-1 is a function of the limited data quality, where we are not sensitive to features such as a spectral turnover, which would point more definitively to a ULX versus AGN interpretation. In any case, in the absence of higher quality spectra or long-term monitoring to detect possible state transitions, we cannot distinguish between an AGN or ULX for VV 114 X-1 on the basis of the Chandra data alone.
Although we cannot definitively determine the nature of VV 114 X-1, it is important to note that our spectral analysis using the newly obtained XMM-Newton and NuSTAR data indicates that the galaxy-wide emission of VV 114 is not dominated by an AGN at energies 2 keV. For an AGN-dominated galaxy we would expect a spectrum well-fit by a simple power-law (e.g., Winter et al., 2008, 2009). We find that the spectral fits to the joint XMM-Newton and NuSTAR observations favor a broken power-law model with keV, and that the inclusion of a 1 power-law model component (i.e., VV 114 X-1) extended to higher energies is inconsistent with the data (see Figure 4). While AGN may exhibit spectral turnover features, the break energies typically occur at 50 keV (e.g., Molina et al., 2006; Winter et al., 2009). The break energy at 4 keV found from our model is consistent with the spectral behavior measured from high-quality ULX spectra, indicative of disk and Comptonized corona components around accreting stellar mass compact objects (Gladstone et al., 2009).
Thus, the X-ray spectral analysis presented here demonstrates that VV 114 X-1 does not dominate the global 0.3–30 keV emission of VV 114, and that in fact the galaxy-integrated emission is dominated by emission from ULXs. Notably, this finding is corroborated by previous X-ray studies of VV 114: Grimes et al. (2006) showed that if VV 114 X-1 is an AGN it does not dominate the global emission of VV 114, and similarly Basu-Zych et al. (2016) concluded that the removal of VV 114 X-1 from the XLF results in a luminosity distribution consistent with a collection of blended HMXBs drawn from a “standard” HMXB XLF. Both of these studies thus conclude that the galaxy-integrated X-ray emission from VV 114 is consistent with expectations for a galaxy with 2 keV emission dominated by XRBs. In the following sections, we therefore discuss our results for VV 114 assuming the 2 keV emission is dominated by such sources.
4.2 Comparison with SEDs in other Star-Forming Galaxies
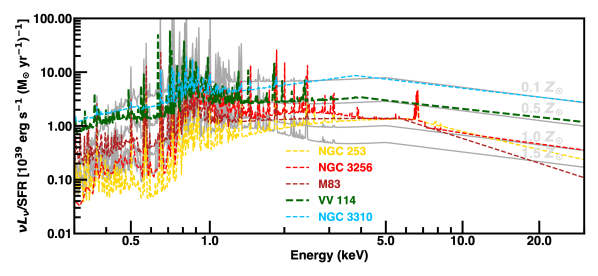
In this section we present the 0.3–30 keV SED of VV 114 relative to the X-ray SEDs from a small sample of star-forming galaxies at different metallicities already in the literature to discuss the effects of metallicity and SFH on the X-ray SED. In Figure 6 we show the SFR-normalized SED of VV 114 (green) relative to the SFR-normalized SEDs of NGC 253 (yellow, Wik et al. 2014b), NGC 3256 (red, Lehmer et al. 2015), M 83 (dark red, Yukita et al. 2016), and NGC 3310 (blue, Lehmer et al. 2015). All the galaxies in Figure 6 have a similar overall SED shape, with spectral turnovers at energies between 3–8 keV, indicating that all these galaxies have substantial ULX populations.
While the basic SED shape indicates the same class of source provides the bulk of the hard (2–30 keV) X-ray emission in all these galaxies, the normalizations for the sub-solar metallicity galaxy SEDs of VV 114 and NGC 3310 are noticeably elevated with respect to the normalizations of the solar to super-solar metallicity galaxies (NGC 253, NGC 3256, and M 83; Zaritsky et al., 1994; Mas-Hesse & Kunth, 1999; Trancho et al., 2007). In particular, the SED of VV 114 is elevated by a factor of 3–11 relative to the solar metallicity SEDs, a factor consistent with theoretical predictions for the enhancement in the bright XRB population at half solar metallicity from Fragos et al. (2013a). Furthermore, the SED of VV 114 appears elevated in the soft band relative to the solar metallicity galaxies, which, as will be discussed in Section 4.3, is possibly the result of different ISM conditions at lower metallicity.
The SED of NGC 3310 likewise appears elevated in the soft band relative to the solar metallicity galaxies, and furthermore displays an even higher normalization than VV 114 at energies 1 keV (enhancement by a factor of 8–25 relative to solar). This enhancement factor for NGC 3310 is more consistent with theoretical predictions for an XRB population at 0.1 , as the theoretical simulations suggest a nearly order of magnitude difference between the galaxy-integrated /SFR between XRB populations at solar and 0.1 (Linden et al., 2010; Fragos et al., 2013a). However, the reported gas phase metallicity for NGC 3310 is closer to 0.3 (de Grijs et al., 2003a; Engelbracht et al., 2008), which is only slightly lower than the half solar value reported for VV 114. It is possible that the simulated SEDs based on theoretical predictions presented in Figure 6, although simplified, are actually constraining the metallicity of NGC 3310, indicating that the galaxy may have a gas phase metallicity closer to the low end ( 0.2 ) of the measured uncertainty range (Engelbracht et al., 2008).
Alternatively, statistical scatter due to XLF sampling can affect galaxy-integrated XRB and therefore SED normalization (e.g., Lehmer et al., 2019). Given 9 109 and SFR 6 yr-1 for NGC 3310 (Lehmer et al., 2015), and 4 1010 and SFR 38 yr-1 for VV 114 (Basu-Zych et al., 2016), we would expect the statistical scatter in XRB for these galaxies to be on the order of 0.3 dex and 0.2 dex, respectively (Lehmer et al., 2019). The SED normalizations of VV 114 and NGC 3310 are elevated with respect to the SEDs of NGC 253, NGC 3256, and M 83 by more than 0.5 dex in all cases, and the measured difference in normalization between NGC 3310 and VV 114 is 0.4 dex. Thus, statistical scatter cannot explain the difference in SED normalization between the sub-solar and solar metallicity galaxies, and it is not likely to be responsible for the difference in normalization between NGC 3310 and VV 114.
Another possible factor affecting the normalization of the SED is the SFH of the galaxy. HMXBs and ULXs represent a snapshot in the evolution of massive stars in binaries, and thus appear at early times ( 50 Myr) following a burst of star formation and evolve rapidly ( Myrs) away from their X-ray bright phase following core-collapse of the secondary donor star. Binary population synthesis models thus predict that the underlying SFH, or age of the stellar population, will affect the integrated from such a population, in addition to the aforementioned metallicity effects. Such models predict a peak in the number of bright XRBs produced at on timescales 5–10 Myr post-starburst (Linden et al., 2010). In these models the lowest metallicity populations () produce vastly more HMXBs, and therefore higher /SFR, than solar metallicity environments, but only on timescales 10 Myr post-starburst. A number of recent observational studies have corroborated this SFH-dependence for HMXB production using spatially and temporally resolved SFHs in the vicinities of HMXBs (e.g., Antoniou et al., 2010; Antoniou & Zezas, 2016; Lehmer et al., 2017; Antoniou et al., 2019; Garofali et al., 2018).
As we do not have a detailed SFH of VV 114 or measurements of individual cluster ages, a joint analysis of the effect of both stellar population age and metallicity on the SED is beyond the scope of this work. However, we can make some conjectures as to the differences between the host environment in NGC 3310 and VV 114 using measured star cluster ages in NGC 3310. These cluster ages, derived from SED-fitting of HST data, reveal a peak in the cluster age distribution at 30 Myr post-starburst (de Grijs et al., 2003b, a), well beyond the most favorable timescale ( 10 Myr post-starburst) for boosted HXMB or ULX production at discussed above. On its surface, this would seem to indicate that NGC 3310 does not have a more favorable SFH in terms of XRB production relative to VV 114, and that instead metallicity, perhaps as low as 0.1 , is the primary effect driving the enhanced SED normalization for NGC 3310. Of course, this analysis is highly simplified, as it assumes simple bursts of star formation when galaxies in fact have much more complex SFHs (e.g., Eufrasio et al., 2017). In fact, recent work exploring the -SFR scaling relation for XRBs using sub-galactic regions in NGC 3310 identified stellar population age as the likely dominant factor in driving the excess of XRB emission relative to galaxy-wide scaling relations (Anastasopoulou et al., 2019). This highlights the need for further studies exploring both the age and metallicity effects on XRB production, ideally for a larger sample of galaxies across different metallicities, in order to provide improved empirical constraints for the scaling of XRB with these host galaxy properties.
4.3 The Effect of Metallicity on the X-ray SED
As demonstrated in Section 4.2 for the small sample of nearby, star-forming galaxies, metallicity appears to be a key property affecting the emergent X-ray SED of a galaxy. Likewise, studies of nearby, star-forming galaxies have demonstrated that galaxy-integrated /SFR increases with decreasing metallicity, an effect which is corroborated by theoretical binary population synthesis work (e.g., Mapelli et al., 2010; Linden et al., 2010; Fragos et al., 2013a; Prestwich et al., 2013; Douna et al., 2015; Brorby et al., 2016; Basu-Zych et al., 2016; Wiktorowicz et al., 2017, 2019). This behavior can be attributed to the effects of metallicity on stellar and binary evolution and thus the characteristics of the resultant XRB population, namely the formation of more massive BHs at lower metallicities given weaker stellar winds (e.g., Mapelli et al., 2010), the formation of more high accretion rate Roche lobe overflow (RLOF) systems due to the more compact nature of the binaries at lower metallicities (e.g., Linden et al., 2010), and the wider parameter space leading to survivable common envelope phases and therefore production of RLOF systems at low metallicity (e.g., Belczynski et al., 2010; Linden et al., 2010). The net effect of metallicity on XRB production is therefore the appearance of not only more HMXBs with decreasing metallicity, but also possibly the presence of more luminous HMXBs, leading to the expectation of a population whose XLF has both a higher normalization and a flatter slope.
While observational and theoretical studies alike suggest that there are more luminous XRBs per unit SFR at lower metallicity, the effect of this enhanced /SFR on the emergent X-ray SED is not yet constrained empirically. To understand where our newly measured low-metallicity SED for VV 114 fits in with theoretical expectations for the metallicity dependence of XRB populations we must first build up a theoretically-motivated picture of the changes to the X-ray SED with metallicity.
To simulate X-ray SEDs for star-forming galaxies at different metallicities we begin with a baseline X-ray SED informed by the SED studies of the nearby star-forming galaxies shown in Figure 6 from Wik et al. (2014b), Lehmer et al. (2015), and Yukita et al. (2016). Our baseline SED is constructed from a Tbabs*(apec + vphabs*apec + vphabs*bknpow) model in XSPEC. This model choice is empirically motivated: the hot gas component in star-forming galaxies has been shown to be well-fit by two-temperature thermal plasma models (e.g., apec + vphabs*apec) across a range of SFRs as described in Section 3.1 (Strickland et al., 2004; Ott et al., 2005a, b; Grimes et al., 2005; Tüllmann et al., 2006b, a; Li & Wang, 2013; Mineo et al., 2012b; Smith et al., 2018), and studies of Milky Way XRBs and extragalactic ULXs, the dominant sources of compact emission in star-forming galaxies, show spectra well-described by broken power-laws (McClintock & Remillard, 2006; Gladstone et al., 2009; Fragos et al., 2013b). In this model we set the column densities (both foreground and intrinsic), thermal plasma temperatures and normalizations, and broken power-law break energy, photon indices and normalization to reproduce the average SED of M83, NGC 3256, NGC 253, and NGC 3310 which represent the best current empirical constraints on the form of the X-ray SED for star-forming galaxies (Wik et al., 2014b; Lehmer et al., 2015; Yukita et al., 2016).
In what follows, we use this toy model to address how the emergent SED evolves away from the solar metallicity benchmark described above due to changes in gas-phase metallicity; however, our approach is simplified, as we cannot address all the complexities of the effect of metallicity on both the hot gas and XRB emission given the relative lack of observational constraints on the X-ray emission from star-forming galaxies across a range of metallicities. We thus account for metallicity effects on this baseline spectrum in two ways: (1) through the abundances of the vphabs components; and (2) through a change to the bknpow normalization. Altering the vphabs abundances for a chosen metallicity is straightforward, where we use the Asplund et al. (2009) abundance tables in XSPEC to set the abundances relative to solar. To account for the increase in galaxy-integrated /SFR with decreasing metallicity due to XRBs, we scale the bknpow normalization from the baseline model by a factor determined from the theoretical scalings of galaxy-integrated XRB with metallicity from Fragos et al. (2013a). We choose to scale the XRB component normalization using theoretical scalings, as such scaling relations provide a physically-motivated estimate of XRB as a function of metallicity that is broadly consistent with empirical constraints. We leave the APEC model parameters fixed with changes in metallicity, as we do not yet have strong observational or theoretical constraints to show how the underlying hot gas component varies with metallicity and SFR; however, we do not expect the shape of the intrinsic hot gas component to vary strongly with stellar mass or SFR of a star-forming galaxy (e.g., Ott et al., 2005a; Grimes et al., 2005; Smith et al., 2005; Mineo et al., 2012b; Anastasopoulou et al., 2016; Smith et al., 2018; Anastasopoulou et al., 2019).
In the above described model, the APEC abundances are thus fixed at solar metallicity for all simulated SEDs, regardless of assumed gas-phase metallicity. This is in contrast to our fits to the spectra of VV 114, where we set the APEC abundances to the measured gas-phase metallicity of the galaxy. In the case of VV 114, we are able to constrain via fits to the observed spectra the characteristics of the hot gas (e.g., temperature and normalization) given the sub-solar abundance. In the case of our simulated SEDs, the APEC component temperatures and normalizations are set based on observed constraints from largely solar metallicity galaxies, thus the adopted values in the toy model are appropriate assuming solar metallicity abundances. Because the emission from hot gas in star-forming galaxies may be a complex function of metallicity, we choose not to change the APEC abundances in the simulated SEDs in order to keep the shape of the intrinsic hot gas component fixed as a function of metallicity. We stress that these are simplifying assumptions, meant to produce toy models of the X-ray SED for star-forming galaxies at different metallicities for the purposes of comparison with observed SEDs, as described below. A much larger sample of star-forming galaxies across a range of metallicities would be required to produce a more universal model for the X-ray SED on the basis of host galaxy properties such as metallicity, SFR, and stellar mass.
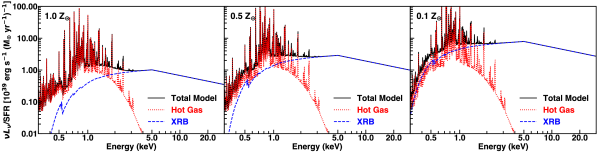
In Figure 7, we show our simulated X-ray SEDs for star-forming galaxies at , 0.5 , and 0.1 . By construction, the shape of neither the intrinsic XRB nor the intrinsic hot gas component changes in our simulated SEDs from to 0.1 ; however, the overall normalization of the SED changes with metallicity. In particular, the flux from the XRB component at 0.1 is 10 higher than at in the 0.5–8 keV band. The flux due to hot gas likewise increases from to 0.1 , albeit by a factor of 3 in the 0.5–8 keV band. The nearly order of magnitude change in the normalization of the XRB component from to 0.1 is due to the theoretical increase in XRB per unit SFR with decreasing metallicity, while the increase in normalization for the hot gas component at 0.1 relative to solar can be ascribed to decreased absorption, particularly of soft band photons, given the sub-solar metallicity assumed for the ISM.
We show the simulated SED at 0.5 as a light grey labelled line relative to the observed SED of VV 114 (green line) in Figure 5, and similarly display simulated SEDs at 1.5 , , 0.5 , and 0.1 relative to other star-forming galaxies in Figure 6. The measured SED of VV 114 becomes ULX-dominated at energies 1.5 keV and is entirely consistent with the simulated SED at 0.5 in this energy range. In other words, with the newly measured 0.3–30 keV SED of VV 114 we confirm theoretical predictions for the effect of metallicity on the high energy SED of a star-forming galaxy, namely an elevated normalization relative to solar indicative of an enhanced XRB population at lower metallicity.
By contrast, the soft band (0.5–2 keV) portion of the SED of VV 114 does not agree well with the soft band of the simulated SED at 0.5 . In particular, the emergent 0.5–2 keV flux of VV 114 is 20 higher than the flux of our simulated 0.5 SED in this same band. This discrepancy is further highlighted when comparing the hot gas versus XRB population contributions to the total soft band emission for VV 114 relative to the simulated SED. From Table 4, we find that is 40% of the total emergent soft band luminosity for VV 114, while it is 20% of the total for the simulated SED at 0.5 . Similarly, the soft band portion of the SED of NGC 3310 (blue line, Figure 6) appears elevated relative to the simulated soft band SED at 0.5 . Recently, Anastasopoulou et al. (2019) measured that the hot diffuse component of NGC 3310 constitutes 57% of the soft band emission in NGC 3310, implying that the XRB component in this galaxy likewise provides a larger share of the total soft band emission relative to expectations from the simulated SED at similar metallicity.
These results imply that the disagreement between the measured and simulated soft band SEDs at low metallicity may stem from incorrect assumptions about ISM properties and, notably, the level of intrinsic absorption, which is most important at energies 1.5 keV and likely varies galaxy to galaxy. In the low-metallicity simulated SEDs, the hot gas component is modeled with the simplified assumption that it approximates the hot ISM of a solar metallicity galaxy, where metallicity is only accounted for in the abundances set in the vphabs, or intrinsic absorption, component modifying the hot gas model. As noted above, this assumption is made in order to keep the intrinsic hot gas shape constant as a function of metallicity, and because there is a lack of observational constraints in the literature on how detailed ISM abundance patterns affect the hot gas emission. Additionally, the broken power-law normalization representing the XRB contribution to the simulated SED is scaled by the theoretical predictions for the change in XRB with metallicity from Fragos et al. (2013a); however, these theoretical scalings for XRB with metallicity are predicated on X-ray SEDs modeled after Milky Way XRBs, and therefore assume Milky Way-like intrinsic absorption modifying the XRB flux.
It is quite possible that the ISM properties of a solar metallicity galaxy are different from those of a lower metallicity galaxy such as VV 114 or NGC 3310 at the same SFR. Comparing the measured SED of VV 114 to our toy model for the X-ray SED at 0.5 suggests that the assumption of intrinsic absorption measured primarily from solar metallicity galaxies (e.g., M83, NGC 3256, and NGC 253) may be inappropriate for lower metallicity galaxies. This is possibly because more metal-poor galaxies have lower intrinsic column densities, an effect which is manifested most strongly in the soft band portion of the SED. As we do not yet have strong observational constraints on how the ISM properties change as a function of host galaxy properties (e.g., metallicity and SFR) we leave it to a future work to provide more rigorous investigation of the origins of the differences in the soft band SED in star-forming galaxies across different metallicities.
4.4 Comparison of Galaxy-Integrated Properties with Empirical and Theoretical Scaling Relations
As discussed in Section 4.2, the 0.3–30 keV SED of VV 114 displays a clearly elevated normalization relative to the X-ray SEDs of solar metallicity star-forming galaxies. In this section, we focus on comparing our results for the galaxy-integrated /SFR of VV 114 with results from previous works, as well as expected theoretical and empirical scalings of XRB /SFR for star-forming galaxies as a function of metallicity.
As reported in Table 3, we measured a galaxy-integrated total luminosity of log = 41.27 0.04 and log = 41.41 0.04 from the bknpowULX model fit to the XMM-Newton and NuSTAR spectra and the powXRB model fit to the Chandra spectrum, respectively. The only other comparable spectral analysis in the literature for VV 114 was performed by Grimes et al. (2006), using the same Chandra data as presented in this work, in addition to using shallow, archival XMM-Newton data (not used here). Their analysis found log = 41.38 for the galaxy-wide emission from fits to the Chandra spectra of the eastern and western components of the galaxy, consistent within the uncertainties of our Chandra-derived total X-ray luminosity (log = 41.41 0.04). They do not report a luminosity from their best-fit model to the archival XMM-Newton data, so we input the best-fit parameters from their model (Table 5 in Grimes et al. 2006) in XSPEC and use the flux command to derive log = 41.23 (corrected for foreground Galactic absorption), consistent with our log = 41.27 0.04 for the newly obtained XMM-Newton and NuSTAR observations. We note that this agreement is significant, as the luminosity derived from the Grimes et al. (2006) XMM-Newton model is based on archival XMM-Newton data taken at a different epoch than the XMM-Newton and NuSTAR observations presented here. This agreement therefore suggests that variability, in a galaxy-integrated sense, is not significant between the epochs at which the archival and new XMM-Newton observations were obtained.
We next turn to the comparison of XRB /SFR for VV 114 with recent theoretical and empirical constraints on the scaling of these quantities with metallicity. To get a “clean” estimate of XRB a thorough accounting of the different contributions, including resolved point sources (ULXs), unresolved XRBs, the hot ISM contribution, and any possible AGN contamination, is important. In this work, we measure XRB from the broken power-law component of the bknpowULX model fit to the XMM-Newton and NuSTAR spectra. We convert luminosities reported in different energy bands from other works to the 0.5–8 keV band using conversion factors determined from webPIMMs under the assumption of a simple power-law spectrum with = 1.7, appropriate for XRBs.
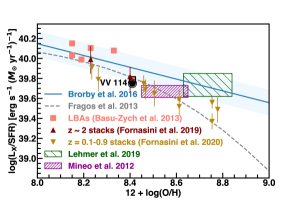
In Figure 8 we show the /SFR of VV 114, assuming a SFR of 38 yr-1, (black circle) relative to the best-fit /SFR in the same band based on fits to the XLF of star-forming galaxies from Lehmer et al. 2019 (hashed green region) and Mineo et al. 2012a (hashed purple region). The horizontal extents of each region show the mean metallicity of all galaxies in each sample and the standard deviations, which for the Lehmer et al. (2019) sample come from their Table 1 and for the Mineo et al. (2012a) sample are taken from the calculations of Fornasini et al. (2019). The vertical extents of the hashed regions represent the 1 uncertainties on both scalings. Both the Mineo et al. (2012a) and Lehmer et al. (2019) scalings should be taken as appropriate for roughly solar metallicity environments. We find the measured /SFR of VV 114 from the bknpowULX model fit to the XMM-Newton + NuSTAR spectra is a 1 outlier from the Mineo et al. (2012a) relation, but consistent with the Lehmer et al. (2019) relation within the 1 uncertainties on their XLF-derived scaling.
We next compare our derived /SFR for VV 114 to theoretical and empirical scalings for the dependence of /SFR on metallicity from Fragos et al. (2013a) and Brorby et al. (2016), respectively. In Figure 8 we show the theoretical Fragos et al. (2013a) evolution of /SFR for XRBs with metallicity from binary population synthesis models as a dashed grey line (absorbed SED model from Fragos et al. (2013a)), and the empirical findings of Brorby et al. (2016) based on analysis of the X-ray emission from a sample of Lyman break galaxies as a solid blue line, with the dispersion in their relation shown as light blue. Our measured value for VV 114 is consistent with the Brorby et al. (2016) empirical relation, though this is expected as their -SFR- scaling is derived from a sample of highly star-forming galaxies similar to VV 114. Likewise, VV 114 is consistent with the theoretical predictions from Fragos et al. (2013a), despite the different assumptions for the underlying SED in the Fragos et al. (2013a) models, which come from analyzing the spectra of Galactic BH and NS XRBs in different accretion states (Fragos et al., 2013b).
We also show three observational samples for comparison in Figure 8, namely a selection of LBAs from Basu-Zych et al. (2013a), the high-sSFR sample of galaxy stacks binned by metallicity from Fornasini et al. (2019), and the sample of galaxy stacks binned by metallicity from Fornasini et al. (2020), all of which are selected to be HMXB-dominated samples. VV 114 is included in the original Basu-Zych et al. (2013a) sample, so we plot VV 114’s XRB /SFR from Basu-Zych et al. (2013a) as the salmon square with black outline. The value for VV 114 from Basu-Zych et al. (2013a) is taken from galaxy-wide 2–10 keV luminosity from the Grimes et al. (2006) analysis. To make an appropriate comparison, we therefore correct the Basu-Zych et al. (2013a) value for VV 114 to the 0.5–8 keV band, and subtract the contribution from the hot gas component based on the galaxy-wide spectral model presented in Grimes et al. (2006). With this correction, we find the values from this work and Grimes et al. (2006) and Basu-Zych et al. (2013a) are in good agreement. Notably, all observed samples (VV 114, LBAs, stacks, and stacks) are elevated with respect to the scalings derived from XLF fitting for nearby star-forming galaxies (Mineo et al., 2012a; Lehmer et al., 2019), but are consistent with the theoretical and empirical scalings which account for the metallicity dependence of XRB populations. These results underscore the necessity of accounting for metallicity effects in studies of XRBs in star-forming environments, including future empirical constraints on the dependence of the XRB XLF on metallicity.
4.5 Soft Band SED and Relevance to IGM Thermal History
In Section 4.2, we showed that the normalization of the hard band (2–30 keV) SED of VV 114 agrees with theoretical predictions for enhanced XRB /SFR at lower metallicity. There are no such theoretical predictions currently in the literature for how the shape or normalization of the soft band (0.5–2 keV) SED scales with metallicity; however, there are past observational works which have investigated the scaling of the hot gas (as measured in the 0.5–2 keV band) in star-forming galaxies with SFR (e.g., Strickland et al., 2004; Ott et al., 2005a, b; Grimes et al., 2005; Mineo et al., 2012b; Smith et al., 2018). In particular, the Mineo et al. (2012b) study used Chandra data for a sample of 21 star-forming galaxies, covering a range of SFRs from 0.1–20 yr-1, to parametrize the linear scaling between and SFR. Below, we discuss our results for the hot gas of VV 114 derived from our best-fit SED relative to the Mineo et al. (2012b) empirical scaling, and connect this discussion to the importance of the soft band SED to the thermal history of the IGM.
From the APEC components of the bknpowULX model fit to the NuSTAR + XMM-Newton spectra (Table 3), we find (0.5–2 keV) = 1.23 1041 erg s-1 for VV 114. By contrast, the linear –SFR scaling derived from the Mineo et al. (2012b) sample predicts (0.5–2 keV) 3 1040 erg s-1 given the SFR for VV 114, a difference of 0.6 dex from our measured hot gas . It is possible the lower metallicity of VV 14 is what results in this discrepancy, as the Mineo et al. (2012b) study does not explicitly account for metallicity in deriving the hot gas –SFR scaling and quotes a dispersion of only = 0.34 dex in the relation.
Several previous X-ray studies with Chandra have also investigated the scaling of with SFR across a range of star-forming galaxies, from ULIRGs to dwarf starbursts (Grimes et al., 2005; Ott et al., 2005a, b). Notably, Ott et al. (2005a, b) studied a sample of eight dwarf starbursts using Chandra, of which the majority were low-metallicity (), finding that the diffuse gas was linearly correlated with “current” (i.e., H-based) SFR. While Ott et al. (2005a, b) did consider the gas-phase metallicity of the dwarf starbursts in their sample in the context of their study, they did not find any explicit correlation between the diffuse gas per unit SFR as a function of metallicity. Two of their lowest metallicity galaxies did not have any detected diffuse component, though they note this may because such emission was below their detection thresholds, while four of their low-metallicity ( 0.3 ) dwarf starbursts had substantial diffuse emission detected. Interestingly, they found that the diffuse emission in these dwarf starburst galaxies constituted 60–80% of the 0.3–8 keV photons from the galaxy (Ott et al., 2005a), a much higher percentage contribution from hot gas than predicted from our simulated low-metallicity SEDs presented in Section 4.3, but in line with the measured percentage contribution from diffuse emission to the soft band for the low-metallicity galaxies VV 114 and NGC 3310 ( 60%, this work and Anastasopoulou et al. 2019, respectively).
The scaling of (0.5–2 keV) with SFR and metallicity has implications for the importance of X-ray photons from star-forming galaxies at high redshift, and their effect on the thermal history of the IGM. In particular, the soft band (0.5–2 keV) portion of the X-ray SED is most important for the epoch of heating, prior to the epoch of reionization (e.g., Pacucci et al., 2014; Das et al., 2017). The mean free paths of photons at 10–20 approach the Hubble length at energies 2 keV, thus photons with energies 2 keV will effectively “free stream” through the IGM during this epoch (e.g., McQuinn, 2012).
Theoretical studies have shown that the cosmic 21-cm signal, which should be measurable with second generation interferometers such as HERA and SKA, will therefore be sensitive to the shape of the soft band SED of the first galaxies and its scaling with SFR (e.g., Mesinger et al., 2014; Greig & Mesinger, 2017). Likewise, theoretical work indicates that the timing of IGM heating is affected by the shape of the X-ray SED, with “early” heating which precedes reionization predicted for softer SEDs, and “late” heating which occurs during reionization predicted for harder SEDs (e.g., Fialkov et al., 2014). Critically, these theoretical studies often assume that the X-ray photons which heat the IGM are produced solely by XRBs in the first star-forming galaxies, without accounting for the hot gas emission from such galaxies (e.g., Fialkov et al., 2014; Madau & Fragos, 2017). As we have shown here, the hot gas emission can be substantial in the soft band, especially for low-metallicity galaxies. Thus, work such as this, which constrains both the form of the X-ray SED as well as its component parts, is critical to constraining when significant IGM heating may occur and predicting the 21-cm fluctuations measurable by next generation interferometers.
The best current empirical constraints on the soft band X-ray SED from star-forming galaxies do not account for the host galaxy metallicity and its effect on the hot gas versus XRB contribution to the emergent soft band flux (e.g., Grimes et al., 2005; Mineo et al., 2012b). Theoretical studies based on these empirical results show that there may be a factor of three difference in the 21-cm power on large scales between assuming hot gas versus XRBs dominate the soft band emission (soft versus hard spectrum, respectively) (e.g., Pacucci et al., 2014). As we might expect the pristine, low-metallicity galaxies in the early Universe to have different ISM properties than local galaxies, nearby low-metallicity galaxies such as VV 114 serve as better analogs for the first galaxies when it comes to constraining the form of the X-ray SED as it applies to the epoch of heating and the cosmic 21-cm signal. Modeling of the expected 21-cm signal shows that tuning model predictions to constraints based on local star-forming galaxies (ostensibly at solar metallicity) can lead to estimates of 5 fewer soft photons escaping the galaxy compared to a “metal-free” ISM, which is more transparent (e.g., Das et al., 2017). This, in turn, affects the thermal history of the IGM; if the ISM conditions in the early Universe are similar to star-forming galaxies today, this implies fewer soft photons escape galaxies at high redshift, leading to inefficient heating of the IGM which occurs closer to reionization.
We present evidence that VV 114 has a higher than expected elevation of per unit SFR in the soft band relative to other highly star-forming galaxies at solar metallicity (e.g., Mineo et al., 2012b; Wik et al., 2014b; Lehmer et al., 2015; Yukita et al., 2016). This may imply more soft photons escape galaxies at low metallicity at high redshift, ultimately leading to larger fluctuations in the IGM temperature, and therefore higher amplitude for the large-scale 21-cm power spectrum (Pacucci et al., 2014). As noted above, the soft band portion of the SED is in general not well calibrated down to low metallicities, but VV 114 offers tantalizing evidence that X-rays from star-forming galaxies may play a critical role in heating the IGM.
5 Summary & Future Work
Here we have measured, for the first time, the 0.3–30 keV SED of the low-metallicity, star-forming galaxy VV 114. Through detailed spectral fitting of archival Chandra as well as the newly obtained, near simultaneous XMM-Newton and NuSTAR observations we showed that the SED of VV 114 has (1) an elevated normalization relative to the X-ray SEDs of solar metallicity galaxies; and (2) a characteristic break at high energies ( 4 keV). These SED characteristics are indicative of an enhanced ULX population, which dominates the global X-ray emission from VV 114. Our findings for VV 114 are consistent with theoretical expectations, which predict a factor of at least two enhancement in the galaxy-integrated from XRBs at 0.5 relative to production of XRBs at solar metallicity.
We further show that the X-ray SED has a similar shape for star-forming galaxies of different metallicities, namely that the SED is ULX-dominated at high energies with a substantial hot gas contribution in the soft band. We also present evidence, for the first time, that VV 114 has an elevated soft band (0.5–2 keV) luminosity relative to predictions for the scaling of diffuse gas emission with SFR from previous empirical studies. This elevated soft band for VV 114 is due possibly to the more pristine ISM conditions in the galaxy given its lower metallicity. This work underlines the importance of broadening the sample of low-metallicity galaxies across a range of SFRs for which there are measured X-ray SEDs, with constraints on the contribution from both hot, diffuse gas, as well as compact sources of emission such as XRBs, to offer the best possible empirical framework for interpreting future high redshift measurements and informing binary population synthesis work.
Acknowledgements
We thank the referee for very helpful comments, which greatly improved the quality of the manuscript. K.G. and B.D.L. gratefully acknowledge financial support from NASA grant 80NSSC18K1605.
References
- Aird et al. (2017) Aird, J., Coil, A. L., & Georgakakis, A. 2017, MNRAS, 465, 3390, doi: 10.1093/mnras/stw2932
- Anastasopoulou et al. (2016) Anastasopoulou, K., Zezas, A., Ballo, L., & Della Ceca, R. 2016, MNRAS, 460, 3570, doi: 10.1093/mnras/stw1200
- Anastasopoulou et al. (2019) Anastasopoulou, K., Zezas, A., Gkiokas, V., & Kovlakas, K. 2019, MNRAS, 483, 711, doi: 10.1093/mnras/sty3131
- Anders & Grevesse (1989) Anders, E., & Grevesse, N. 1989, Geochim. Cosmochim. Acta, 53, 197, doi: 10.1016/0016-7037(89)90286-X
- Antoniou & Zezas (2016) Antoniou, V., & Zezas, A. 2016, MNRAS, 459, 528, doi: 10.1093/mnras/stw167
- Antoniou et al. (2010) Antoniou, V., Zezas, A., Hatzidimitriou, D., & Kalogera, V. 2010, ApJ, 716, L140, doi: 10.1088/2041-8205/716/2/L140
- Antoniou et al. (2019) Antoniou, V., Zezas, A., Drake, J. J., et al. 2019, ApJ, 887, 20, doi: 10.3847/1538-4357/ab4a7a
- Arnaud (1996) Arnaud, K. A. 1996, in Astronomical Society of the Pacific Conference Series, Vol. 101, Astronomical Data Analysis Software and Systems V, ed. G. H. Jacoby & J. Barnes, 17
- Asplund et al. (2009) Asplund, M., Grevesse, N., Sauval, A. J., & Scott, P. 2009, ARA&A, 47, 481, doi: 10.1146/annurev.astro.46.060407.145222
- Astropy Collaboration et al. (2013) Astropy Collaboration, Robitaille, T. P., Tollerud, E. J., et al. 2013, A&A, 558, A33, doi: 10.1051/0004-6361/201322068
- Astropy Collaboration et al. (2018) Astropy Collaboration, Price-Whelan, A. M., Sipőcz, B. M., et al. 2018, AJ, 156, 123, doi: 10.3847/1538-3881/aabc4f
- Baldwin et al. (1981) Baldwin, J. A., Phillips, M. M., & Terlevich, R. 1981, PASP, 93, 5, doi: 10.1086/130766
- Bartalucci et al. (2014) Bartalucci, I., Mazzotta, P., Bourdin, H., & Vikhlinin, A. 2014, A&A, 566, A25, doi: 10.1051/0004-6361/201423443
- Basu-Zych et al. (2016) Basu-Zych, A. R., Lehmer, B., Fragos, T., et al. 2016, ApJ, 818, 140, doi: 10.3847/0004-637X/818/2/140
- Basu-Zych et al. (2009) Basu-Zych, A. R., Gonçalves, T. S., Overzier, R., et al. 2009, ApJ, 699, L118, doi: 10.1088/0004-637X/699/2/L118
- Basu-Zych et al. (2013a) Basu-Zych, A. R., Lehmer, B. D., Hornschemeier, A. E., et al. 2013a, ApJ, 762, 45, doi: 10.1088/0004-637X/762/1/45
- Basu-Zych et al. (2013b) —. 2013b, ApJ, 774, 152, doi: 10.1088/0004-637X/774/2/152
- Belczynski et al. (2010) Belczynski, K., Dominik, M., Bulik, T., et al. 2010, ApJ, 715, L138, doi: 10.1088/2041-8205/715/2/L138
- Berghea et al. (2008) Berghea, C. T., Weaver, K. A., Colbert, E. J. M., & Roberts, T. P. 2008, ApJ, 687, 471, doi: 10.1086/591722
- Boroson et al. (2011) Boroson, B., Kim, D.-W., & Fabbiano, G. 2011, ApJ, 729, 12, doi: 10.1088/0004-637X/729/1/12
- Brorby et al. (2014) Brorby, M., Kaaret, P., & Prestwich, A. 2014, MNRAS, 441, 2346, doi: 10.1093/mnras/stu736
- Brorby et al. (2016) Brorby, M., Kaaret, P., Prestwich, A., & Mirabel, I. F. 2016, MNRAS, 457, 4081, doi: 10.1093/mnras/stw284
- Cash (1979) Cash, W. 1979, ApJ, 228, 939, doi: 10.1086/156922
- Colbert et al. (2004) Colbert, E. J. M., Heckman, T. M., Ptak, A. F., Strickland, D. K., & Weaver, K. A. 2004, ApJ, 602, 231, doi: 10.1086/380899
- Dahlem et al. (2000) Dahlem, M., Parmar, A., Oosterbroek, T., et al. 2000, ApJ, 538, 555, doi: 10.1086/309186
- Das et al. (2017) Das, A., Mesinger, A., Pallottini, A., Ferrara, A., & Wise, J. H. 2017, MNRAS, 469, 1166, doi: 10.1093/mnras/stx943
- de Grijs et al. (2003a) de Grijs, R., Anders, P., Bastian, N., et al. 2003a, MNRAS, 343, 1285, doi: 10.1046/j.1365-8711.2003.06777.x
- de Grijs et al. (2003b) de Grijs, R., Fritze-v. Alvensleben, U., Anders, P., et al. 2003b, MNRAS, 342, 259, doi: 10.1046/j.1365-8711.2003.06536.x
- Douna et al. (2015) Douna, V. M., Pellizza, L. J., Mirabel, I. F., & Pedrosa, S. E. 2015, A&A, 579, A44, doi: 10.1051/0004-6361/201525617
- Engelbracht et al. (2008) Engelbracht, C. W., Rieke, G. H., Gordon, K. D., et al. 2008, ApJ, 678, 804, doi: 10.1086/529513
- Eufrasio et al. (2017) Eufrasio, R. T., Lehmer, B. D., Zezas, A., et al. 2017, ApJ, 851, 10, doi: 10.3847/1538-4357/aa9569
- Fabbiano (2006) Fabbiano, G. 2006, ARA&A, 44, 323, doi: 10.1146/annurev.astro.44.051905.092519
- Fialkov et al. (2014) Fialkov, A., Barkana, R., & Visbal, E. 2014, Nature, 506, 197, doi: 10.1038/nature12999
- Fialkov et al. (2017) Fialkov, A., Cohen, A., Barkana, R., & Silk, J. 2017, MNRAS, 464, 3498, doi: 10.1093/mnras/stw2540
- Fornasini et al. (2020) Fornasini, F. M., Civano, F., & Suh, H. 2020, MNRAS, 495, 771, doi: 10.1093/mnras/staa1211
- Fornasini et al. (2019) Fornasini, F. M., Kriek, M., Sanders, R. L., et al. 2019, ApJ, 885, 65, doi: 10.3847/1538-4357/ab4653
- Fragos et al. (2013a) Fragos, T., Lehmer, B. D., Naoz, S., Zezas, A., & Basu-Zych, A. 2013a, ApJ, 776, L31, doi: 10.1088/2041-8205/776/2/L31
- Fragos et al. (2013b) Fragos, T., Lehmer, B., Tremmel, M., et al. 2013b, ApJ, 764, 41, doi: 10.1088/0004-637X/764/1/41
- Fruscione et al. (2006) Fruscione, A., McDowell, J. C., Allen, G. E., et al. 2006, in Proc. SPIE, Vol. 6270, Society of Photo-Optical Instrumentation Engineers (SPIE) Conference Series, 62701V, doi: 10.1117/12.671760
- Garofali et al. (2018) Garofali, K., Williams, B. F., Hillis, T., et al. 2018, MNRAS, 479, 3526, doi: 10.1093/mnras/sty1612
- Garofali et al. (2017) Garofali, K., Williams, B. F., Plucinsky, P. P., et al. 2017, MNRAS, 472, 308, doi: 10.1093/mnras/stx1905
- Gilfanov (2004) Gilfanov, M. 2004, MNRAS, 349, 146, doi: 10.1111/j.1365-2966.2004.07473.x
- Gladstone et al. (2009) Gladstone, J. C., Roberts, T. P., & Done, C. 2009, MNRAS, 397, 1836, doi: 10.1111/j.1365-2966.2009.15123.x
- Greig & Mesinger (2017) Greig, B., & Mesinger, A. 2017, MNRAS, 472, 2651, doi: 10.1093/mnras/stx2118
- Grimes et al. (2006) Grimes, J. P., Heckman, T., Hoopes, C., et al. 2006, ApJ, 648, 310, doi: 10.1086/505680
- Grimes et al. (2005) Grimes, J. P., Heckman, T., Strickland, D., & Ptak, A. 2005, ApJ, 628, 187, doi: 10.1086/430692
- Grimm et al. (2003) Grimm, H. J., Gilfanov, M., & Sunyaev, R. 2003, MNRAS, 339, 793, doi: 10.1046/j.1365-8711.2003.06224.x
- Günther et al. (2017) Günther, H. M., Frost, J., & Theriault-Shay, A. 2017, AJ, 154, 243, doi: 10.3847/1538-3881/aa943b
- Harrison et al. (2013) Harrison, F. A., Craig, W. W., Christensen, F. E., et al. 2013, ApJ, 770, 103, doi: 10.1088/0004-637X/770/2/103
- Hartwell et al. (2004) Hartwell, J. M., Stevens, I. R., Strickland, D. K., Heckman, T. M., & Summers, L. K. 2004, MNRAS, 348, 406, doi: 10.1111/j.1365-2966.2004.07375.x
- HEASARC (2014) HEASARC. 2014, HEAsoft: Unified Release of FTOOLS and XANADU. http://ascl.net/1408.004
- Heckman et al. (2005) Heckman, T. M., Hoopes, C. G., Seibert, M., et al. 2005, ApJ, 619, L35, doi: 10.1086/425979
- HI4PI Collaboration et al. (2016) HI4PI Collaboration, Ben Bekhti, N., Flöer, L., et al. 2016, A&A, 594, A116, doi: 10.1051/0004-6361/201629178
- Hoopes et al. (2007) Hoopes, C. G., Heckman, T. M., Salim, S., et al. 2007, ApJS, 173, 441, doi: 10.1086/516644
- Hunter (2007) Hunter, J. D. 2007, Computing In Science & Engineering, 9, 90, doi: 10.1109/MCSE.2007.55
- Iono et al. (2013) Iono, D., Saito, T., Yun, M. S., et al. 2013, PASJ, 65, L7, doi: 10.1093/pasj/65.3.L7
- Joye & Mandel (2003) Joye, W. A., & Mandel, E. 2003, in Astronomical Society of the Pacific Conference Series, Vol. 295, Astronomical Data Analysis Software and Systems XII, ed. H. E. Payne, R. I. Jedrzejewski, & R. N. Hook, 489
- Kouroumpatzakis et al. (2020) Kouroumpatzakis, K., Zezas, A., Sell, P., et al. 2020, MNRAS, 494, 5967, doi: 10.1093/mnras/staa1063
- Kroupa (2001) Kroupa, P. 2001, MNRAS, 322, 231, doi: 10.1046/j.1365-8711.2001.04022.x
- Kuntz & Snowden (2000) Kuntz, K. D., & Snowden, S. L. 2000, ApJ, 543, 195, doi: 10.1086/317071
- Le Floc’h et al. (2002) Le Floc’h, E., Charmandaris, V., Laurent, O., et al. 2002, A&A, 391, 417, doi: 10.1051/0004-6361:20020784
- Lehmer et al. (2010) Lehmer, B. D., Alexander, D. M., Bauer, F. E., et al. 2010, ApJ, 724, 559, doi: 10.1088/0004-637X/724/1/559
- Lehmer et al. (2013) Lehmer, B. D., Wik, D. R., Hornschemeier, A. E., et al. 2013, ApJ, 771, 134, doi: 10.1088/0004-637X/771/2/134
- Lehmer et al. (2015) Lehmer, B. D., Tyler, J. B., Hornschemeier, A. E., et al. 2015, ApJ, 806, 126, doi: 10.1088/0004-637X/806/1/126
- Lehmer et al. (2016) Lehmer, B. D., Basu-Zych, A. R., Mineo, S., et al. 2016, ApJ, 825, 7, doi: 10.3847/0004-637X/825/1/7
- Lehmer et al. (2017) Lehmer, B. D., Eufrasio, R. T., Markwardt, L., et al. 2017, ApJ, 851, 11, doi: 10.3847/1538-4357/aa9578
- Lehmer et al. (2019) Lehmer, B. D., Eufrasio, R. T., Tzanavaris, P., et al. 2019, ApJS, 243, 3, doi: 10.3847/1538-4365/ab22a8
- Lehmer et al. (2020) Lehmer, B. D., Ferrell, A. P., Doore, K., et al. 2020, ApJS, 248, 31, doi: 10.3847/1538-4365/ab9175
- Li & Wang (2013) Li, J.-T., & Wang, Q. D. 2013, MNRAS, 435, 3071, doi: 10.1093/mnras/stt1501
- Linden et al. (2010) Linden, T., Kalogera, V., Sepinsky, J. F., et al. 2010, ApJ, 725, 1984, doi: 10.1088/0004-637X/725/2/1984
- Lumb et al. (2002) Lumb, D. H., Warwick, R. S., Page, M., & De Luca, A. 2002, A&A, 389, 93, doi: 10.1051/0004-6361:20020531
- Maccarone et al. (2016) Maccarone, T. J., Yukita, M., Hornschemeier, A., et al. 2016, MNRAS, 458, 3633, doi: 10.1093/mnras/stw530
- Madau & Fragos (2017) Madau, P., & Fragos, T. 2017, ApJ, 840, 39, doi: 10.3847/1538-4357/aa6af9
- Madsen et al. (2015) Madsen, K. K., Harrison, F. A., Markwardt, C. B., et al. 2015, ApJS, 220, 8, doi: 10.1088/0067-0049/220/1/8
- Mapelli et al. (2010) Mapelli, M., Ripamonti, E., Zampieri, L., Colpi, M., & Bressan, A. 2010, MNRAS, 408, 234, doi: 10.1111/j.1365-2966.2010.17048.x
- Martin et al. (2002) Martin, C. L., Kobulnicky, H. A., & Heckman, T. M. 2002, ApJ, 574, 663, doi: 10.1086/341092
- Mas-Hesse & Kunth (1999) Mas-Hesse, J. M., & Kunth, D. 1999, A&A, 349, 765. https://arxiv.org/abs/astro-ph/9812072
- McClintock & Remillard (2006) McClintock, J. E., & Remillard, R. A. 2006, Black hole binaries, Vol. 39, 157–213
- McQuinn (2012) McQuinn, M. 2012, MNRAS, 426, 1349, doi: 10.1111/j.1365-2966.2012.21792.x
- Mesinger et al. (2014) Mesinger, A., Ewall-Wice, A., & Hewitt, J. 2014, MNRAS, 439, 3262, doi: 10.1093/mnras/stu125
- Mesinger et al. (2013) Mesinger, A., Ferrara, A., & Spiegel, D. S. 2013, MNRAS, 431, 621, doi: 10.1093/mnras/stt198
- Mineo et al. (2012a) Mineo, S., Gilfanov, M., & Sunyaev, R. 2012a, MNRAS, 419, 2095, doi: 10.1111/j.1365-2966.2011.19862.x
- Mineo et al. (2012b) —. 2012b, MNRAS, 426, 1870, doi: 10.1111/j.1365-2966.2012.21831.x
- Mirocha (2014) Mirocha, J. 2014, MNRAS, 443, 1211, doi: 10.1093/mnras/stu1193
- Molina et al. (2006) Molina, M., Malizia, A., Bassani, L., et al. 2006, MNRAS, 371, 821, doi: 10.1111/j.1365-2966.2006.10715.x
- Moustakas & Kennicutt (2006) Moustakas, J., & Kennicutt, Robert C., J. 2006, ApJS, 164, 81, doi: 10.1086/500971
- Ott et al. (2005a) Ott, J., Walter, F., & Brinks, E. 2005a, MNRAS, 358, 1423, doi: 10.1111/j.1365-2966.2005.08862.x
- Ott et al. (2005b) —. 2005b, MNRAS, 358, 1453, doi: 10.1111/j.1365-2966.2005.08863.x
- Pacucci et al. (2014) Pacucci, F., Mesinger, A., Mineo, S., & Ferrara, A. 2014, MNRAS, 443, 678, doi: 10.1093/mnras/stu1240
- Park et al. (2019) Park, J., Mesinger, A., Greig, B., & Gillet, N. 2019, MNRAS, 484, 933, doi: 10.1093/mnras/stz032
- Pettini & Pagel (2004) Pettini, M., & Pagel, B. E. J. 2004, MNRAS, 348, L59, doi: 10.1111/j.1365-2966.2004.07591.x
- Prestwich et al. (2015) Prestwich, A. H., Jackson, F., Kaaret, P., et al. 2015, ApJ, 812, 166, doi: 10.1088/0004-637X/812/2/166
- Prestwich et al. (2013) Prestwich, A. H., Tsantaki, M., Zezas, A., et al. 2013, ApJ, 769, 92, doi: 10.1088/0004-637X/769/2/92
- Rana et al. (2015) Rana, V., Harrison, F. A., Bachetti, M., et al. 2015, ApJ, 799, 121, doi: 10.1088/0004-637X/799/2/121
- Remillard & McClintock (2006) Remillard, R. A., & McClintock, J. E. 2006, ARA&A, 44, 49, doi: 10.1146/annurev.astro.44.051905.092532
- Saito et al. (2015) Saito, T., Iono, D., Yun, M. S., et al. 2015, ApJ, 803, 60, doi: 10.1088/0004-637X/803/2/60
- Smith et al. (2018) Smith, B. J., Campbell, K., Struck, C., et al. 2018, AJ, 155, 81, doi: 10.3847/1538-3881/aaa1a6
- Smith et al. (2005) Smith, B. J., Struck, C., & Nowak, M. A. 2005, AJ, 129, 1350, doi: 10.1086/427858
- Strickland et al. (2004) Strickland, D. K., Heckman, T. M., Colbert, E. J. M., Hoopes, C. G., & Weaver, K. A. 2004, ApJS, 151, 193, doi: 10.1086/382214
- Strüder et al. (2001) Strüder, L., Briel, U., Dennerl, K., et al. 2001, A&A, 365, L18, doi: 10.1051/0004-6361:20000066
- Summers et al. (2003) Summers, L. K., Stevens, I. R., Strickland, D. K., & Heckman, T. M. 2003, MNRAS, 342, 690, doi: 10.1046/j.1365-8711.2003.06590.x
- Trancho et al. (2007) Trancho, G., Bastian, N., Miller, B. W., & Schweizer, F. 2007, ApJ, 664, 284, doi: 10.1086/518886
- Tüllmann et al. (2006a) Tüllmann, R., Breitschwerdt, D., Rossa, J., Pietsch, W., & Dettmar, R. J. 2006a, A&A, 457, 779, doi: 10.1051/0004-6361:20054743
- Tüllmann et al. (2006b) Tüllmann, R., Pietsch, W., Rossa, J., Breitschwerdt, D., & Dettmar, R. J. 2006b, A&A, 448, 43, doi: 10.1051/0004-6361:20052936
- Turner et al. (2001) Turner, M. J. L., Abbey, A., Arnaud, M., et al. 2001, A&A, 365, L27, doi: 10.1051/0004-6361:20000087
- Walton et al. (2013) Walton, D. J., Fuerst, F., Harrison, F., et al. 2013, ApJ, 779, 148, doi: 10.1088/0004-637X/779/2/148
- Walton et al. (2015) Walton, D. J., Middleton, M. J., Rana, V., et al. 2015, ApJ, 806, 65, doi: 10.1088/0004-637X/806/1/65
- Weaver et al. (2000) Weaver, K. A., Heckman, T. M., & Dahlem, M. 2000, ApJ, 534, 684, doi: 10.1086/308786
- Wik et al. (2014a) Wik, D. R., Hornstrup, A., Molendi, S., et al. 2014a, ApJ, 792, 48, doi: 10.1088/0004-637X/792/1/48
- Wik et al. (2014b) Wik, D. R., Lehmer, B. D., Hornschemeier, A. E., et al. 2014b, ApJ, 797, 79, doi: 10.1088/0004-637X/797/2/79
- Wiktorowicz et al. (2019) Wiktorowicz, G., Lasota, J.-P., Middleton, M., & Belczynski, K. 2019, ApJ, 875, 53, doi: 10.3847/1538-4357/ab0f27
- Wiktorowicz et al. (2017) Wiktorowicz, G., Sobolewska, M., Lasota, J.-P., & Belczynski, K. 2017, ApJ, 846, 17, doi: 10.3847/1538-4357/aa821d
- Winter et al. (2009) Winter, L. M., Mushotzky, R. F., Terashima, Y., & Ueda, Y. 2009, ApJ, 701, 1644, doi: 10.1088/0004-637X/701/2/1644
- Winter et al. (2008) Winter, L. M., Mushotzky, R. F., Tueller, J., & Markwardt, C. 2008, ApJ, 674, 686, doi: 10.1086/525274
- Yukita et al. (2016) Yukita, M., Hornschemeier, A. E., Lehmer, B. D., et al. 2016, ApJ, 824, 107, doi: 10.3847/0004-637X/824/2/107
- Zaritsky et al. (1994) Zaritsky, D., Kennicutt, Robert C., J., & Huchra, J. P. 1994, ApJ, 420, 87, doi: 10.1086/173544