Observations of [OI]63 m line emission in main-sequence galaxies at ††thanks: Herschel is an ESA space observatory with science instruments provided by European-led Principal Investigator consortia and with important participation from NASA.
Abstract
We present Herschel-PACS spectroscopy of four main-sequence star-forming galaxies at . We detect [OI]63 m line emission in BzK-21000 at , and measure a line luminosity, L L⊙. Our PDR modelling of the interstellar medium in BzK-21000 suggests a UV radiation field strength, , and gas density, cm-3, consistent with previous LVG modelling of the molecular CO line excitation. The other three targets in our sample are individually undetected in these data, and we perform a spectral stacking analysis which yields a detection of their average emission and an [OI]63 m line luminosity, L L⊙. We find that the implied luminosity ratio, LLIR, of the undetected BzK-selected star-forming galaxies broadly agrees with that of low-redshift star-forming galaxies, while BzK-21000 has a similar ratio to that of a dusty star-forming galaxy at . The high [OI]63 m line luminosities observed in BzK-21000 and the dusty and submm luminous star-forming galaxies may be associated with extended reservoirs of low density, cool neutral gas.
keywords:
galaxies: high-redshift – galaxies: star formation – galaxies: ISM – infrared: ISM1 Introduction
The Cosmic star-formation rate density is known to have been significantly higher in the past (see review by Madau & Dickson 2014). This galaxy formation will have been fed by larger molecular gas masses than what is observed in present day galaxies, as confirmed by observations of redshifted CO line emission (see review by Carilli & Walter 2013). A significant contributor to the star-formation rate density of the Universe at the peak epoch of galaxy build up () was the population of massive star-forming main-sequence galaxies (Brinchmann et al. 2004; Daddi et al. 2007; Elbaz et al. 2007; Rodighiero et al. 2011; Sargent et al. 2012). Several studies of molecular CO line emission have concluded that these galaxies have long depletion timescales, high molecular gas fractions and typically evolve secularly with redshift (e.g. Daddi et al. 2010a,b; Tacconi et al. 2010, 2013, 2018; Freundlich et al. 2019). In general, considerable advances have been made in our understanding of the molecular and atomic interstellar medium (ISM) properties of main-sequence galaxies at (Dannerbauer et al. 2009; Aravena et al. 2010, 2019; Tacconi et al. 2013, 2018; Daddi et al. 2015; Genzel et al. 2015; Decarli et al. 2016; Valentino et al. 2018, 2020; Zanella et al. 2018; Brisbin et al. 2019).
Owing to their brightness at rest-frame FIR wavelengths, the ionized and neutral species of Carbon, Nitrogen and Oxygen are powerful diagnostic lines for tracing the ISM of nearby and distant galaxies. When combined with photo-dissociation region (PDR) models (Tielens & Hollenbach 1985), measurement of the emission from different lines provides a means to constrain quantities such as the ionization rate and metallicity of the ISM of galaxies. Multi-level FIR transition lines have now been widely surveyed in local galaxies, originally by ISO (e.g. Luhman et al. 1998; Malhotra et al. 2001) and more recently using the PACS spectrometer (Poglitsch et al. 2010) on the ESA Herschel Space Observatory (Pilbratt et al. 2010). The [CII]158 m line is typically the brightest in star-forming galaxies, arising from ionized, and even neutral gas where it is the main coolant (Wolfire et al. 2003). Another commonly observed FIR line tracer of the ionized ISM is [NII]122 m. It has the advantage that it can be found associated with lower excitation gas, close to that observed in our own Galaxy (e.g. Goldsmith et al. 2015; Herrera-Camus et al. 2016). Another major coolant of the ISM is [OI]63 m (Wolfire et al. 2003). Owing to its high excitation temperature and critical density, it can dominate the cooling in regions of starburst activity (Kaufman et al. 1999, 2006; Brauher et al. 2008; Croxall et al. 2012; Narayanan & Krumholz 2017). When combined with measurements of the [CII]158 m line intensity and FIR luminosity, the [OI]63 m line intensity can constrain the FUV field, , and the gas density using PDR models. The luminosity in these FIR lines generally exhibits a deficit in the most FIR luminous galaxies compared to the trend expected from lower luminosity galaxies (e.g. Malhotra et al. 2001; Graciá-Carpio et al. 2011; Diaz-Santos et al. 2017). This has made the emission from lines like [OI]63 m more challenging to detect at high-redshifts.
Studies of the [OI]63 m line in the distant Universe have been further limited by the opacity of the atmosphere. Space-based observations provide the most promising route to detecting this line in either emission or absorption during the epoch of peak star-formation. The Herschel-PACS spectrometer enabled observations of the [OI]63 m line emission in high-redshift, submm-selected starburst galaxies (Sturm et al. 2010; Coppin et al. 2012; Brisbin et al. 2015; Wardlow et al. 2017; Zhang et al. 2018), which confirm the FIR line deficit observed in nearby luminous and ultraluminous galaxies. Most recently, Rybak et al. (2020) have made a ground-based detection of [OI]63 m in G09.83808, a dusty z6 galaxy, and from these data they infer a gas density, cm-3, and FUV field strength, G G0111Note that is the Habing field unit and is equal to erg s-1 cm-2.. To date, few observations of this line have been presented for lower redshift, main sequence star-forming objects like the BzK galaxies.
Here, we present Herschel-PACS spectroscopy of four BzK-selected star-forming galaxies at . The paper is organized as follows: in Section 2 we describe the sample selection along with the Herschel-PACS observations and data analysis. In Section 3 we present our results and discussion, including PDR modelling of the luminosity ratios. Finally, we conclude in Section 4. Throughout this work, we adopt a flat CDM cosmology with parameters measured by Planck Collaboration et al. (2016).
2 Observations and Data Reduction
2.1 Selection of BzK galaxy sample
Our targets were selected to be massive (), disk galaxies at , detected in multiple CO line transitions (Daddi et al. 2008, 2010a,b, 2015; Dannerbauer et al. 2009; Aravena et al. 2010). There were four main-sequence galaxies with observations of multiple CO line transitions at the time of the proposal, and all benefitted from a wealth of multi-wavelength data covering UV-to-cm wavelengths (Capak et al. 2004; Wirth et al. 2004; Barger et al. 2008; Magdis et al. 2010, 2012; Morrison et al. 2010; Teplitz et al. 2011). The data have been used to measure infrared luminosities, L L⊙, and estimate star-formation rates of M⊙ yr-1. With the exception of BzK-17999 which has not been detected in CO J =1-0 line emission, all of our sources have been observed in CO J =1-0, 2-1, 3-2 and 5-4 line emission. Some of the observational properties of our targets are provided in Table 1.
| Source name | Source properties | Observation Parameters | [OI]63 m Spectral Measurements | ||||||
|---|---|---|---|---|---|---|---|---|---|
| R.A. | Dec. | zCO | LIR | OD | ObsID | Obs. time | Integrated intensity | rms per 80 km s-1 | |
| (J2000) | L⊙ | (hrs) | (Jy kms s-1) | (mJy) | |||||
| BzK-4171 | 12:36:26.516 | 62:08:35.25 | 1.4652 | 1.0 | 1140 | 1342247456 | 9.0 | (3-) | 3.5 |
| BzK-21000 | 12:37:10.597 | 62:22:34.60 | 1.5213 | 2.1 | 1132 | 1342247133 | 7.5 | 15.32.7 | 9.1 |
| BzK-16000 | 12:36:30.120 | 62:14:28.00 | 1.5250 | 0.7 | 1306 | 1342256932, 1342247133 | 9.6 | (3-) | 12.9 |
| BzK-17999 | 12:37:51.819 | 62:15:20.16 | 1.4139 | 1.1 | 1133 | 1342247156 | 6.3 | (3-) | 16.5 |
2.2 Observing setup and pipeline processing
Observations were made with the PACS integral field unit (IFU) spectrometer on board the Herschel Space Observatory (OT2_maravena_3, PI: M. Aravena) during June and December, 2012. At the redshifts of our targets, the [OI]63 m line will be redshifted to the 103 to 190m R1 band, which we have used along with the high spectral sample density mode. The sky background subtraction was achieved using a chop-nod technique and the total on-sky observing times are given in Table 1. The PACS integral field spectrometer consisted of 55 spatial pixels, where each is connected to two arrays of 16 spectral pixels. Each spectrometer spatial pixel (or spaxel) has an approximate size of at these wavelengths, and the line emission is unresolved over these angular scales (Daddi et al. 2010a,b).
Data reduction was performed using the PACS data reduction and calibration pipeline. We follow a similar recipe to that of Coppin et al. (2012) in our data processing, using Herschel Interactive Processing Environment (HIPE v12.1.0; Ott 2010) and calibration tree version 58. This pipeline scales the continuum in each pixel to the median value in order to perform the flat-field correction, and then subsequently combines the nods for sky removal. As our sources are expected to be unresolved at the resolution of these observations, the spectra are extracted at the central pixel position. The spectra have a resolution of 40 km s-1 prior to resampling. No continuum emission is detected from the targets in our sample.
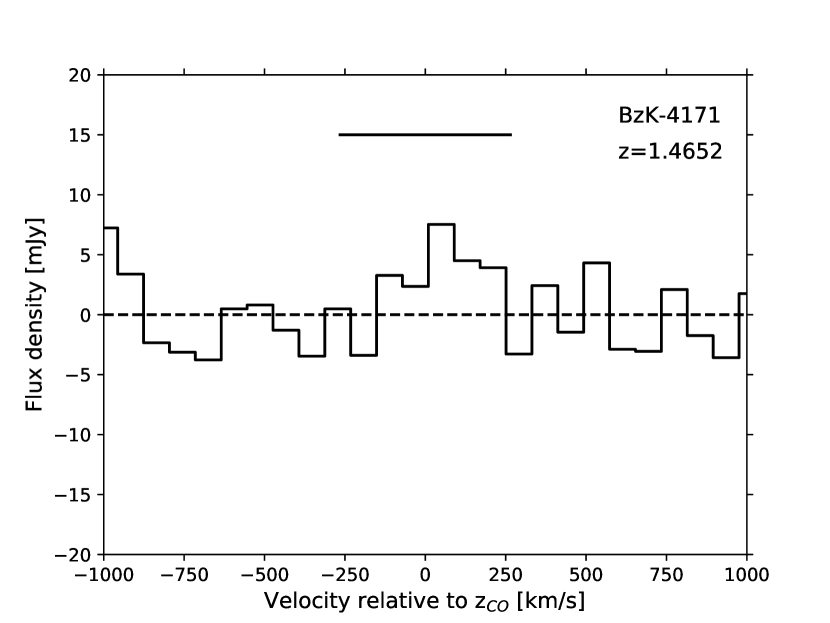
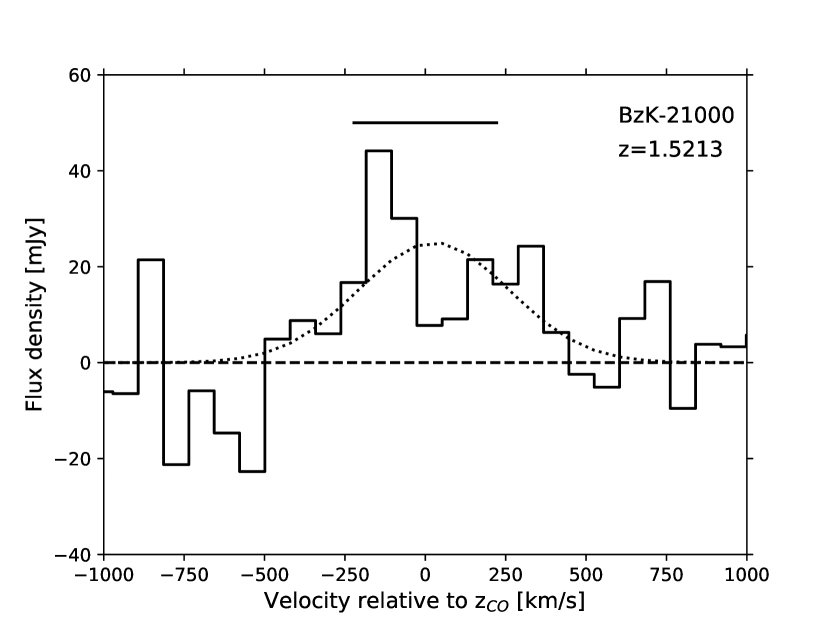
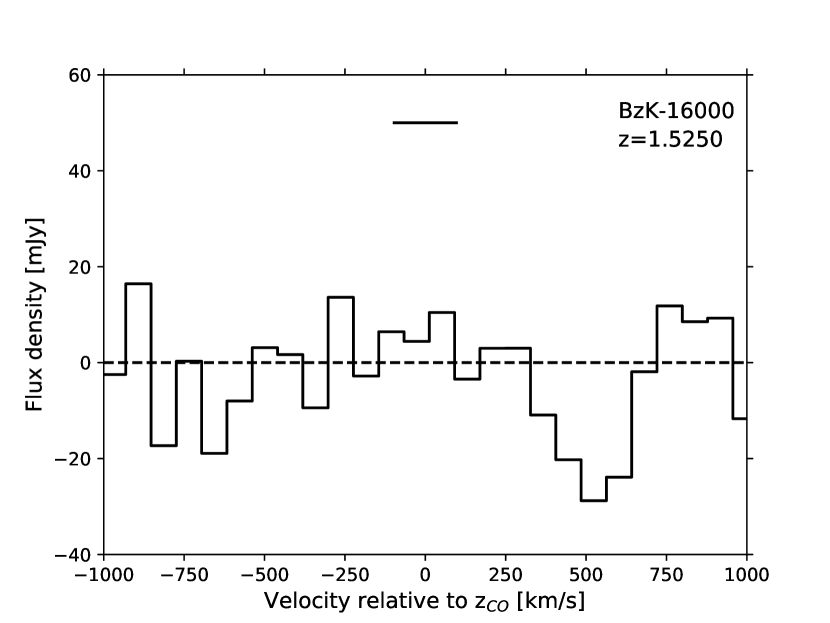
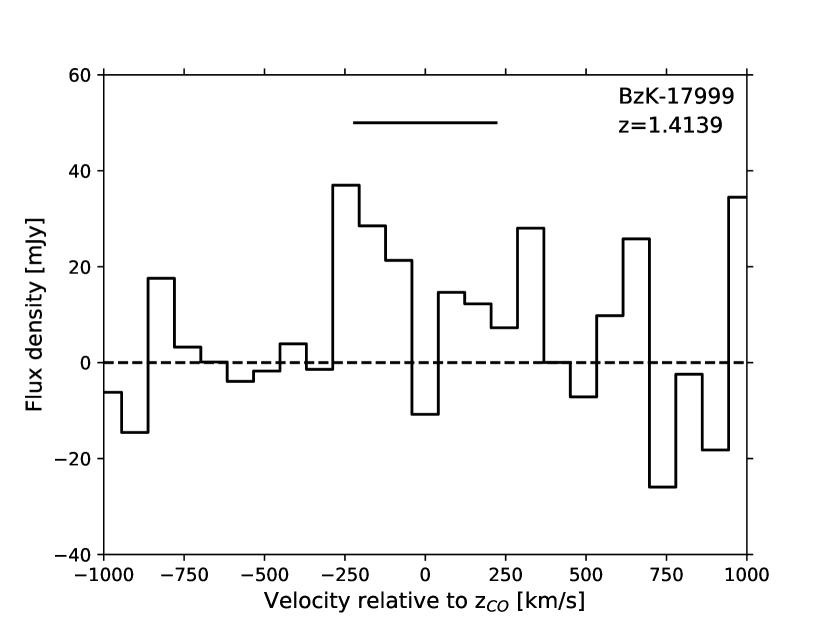
The pipeline processed spectra are all modelled with a third order polynomial fit to the regions of the data which are expected to be line-free as indicated by the width of the previously detected CO lines. This polynomial was deemed to be the lowest order which best represented the off-line spectral baseline structure while not introducing a spurious signal at the expected line wavelength. We also excluded channels at the outer edges of the band in our fitting, as these are known to be noisy in PACS spectra (e.g. Coppin et al. 2012). The total region included in the line fitting corresponds to 3000 km s-1. Figure 1 shows plots of the spectra following baseline subtraction, and resampling to 80 km s-1.
3 Results and Discussion
3.1 Detection of [OI]63 m in BzK-21000
Of the four targets observed in our programme, we detect [OI]63 m line emission only in BzK-21000 at . The integrated line intensity is detected with a signal-to-noise of 5.7- (see Table 1). Although there is a hint of positive emission in the spectra of BzK-4171 and BzK-17999, the significance of the integrated intensity is formally less than 3- in each case. We calculate a line luminosity for BzK-21000, L L⊙. When compared to galaxies in the nearby Universe, this line luminosity is only similar to that observed in the low-redshift ULIRG, NGC6240 (Diaz-Santos et al. 2017), a prototypical dual AGN known to be undergoing a merger (e.g. de Vaucouleurs et al. 1964; Komossa et al. 2003; Wang et al. 2014). The line to infrared luminosity ratio in NGC6240 is nearly 70% higher than that observed in BzK-21000, possibly due to an absence of AGN activity in the latter. We discuss this further below.
The other three sources are individually undetected in these data and we compute 3- upper-limits to the integrated line intensities, (Isaak et al. 2004; Wagg et al. 2007). and are the channel linewidths and rms per channel, respectively, while is the assumed linewidth of the [OI]63 m based on previous CO J=2-1 line measurements (Daddi et al. 2010a,b). We assume FWHM linewidths of 530, 194, and 440 km s-1 when calculating the [OI]63 m line intensity limits for BzK-4171, BzK-16000 and BzK-17999, respectively. Table 1 provides the calculated 3- upper-limits on the integrated line intensity.
3.2 Spectral line stacking
Although the [OI]63 m line emission is not detected in three of our targets, we perform a stacking analysis of the spectra of the three undetected sources in order to determine if the line might be detectable with more sensitive observations. Our approach is to calculate the weighted mean of individual spectra, , after first normalizing such that each is divided by the source FIR luminosity and then scaled by 1012 [L⊙].
| (1) |
For the weighting we take the measured rms of the spectra, , and assume weighting, and . Both weighting schemes give similar results, and in Figure 2 we plot the results obtained assuming . The average infrared luminosity of the three galaxies is L⊙.
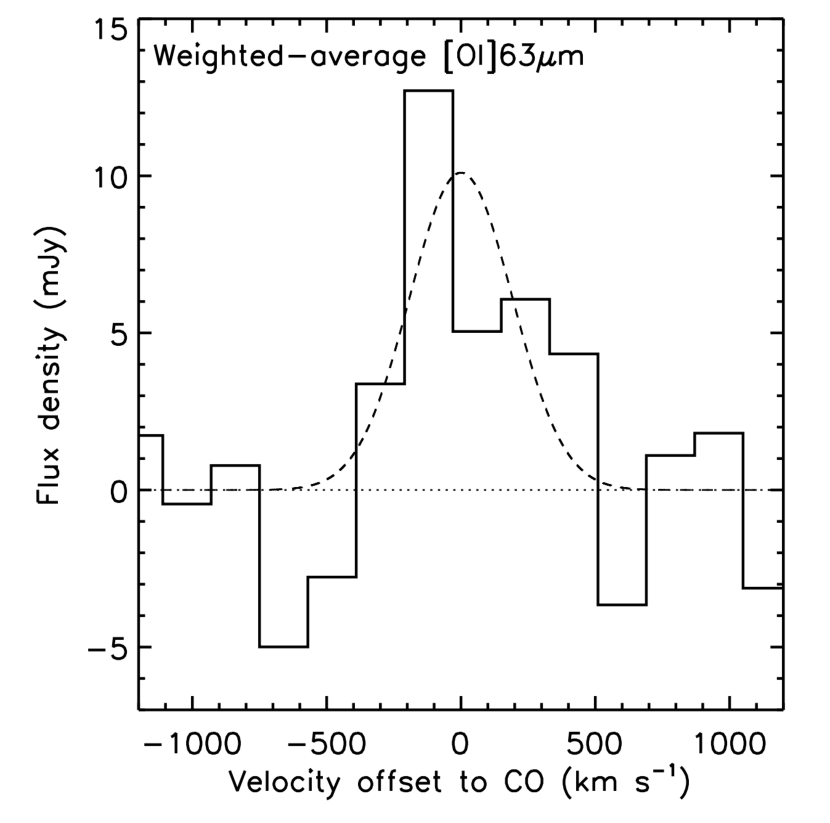
The results of our stacking analysis reveal a significant detection of the [OI]63 m line emission with an integrated intensity, Jy km s-1. As all three galaxies are at a similar redshift, we can assume a common luminosity distance and therefore calculate a line luminosity from the integrated intensity of the stacked spectrum, L L⊙.
3.3 Luminosity ratios and PDR modelling
Assuming that the line emission is cospatial with the thermal dust continuum emission, we calculate the ratio of the [OI]63m line luminosity in BzK-21000 to its total 8-1000m infrared luminosity measured by Magdis et al. (2012). These authors use photometry from Herschel PACS and SPIRE to constrain the full infrared spectral energy distributions of the targets in our sample. The measured luminosities are presented in Table 1. From this we calculate a luminosity ratio, , for BzK-21000.
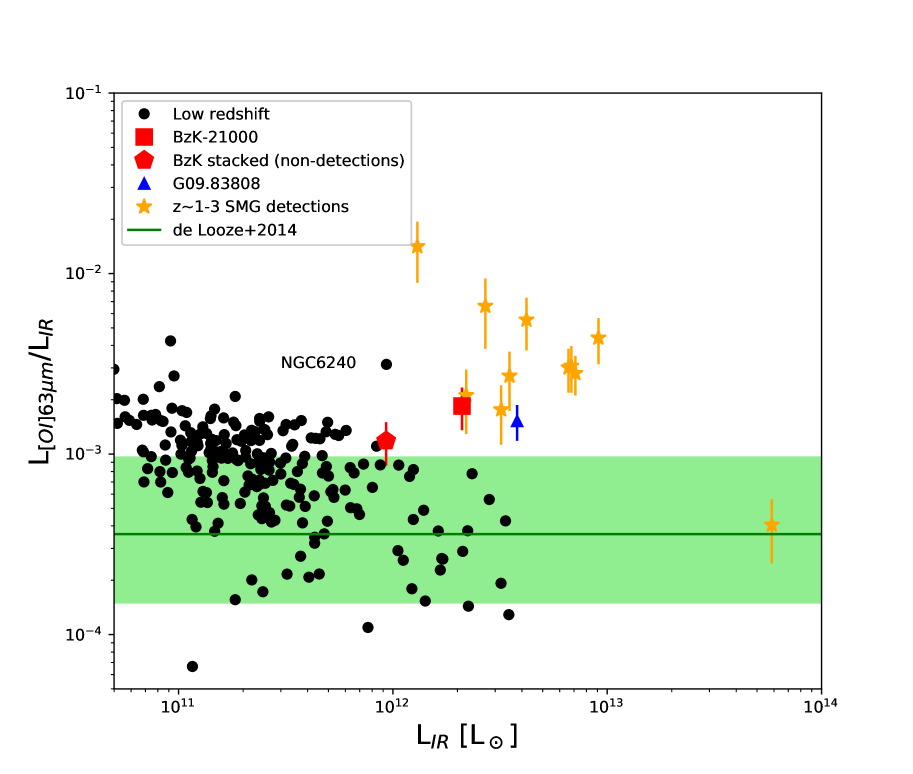
In Figure 3 we plot the [OI]63 line-to-infrared luminosity ratio of galaxies as a function of infrared luminosity. The luminosity ratio for BzK-21000 is compared to the low-redshift GOALS sample of star-forming galaxies and AGN (Diaz-Santos et al. 2017), along with the average ratio derived by de Looze et al. (2014). Also plotted are the luminosity ratios of the submm galaxies at detected using Herschel-PACS (Coppin et al. 2012; Brisbin et al. 2015; Zhang et al. 2018), where three of the 8 to 1000 m infrared luminosities are from Swinbank et al. (2014), and the APEX telescope detection of [OI]63m emission in a gravitationally lensed, dusty galaxy at (Rybak et al. 2020). All of our error bars include an additional 20% to account for instrumental calibration uncertainty on the line measurements.
The high-redshift galaxies detected in [OI]63 line emission tend to exhibit a higher line-to-infrared luminosity ratio than that of typical galaxies in the nearby Universe. One of the clear exceptions to this is NGC6240, exhibiting both a high infrared luminosity ( L) and strong [OI]63m line emission ( L⊙). This dual AGN is known to have a very warm and dense ISM, as revealed by studies of molecular CO line emission and dense gas tracers HCN and HCO+ (e.g. Greve et al. 2009; Meijerink et al. 2013; Scoville et al. 2015; Treister et al. 2020) . It also appears to have a nuclear outflow traced by molecular gas (van der Werf et al. 1993; Iono et al. 2007; Feruglio et al. 2013; Cicone et al. 2018). It is possible that the extreme physical conditions of the ISM of NGC6240 may have some similarities with that of high-redshift submm starburst galaxies and AGN detected in the [OI]63m line, however we note that both high-redshift submm galaxies and main-sequence galaxies generally exhibit lower CO line excitation. The presence of an AGN may be a contributing factor, as up to four of the submm galaxies with strong [OI]63m line emission are thought to contain an AGN. The optical and UV lines in SMMJ030227.73 +000653.5 suggest that an AGN is present (Swinbank et al. 2004; Takata et al. 2006), while SDSS J120602.09+514229.5 shows weak evidence in the form of a strong [S IV] line and hot mid-infrared colours (Fadely et al. 2010). LESS66 has a Chandra X-ray counterpart (Wang et al. 2013) and MIPS 22530 is tentatively believed to host an AGN based on an analysis of its radio emission (Sajina et al. 2008).
Another possible interpretation of the high [OI]63 line luminosity observed in submm galaxies and BzK-21000, is that this emission arises from an extended reservoir of cool and low density, neutral gas within these galaxies. Such a scenario would be consistent with the low molecular CO line excitation observed in main sequence galaxies (e.g. Daddi et al. 2008, 2010a, 2015, Dannerbauer et al. 2009; Aravena et al. 2010), and the extended reservoirs of cold molecular gas traced by CO J=1-0 in some submm galaxies (e.g. Ivison et al. 2010, 2011; Riechers et al. 2011). Blind mm and cm-wavelength surveys of CO line emission in high-redshift galaxies have found that galaxies selected via CO J=1-0 line emission have a lower excitation, on average, than those selected through the CO J=3-2 line (Riechers et al. 2020). These low excitation galaxies may also be strong [OI]63 line emitters, with some fraction of the neutral atomic gas arising from clumps of denser gas.
The results presented here are similar to what has been found by previous studies of far-infrared line emission in star-forming galaxies, where the line-to-infrared luminosity ratio shows a deficit that shifts to higher luminosities with redshift (e.g. Graziá-Carpio et al. 2011). Such a redshift trend can be removed by plotting the dependance of the luminosity ratio against the ratio (related to the star-formation efficiency). This can be understood by considering that the majority of galaxies studied in far-infrared line emission at high-redshift are starburst galaxies which exhibit a high star-formation efficiency compared to main sequence galaxies. Observing the [CII] line emission in main-sequence galaxies over a range in luminosities and redshifts, Zanella et al. (2018) showed that the luminosity in this line is strongly correlated with total molecular gas. As such, the ratio could be interpreted as the gas-depletion timescale for galaxies such as those in our sample.
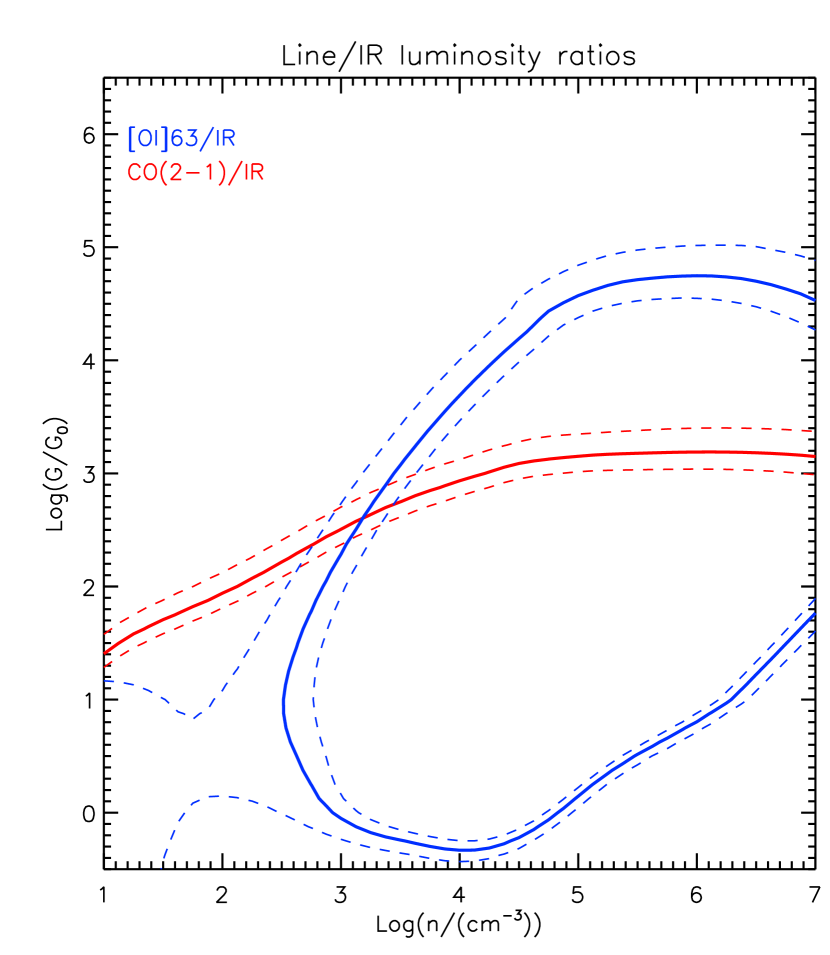
Finally, we consider the constraints that our luminosity ratios imply for the physical conditions within the ISM of BzK-21000 where the [OI]63m emission arises. We assume that the [OI]63m line and thermal dust continuum emission regions are cospatial with the CO J=2-1 line emission measured by Daddi et al. (2010a), acknowledging that high angular resolution imaging would be required to verify this assumption. To investigate the PDRs we adopt updated PDR models based on the online PDR toolbox (Pound & Wolfire 2008 and Kaufman et al. 2006, Wolfire priv. communication). These models have recently been updated to reflect the chemistry and reaction rates noted in Hollenbach et al. (2012), and Neufeld & Wolfire (2016), as well as photodissociation and ionization rates from Heays et al. (2017), and the collisional excitation of OI from Lique et al. (2018). These models assume a simple slab PDR geometry illuminated on one side. For an ensemble of PDR cloudlets externally illuminated, optically thin emission will be observed from both sides, while optically thick emission is only observed from the front side. Therefore, as recommended in Kaufman et al. (1999) and commonly practiced in PDR analysis (e.g. Hailey-Dunsheath et al 2010; Stacey et al. 2010), we have doubled the observed line fluxes of [OI] and CO when fitting the data to account for their expected optical thickness. Based on these models, the LLIR and LLIR luminosity ratios suggest a UV radiation field, , and gas density, cm-3 (Figure 4). This gas density is broadly consistent with the Large Velocity Gradient (LVG) models fit to the observed CO J=2-1 and J=3-2 line intensities (Dannerbauer et al. 2009; Daddi et al. 2015). Although these gas densities are low compared to what is typically inferred for submm luminous galaxies observed in [CII] and [OI]63m (Brisbin et al. 2015), the radiation field strengths are similar. Further constraints on the ISM conditions within BzK-21000 would be possible with detections of other FIR lines like [CII] or [NII].
4 Conclusions
We present Herschel-PACS spectroscopy of four BzK-selected star-forming galaxies at . One of our targets, BzK-21000 at is detected with an [OI]63m line luminosity, L L⊙. A spectral stacking analysis of the data from the three non-detections reveals a significant signal, implying L L⊙.
The line-to-total infrared luminosity ratio in BzK-21000 is similar to that of a dusty, galaxy (Rybak et al. 2020), but lower than that typically observed in massive submm galaxies at . Combined with PDR models, the relative strengths of the [OI]63m and CO J=2-1 lines compared to the infrared luminosity imply a UV field intensity, , and a gas density, cm-3. The gas density is low compared to the average determined for more massive submm galaxies observed in [OI]63m at high-redshift (Brisbin et al. 2015).
Given the observed intensity of the [OI]63m line emission in the BzK-selected star-forming galaxies studied here, it is likely that ALMA would be a powerful instrument for studying this line in more distant, main sequence galaxies. Beyond redshifts, , this line is redshifted into the ALMA band 10 receiver range. The GHz band 9 receivers can observe this line in galaxies during the Epoch of Reionization at , and have been used to study the [CII]158m line in lower redshift galaxies (e.g. Schaerer et al. 2015; Zanella et al. 2018; Lamarche et al. 2018).
Acknowledgements
We thank the anonymous referee for a thorough review of the original manuscript, and for useful feedback. In addition, we thank Kristen Coppin and Mark Swinbank for helpful discussions. MA and this work have been supported by grants “CONICYT+PCI+REDES 19019" and “CONICYT + PCI + INSTITUTO MAX PLANCK DE ASTRONOMIA MPG190030”. D.R. acknowledges support from the National Science Foundation under grant numbers AST-1614213 and AST-1910107. D.R. also acknowledges support from the Alexander von Humboldt Foundation through a Humboldt Research Fellowship for Experienced Researchers. PACS has been developed by a consortium of institutes led by MPE (Germany) and including UVIE (Austria); KU Leuven, CSL, IMEC (Belgium); CEA, LAM (France); MPIA (Germany); INAF-IFSI/OAA/OAP/OAT, LENS, SISSA (Italy); IAC (Spain). This development has been supported by the funding agencies BMVIT (Austria), ESA-PRODEX (Belgium), CEA/CNES (France), DLR (Germany), ASI/INAF (Italy), and CICYT/MCYT (Spain).
Data Availability
The data underlying this article can be accessed from the ESA Herschel science archive: http://archives.esac.esa.int/hsa/whsa/. The derived data generated in this research will be shared on reasonable request to the corresponding author.
References
- Aravena, et al. (2010) Aravena M., et al., 2010, ApJ, 718, 177
- Aravena, et al. (2019) Aravena M., et al., 2019, ApJ, 882, 136
- Barger, Cowie & Wang (2008) Barger A. J., Cowie L. L., Wang W.-H., 2008, ApJ, 689, 687
- Brauher, Dale & Helou (2008) Brauher J. R., Dale D. A., Helou G., 2008, ApJS, 178, 280
- Brinchmann, et al. (2004) Brinchmann J., Charlot S., White S. D. M., Tremonti C., Kauffmann G., Heckman T., Brinkmann J., 2004, MNRAS, 351, 1151
- Brisbin, et al. (2015) Brisbin D., et al., 2015, ApJ, 799, 13
- Brisbin, et al. (2019) Brisbin D., et al., 2019, A&A, 628, A104
- Capak, et al. (2004) Capak P., et al., 2004, AJ, 127, 180
- Carilli & Walter (2013) Carilli C. L., Walter F., 2013, ARA&A, 51, 105
- Cicone, et al. (2018) Cicone C., et al., 2018, ApJ, 863, 143
- Coppin, et al. (2012) Coppin K. E. K., et al., 2012, MNRAS, 427, 520
- Croxall, et al. (2012) Croxall K. V., et al., 2012, ApJ, 747, 81
- Daddi, et al. (2004) Daddi E., et al., 2004, ApJ, 617, 746
- Daddi, et al. (2007) Daddi E., et al., 2007, ApJ, 670, 156
- Daddi, et al. (2008) Daddi E., Dannerbauer H., Elbaz D., Dickinson M., Morrison G., Stern D., Ravindranath S., 2008, ApJL, 673, L21
- Daddi, et al. (2010) Daddi E., et al., 2010a, ApJ, 713, 686
- Daddi, et al. (2010) Daddi E., et al., 2010b, ApJL, 714, L118
- Daddi, et al. (2015) Daddi E., et al., 2015, A&A, 577, A46
- Dannerbauer, et al. (2009) Dannerbauer H., et al., 2009, ApJL, 698, L178
- Decarli, et al. (2016) Decarli R., et al., 2016, ApJ, 833, 70
- De Looze, et al. (2014) De Looze I., et al., 2014, A&A, 568, A62
- de Vaucouleurs, de Vaucouleurs & Shapley (1964) de Vaucouleurs G. H., de Vaucouleurs A., Shapley H., 1964, rcbg.book
- Díaz-Santos, et al. (2017) Díaz-Santos T., et al., 2017, ApJ, 846, 32
- Elbaz, et al. (2007) Elbaz D., et al., 2007, A&A, 468, 33
- Fadely, et al. (2010) Fadely R., et al., 2010, ApJ, 723, 729
- Feruglio, et al. (2013) Feruglio C., et al., 2013, A&A, 549, A51
- Freundlich, et al. (2013) Freundlich J., et al., 2013, A&A, 553, A130
- Genzel, et al. (2015) Genzel R., et al., 2015, ApJ, 800, 20
- Goldsmith, et al. (2015) Goldsmith P. F., Yıldız U. A., Langer W. D., Pineda J. L., 2015, ApJ, 814, 133
- Graciá-Carpio, et al. (2011) Graciá-Carpio J., et al., 2011, ApJL, 728, L7
- Greve, et al. (2009) Greve T. R., Papadopoulos P. P., Gao Y., Radford S. J. E., 2009, ApJ, 692, 1432
- Stacey et al. (2010) Stacey G. J., Hailey-Dunsheath S., Ferkinhoff C., Nikola T., Parshley S. C., Benford D. J., Staguhn J. G., et al., 2010, ApJ, 724, 957
- Heays et al. (2017) Heays, A. N., Bosman, A. D., & van Dishoeck, E. F. 2017, A&A, 602, A105
- Herrera-Camus, et al. (2016) Herrera-Camus R., et al., 2016, ApJ, 826, 175
- Hollenbach et al. (2012) Hollenbach, D., Kaufman, M. J., Neufeld, D., et al. 2012, ApJ, 754, 105
- Iono, et al. (2007) Iono D., et al., 2007, ApJ, 659, 283
- Isaak, Chandler & Carilli (2004) Isaak K. G., Chandler C. J., Carilli C. L., 2004, MNRAS, 348, 1035
- Ivison, et al. (2010) Ivison R. J., et al., 2010, MNRAS, 404, 198
- Ivison, et al. (2011) Ivison R. J., Papadopoulos P. P., Smail I., Greve T. R., Thomson A. P., Xilouris E. M., Chapman S. C., 2011, MNRAS, 412, 1913
- Kaufman, et al. (1999) Kaufman M. J., Wolfire M. G., Hollenbach D. J., Luhman M. L., 1999, ApJ, 527, 795
- Kaufman, Wolfire & Hollenbach (2006) Kaufman M. J., Wolfire M. G., Hollenbach D. J., 2006, ApJ, 644, 283
- Komossa, et al. (2003) Komossa S., Burwitz V., Hasinger G., Predehl P., Kaastra J. S., Ikebe Y., 2003, ApJL, 582, L15
- Lamarche et al. (2018) Lamarche C., Verma A., Vishwas A., Stacey G. J., Brisbin D., Ferkinhoff C., Nikola T., et al., 2018, ApJ, 867, 140
- Lique et al. (2018) Lique, F., Kłos, J., Alexander, M. H., et al. 2018, MNRAS, 474, 2313
- Luhman, et al. (1998) Luhman M. L., et al., 1998, ApJL, 504, L11
- Madau & Dickinson (2014) Madau P., Dickinson M., 2014, ARA&A, 52, 415
- Magdis, et al. (2010) Magdis G. E., et al., 2010, MNRAS, 409, 22
- Magdis, et al. (2012) Magdis G. E., et al., 2012, ApJ, 760, 6
- Malhotra, et al. (2001) Malhotra S., et al., 2001, ApJ, 561, 766
- Meijerink, et al. (2013) Meijerink R., et al., 2013, ApJL, 762, L16
- Morrison, et al. (2010) Morrison G. E., Owen F. N., Dickinson M., Ivison R. J., Ibar E., 2010, ApJS, 188, 178
- Narayanan & Krumholz (2017) Narayanan D., Krumholz M. R., 2017, MNRAS, 467, 50
- Neufeld & Wolfire (2016) Neufeld, D. A. & Wolfire, M. G. 2016, ApJ, 826, 183
- Ott (2010) Ott S., 2010, ASPC, 434, 139, ASPC..434
- Pilbratt, et al. (2010) Pilbratt G. L., et al., 2010, A&A, 518, L1
- Planck Collaboration, et al. (2016) Planck Collaboration, et al., 2016, A&A, 594, A13
- Poglitsch, et al. (2010) Poglitsch A., et al., 2010, A&A, 518, L2
- Pound & Wolfire (2008) Pound M. W., Wolfire M. G., 2008, ASPC, 394, 654, ASPC..394
- Riechers, et al. (2011) Riechers D. A., Hodge J., Walter F., Carilli C. L., Bertoldi F., 2011, ApJL, 739, L31
- Riechers, et al. (2020) Riechers D. A., et al., 2020, arXiv, arXiv:2005.09653
- Rodighiero, et al. (2011) Rodighiero G., et al., 2011, ApJL, 739, L40
- Rybak, et al. (2020) Rybak M., Zavala J. A., Hodge J. A., Casey C. M., Werf P. van . der ., 2020, ApJL, 889, L11
- Sajina, et al. (2008) Sajina A., et al., 2008, ApJ, 683, 659
- Sargent, et al. (2012) Sargent M. T., Béthermin M., Daddi E., Elbaz D., 2012, ApJL, 747, L31
- Scoville, et al. (2015) Scoville N., et al., 2015, ApJ, 800, 70
- Schaerer et al. (2015) Schaerer D., Boone F., Jones T., Dessauges-Zavadsky M., Sklias P., Zamojski M., Cava A., et al., 2015, A&A, 576, L2
- Stacey et al. (2010) Stacey G. J., Hailey-Dunsheath S., Ferkinhoff C., Nikola T., Parshley S. C., Benford D. J., Staguhn J. G., et al., 2010, ApJ, 724, 957
- Sturm, et al. (2010) Sturm E., et al., 2010, A&A, 518, L36
- Tacconi, et al. (2010) Tacconi L. J., et al., 2010, Natur, 463, 781
- Tacconi, et al. (2013) Tacconi L. J., et al., 2013, ApJ, 768, 74
- Tacconi, et al. (2018) Tacconi L. J., et al., 2018, ApJ, 853, 179
- Teplitz, et al. (2011) Teplitz H. I., et al., 2011, AJ, 141, 1
- Tielens & Hollenbach (1985) Tielens A. G. G. M., Hollenbach D., 1985, ApJ, 291, 722
- Treister, et al. (2020) Treister E., et al., 2020, ApJ, 890, 149
- Valentino, et al. (2018) Valentino F., et al., 2018, ApJ, 869, 27
- Valentino, et al. (2020) Valentino F., et al., 2020, ApJ, 890, 24
- Wagg, et al. (2007) Wagg J., Hughes D. H., Aretxaga I., Chapin E. L., Dunlop J. S., Gaztañaga E., Devlin M., 2007, MNRAS, 375, 745
- Wang, et al. (2013) Wang S. X., et al., 2013, ApJ, 778, 179
- Wang, et al. (2014) Wang J., et al., 2014, ApJ, 781, 55
- Wardlow, et al. (2017) Wardlow J. L., et al., 2017, ApJ, 837, 12
- Wirth, et al. (2004) Wirth G. D., et al., 2004, AJ, 127, 3121
- Wolfire, et al. (2003) Wolfire M. G., McKee C. F., Hollenbach D., Tielens A. G. G. M., 2003, ApJ, 587, 278
- Zanella, et al. (2018) Zanella A., et al., 2018, MNRAS, 481, 1976
- Zhang, et al. (2018) Zhang Z.-Y., et al., 2018, MNRAS, 481, 59