MusE GAs FLOw and Wind (MEGAFLOW) V. The dust/metallicity-anisotropy of the Circum-Galactic Medium ††thanks: Based on observations made at the ESO telescopes at La Silla Paranal Observatory under programme IDs 094.A-0211, 095.A-0365, 096.A-0164, 096.A-0609, 097.A-0138, 097.A-0144, 097.A-0144, 098.A-0216, 098.A-0310, 099.A-0059, 293.A-5038, 0100.A-0089, 0101.A-0287, and/or data products created thereof.
Abstract
We investigate whether the dust content of the circum-galactic medium (CGM) depends on the location of the quasar sightline with respect to the galaxy major-axis using 13 galaxy-Mg ii absorber pairs (9 - 81 kpc distance) from the MusE GAs FLOw and Wind (MEGAFLOW) survey at . The dust content of the CGM is obtained from [Zn/Fe] using Ultraviolet and Visual Echelle Spectrograph (UVES) data. When a direct measurement of [Zn/Fe] is unavailable, we estimate the dust depletion from a method which consists in solving for the depletion from multiple singly ionized ions (e.g. Mn ii, Cr ii, Zn ii) since each ion depletes on dust grains at different rates. We find a positive correlation between the azimuthal angle and [Zn/Fe] with a Pearson’s . The sightlines along the major axis show [Zn/Fe] < 0.5, whereas the [Zn/Fe] is > 0.8 along the minor axis. These results suggest that the CGM along the minor axis is on average more metal enriched (by 1 dex) than the gas located along the major axis of galaxies provided that dust depletion is a proxy for metallicity. This anisotropic distribution is consistent with recent results on outflow and accretion in hydro-dynamical simulations.
keywords:
galaxies: evolution – galaxies: formation – galaxies: intergalactic medium – quasars: absorption lines1 Introduction
In the CDM cosmological context, supernovae(SN)-driven outflows (Dekel & Silk, 1986) are thought to play a major role in galaxy formation given that galactic winds are ubiquitous and necessary to account for the observed mass-metallicity relation. They could eject a significant fraction of the baryons and play a key role in enriching the inter-galactic medium (Veilleux et al., 2005, 2020; Heckman & Thompson, 2017). SN-driven outflows and gas inflows usually have rather low particle densities and are hence difficult to observe. The properties of this low density gas can, however, be studied through quasar absorption line systems (QSOALs). The circum-galactic medium (CGM) is typically extended out to a few 100 kpc around galaxies. The physical and chemical conditions of the CGM are determined by gas infall, outflow, and other dynamical processes. Over the past decades, various surveys have been developed to study the distribution, physical state, and kinematics of the CGM around galaxies using both metal absorption lines (e.g., Steidel et al., 2010; Chen et al., 2010; Prochaska et al., 2011; Bordoloi et al., 2011; Werk et al., 2013; Nielsen et al., 2013; Schroetter et al., 2016; Rubin et al., 2018; Zabl et al., 2019; Muzahid et al., 2019 and references therein).
Galaxy-absorber pairs at high redshifts () were studied by Rudie et al. (2012). Therein 15 QSO sightlines from the Keck Baryonic Structure Survey (KBSS) were analyzed with the strongest H i absorbers within 100 kpc of the nearest galaxy. At intermediate redshifts, when Ly in the ultraviolet (UV) is not available from the ground, the CGM can be best studied with metal lines in quasar spectra. While, it is well established since the early 90s (Bergeron & Boissé, 1991; Bergeron et al., 1992; Steidel & Sargent, 1992), that strong Mg ii absorbers with rest-frame Å are known to be generally associated with star-forming galaxies. The resonant doublet is an especially useful tracer of the cool (), metal enriched CGM due to its strength and rest-wavelength, which allows to study it with ground-based optical spectroscopy for redshifts between .
Among galaxy-absorber pair Mg ii surveys, there is the Keck survey of Martin and collaborators (e.g. Ho et al., 2017, 2019) at lower redshifts (), who find that the broad velocity shifts of the Mg ii absorption can successfully be explained by gas spiraling inwards near the disk plane, as found by Bouché et al. (2013, 2016) and Zabl et al. (2019). One of the largest surveys of Mg ii absorbers is the Mg ii Absorber-Galaxy Catalog (MAGIICAT) which contains 182 galaxies with QSO sightlines within 200 kpc (Nielsen et al., 2013). Rubin et al. (2018) built a sample of 27 Mg ii absorber-QSO pairs with galaxies in the PRIMUS survey and background QSO as well as other galaxies in the redshift range of . Earlier, Churchill et al. (1999) observed 30 weak ( < 0.3 Å) Mg ii absorbers at a similar redshift range () and associate those weak Mg ii absorbers with sub Lyman limit system (LLS) environments (see also Muzahid et al., 2018). A study on a possible dust selection bias for samples selected for strong Mg ii absorbers ( > 0.5 Å) in the Complete Optical and Radio Absorption Line System (CORALS) survey at redshifts finds no particularly high dust-to-metals ratios in their sample (Ellison & Lopez, 2009).
Thanks to these surveys and others, there has been an important advance of our understanding of the statistics of the CGM, namely on the anisotropic distribution of the presence of Mg ii absorption lines since Bordoloi et al. (2011) and Bouché et al. (2012). This anisotropic presence of Mg ii around galaxies pointed towards a dual physical mechanism at play, namely that Mg ii QSOALs are caused either by the accreting/rotating extended gaseous disks or by outflows (see also Lan & Mo, 2018). This scenario is now strongly supported from the relation between the CGM kinematics and the host-galaxy kinematics (e.g. Bouché et al., 2013, 2016; Ho et al., 2017, 2019; Kacprzak et al., 2014; Martin et al., 2019; Muzahid et al., 2015; Schroetter et al., 2016, 2019; Zabl et al., 2019; Rahmani et al., 2018a, b).
In this setting, the gas in the SN-driven outflows ought to be more dusty (as in M82) or metal enriched than the co-planar material (presumably related to accretion). However, while there is strong evidence that the CGM gas metallicities are bimodal for LLs at (Lehner et al., 2013, 2016; Wotta et al., 2016, 2019), there is currently no supporting observational evidence that the anisotropic bimodal gas distribution for Mg ii absorbers is related to the bimodal metallicity distribution for LLS (Pointon et al., 2019). Furthermore, comparing the CGM metallicity to the metallicity of the interstellar medium (ISM) of the galaxy shows that gas flow metallicities have a wide range of values compared to that of the host galaxies regardless of the azimuthal angle (Péroux et al., 2016, 2017; Kacprzak et al., 2019). It should be noted, in regards to these null results, that the H i selection of Péroux et al. (2017) appears to select complex CGM situations when there are multiple galaxies within 100-150kpc. In addition, the sample of Pointon et al. (2019) is likely not uniformly selected given that their survey relies on photometric pre-selections of follow-up galaxies, a limitation that can be avoided with integral field unit (IFU) spectroscopy surveys.
In this context, we aim to use our MUSE GAs FLOw and Wind (MEGAFLOW) survey (Schroetter et al., 2016, 2019; Zabl et al., 2019, 2020) (paper I, III, II, IV) to investigate dust (and metallicity) properties of the CGM with respect to the anisotropic Mg ii distributions. MEGAFLOW, which aimed at studying the kinematics and physical properties of 100 star-forming galaxies at around Mg ii absorptions with rest-frame equivalent width () larger than 0.5Å, has enabled us to investigate the anisotropic distribution of the CGM gas traced by Mg ii absorption lines (see Schroetter et al., 2019; Zabl et al., 2019). MUSE observations have been used in the past to analyze individual projected quasar galaxy pairs with regard to the CGM-host galaxy connection (e.g., Bouché et al., 2016; Rahmani et al., 2018b).
In this paper, we use the large sample of galaxy-Mg ii absorber pairs from the MEGAFLOW survey which already showed strong evidence for Mg ii anisotropy (Schroetter et al., 2019; Zabl et al., 2019) in order to study whether also the amount of CGM dust-depletion depends on the alignment between absorber and galaxy. Given that our survey redshift range does not allow us to measure metallicities directly (as H i falls in the far ultra-violet), we will study in this paper the dust content of our sightlines using the prescription of De Cia et al. (2016).
2 Data
We use the data from the MEGAFLOW survey (Schroetter et al., 2016, hereafter paper I) that was published in Zabl et al. (2019, paper II) and Schroetter et al. (2019, paper III). This survey has enabled us to bring the sample size of galaxy-quasar pairs with robust galaxy orientation information from a dozen (Bouché et al., 2012; Schroetter et al., 2015) to 79 by targeting 22 quasar fields where each sightline has multiple (3 to 5) Mg ii absorbers at redshifts accessible with [O ii] in MUSE at , taking full advantage of the multiplexing capabilities of this 3D spectrograph (Bacon et al., 2010). Paper III covers the galaxies with corresponding absorption of the winds, while paper II lists cases attributed to accretion.
The division into accretion and wind cases was made based on the azimuthal angle. The azimuthal angle, , is defined as the angle between the location of the background quasar on the sky and the (projected) major axis of the galaxy associated to the absorber (see e.g. Figure 1 of paper II for an illustration). Quasar sightlines which are close to the galaxy’s minor axis () are likely to probe outflows (paper III), while sightlines along the major axis () are passing through extended gas disks (paper II). In practice, we determined the major-axis by fitting a 3D morpho-kinematical model to the [O ii] emission doublet using the 3D fitting tool GalPaK3D (Bouché et al., 2015).
For the MEGAFLOW survey, each MUSE field was searched for [O ii] in emission corresponding to the Mg ii absorption redshifts seen in the quasar spectrum within a velocity interval of 1 000 . The details of this process are described in paper I.
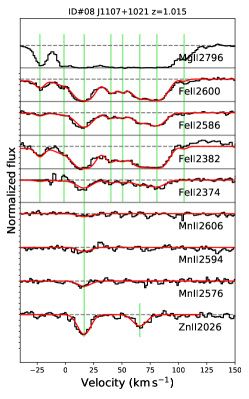
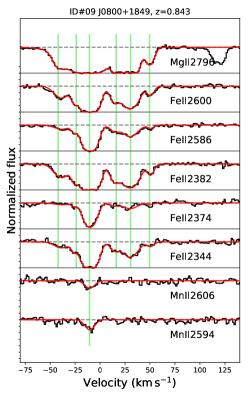
For each galaxy-absorber pair in the full MEGAFLOW sample, we searched for absorption of weaker ions in high resolution VLT/UVES data (dedicated observations, see section 3) to derive the depletion via the model given in De Cia et al. (2016) and selected those. Independently, all pairs for which we determined a robust measurement of the azimuthal angle from the 3D morpho-kinematical model were considered (see paper II and paper III). Merging these two selection criteria brought down the sample to 13 galaxy-absorber pairs for which we detected singly ionized elements that enabled us to apply the prescription in De Cia et al., 2016 (see section 4). For those 13 pairs, whenever feasible, we measured the dust depletion [Zn/Fe] directly via Zn which is minimally affected by depletion and Fe with possible depletion onto dust grains (4 cases, see Table 1). The precise redshifts were already determined by the dominant Mg ii absorption. When information of the complex velocity structures was available from stronger elements such as Fe ii, we felt confident identifying weak ions in single transitions for individual cases.
3 UVES Observations and data reduction
The quasar fields of our MUSE GTO-Programme were observed with the high-resolution spectrograph UVES (Dekker et al., 2000) between 2014 and 2016 (Table 1). The settings used in our observation were chosen in order to cover the Mg ii absorption lines as well as other elements such as Mg i, Fe ii when possible. The full list of observations is given in paper II and paper III.
The data were taken under similar conditions resulting in a spectral resolving power of R dispersed on pixels of 1.3 . The Common Pipeline Language (CPL version 6.3) of the UVES pipeline was used to bias correct and flat field the exposures and then to extract the wavelength and flux calibrated spectra. After the standard reduction, the custom software UVES Popler (Murphy, 2016, version 0.66) was used to combine the extracted echelle orders into single 1D spectra. The continuum was fitted with low-order polynomial functions.
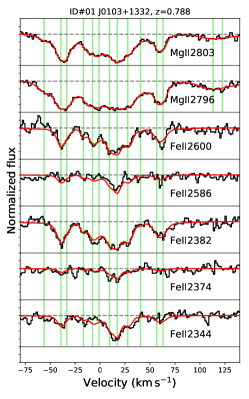
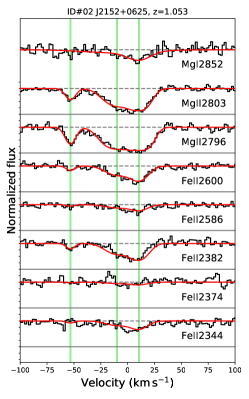
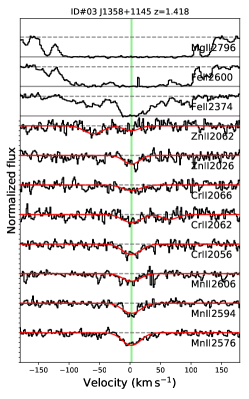
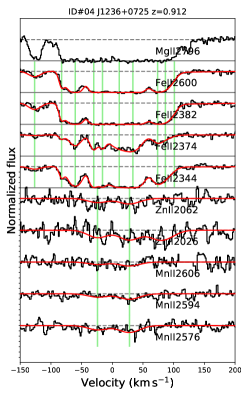
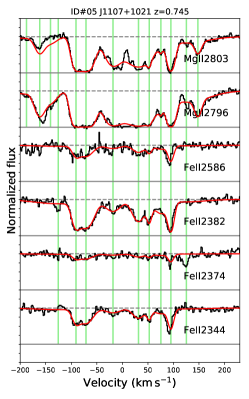
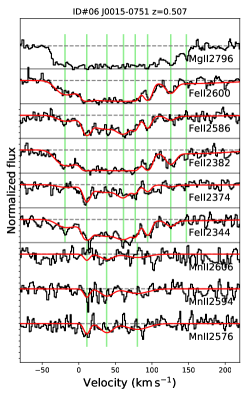
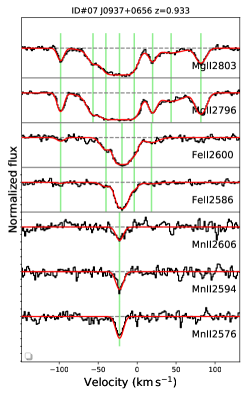
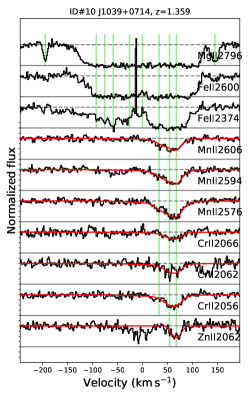
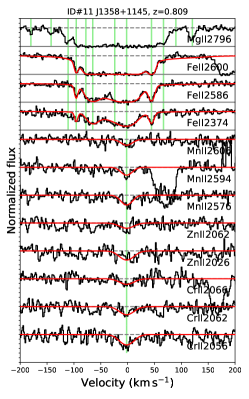
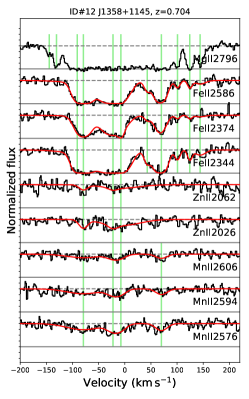
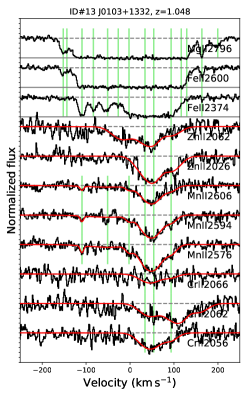
For this analysis we searched for the singly ionized species to determine the depletion of the absorption system such as the Mn ii, Zn ii, Cr ii and Ti ii. Of the 45 galaxy-absorber pairs in our MEGAFLOW sample, we were able to identify and fit these ions in 13 pairs. All absorption features were modeled as Gaussians with the evolutionary algorithm described in Quast et al. (2005) that is particularly successful in deblending complex velocity structures (Wendt & Molaro, 2011). The same velocity components were fitted –when detected– for every ion. All observed transitions of an individual ion were fitted with a common broadening parameter and column density and the fitted transitions are shown in the Appendix (see Fig.4). As a consequence, the column densities of Fe ii are rather precise thanks to the utilization of weak transitions such as Fe ii 2586 and 2374 with oscillator strengths as low as 0.069 and 0.031, respectively (see Cardelli & Savage, 1995) that constrain the overall column density of Fe ii. In some cases the weaker ions could not be deblended into distinct velocity components and as all our singly ionized elements are optically thin, we additionally derived logN from equivalent width measurements via linear relation for those systems via:
with and in units of Å. The column densities for the ions used in this paper are listed in Table 2.
Finally, to evaluate how representative our selection of the 13 galaxy-absorber pairs is with regard to the overall MEGAFLOW sample and the 45 galaxy-absorber pairs therein, we compared their distributions of impact parameters. The corresponding two-sided KS tests of the distribution for the 45-13 = 32 absorbers not part of this paper and the 13 absorbers used in this work has a p-values of 0.18. We thus conclude that the 13 absorbers with regard to impact parameters are typical of the MEGAFLOW sample.
Our sample based on the detection of weaker ions favors Mg ii systems with slightly higher restframe EWs on average compared to the full sample (median value of 1.86Å compared to the median EW of 1.25Å for all 79 Mg ii systems). The two-sided KS test yields that the hypothesis that they follow the same distribution in EWs can still not be rejected beyond the 2- level. For comparison to other samples, it is noteworthy that the Pointon et al. (2019) sample has a quite different impact parameter distribution and that, in most cases, their systems are no strong Mg ii absorbers.
4 Methodology
Given the redshift range of our systems () imposed by the MUSE wavelength coverage of [O ii], a direct metallicity ] estimation is currently difficult since the corresponding Lyman series lines fall in the near UV (NUV) and are often inaccessible even with HST/COS given the low NUV fluxes of our QSOs.
Here, we aim at measuring the dust depletion in the CGM as a function of azimuthal angle. This can be easily achieved because several authors have shown that various elements are depleted at different rates (e.g. Savage & Sembach, 1996; Vladilo, 2002b, a; Jenkins, 2009; De Cia et al., 2016) where Zn is the least depleted element (e.g. Vladilo et al., 2000). In particular, Jenkins (2009) built a framework that describes the depletion in terms of a set of a simple parameter, , the depletion strength factor, using data from sightlines of Milky-Way halo stars, i.e. at around solar metallicity. More recently, De Cia et al. (2016) extended the method of Jenkins (2009) to intergalactic clouds (colum density N > cm-2) and showed that relative abundances of intergalactic and galactic sightlines can all be put into a similar coherent framework111One limitation of the Jenkins (2009) framework is that was calibrated in the MilkyWay enriched environment such that the lowest depletion correspond to [Zn/Fe]=1 whereas this quantity can range below 1 in DLAs. where they parameterized the depletion sequence of each element as a function of [Zn/Fe].222See also Jenkins & Wallerstein (2017) and Wiseman et al. (2017) for other extensions of the original Jenkins (2009) framework to GRBs and the SMC, respectively.
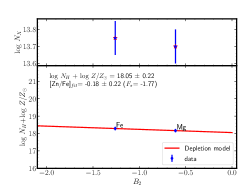
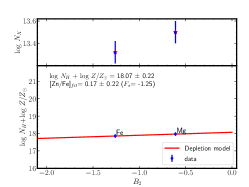
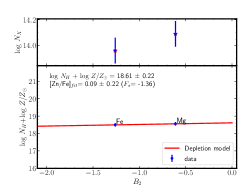
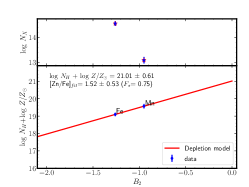
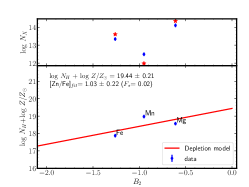
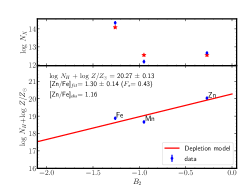
The methodology can be understood as follows: given that the depletion [X/Zn] of an element varies linearly with [Zn/Fe] with each element having a different slope ( in De Cia et al., 2016), the global depletion factor [Zn/Fe] can be determined if one has at least two ions, even when a direct Zn measurement is not available by solving a simple set of linear equations. The model fits are shown in Fig. 4. The two unknowns are the global depletion [Zn/Fe] given by the slope and given by the zero-point of the line when each element abundance is plotted as a function of the depletion propensity . Naturally, a [Zn/Fe] measurement based on more than two ions will lead to a better understanding of the depletion.These [Zn/Fe] constraints will determine the amount of dust in the CGM, which is itself well correlated with metallicity (Fig.6 of De Cia et al., 2016), and our aim is to determine whether the dust/metallicity content of the CGM differs on the minor/major axes of galaxies. The information in De Cia et al. (2016) were also applied in Guber et al. (2018) in using Mn ii/Ca ii as an indicator for the dust-to-gas ratio in Damped Lyman Alpha (DLA) systems. This approach was also followed by Jones et al. (2018), who extended the prescription to estimate the Ni depletion sequence and assume low ions from different elements to be cospatial as well. Churchill et al. (2015) also conclude from hydroART simulations (at ) of the CGM that low ionization gas likely arises from small structures with a narrow range of densities and temperatures, suggesting they can be modeled as single phase structures. FOGGIE simulations of the CGM at higher redshifts () also find that low ions populate similar regions in velocity phase-space (Peeples et al., 2019). The elements used in this study have nearly identical ionization potentials (within 1–2 eV) and therefore should be strongly associated.
In our study we do not apply any ionization corrections. While ionization corrections for an element relative to hydrogen are important at , the corrections for low-ionization elements (e.g. FeII) to others (e.g. ZnII) are relatively small. The low-ions we used in this work have similar ionization potential and are, to a large extent, already fully ionized. This is confirmed by studies such as Péroux et al. (2007) in which they state that for sub-DLAs only a small fraction required ionization corrections above 0.2 dex and none beyond 0.35 dex. Meiring et al. (2009) also conclude that the ionization corrections for most elements in DLA systems were found to be < 0.2 dex in most cases. We note that De Cia et al. (2016) used DLA and sub-damped Lyman (sub-DLA) systems with > cm-2 where ionization corrections are negligible and in general below 0.3 dex (e.g. Vladilo et al., 2001; Dessauges-Zavadsky et al., 2003). The systems of our sample have estimated column densities of H i > cm-2 based on the restframe EWs of the Mg ii absorption (Ménard & Chelouche, 2009; Lan & Fukugita, 2017). We made calculations on the required ionization correction for Zn ii, Mn ii and Cr ii and confirm that the corrections for [Zn/Fe] and certainly [Mn/Fe] and [Cr/Fe] do not exceed 0.2 – 0.3 dex for and and log n -0.5, respectively.
Some of our targets show Mn ii, Cr ii and Zn ii together. For them, the model fit shows no sign of systematic discrepancies for Zn ii that could be caused by ionization effects. Thus, while such ionization effects –if present– could introduce a slight offset in our column density measurements, the column densities would be shifted by a similar amount and have little impact on the derived slope and hence on [Zn/Fe] (see Figs. 4). Moreover, it should be noted that these corrections are heavily model dependent. Another source of error is from the mis-association between H i(v) and X(v) and multi-phase nature of the gas.
Our calculations show that even under strongly varying conditions with regard to gas density and metallicity the required corrections for [Zn/Fe] are significantly lower than the observed range of > 1 dex.
5 Results
5.1 Dust anisotropy
The primary goal of this study is to investigate the relationship between the (known) anisotropic distribution of MgII around galaxies (e.g., Bouché et al., 2012; Kacprzak et al., 2012; Lopez et al., 2018) with the distribution of dust in the CGM.
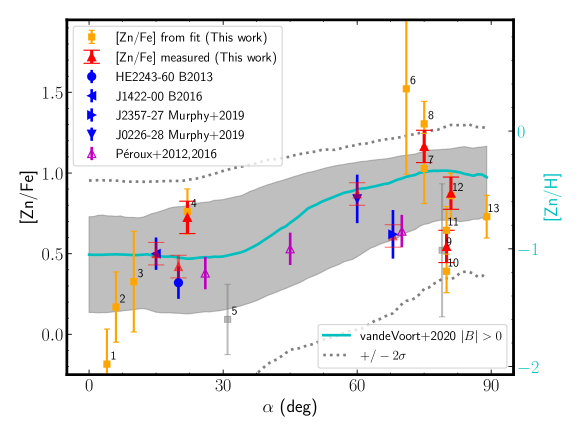
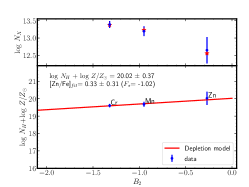
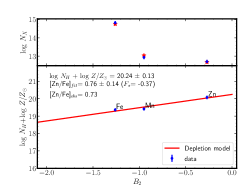
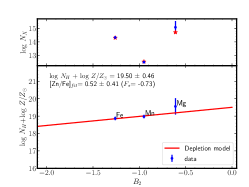
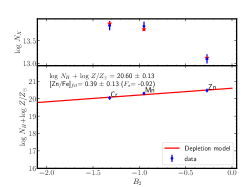
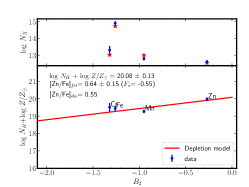
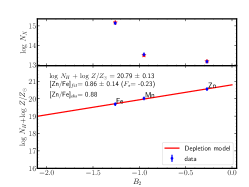
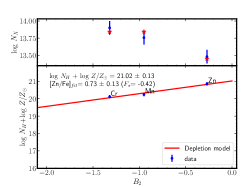
Figure 1 shows the depletion [Zn/Fe] values as a function of the azimuthal angle for our subset of galaxy-absorber pairs from MEGAFLOW. The individual systems are shown with the solid squares and are labeled by their ID in order of azimuthal angle (see Table 1). The red solid triangles show the direct [Zn/Fe] measurement when available. One sees that systems located along the minor-axis of galaxies, with , have depletion levels of [Zn/Fe] , while systems located along the major-axis of galaxies, with , have smaller depletions with [Zn/Fe] at 0–0.5, indicative of a smaller dust content.
In Figure 1, we also show literature data when [Zn/Fe] is available and well defined, which are taken from Péroux et al. (2016) 333The azimuthal angles and column densities come from Péroux et al. (2016) and Péroux et al. (2012), respectively. (open triangles), from Bouché et al. (2013); Murphy et al. (2019) (blue triangles) and from Bouché et al. (2016) (blue circles). For Bouché et al. (2013) and Bouché et al. (2016), we were able to perform the same analysis as in this paper using the same modeling.
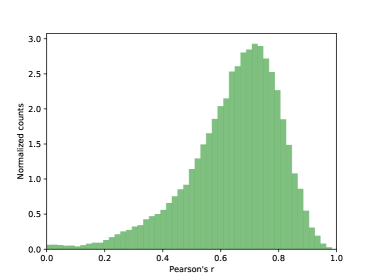
The found correlation with the measured azimuthal angle for our data points is significant at more than from a bootstrap sampling of the Pearson correlation coefficient. Indeed, Figure 2 shows the distribution of the Pearson correlation coefficient of [Zn/Fe] over for 50 000 bootstrap realizations . This relates well to the direct Spearman correlation with the standard deviation in as and .
To evaluate the robustness of the results and their interpretation we performed several checks for alternative underlying correlations that could mimic a dependency between dust depletion and azimuthal angle. Firstly, we wanted to make sure that the trend we see is not attributable to the stellar masses of the galaxies in our sample. The two-sided hypothesis test, whose null hypothesis is that these two properties are uncorrelated, yields a p-value of 0.49 for vs . Similarly, the [Zn/Fe] values show no correlation with the impact parameter to the galaxy center (p-value for null hypothesis is 0.97). The values for are also listed in Table 1. For consistency, the given masses are estimated via the galaxies’ dynamics using the S05- relation from Alcorn et al. (2018) as utilized in Schroetter et al. (2019) and therefore differ slightly from the masses derived via SED-fittig in paper II for the accretion cases. Our sample covers a wide range of [Zn/Fe] (-0.2 < [Zn/Fe] < 1.5) and relative galaxy orientations ( = 4 - 89 degrees). A potential bias towards enriched gas could not mimic the observed trend.
| Pair ID | Quasar ID | redshift | b [kpc] | [deg] | [Å] | [Zn/Fe]obs | [Zn/Fe] model | |
|---|---|---|---|---|---|---|---|---|
| 1 | J0103+1332 | 0.788 | 20 | 4 | 1.25 | – | 9.1 | -0.18(22) |
| 2 | J2152+0625 | 1.053 | 49 | 6 | 0.54 | – | 10.1 | 0.17(22) |
| 3 | J1358+1145 | 1.418 | 30 | 10 | 2.61 | – | 8.9 | 0.33(31) |
| 4 | J1236+0725 | 0.912 | 17 | 22 | 2.24 | 0.73 | 10.5 | 0.76(14) |
| 5 | J1107+1021 | 0.745 | 43 | 31 | 2.45 | – | 8.4 | 0.09(22) |
| 6 | J0015-0751 | 0.507 | 24 | 71 | 1.59 | – | 10.7 | 1.52(53) |
| 7 | J0937+0656 | 0.933 | 41 | 75 | 1.52 | – | 9.7 | 1.03(22) |
| 8 | J1107+1021 | 1.015 | 81 | 75 | 1.93 | 1.16 | 11.1 | 1.30(14) |
| 9 | J0800+1849 | 0.843 | 21 | 79 | 0.96 | – | 9.8 | 0.52(41) |
| 10 | J1039+0714 | 1.359 | 9 | 80 | 2.49 | – | 9.0 | 0.39(13) |
| 11 | J1358+1145 | 0.810 | 13 | 80 | 1.79 | 0.55 | 9.3 | 0.64(15) |
| 12 | J1358+1145 | 0.704 | 17 | 81 | 2.45 | 0.88 | 10.2 | 0.86(14) |
| 13 | J0103+1332 | 1.048 | 9 | 89 | 2.99 | – | 9.8 | 0.73(13) |
5.2 Implications for CGM Metallicity
The implication of our result is that the CGM metallicity ought to also be anisotropic, provided that there is a relation between dust depletion and metallicity. At face value, there seems to be such a dust-metallicity ([Zn/Fe]–[Zn/H]) relation, albeit with significant intrinsic scatter (Meiring et al., 2009; De Cia et al., 2016).
In this context, we also show in Figure 1 (cyan line; the right-hand -axis) the recent prediction of the azimuthal dependence of metallicity from a simulation of a MilkyWay-like halo that included magnetic fields from van de Voort et al. (2020) 444The model was arbitrarily shifted by -0.5 dex in X/H given the uncertain yields in the simulations (F. van de Voort, private communication).. The right-hand axis is computed from the [Zn/Fe]–[Zn/H] relation of De Cia et al. (2016).
Provided that there is a dust-metallicity relation, our results are in apparent contradiction with the recent analysis of Pointon et al. (2019) who studied the azimuthal distribution of the CGM metallicity for the first time, using a sample of 47 galaxies with H i absorption ranging from - cm-2 at a considerably lower median redshift of detected in 29 quasar fields. Using photo-ionization models, they find no evidence for a relation between their single phase metallicities and on 29 systems. However, we note that the impact parameter of the galaxies in their sample are rather large (median impact parameter 93 kpc) with only 10 galaxies having impact parameter of < 50 kpc.
6 Conclusion & Discussion
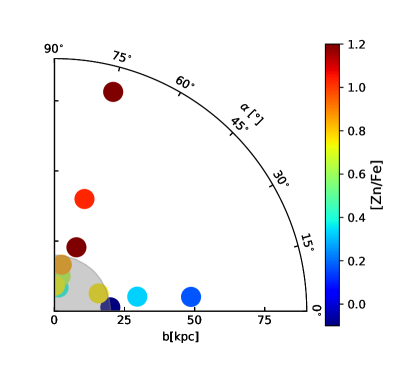
In order to study the dust-depletion pattern of the CGM gas around galaxies from our MEGAFLOW survey, we selected all the absorber-galaxy pairs where column densities of at least two elements such as Zn, Fe, Mn, etc. could be measured in our UVES spectra. From this sub-sample, we find that the dust-depletion ([Zn/Fe]) does depend strongly on the azimuthal angle of the quasar’s apparent location with respect to the galaxy’s major-axis (see Fig 1). Fig. 3 shows the same data as Fig 1 but includes the information of the impact parameter and thus corresponds to a 2D projection of a quadrant of the average galaxy we see in CGM absorption (without any information on inclination). Given that [Zn/Fe] is also a proxy for metallicity (as discussed in De Cia et al., 2016) where [Zn/Fe]=0 (1) corresponds to sightlines with [M/H] -1.75 (-0.25), respectively, one can conclude that the bi-modal distribution of Mg ii absorbers around galaxies is indeed related to metal-poor gas along the major-axis and metal-rich gas along the galay’s minor-axis, supporting the accretion/wind dichotomy.
There are several recent efforts to address the azimuthal dependence in contemporary simulations. Kannan et al. (2020) find on the basis of high resolution hydrodynamical simulations of Milky-Way like and Large Magellanic Cloud like galaxies that dust is efficiently entrained and expelled out of the disk by supernova driven outflows, offering a path to explain the transport of dust from galaxies into the circum-galactic medium. Hafen et al. (2019) study the CGM based on the cosmological hydrodynamic FIRE-2 simulations and find that the metallicity of IGM accretion is systematically lower than the metallicity of winds (typically by >1 dex). While they identify the accretion preferably in the galactic plane at low azimuthal angles, they find no distinct bimodal distribution as the simulated winds are distributed close to spherically in the median. They note, however, that a subset of the simulated haloes have enhanced warm/hot wind mass along the galaxy minor axis, which may reflect the preferential expansion of warm/hot wind normal to the disc plane.
Hopkins et al. (2020) demonstrate the importance of the inclusion of cosmic rays in simulations for galaxy outflows. They find that the cosmic ray driven outflows extends outwards biconically with a widening outflow angle at increasing distance. Since in their simulations the density in outflowing gas is relatively low, it is not obvious if the clear bipolar outflow structure they find translates directly to a clear observable trend of absorber equivalent width as a function of polar angle. This influence of cosmic rays on the structure of gas flows in the CGM is also analysed more general in Buck et al. (2020).
van de Voort et al. (2020) study the effect of magnetic fields on the CGM properties (such as metallicity) of a Milky Way-like galaxy and find that magnetic fields have a significant impact on the physical properties of the CGM (resolved with spatial refinement to 1 kpc or better). In particular, magnetic fields enhance the azimuthal dependence of the CGM metallicity (see also Fig. 1) in their simulations. The impact of magnetic fields in simulations is also shown in Sparre et al. (2020). Very recently, Péroux et al. 2020 study the physical properties of the CGM in cosmological hydrodynamical simulations and find a clear angular dependence of the CGM metallicity. The predicted correlation of metallicity with azimuthal angle was found to be rather robust within a broad mass range of 8.5 < < 10.5 and for all redshifts z < 1.
Our study finds the first evidence for an anisotropic dust distribution in the CGM, and provided there is a dust-metallicity relation, this observed dust-anisotropy supports the results of van de Voort et al. (2020) and the interpretation of dust enriched outflows along the minor axis and gas with lower metallicity along the major axis.
Acknowledgements
We thank the referee for detailed comments. This work has been carried out thanks to the support of the ANR 3DGasFlows (ANR-17-CE31-0017), and the OCEVU Labex (ANR-11-LABX-0060). SM acknowledges support from the Humboldt Foundation, Germany. We thank M. T. Murphy for providing some of the data in a tabulated format. This work made use of the following open source software: GalPaK3D (Bouché et al., 2015), ZAP (Soto et al., 2016), MPDAF (Piqueras et al., 2017), matplotlib (Hunter, 2007), NumPy (van der Walt et al., 2011; Oliphant, 2007), Astropy (Astropy Collaboration et al., 2013), especia (Quast, 2016).
data availability
The data underlying this article are available in the ESO archive (http://archive.eso.org). The reduced data will be shared on reasonable request to the corresponding author.
References
- Alcorn et al. (2018) Alcorn, L. Y., Tran, K.-V., Glazebrook, K., et al. 2018, ApJ, 858, 47
- Astropy Collaboration et al. (2013) Astropy Collaboration, Robitaille, T. P., Tollerud, E. J., et al. 2013, A&A, 558, A33
- Bacon et al. (2010) Bacon, R., Accardo, M., Adjali, L., et al. 2010, in Society of Photo-Optical Instrumentation Engineers (SPIE) Conference Series, Vol. 7735, Society of Photo-Optical Instrumentation Engineers (SPIE) Conference Series, 8
- Bergeron & Boissé (1991) Bergeron, J. & Boissé, P. 1991, A&A, 243, 344
- Bergeron et al. (1992) Bergeron, J., Cristiani, S., & Shaver, P. A. 1992, A&A, 257, 417
- Bordoloi et al. (2011) Bordoloi, R., Lilly, S. J., Knobel, C., et al. 2011, ApJ, 743, 10
- Bouché et al. (2015) Bouché, N., Carfantan, H., Schroetter, I., Michel-Dansac, L., & Contini, T. 2015, AJ, 150, 92
- Bouché et al. (2016) Bouché, N., Finley, H., Schroetter, I., et al. 2016, ApJ, 820, 121
- Bouché et al. (2012) Bouché, N., Hohensee, W., Vargas, R., et al. 2012, MNRAS, 426, 801
- Bouché et al. (2013) Bouché, N., Murphy, M. T., Kacprzak, G. G., et al. 2013, Science, 341, 50
- Buck et al. (2020) Buck, T., Pfrommer, C., Pakmor, R., Grand, R. J. J., & Springel, V. 2020, MNRAS, 497, 1712
- Cardelli & Savage (1995) Cardelli, J. A. & Savage, B. D. 1995, ApJ, 452, 275
- Chen et al. (2010) Chen, H.-W., Helsby, J. E., Gauthier, J.-R., et al. 2010, ApJ, 714, 1521
- Churchill et al. (1999) Churchill, C. W., Rigby, J. R., Charlton, J. C., & Vogt, S. S. 1999, ApJS, 120, 51
- Churchill et al. (2015) Churchill, C. W., Vander Vliet, J. R., Trujillo-Gomez, S., Kacprzak, G. G., & Klypin, A. 2015, ApJ, 802, 10
- De Cia et al. (2016) De Cia, A., Ledoux, C., Mattsson, L., et al. 2016, A&A, 596, A97
- Dekel & Silk (1986) Dekel, A. & Silk, J. 1986, ApJ, 303, 39
- Dekker et al. (2000) Dekker, H., D’Odorico, S., Kaufer, A., Delabre, B., & Kotzlowski, H. 2000, in Proc. SPIE, Vol. 4008, Optical and IR Telescope Instrumentation and Detectors, ed. M. Iye & A. F. Moorwood, 534–545
- Dessauges-Zavadsky et al. (2003) Dessauges-Zavadsky, M., Péroux, C., Kim, T. S., D’Odorico, S., & McMahon, R. G. 2003, MNRAS, 345, 447
- Ellison & Lopez (2009) Ellison, S. L. & Lopez, S. 2009, MNRAS, 397, 467
- Guber et al. (2018) Guber, C. R., Richter, P., & Wendt, M. 2018, A&A, 609, A85
- Hafen et al. (2019) Hafen, Z., Faucher-Giguère, C.-A., Anglés-Alcázar, D., et al. 2019, MNRAS, 488, 1248
- Heckman & Thompson (2017) Heckman, T. M. & Thompson, T. A. 2017, arXiv e-prints, arXiv:1701.09062
- Ho et al. (2017) Ho, S. H., Martin, C. L., Kacprzak, G. G., & Churchill, C. W. 2017, ApJ, 835, 267
- Ho et al. (2019) Ho, S. H., Martin, C. L., & Turner, M. L. 2019, ApJ, 875, 54
- Hopkins et al. (2020) Hopkins, P. F., Chan, T. K., Ji, S., et al. 2020, arXiv e-prints, arXiv:2002.02462
- Hunter (2007) Hunter, J. D. 2007, Computing in Science and Engineering, 9, 90
- Jenkins (2009) Jenkins, E. B. 2009, ApJ, 700, 1299
- Jenkins & Wallerstein (2017) Jenkins, E. B. & Wallerstein, G. 2017, ApJ, 838, 85
- Jones et al. (2018) Jones, T., Stark, D. P., & Ellis, R. S. 2018, ApJ, 863, 191
- Kacprzak et al. (2012) Kacprzak, G. G., Churchill, C. W., & Nielsen, N. M. 2012, ApJ, 760, L7
- Kacprzak et al. (2014) Kacprzak, G. G., Martin, C. L., Bouché, N., et al. 2014, ApJ, 792, L12
- Kacprzak et al. (2019) Kacprzak, G. G., Pointon, S. K., Nielsen, N. M., et al. 2019, ApJ, 886, 91
- Kannan et al. (2020) Kannan, R., Vogelsberger, M., Marinacci, F., et al. 2020, arXiv e-prints, arXiv:2002.01933
- Lan & Fukugita (2017) Lan, T.-W. & Fukugita, M. 2017, ApJ, 850, 156
- Lan & Mo (2018) Lan, T.-W. & Mo, H. 2018, ApJ, 866, 36
- Lehner et al. (2013) Lehner, N., Howk, J. C., Tripp, T. M., et al. 2013, ApJ, 770, 138
- Lehner et al. (2016) Lehner, N., O’Meara, J. M., Howk, J. C., Prochaska, J. X., & Fumagalli, M. 2016, ApJ, 833, 283
- Lopez et al. (2018) Lopez, S., Tejos, N., Ledoux, C., et al. 2018, Nature, 554, 493
- Martin et al. (2019) Martin, C. L., Ho, S. H., Kacprzak, G. G., & Churchill, C. W. 2019, ApJ, 878, 84
- Meiring et al. (2009) Meiring, J. D., Lauroesch, J. T., Kulkarni, V. P., et al. 2009, Monthly Notices of the Royal Astronomical Society, 397, 2037
- Ménard & Chelouche (2009) Ménard, B. & Chelouche, D. 2009, MNRAS, 393, 808
- Murphy (2016) Murphy, M. T. 2016, UVES popler: POst-PipeLine Echelle Reduction software
- Murphy et al. (2019) Murphy, M. T., Kacprzak, G. G., Savorgnan, G. A. D., & Carswell, R. F. 2019, MNRAS, 482, 3458
- Muzahid et al. (2018) Muzahid, S., Fonseca, G., Roberts, A., et al. 2018, MNRAS, 476, 4965
- Muzahid et al. (2015) Muzahid, S., Kacprzak, G. G., Churchill, C. W., et al. 2015, ApJ, 811, 132
- Muzahid et al. (2019) Muzahid, S., Schaye, J., Marino, R. A., et al. 2019, arXiv e-prints, arXiv:1910.03593
- Nielsen et al. (2013) Nielsen, N. M., Churchill, C. W., Kacprzak, G. G., & Murphy, M. T. 2013, ApJ, 776, 114
- Oliphant (2007) Oliphant, T. E. 2007, Computing in Science and Engineering, 9, 10
- Peeples et al. (2019) Peeples, M. S., Corlies, L., Tumlinson, J., et al. 2019, ApJ, 873, 129
- Péroux et al. (2012) Péroux, C., Bouché, N., Kulkarni, V. P., York, D. G., & Vladilo, G. 2012, MNRAS, 419, 3060
- Péroux et al. (2007) Péroux, C., Dessauges-Zavadsky, M., D’Odorico, S., Kim, T.-S., & McMahon, R. G. 2007, MNRAS, 382, 177
- Péroux et al. (2020) Péroux, C., Nelson, D., van de Voort, F., et al. 2020, MNRAS, 499, 2462
- Péroux et al. (2016) Péroux, C., Quiret, S., Rahmani, H., et al. 2016, MNRAS, 457, 903
- Péroux et al. (2017) Péroux, C., Rahmani, H., Quiret, S., et al. 2017, MNRAS, 464, 2053
- Piqueras et al. (2017) Piqueras, L., Conseil, S., Shepherd, M., et al. 2017, ArXiv e-prints [\eprint[arXiv]1710.03554]
- Pointon et al. (2019) Pointon, S. K., Kacprzak, G. G., Nielsen, N. M., et al. 2019, ApJ, 883, 78
- Prochaska et al. (2011) Prochaska, J. X., Weiner, B., Chen, H. W., Mulchaey, J., & Cooksey, K. 2011, ApJ, 740, 91
- Quast (2016) Quast, R. 2016, Evolutionary spectrum inversion and analysis (Especia)
- Quast et al. (2005) Quast, R., Baade, R., & Reimers, D. 2005, A&A, 431, 1167
- Rahmani et al. (2018a) Rahmani, H., Péroux, C., Augustin, R., et al. 2018a, MNRAS, 474, 254
- Rahmani et al. (2018b) Rahmani, H., Péroux, C., Schroetter, I., et al. 2018b, MNRAS, 480, 5046
- Rubin et al. (2018) Rubin, K. H. R., Diamond-Stanic, A. M., Coil, A. L., Crighton, N. H. M., & Moustakas, J. 2018, ApJ, 853, 95
- Rudie et al. (2012) Rudie, G. C., Steidel, C. C., Trainor, R. F., et al. 2012, ApJ, 750, 67
- Savage & Sembach (1996) Savage, B. D. & Sembach, K. R. 1996, ARA&A, 34, 279
- Schroetter et al. (2015) Schroetter, I., Bouché, N., Péroux, C., et al. 2015, ApJ, 804, 83
- Schroetter et al. (2016) Schroetter, I., Bouché, N., Wendt, M., et al. 2016, ApJ, 833, 39
- Schroetter et al. (2019) Schroetter, I., Bouché, N. F., Zabl, J., et al. 2019, ArXiv e-prints [\eprint[arXiv]1907.09967]
- Soto et al. (2016) Soto, K. T., Lilly, S. J., Bacon, R., Richard, J., & Conseil, S. 2016, ZAP: Zurich Atmosphere Purge, Astrophysics Source Code Library
- Sparre et al. (2020) Sparre, M., Pfrommer, C., & Ehlert, K. 2020, arXiv e-prints, arXiv:2008.09118
- Steidel et al. (2010) Steidel, C. C., Erb, D. K., Shapley, A. E., et al. 2010, ApJ, 717, 289
- Steidel & Sargent (1992) Steidel, C. C. & Sargent, W. L. W. 1992, ApJS, 80, 1
- van de Voort et al. (2020) van de Voort, F., Bieri, R., Pakmor, R., et al. 2020, arXiv e-prints, arXiv:2008.07537
- van der Walt et al. (2011) van der Walt, S., Colbert, S. C., & Varoquaux, G. 2011, Computing in Science and Engineering, 13, 22
- Veilleux et al. (2005) Veilleux, S., Cecil, G., & Bland-Hawthorn, J. 2005, ARA&A, 43, 769
- Veilleux et al. (2020) Veilleux, S., Maiolino, R., Bolatto, A. D., & Aalto, S. 2020, arXiv e-prints, arXiv:2002.07765
- Vladilo (2002a) Vladilo, G. 2002a, ApJ, 569, 295
- Vladilo (2002b) Vladilo, G. 2002b, A&A, 391, 407
- Vladilo et al. (2000) Vladilo, G., Bonifacio, P., Centurión, M., & Molaro, P. 2000, ApJ, 543, 24
- Vladilo et al. (2001) Vladilo, G., Centurión, M., Bonifacio, P., & Howk, J. C. 2001, ApJ, 557, 1007
- Wendt & Molaro (2011) Wendt, M. & Molaro, P. 2011, A&A, 526, A96
- Werk et al. (2013) Werk, J. K., Prochaska, J. X., Thom, C., et al. 2013, ApJS, 204, 17
- Wiseman et al. (2017) Wiseman, P., Shady, P., Bolmer, J., et al. 2017, Astronomy & Astrophysics, 88, A24
- Wotta et al. (2019) Wotta, C. B., Lehner, N., Howk, J. C., et al. 2019, ApJ, 872, 81
- Wotta et al. (2016) Wotta, C. B., Lehner, N., Howk, J. C., O’Meara, J. M., & Prochaska, J. X. 2016, ApJ, 831, 95
- Zabl et al. (2020) Zabl, J., Bouché, N. F., Schroetter, I., et al. 2020, MNRAS, 4576
- Zabl et al. (2019) Zabl, J., Bouché, N. F., Schroetter, I., et al. 2019, MNRAS, 485, 1961
Appendix A Appendix
The column densities for the measured ions used in this paper are listed in Table 2.
Table 3 shows the azimuthal angles and measured dust depletion [Zn/Fe] for the additional data points in Fig. 1 taken from literature.
Figure 4 shows all observed and used transitions with fit to the model described in De Cia et al. (2016).
| Pair ID | Quasar ID | redshift | Mn ii | Cr ii | Zn ii | Fe ii | Mg ii |
|---|---|---|---|---|---|---|---|
| log (cm-2) | |||||||
| 1 | J0103+1332 | 0.788 | < 11.72 | < 12.32 | < 11.77 | 13.75(2) | 13.85(10) |
| 2 | J2152+0625 | 1.053 | < 11.64 | < 12.69 | < 12.03 | 13.32(3) | 13.65(10) |
| 3 | J1358+1145 | 1.418 | 12.82(14) | 13.39(9) | 12.65(38) | – | – |
| 4 | J1236+0725 | 0.912 | 12.7(3) | < 12.19 | 12.7(1) | 14.82(2) | – |
| 5 | J1107+1021 | 0.745 | – | < 12.15 | < 11.54 | 13.96(1) | 14.24(10) |
| 6 | J0015-0751 | 0.507 | 12.87(13) | – | – | 14.56(2) | – |
| 7 | J0937+0656 | 0.933 | 12.34(2) | – | < 11.51 | 13.34(3) | 14.14(10) |
| 8 | J1107+1021 | 1.015 | 12.12(5) | < 11.98 | 12.66(2) | 14.34(2) | – |
| 9 | J0800+1849 | 0.843 | 12.14(2) | < 12.36 | < 11.38 | 14.33(1) | 15.24(47) |
| 10 | J1039+0714 | 1.359 | 13.46(1) | 13.83(6) | 13.1(1) | – | – |
| 11 | J1358+1145 | 0.810 | 12.51(4) | 13.30(24 | 12.6(1) | 14.9(14) | – |
| 12 | J1358+1145 | 0.704 | 13.33(3) | < 12.18 | 13.18(3) | 15.15(3) | – |
| 13 | J0103+1332 | 1.048 | 13.51(3) | 13.90(5) | 13.48(1) | – | – |
| Quasar ID | redshift | b [kpc] | [deg] | [Zn/Fe]obs | [Zn/Fe] model |
|---|---|---|---|---|---|
| J1422-0001 | 1.083 | 12 | 15 | 0.5 | 0.5(1) |
| HE2242-60 | 2.32 | 26 | 20 | 0.42 | 0.32(10) |
| J2357-2736 | 0.815 | 7 | 68 | 0.61 | 0.62(10) |
| J0226-2857 | 1.022 | 2 | 60 | 0.87 | 0.85(10) |
Continued from Figure 4.
Continued from Figure 4.
Continued from Figure 4.
Continued from Figure 4.