Dying of the Light: An X-ray Fading Cold Quasar at
Abstract
Cold quasars are a rare subpopulation observed to host unobscured, X-ray luminous active galactic nuclei (AGN) while also retaining a cold gas supply fueling high star formation rates. These objects are interpreted as AGN early in their evolution. We present new SOFIA HAWC+ far-infrared observations, FUV-FIR photometry, and optical spectroscopy to characterize the accretion and star formation behavior in a cold quasar at (CQ 4479). CQ 4479 is a starburst galaxy with a predominantly young stellar population and a high gas mass fraction of . The AGN component has yet to become the dominant component of the FIR emission. We also find AGN bolometric luminosity that varies as a function of observation method and AGN region probed. Finally, we identify a candidate outflow feature corroborating the hypothesis that cold quasars have energetic feedback. This object presents an intriguing look into the early stages of AGN feedback and probes the rare phase where an AGN and cold gaseous component coexist.
Subject headings:
Active galactic nuclei (16); Infrared excess galaxies (789); Galaxy evolution (594); Galaxy quenching (2040); X-ray quasars (1821);1. Introduction
Galaxies observed in the local universe result from the interplay between a given galaxy’s stellar, gas, dust, and supermassive black hole (SMBH) components. In the most massive galaxies ( M⊙), the current paradigm evokes a gas-rich, highly star-forming past that is ended via a feedback mechanism induced by an active phase of accretion onto the SMBH (Henriques et al., 2015; Amarantidis et al., 2019). This so-called active galactic nucleus (AGN) phase results in the injection of significant levels of radiative and mechanical energy into the interstellar medium (ISM) of its host, effectively quenching star formation (Benson et al., 2003). The transition period between star-forming and quenched galaxies, and the role of the AGN in this transition, remains a poorly understood phase of galaxy evolution (Heckman & Best, 2014, and references therein).
Characterized as unobscured X-ray sources (LX 1044 erg s-1, MB -23, Kirkpatrick et al., 2020) with a cold dust component (S 30 mJy), cold quasars represent a short-lived phase where AGN and starburst coexist. Star-bursting quasars have been previously observed, albeit at high (; Walter et al., 2009; Leipski et al., 2014; Decarli et al., 2018). This has made follow-up observations difficult, especially toward the goal of constraining host galaxy properties. Cold quasars present a complementary opportunity to investigate FIR detected quasars at low redshift. A key result from cold quasars is their enhanced WISE MIR band emission in comparison to other unobscured quasars. Kirkpatrick et al. (2020) found 72 of WISE-detected cold quasars hosted W3Vega 11.5, in comparison to 19 of a redshift-matched unobscured quasar population also from Stripe82X. These MIR features point toward several potential explanations: an optically thin obscuring torus, a clumpy torus or large-scale obscuring medium, and/or contamination from the concurrent star formation episode. To better understand the origin and structure of the central engine, we obtain new SOFIA observations to follow up on new cold quasar candidates with LX and MB within a factor of 3 of the original classification criteria to more accurately discern the origin of the dust emission in these rare objects.
We present a case study the of the cold quasar SDSS J014040.71+001758.1 using data from the X-ray to the far-IR, including new observations using SOFIA HAWC+. These observations are used to decompose the stellar, dust, and AGN components through spectral energy distribution (SED) fitting. We discuss the target and observations in Section 2. The multi-wavelength emission and SED fitting process is described in Section 3, with a discussion on these results in Section 4. We summarize our conclusions in Section 5. In this work, we assume a standard cosmology with = 70 km s-1 Mpc-1, = 0.3, and = 0.7 (Planck Collaboration et al., 2016). All magnitudes are reported in the AB magnitude system unless specified otherwise (Oke & Gunn, 1983).
2. Object and Multiwavelength Data
2.1. Target Information
SDSS J014040.71+001758.1 (hereafter CQ 4479) is a cold quasar located at R.A.J2000 of 1h 40m 40.71s and Decl.J2000 of 0 17 58.17 with a spectroscopic redshift of 0.405000.00003 from Sloan Digital Sky Survey (SDSS) Data Release 16 (DR16) (Albareti et al., 2017). CQ 4479 was originally observed as part of the Stripe 82X survey, a 31.3 deg2 noncontiguous region (LaMassa et al., 2013a, b, 2016) of the original Stripe 82 field that includes a total of 15.6 deg2 of overlapping XMM-Newton and Herschel/SPIRE coverage as part of the Accretion History of AGN survey (AHA111http://project.ifa.hawaii.edu/aha/; PI, M. Urry; see LaMassa et al. 2016 for full survey details).
CQ 4479 was not examined in the original Kirkpatrick et al. (2020) cold quasar sample due to its k-corrected X-ray luminosity (), which is below the original classification threshold of . In this work, we selected CQ 4479 for follow-up because of its combination of Herschel detection and classification as an optically classified broadline quasar, as well as a secure narrow-line quasar (Kewley et al., 2006). We discuss this classification in Section 3.1.
2.2. X-Ray
The source was observed by XMM-Newton in the Stripe 82X observational campaign (LaMassa et al., 2013a, b, 2016) with an exposure time of 4.1 ks. The Stripe 82X coverage is a combination of archival XMM data and data awarded to us from two observing campaigns, one covering deg2 from AO10 (LaMassa et al., 2013a) and the other covering 15.6 deg2 from AO13 (LaMassa et al., 2016). CQ 4479 was specifically observed in the LaMassa et al. (2013a) dataset with a pixel scale of 4.1″and individual European Photon Imaging Camera exposure field of view of 30′.
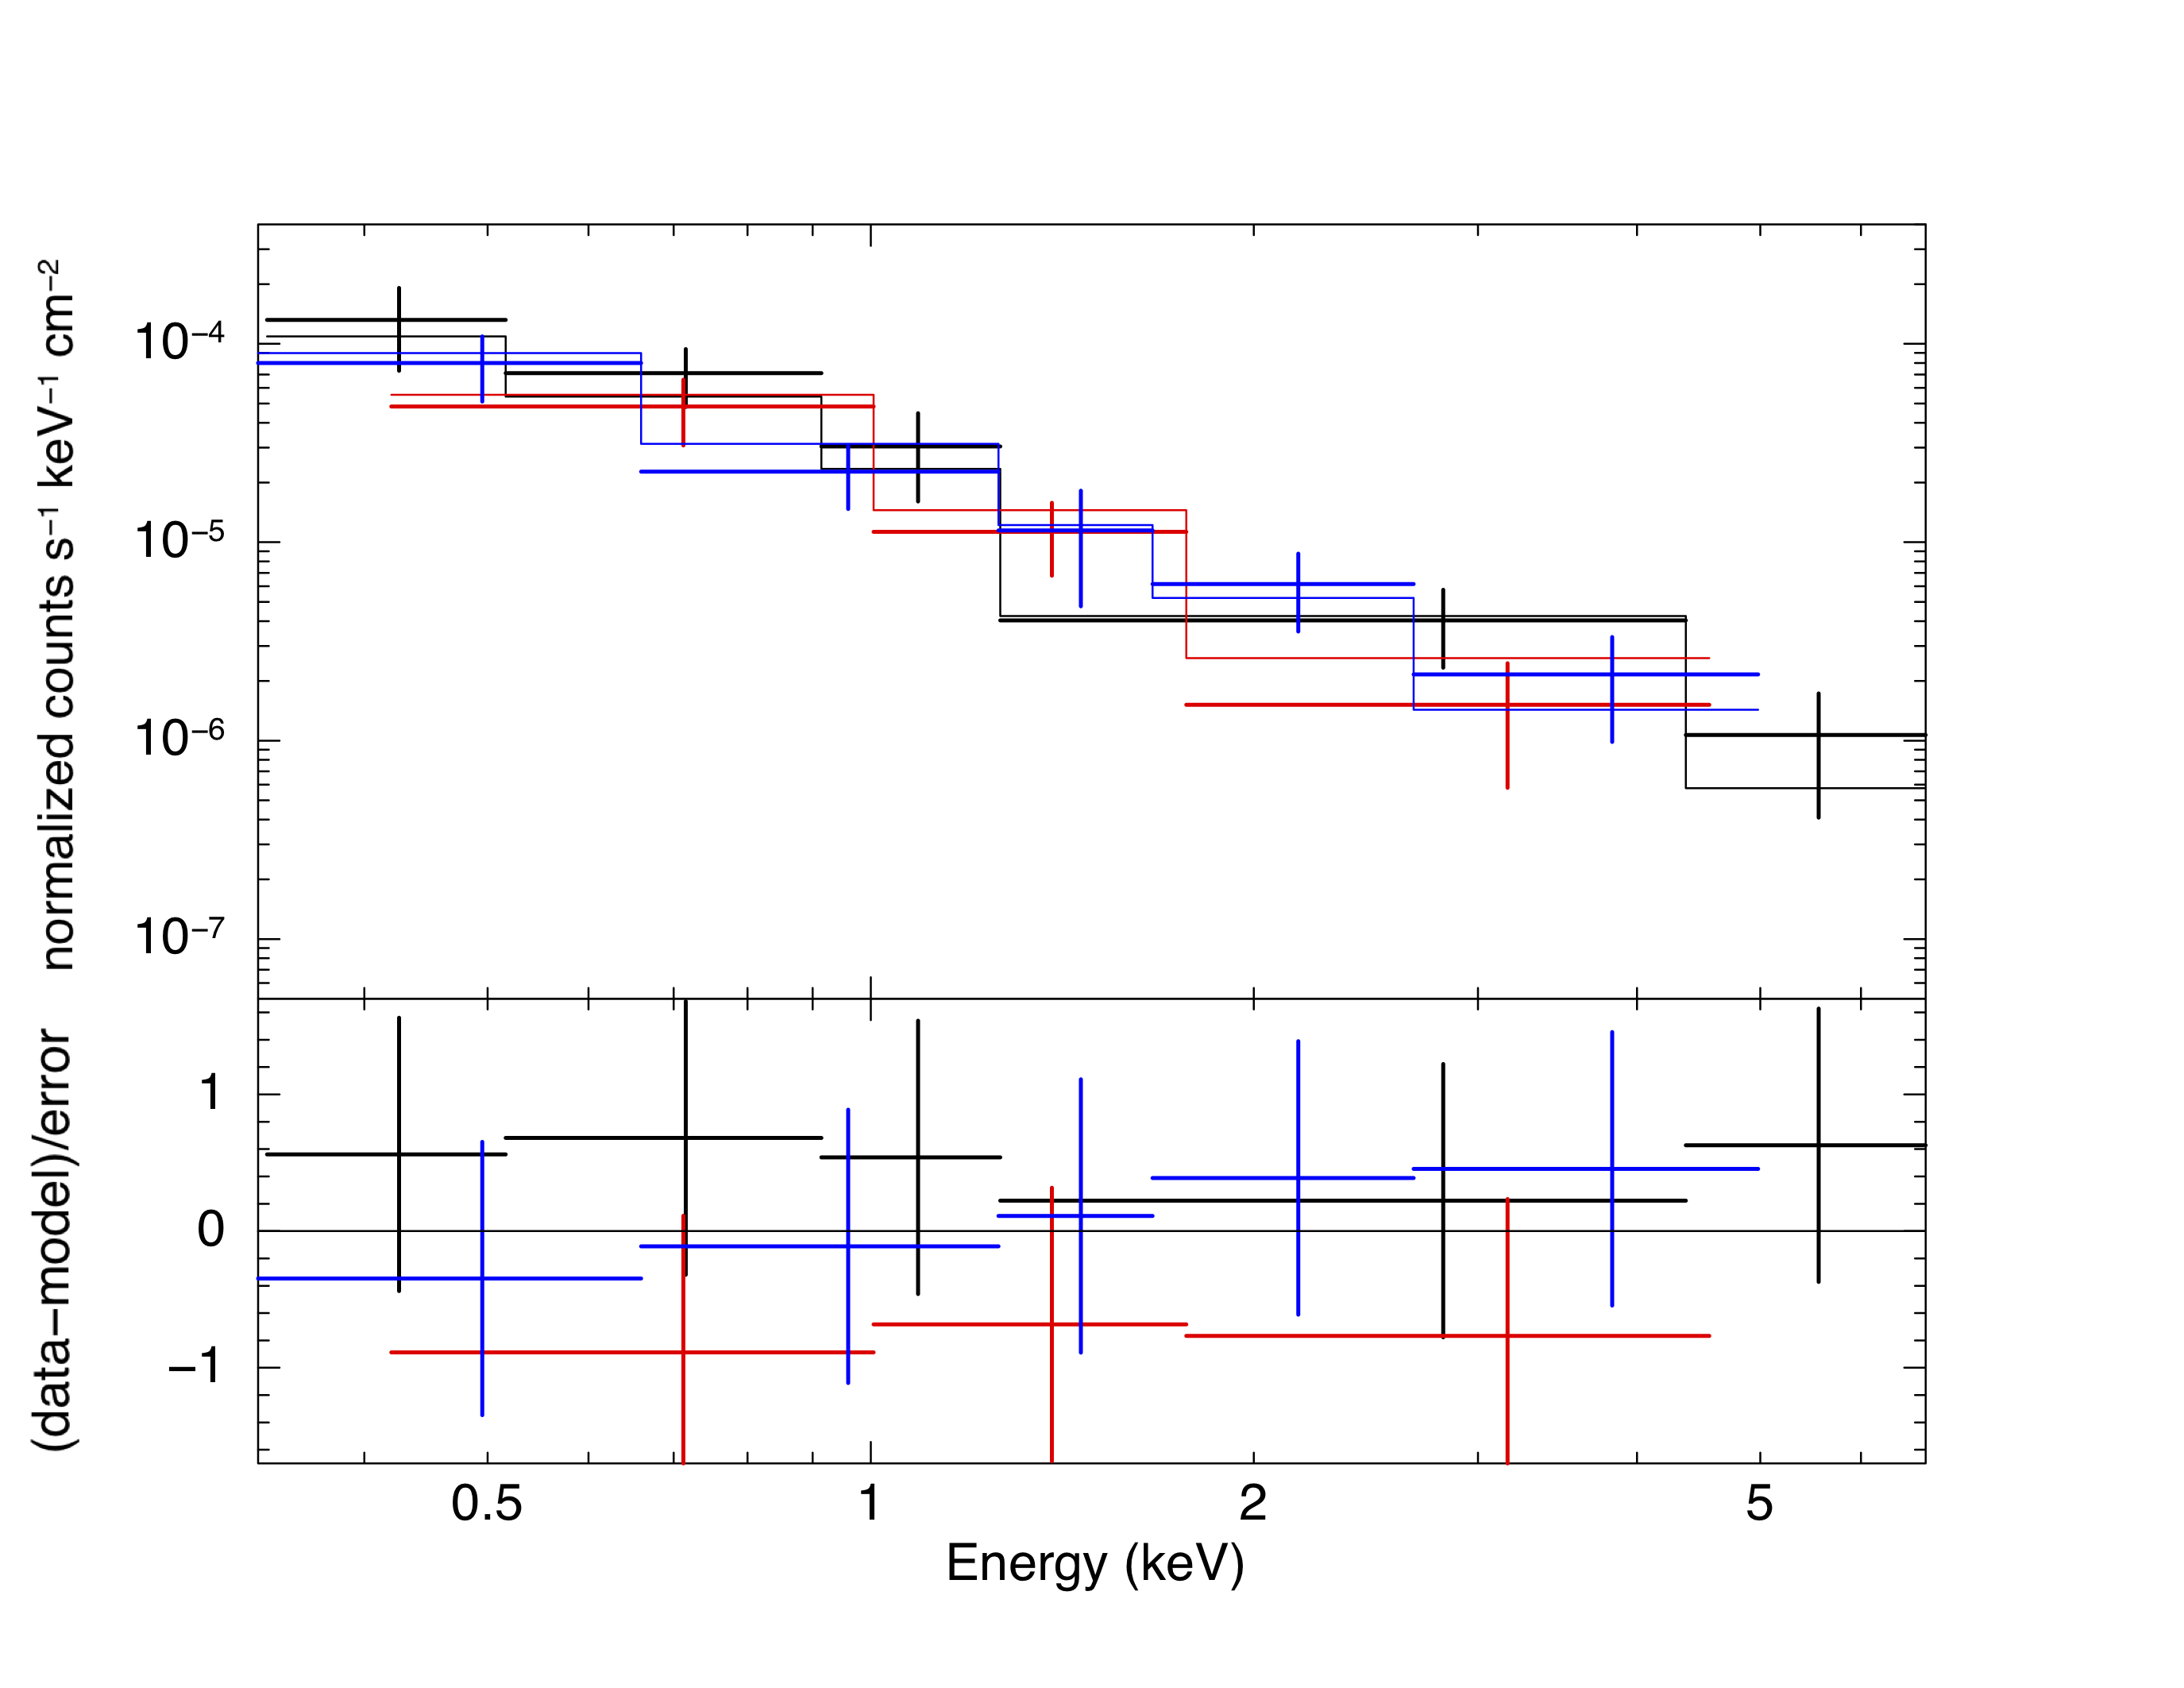
The spectral analysis (Peca et al. in preparation) using this data reveals 82 net counts after background subtraction in the Full (0.3-10 keV) band. The hardness ratio, defined as , where and are the net count rates in the Hard (2-10 keV) and Soft (0.3-2 keV) bands, can be used to identify obscuration when assuming a power law with an absorber model (LaMassa et al., 2016). CQ4479 has a hardness ratio of . The negative HR, observed at = 0.405, is typical of unobscured AGN (LaMassa et al., 2016).
The X-ray spectrum (Figure 1) is modeled with an absorbed power law plus a galactic absorption of cm-2. The best-fit model yields an unobscured ( cm-2) AGN, with a steep power-law photon index, ( and errors at 90% confidence level), from which we can infer a higher accretion rate than commonly observed at this redshift (e.g., Shemmer et al., 2008; Risaliti et al., 2009). The derived absorption-corrected and k-corrected X-ray luminosity is erg s -1, with 90% error confidence levels. To explore how sensitive our fit luminosity is to fitting procedure, we also fit the X-ray spectrum with a fixed upper limit for and left as a free parameter. This fit results in a steeper power law and a lower deabsorbed intrinsic AGN luminosity of erg s -1. Finally, we fix , leaving as a free parameter and estimate a luminosity of erg s -1, also recovering an unobscured quasar solution with an upper limit of cm-2. All fits are consistent with an unobscured AGN system at the heart of CQ 4479 (Table 1); however, the individual fits are limited in their ability to converge due to our net source count of 82 photons. Therefore we proceed in the analysis with the best-fit model yielding erg s -1.
| Model | (cm-2) | |
|---|---|---|
| Free | ||
| -fixed | [2.4] | |
| -fixed | 2.7 | [] |
| -fixed | [2.7] |
Note. — X-ray spectrum fit parameter results from an absorbed power-law fit corrected for galactic absorption. When both parameters are left free, or one of each parameter is fixed using previous fit results, we consistently find an upper limit solution to characteristic of an unobscured quasar.
2.3. Far-ultraviolet to Far-infrared Photometry
Far-ultraviolet (FUV) to far-infrared (FIR) observations are obtained from the Stripe 82X catalog (Ananna et al., 2017). The target has FUV and NUV coverage from GALEX (Martin et al., 2005), and optical coverage from the coadded SDSS catalogs (Jiang et al., 2014; Fliri & Trujillo, 2015). In the infrared, Stripe 82X was observed with the Spitzer Space Telescope at 3.6 and 4.5 (Papovich et al., 2016; Timlin et al., 2016) as well as the WISE 3.4, 4.6, 12, and 22 bands (Wright et al., 2010). Herschel/SPIRE observations using 250, 350, and 500 bands are also available for the Stripe82X field from the Herschel Stripe82 Survey (HerS; Viero et al., 2014). For more information on the Stripe 82X catalog and its counterpart identification protocol, please see LaMassa et al. (2016) and Ananna et al. (2017).
2.4. SOFIA HAWC+ Observations
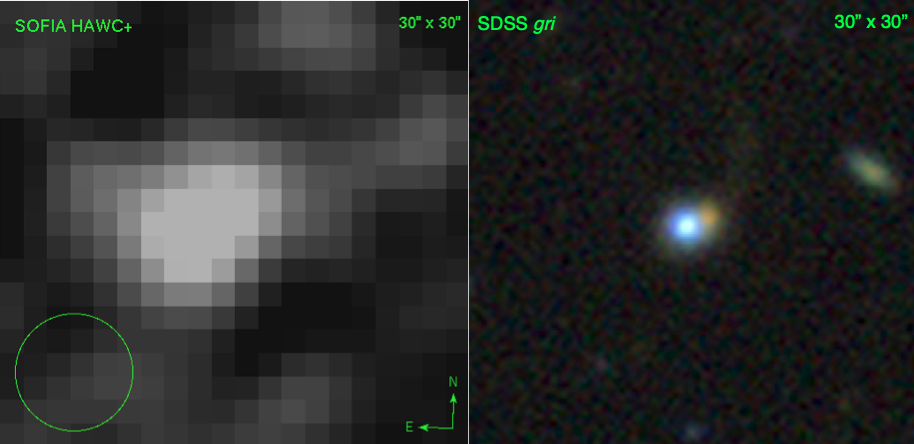
Due to the large gap in spectral coverage from 22 to 250 , crucial for measuring the dust-obscured star formation rate (SFR) and the AGN contribution to the mid-IR, new observations using SOFIA/HAWC+ (Dowell et al., 2013; Smith et al., 2014) were taken using band C at 89 µm (PI: A. Kirkpatrick, PID: 07-0096). CQ 4479 was observed for 7223 s on 2019 September 7 during SOFIA Cycle 7 using the HAWC+ total intensity OTFMAP mode with a Lissajous pattern in nominal water vapor conditions. At this redshift, each 1.55 pixel subtends a linear width of 8.4 kpc. The total field of view of HAWC+ in this setup is 4.2′ by 2.7′, with an FWHM of 7.8. Following data acquisition, the observations were reduced using the HAWCDPR PIPELINE (Harper et al., 2018). Flux calibration was performed using an average reference calibration factor across the detector. Source extraction was performed using the CRUSH V. 2.50-2 detect routine (Kovács, 2006, 2008) in the faint object mode, yielding a flux measurement of mJy in a 7.8″ FWHM beam (SNR = 5.31). The SOFIA HAWC+ band C image is shown in Figure 2.
3. Results
3.1. Optical Emission Lines
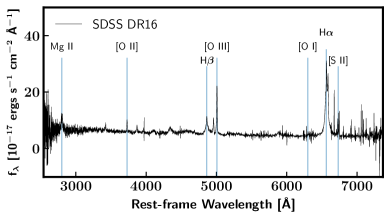
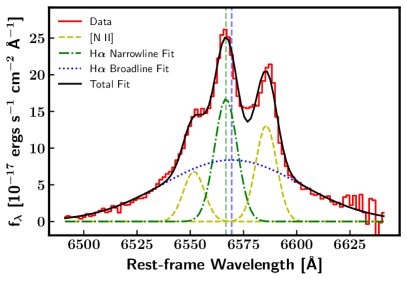
We analyze the optical emission lines using the SDSS-IV spectrum from Data Release 16 (Ahumada et al., 2020). The SDSS spectrum (Figure 3) exhibits classic Type-1 quasar emission, with broad Mg ii, H, and H emission lines. We measure the black hole mass by fitting a multicomponent Gaussian to the H/[N ii] complex at 6563 Å (Figure 4), which consists of a broad and narrow H component as well as the [N ii] doublet. We allow the normalization, central wavelength, and line widths to be independent parameters. We attribute the broadening behavior of the H line as being due to the gas moving under the gravitational influence of the black hole. We use the broad H component to determine the black hole mass with the relation,
| (1) |
where LHα and FWHMHα are the luminosity and FWHM of the broad H component Greene & Ho (2005). This yields M⊙.
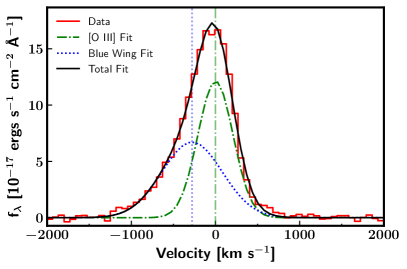
We also fit the H and [O iii] emissions with a model consisting of broad and narrow Gaussian components. The fit to the [O iii] emission line is shown in the bottom panel of Figure 4. The narrow [O iii] component has an FWHM of 492 km s-1, consistent with other Type 1 quasars (Schmidt et al., 2018). The [O iii] emission is asymmetric, with a blue wing centered at km s-1 from the [O iii] core and an FWHM of 845 km s-1, well within the typical range reported in the literature (Bian et al., 2005; Boroson, 2005; Schmidt et al., 2018). We compare the blue wing properties to the other optical emission lines in Table 3 and find no other component with a similar offset or FWHM estimate.
| Filter | () | Flux | Flux Err | Flux Units | |
|---|---|---|---|---|---|
| FUV | 0.152 | 17.5 | 1.1 | Jy | |
| NUV | 0.227 | 31.8 | 1.1 | Jy | |
| 0.354 | 59.2 | 0.3 | Jy | ||
| 0.477 | 89.5 | 0.1 | Jy | ||
| 0.623 | 122.0 | 0.2 | Jy | ||
| 0.762 | 154.0 | 0.4 | Jy | ||
| 0.913 | 203.1 | 1.3 | Jy | ||
| jVHS | 1.25 | 234.5 | 5.1 | Jy | |
| hVHS | 1.64 | 338.8 | 7.1 | Jy | |
| kVHS | 2.15 | 527.6 | 13.8 | Jy | |
| WISE1 | 3.40 | 715.8 | 17.8 | Jy | |
| IRAC1 | 3.56 | 807.3 | 5.9 | Jy | |
| IRAC2 | 4.51 | 1.03 | 0.01 | mJy | |
| WISE2 | 4.60 | 1.00 | 0.02 | mJy | |
| WISE3 | 12. | 3.11 | 0.2 | mJy | |
| WISE4 | 22. | 9.38 | 0.1 | mJy | |
| HAWC+ C | 89. | 75.4 | 14.2 | mJy | |
| SPIRE1 | 250. | 51.5 | 10.1 | mJy | |
| SPIRE2 | 350. | 20.8 | 10.2 | mJy | |
| SPIRE3 | 500. | 7.2 | 10.8 | mJy |
Note. — Observed and archival photometry with associated errors for each wave band used in the broadband SED fitting described in Section 3.2.
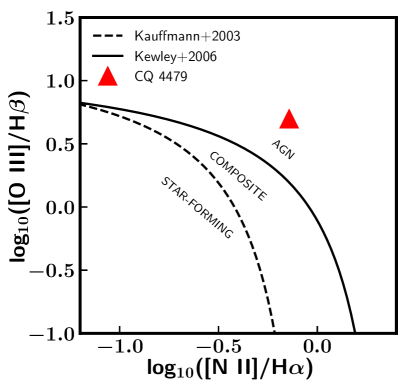
Finally, we use the narrow components of the optical emission lines to confirm the source of ionizing radiation, and CQ 4479 has clear signatures of a Type-1 AGN (Figure 5). The ratio of [N ii]/H vs. [O iii]/H falls securely in the AGN region of the BPT diagram (Baldwin et al., 1981), strongly indicating a high ionization state due to radiation from an AGN (Kauffmann et al., 2003; Kewley et al., 2006).
3.2. Broadband SED Fitting
We use two SED fitting packages to decompose the stellar, dust, and AGN contributors to the UV-FIR photometry (Table 2). We choose SED3FIT (Berta et al., 2013) and CIGALE (Burgarella et al., 2005; Boquien et al., 2019). Both codes employ an energy balance requirement to ensure that the dust luminosity is consistent with the energy provided by obscured stellar and AGN radiation. We chose to employ two codes to provide a consistency check. SED3FIT provides a direct estimation of the dust temperature, while CIGALE provides the faster run time and larger range of model libraries, enabling better systematic error estimation.
| Line | Flux | FWHM | Luminosity | velrelative | |
|---|---|---|---|---|---|
| (10-17erg s-1 cm-2) | (km s-1) | log10(erg s-1) | (km s-1) | ||
| H | 4863 | 101.960.90 | 2287 | 41.770.01 | +151.7 |
| H | 4862 | 18.500.61 | 559 | 41.030.01 | +77.6 |
| O III | 5008 | 92.090.27 | 492 | 41.730.01 | +75.5 |
| O III | 5003 | 87.510.40 | 845 | 41.700.01 | -202.41 |
| N II | 6551 | 55.931.05 | 531 | 41.510.01 | +85.3 |
| H | 6569 | 439.542.41 | 3475 | 42.400.01 | +219.9 |
| H | 6566 | 148.030.50 | 574 | 41.930.01 | +97.9 |
| N II | 6585 | 106.560.45 | 526 | 41.790.01 | +18.0 |
Note. — Best fit parameters derived from the SDSS optical emission line fits described in Section 3.1. Relative velocity is calculated with respect to the target’s spectroscopic redshift, with positive values denoting redshift and negative values denoting blueshift relative to the host. The blue wing component of the [O III] emission line occupies a distinct velocity space with respect to other lines.
| Input Parameters | SED3FIT w/ SOFIA | SED3FIT w/o SOFIA | CIGALE w/ SOFIA | CIGALE w/o SOFIA |
|---|---|---|---|---|
| Stellar Population | Bruzual & Charlot (2003) | Bruzual & Charlot (2003) | Bruzual & Charlot (2003) | Bruzual & Charlot (2003) |
| Dust | da Cunha et al. (2008) | da Cunha et al. (2008) | Draine et al. (2014)aaThe Draine et al. (2014) models are a modified version of the Draine & Li (2007) available in the public CIGALE distribution. | Draine et al. (2014)aaThe Draine et al. (2014) models are a modified version of the Draine & Li (2007) available in the public CIGALE distribution. |
| AGN Model | Feltre et al. (2012) | Feltre et al. (2012) | Fritz et al. (2006) | Fritz et al. (2006) |
| Initial Mass Function | Chabrier (2003) | Chabrier (2003) | Chabrier (2003) | Chabrier (2003) |
| Output Parameters | ||||
| SFR (M⊙ yr-1) | 78 20 | 38.19 2.26 | 95.55 4.59 | 51.85 2.68 |
| M∗ (1010 M⊙) | 3.11 0.2 | 3.01 0.13 | 2.19 0.37 | 2.11 0.39 |
| log10(sSFR (yr-1)) | -8.625 0.05 | -8.89 0.05 | -8.36 0.1 | -8.60 0.08 |
| 0.61 0.22 | … | 0.90 0.02 | 0.95 0.06 | |
| (K) | 59.15 26.3 | 39.163 14.73 | … | … |
| (1011 L⊙) | 6.76 2.29 | 3.43 1.54 | 8.28 0.41 | 4.10 0.28 |
| (108 M⊙) | 2.00 0.29 | 2.73 0.86 | 5.04 0.52 | 6.68 0.27 |
| (1010 M⊙) | 2.00 0.29 | 2.73 0.86 | 5.04 0.52 | 6.68 0.27 |
| (Gyr) | 0.256 | 0.71 | 0.526 | 1.28 |
| 9.7% | 28% | 10% | 20% | |
| 5.26 | 5.90 | 0.99 | 1.22 |
SED3FIT is a publicly available SED fitting package built upon the public MAGPHYS code (da Cunha et al., 2008), adding the capability to fit an AGN with the optical and IR components. For each target, both packages construct model libraries using stellar models from Bruzual & Charlot (2003) and IR dust models from da Cunha et al. (2008). In SED3FIT, AGN models from Feltre et al. (2012) are included across both optical and infrared fitting steps, and include both high and low viewing angle templates (Type-1 and Type-2 AGN, Urry & Padovani, 1995).
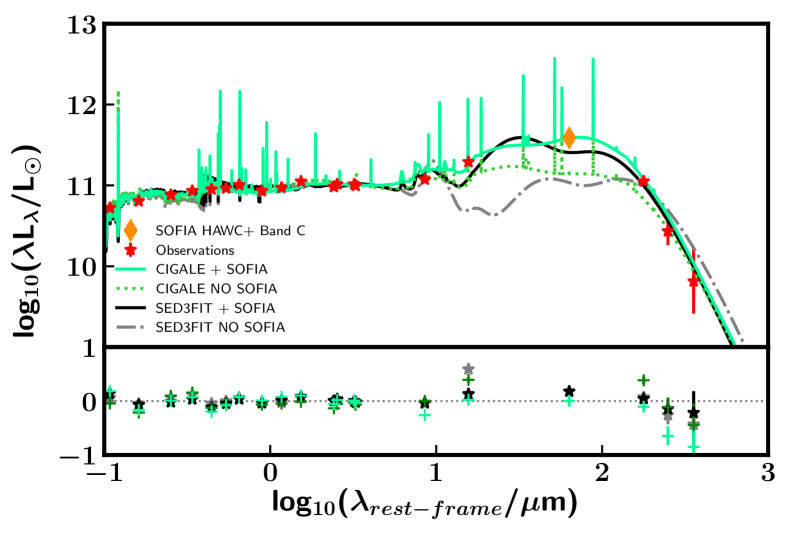
Code Investigating GALaxy Emission (CIGALE) is an SED fitting package that fits galaxy SEDs from the FUV to radio wave bands. We use Bruzual & Charlot (2003) stellar population models, Fritz et al. (2006) AGN models, and both the original Draine & Li (2007) and updated Draine et al. (2014) dust models. Both dust models produce consistent results, so we only list the results using Draine et al. (2014) in Table 4. CIGALE’s built-in nebular emission lines are also included. We compare the best-fit CIGALE and SED3FIT SEDs in Figure 6.
The fitted parameters from both SED packages, using and excluding the new SOFIA data, are cataloged in Table 4. The inclusion of the new SOFIA HAWC+ 89 photometry significantly changes the modeled FIR output of CQ 4479 and is an example of the powerful characterization possible with FIR detectors such as those on SOFIA or future telescope concepts such as Origins Space Telescope (Meixner et al., 2019). When the SOFIA 89 data is included in the fit, the IR luminosity (LIR) and SFR increase by a factor of two, while the AGN contribution to the LIR decreases by roughly the same amount. This drop in the AGN fraction is primarily due to the increase in the total infrared luminosity of the galaxy, rather than a change in the estimated amount of torus emission. That is, the fraction of AGN emission at 2.5-5.0 um changes very little in the fits with and without the SOFIA data (88% and 83% AGN fraction at these wavelengths, respectively). Therefore the critical difference in the SED fit when including SOFIA data is from the dust component of the IR fit rather than the AGN.
The fits from both fitting methods match reasonably well, with for best fits. Both packages agree that the AGN contribution to the IR emission from 8 to 1000 is low at 10%, and that the IR luminosity is strongly driven by SFRs of 90 M⊙ yr-1. We also run an alternate series of fits using upper limits for the SPIRE points and recover SFR estimates within the errors. We find a gas mass fraction () of %, where the gas mass derived from the dust mass, assuming a gas-to-dust ratio of 100 (Bohlin et al., 1978). In the analysis that follows, we use the SFR, , and from the CIGALE fit, given that the 0.99, better than that from the SED3FIT model.
4. Discussion
Cold quasars are a population of Type-1 quasars with extreme SFRs and high gas masses (Kirkpatrick et al., 2020). In the context of an evolutionary scenario when an unobscured quasar phase follows an obscured phase (e.g., Hopkins & Beacom, 2006), cold quasars would be caught in the act of transitioning, i.e. the AGN is dispersing the surrounding ISM in a process known as “blowout." In the case of CQ 4479, a blue wing component is observed as a component of the [O III] emission, and likely arises from an outflow close to the AGN powering a blowout phase, although without spatially resolved spectroscopy, we cannot determine the extent of the narrow-line region. Unobscured quasars in general have lower SFRs than cold quasars (Stanley et al., 2015, 2017; Kirkpatrick et al., 2020), and if the unobscured quasar phase directly precedes the “red and dead” elliptical phase, CQ 4479 may be in the process of quenching due to AGN and high SF activity.
4.1. Gas Depletion Timescale
To characterize the state of quenching, we estimate the gas depletion time (/SFR) to determine the likely future of CQ 4479. We estimate that the gas depletion times are extremely short, 0.5 Gyr, a factor of 2 or 6 shorter than local star-forming and quiescent galaxies (Saintonge et al., 2011). This is the gas depletion timescale due to star formation alone, but it is possible for the AGN to drive molecular outflows that can also deplete the gas reservoir further (Chen et al., 2020; Herrera-Camus et al., 2019, 2020). We therefore take 0.5 Gyr as an upper limit for .
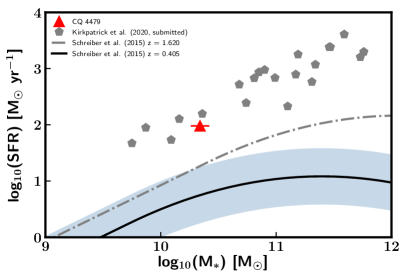
The short gas depletion timescale is consistent with its location on the SFR–stellar mass diagram (Figure 7), which would classify this galaxy as a star-bursting galaxy, nearly a factor of 30 above the star-forming main sequence (SFMS) prediction for SFR activity for a galaxy of this stellar mass (Schreiber et al., 2015).
We compare CQ 4479 with the primary cold quasar sample from Kirkpatrick et al. (2020) at . The full cold quasar sample also lies in the starbursting regime according to the SFR and redshift (Schreiber et al., 2015). Quenching has not yet begun in CQ 4479, based on its location in the starburst regime of the SFMS diagram, although the short reveals it may be imminent.
4.2. Fading X-Ray Emission?
Although the IR emission is dominated by star formation, the [O iii] luminosity, , can be used to provide an independent estimate of the bolometric luminosity due to the AGN using , appropriate for [O iii] emission uncorrected for extinction (Heckman et al., 2004). We measure the [O III] line flux of both the core and the blue wing and obtain erg s-1. To derive a bolometric luminosity, we only consider the narrow-line component erg s-1, yielding erg s-1. Due to the high estimated SFR estimated from the SED fit of CQ 4479, part of the [O iii] emission may arise from star formation. However, based on its location in the BPT diagram (Figure 5), Kauffmann & Heckman (2009) predict that at most 10% of the is due to star formation. To verify this hypothesis, we independently estimate the component of expected from a star-forming galaxy hosting 95.5 M⊙ yr of SF using the L–SFR relation of Drozdovsky et al. (2005), correcting to a Chabrier IMF, and assuming our measured [O III]/H ratio from the SDSS spectrum. We estimate that SF may be responsible for between 100% and 100% of the [O III], a poor constraint due to the several order of magnitude dispersion in the [O III]/H–SFR correlation at this redshift (Drozdovsky et al., 2005). However, our target remains consistent with the lower bound of this correlation.
CQ 4479 has a hard X-ray luminosity of erg s-1. From , we derive erg s-1, using the relation derived in Lusso et al. (2012) from a sample of keV detected AGN with spectroscopic redshifts. This is lower than [O iii], though they may be consistent at the extreme ends of range allowed by the uncertainties. Thus, CQ 4479 is underluminous in X-ray emission compared with the optical prediction.
As X-ray emission is not included in either of our SED fits, we use the 6 m emission of the SED fit’s AGN component to calculate the expected X-ray emission, following the relation in Stern (2015). We assume the torus model from the best-fit CIGALE model to calculate erg s-1, which gives an estimated erg s-1, twice as high as observed. This behavior has been previously observed in red quasars (Urrutia et al., 2012; Glikman et al., 2017), a subpopulation of AGN with near Eddington-limit accretion rates yet whose X-ray spectra are best fit by an absorbed power law. Additionally, this has been observed in hot dust-obscured galaxies (hot DOGs; Ricci et al., 2017), which are X-ray deficient subpopulations of quasars with FIR spectra that peak at much shorter wavelengths, 20 . While the FIR peaks we find are at cooler temperatures, to clarify the exact relationship between CQ4479 and hot DOGS would require further FIR observations.
The X-ray luminosity for CQ 4479 predicted by is more consistent with the higher levels of emission determined by optical properties. The best-fit CIGALE and SED3FIT AGN models can likewise be integrated to determine the bolometric luminosity of the AGN. Interestingly, these two fits give discrepant results. The SED3FIT AGN component has a bolometric luminosity of erg s-1, while CIGALE estimates erg s-1. SED3FIT is consistent with the [O iii]-derived while CIGALE is consistent with the X-ray-based . This is most likely due to the differing amounts of AGN emission each model predicts in the optical, and illustrates the sensitivity of AGN derived properties to the particular SED fitting code employed. derived from SED packages has not been as well-calibrated in large samples as using , , and , so we only discuss the latter below.
The weaker X-ray emission than predicted by and hints that accretion onto CQ 4479 is declining at the time of observation (Sartori et al., 2018; Ichikawa et al., 2019), or there X-ray emission is obscured and the spectrum cannot constrain accurately. Physically, the X-ray emission arises from the corona, which has the closest proximity to the accretion disk. It is therefore the most instantaneous measure of the accretion rate. Next in proximity is the infrared emission arising from the torus, typically on scales of pc. Finally, the [O iii] emission arises from the narrow-line region, typically pc from the central BH. The size of the narrow-line region varies greatly from galaxy to galaxy, and has been found to span up to 20 kpc (e.g., Hainline et al., 2016). It is the most extended emission in AGN, and therefore traces the accretion rate of the AGN on the longest timescales. CQ 4479 is a particularly tidy case, where increases as the physical tracer increases in distance from the AGN, pointing to a scenario when the accretion was higher in the past and is steadily decreasing (Harrison, 2017). This AGN may be caught in the act of turning off, supporting the scenario where cold quasars are in a special, short-lived transition phase. It is important to note the uncertainties in the bolometric correction, especially in the X-ray, and the X-ray luminosity estimated might not be the unabsorbed luminosity.
Alternatively, it is important to consider that the broad emission lines are driven by far-UV ionizing radiation that, like the corona, also comes from the inner disk. With BLR reverberation time delays of weeks it is difficult to explain how CQ 4479 would be underluminous in X-rays but still have a luminous BLR. Previous work has generally suggested they are rapidly accreting (e.g. Brandt et al., 2000) and wind-dominated systems (e.g. Gibson et al., 2008). Broad absorption line quasars (BALQSOs) are generally X-ray weak and fit this picture (Boroson, 2002); however, the link between Eddington ratio and X-ray weakness remains under investigation (e.g. Vito et al., 2018).
4.3. Predicting the Future of CQ 4479
We can predict CQ 4479’s future stellar mass and black hole mass growth. First, we calculate the black hole accretion rate, , using the formula:
| (2) |
where is the radiative efficiency of the accretion disk, which we assume to be (e.g., Shakura & Sunyaev, 1973). Using and , we find and 0.11 M⊙ yr-1, respectively. We also calculate the Eddington ratio, , which can be thought of as a specific accretion rate. Using and , we find 0.61 and 0.22, respectively. Both of the these Eddington ratios are energetic and commensurate with what is typically found in luminous quasars (e.g. Aird et al., 2012). The specifically suggests near-Eddington accretion, explaining the X-ray weakness (Brandt et al., 2000) and making it likely this target has strong winds similar to other X-ray weak quasars (e.g., Gibson et al., 2008). These Eddington ratios also support the steep X-ray spectrum, which is indicative of a high accretion rate.
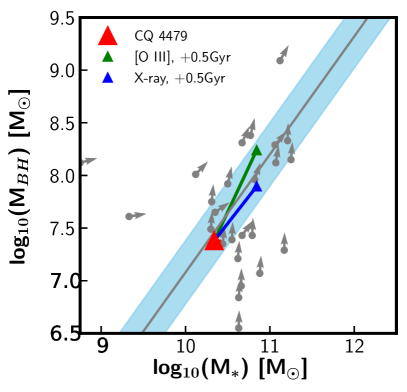
Finally, we examine the growth rate of the supermassive black hole relative to the stellar population. We cannot separate this galaxy into bulge and disk components, so we compare the black hole mass to the total stellar mass in Figure 8. CQ 4479 lies on the relation observed in local galaxies (Häring & Rix, 2004). However, CQ 4479 still has a substantial gas reservoir remaining, so it will continue to evolve in this parameter space. We estimate in what direction this galaxy will evolve using the specific growth rates of the stellar mass and black hole mass (M∙). For the stellar population, we measure (using the CIGALE fit) a specific star formation rate of specific SFR, Gyr-1. For the black hole, we measure specific black hole mass growth rate s Gyr-1, using and , respectively. The [O iii]-derived s is outpacing the sSFR, while the X-ray-derived s is almost exactly the same as sSFR. Assuming that the gas reservoir only lasts for 0.5 Gyr, and the SFR and remain essentially unchanged, we calculate where CQ 4479 will end up in the parameter space when its gas reservoir is depleted. Despite the different growth rates, this galaxy winds up within the scatter of the relationship currently measured for local galaxies. However, the final black hole masses differ by a factor of 3. Based on the specific growth rates, the stellar and black hole mass components of CQ 4479 are growing in lock-step, rather than the quasar phase following the starburst phase as theoretically expected (Hopkins & Beacom, 2006; Kocevski et al., 2017; Caplar et al., 2018). We note that with the uncertainties present in the X-ray luminosity and [O III]–LBol conversion, this model remains a hypothesis to be tested by further observations.
Sun et al. (2015) measured the direction of change (‘flow’) of Herschel-detected broad-line AGN in the same parameter space. We compare CQ 4479 to their sample. Approximately 60% of their sample have black holes that are growing proportionately faster than the stellar component at higher redshift, although most of these galaxies lie below the relation. What is particularly interesting about CQ 4479 relative to the larger sample is the predicted young age of the stellar component from both the best-fit CIGALE and SED3FIT models. Both point toward a mass-weighted or -band-weighted age of Myr or shorter, similar to . This indicates a relatively young stellar population and a galaxy that is about halfway through its star-forming lifetime. Sun et al. (2015) measure an AGN duty cycle of 10% for their sample. If CQ 4479’s black hole has been accreting at roughly 0.30 yr-1, then it would take approximately 50 Myr for it to build up its present BH mass, consistent with a 10% duty cycle. However, if the galaxy is younger, or the accretion rate is lower, the duty cycle becomes much closer to unity.
5. Conclusions
The transition period between a gas-rich star-forming galaxy and its quiescent future likely includes feedback driven by an actively accreting SMBH. To better understand how AGN are driving the evolution in their host galaxies, we conduct observations of CQ 4479 (SDSS J014040.71+001758.1) at z 0.405. CQ 4479 is a rare cold quasar, host to a cold dust component and a luminous AGN. Using newly acquired SOFIA/HAWC+ data at 89 , we determine the following regarding CQ 4479:
-
•
CQ 4479 is a starburst galaxy (SFR 95 M⊙ yr-1) with a cold dust component and an X-ray luminous central engine.
-
•
This object represents an early stage in AGN feedback, retaining a significant gas and dust supply with a molecular gas mass fraction of 50-70%.
-
•
The X-ray luminosity observed is significantly lower than expected based on optical emission line or 6 modeling, indicating a very recent decline in AGN energy output.
-
•
The [O iii] emission line exhibits the potential indicator of an outflow, consistent with the recently active AGN model.
CQ 4479 represents a rare window to observe the complex interplay between AGN and host galaxy. The detection of a cold gas supply, as well as the complex differences between X-ray bolometric luminosities, suggest a system with a potentially complex central engine that would strongly benefit from follow-up investigations.
References
- Ahumada et al. (2020) Ahumada, R., Allende Prieto, C., Almeida, A., et al. 2020, ApJS, 249, 3
- Aird et al. (2012) Aird, J., Coil, A. L., Moustakas, J., et al. 2012, ApJ, 746, 90
- Albareti et al. (2017) Albareti, F. D., Allende Prieto, C., Almeida, A., et al. 2017, ApJS, 233, 25
- Amarantidis et al. (2019) Amarantidis, S., Afonso, J., Messias, H., et al. 2019, MNRAS, 485, 2694
- Ananna et al. (2017) Ananna, T. T., Salvato, M., LaMassa, S., et al. 2017, ApJ, 850, 66
- Baldwin et al. (1981) Baldwin, J. A., Phillips, M. M., & Terlevich, R. 1981, PASP, 93, 5
- Benson et al. (2003) Benson, A. J., Bower, R. G., Frenk, C. S., et al. 2003, ApJ, 599, 38
- Berta et al. (2013) Berta, S., Lutz, D., Santini, P., et al. 2013, A&A, 551, A100
- Bian et al. (2005) Bian, W., Yuan, Q., & Zhao, Y. 2005, MNRAS, 364, 187
- Bohlin et al. (1978) Bohlin, R. C., Savage, B. D., & Drake, J. F. 1978, ApJ, 224, 132
- Boquien et al. (2019) Boquien, M., Burgarella, D., Roehlly, Y., et al. 2019, A&A, 622, A103
- Boroson (2005) Boroson, T. 2005, AJ, 130, 381
- Boroson (2002) Boroson, T. A. 2002, ApJ, 565, 78
- Brandt et al. (2000) Brandt, W. N., Laor, A., & Wills, B. J. 2000, ApJ, 528, 637
- Bruzual & Charlot (2003) Bruzual, G., & Charlot, S. 2003, MNRAS, 344, 1000
- Burgarella et al. (2005) Burgarella, D., Buat, V., & Iglesias-Páramo, J. 2005, MNRAS, 360, 1413
- Caplar et al. (2018) Caplar, N., Lilly, S. J., & Trakhtenbrot, B. 2018, ApJ, 867, 148
- Chabrier (2003) Chabrier, G. 2003, PASP, 115, 763
- Chen et al. (2020) Chen, X., Akiyama, M., Ichikawa, K., et al. 2020, ApJ, 900, 51
- da Cunha et al. (2008) da Cunha, E., Charlot, S., & Elbaz, D. 2008, MNRAS, 388, 1595
- Decarli et al. (2018) Decarli, R., Walter, F., Venemans, B. P., et al. 2018, ApJ, 854, 97
- Dowell et al. (2013) Dowell, C. D., Staguhn, J., Harper, D. A., et al. 2013, in American Astronomical Society Meeting Abstracts, Vol. 221, , 345.14
- Draine & Li (2007) Draine, B. T., & Li, A. 2007, ApJ, 657, 810
- Draine et al. (2014) Draine, B. T., Aniano, G., Krause, O., et al. 2014, ApJ, 780, 172
- Drozdovsky et al. (2005) Drozdovsky, I., Yan, L., Chen, H.-W., et al. 2005, AJ, 130, 1324
- Feltre et al. (2012) Feltre, A., Hatziminaoglou, E., Fritz, J., & Franceschini, A. 2012, MNRAS, 426, 120
- Fliri & Trujillo (2015) Fliri, J., & Trujillo, I. 2015, MNRAS, 456, 1359
- Fritz et al. (2006) Fritz, J., Franceschini, A., & Hatziminaoglou, E. 2006, MNRAS, 366, 767
- Gibson et al. (2008) Gibson, R. R., Brandt, W. N., Schneider, D. P., & Gallagher, S. C. 2008, ApJ, 675, 985
- Glikman et al. (2017) Glikman, E., LaMassa, S., Piconcelli, E., Urry, M., & Lacy, M. 2017, ApJ, 847, 116
- Greene & Ho (2005) Greene, J. E., & Ho, L. C. 2005, ApJ, 630, 122
- Hainline et al. (2016) Hainline, K. N., Hickox, R. C., Chen, C.-T., et al. 2016, ApJ, 823, 42
- Häring & Rix (2004) Häring, N., & Rix, H.-W. 2004, ApJ, 604, L89
- Harper et al. (2018) Harper, D. A., Runyan, M. C., Dowell, C. D., et al. 2018, Journal of Astronomical Instrumentation, 07, 1840008
- Harrison (2017) Harrison, C. M. 2017, Nature Astronomy, 1, 0165
- Heckman & Best (2014) Heckman, T. M., & Best, P. N. 2014, ARA&A, 52, 589
- Heckman et al. (2004) Heckman, T. M., Kauffmann, G., Brinchmann, J., et al. 2004, ApJ, 613, 109
- Henriques et al. (2015) Henriques, B. M. B., White, S. D. M., Thomas, P. A., et al. 2015, MNRAS, 451, 2663
- Herrera-Camus et al. (2019) Herrera-Camus, R., Tacconi, L., Genzel, R., et al. 2019, ApJ, 871, 37
- Herrera-Camus et al. (2020) Herrera-Camus, R., Sturm, E., Graciá-Carpio, J., et al. 2020, A&A, 633, L4
- Hopkins & Beacom (2006) Hopkins, A. M., & Beacom, J. F. 2006, ApJ, 651, 142
- Hunter (2007) Hunter, J. D. 2007, Computing in Science & Engineering, 9, 90
- Ichikawa et al. (2019) Ichikawa, K., Ueda, J., Bae, H.-J., et al. 2019, ApJ, 870, 65
- Jiang et al. (2014) Jiang, L., Fan, X., Bian, F., et al. 2014, ApJS, 213, 12
- Kauffmann & Heckman (2009) Kauffmann, G., & Heckman, T. M. 2009, MNRAS, 397, 135
- Kauffmann et al. (2003) Kauffmann, G., Heckman, T. M., Tremonti, C., et al. 2003, MNRAS, 346, 1055
- Kewley et al. (2006) Kewley, L. J., Groves, B., Kauffmann, G., & Heckman, T. 2006, MNRAS, 372, 961
- Kirkpatrick et al. (2020) Kirkpatrick, A., Urry, C. M., Brewster, J., et al. 2020, ApJ, 900, 5
- Kocevski et al. (2017) Kocevski, D. D., Barro, G., Faber, S. M., et al. 2017, ApJ, 846, 112
- Kovács (2006) Kovács, A. 2006, PhD thesis, Caltech
- Kovács (2008) Kovács, A. 2008, in Society of Photo-Optical Instrumentation Engineers (SPIE) Conference Series, Vol. 7020, Millimeter and Submillimeter Detectors and Instrumentation for Astronomy IV, ed. W. D. Duncan, W. S. Holland, S. Withington, & J. Zmuidzinas, 70201S
- LaMassa et al. (2013a) LaMassa, S. M., Urry, C. M., Glikman, E., et al. 2013a, MNRAS, 432, 1351
- LaMassa et al. (2013b) LaMassa, S. M., Urry, C. M., Cappelluti, N., et al. 2013b, MNRAS, 436, 3581
- LaMassa et al. (2016) LaMassa, S. M., Civano, F., Brusa, M., et al. 2016, ApJ, 818, 88
- LaMassa et al. (2016) LaMassa, S. M., Urry, C. M., Cappelluti, N., et al. 2016, ApJ, 817, 172
- Leipski et al. (2014) Leipski, C., Meisenheimer, K., Walter, F., et al. 2014, ApJ, 785, 154
- Lusso et al. (2012) Lusso, E., Comastri, A., Simmons, B. D., et al. 2012, MNRAS, 425, 623
- Martin et al. (2005) Martin, D. C., Fanson, J., Schiminovich, D., et al. 2005, ApJ, 619, L1
- Meixner et al. (2019) Meixner, M., Cooray, A., Leisawitz, D., et al. 2019, arXiv e-prints, arXiv:1912.06213
- Oke & Gunn (1983) Oke, J. B., & Gunn, J. E. 1983, ApJ, 266, 713
- Papovich et al. (2016) Papovich, C., Shipley, H. V., Mehrtens, N., et al. 2016, ApJS, 224, 28
- Perez & Granger (2007) Perez, F., & Granger, B. E. 2007, Computing in Science & Engineering, 9, 21
- Planck Collaboration et al. (2016) Planck Collaboration, Ade, P. A. R., Aghanim, N., et al. 2016, A&A, 594, A13
- Price-Whelan et al. (2018) Price-Whelan, A. M., Sipőcz, B. M., Günther, H. M., et al. 2018, AJ, 156, 123
- Ricci et al. (2017) Ricci, C., Assef, R. J., Stern, D., et al. 2017, ApJ, 835, 105
- Risaliti et al. (2009) Risaliti, G., Young, M., & Elvis, M. 2009, ApJ, 700, L6
- Robitaille et al. (2013) Robitaille, T. P., Tollerud, E. J., Greenfield, P., et al. 2013, A&A, 558, A33
- Saintonge et al. (2011) Saintonge, A., Kauffmann, G., Wang, J., et al. 2011, MNRAS, 415, 61
- Sartori et al. (2018) Sartori, L. F., Schawinski, K., Trakhtenbrot, B., et al. 2018, MNRAS, 476, L34
- Schmidt et al. (2018) Schmidt, E. O., Oio, G. A., Ferreiro, D., Vega, L., & Weidmann, W. 2018, A&A, 615, A13
- Schreiber et al. (2015) Schreiber, C., Pannella, M., Elbaz, D., et al. 2015, A&A, 575, A74
- Shakura & Sunyaev (1973) Shakura, N. I., & Sunyaev, R. A. 1973, A&A, 500, 33
- Shemmer et al. (2008) Shemmer, O., Brandt, W. N., Netzer, H., Maiolino, R., & Kaspi, S. 2008, ApJ, 682, 81
- Smith et al. (2014) Smith, E. C., Miles, J. W., Helton, L. A., et al. 2014, in Society of Photo-Optical Instrumentation Engineers (SPIE) Conference Series, Vol. 9147, Ground-based and Airborne Instrumentation for Astronomy V, ed. S. K. Ramsay, I. S. McLean, & H. Takami, 914706
- Stanley et al. (2015) Stanley, F., Harrison, C. M., Alexander, D. M., et al. 2015, MNRAS, 453, 591
- Stanley et al. (2017) Stanley, F., Alexander, D. M., Harrison, C. M., et al. 2017, MNRAS, 472, 2221
- Stern (2015) Stern, D. 2015, ApJ, 807, 129
- Sun et al. (2015) Sun, M., Trump, J. R., Brandt, W. N., et al. 2015, ApJ, 802, 14
- Timlin et al. (2016) Timlin, J. D., Ross, N. P., Richards, G. T., et al. 2016, ApJS, 225, 1
- Urrutia et al. (2012) Urrutia, T., Lacy, M., Spoon, H., et al. 2012, ApJ, 757, 125
- Urry & Padovani (1995) Urry, C. M., & Padovani, P. 1995, PASP, 107, 803
- van der Walt et al. (2011) van der Walt, S., Colbert, S. C., & Varoquaux, G. 2011, Computing in Science & Engineering, 13, 22
- Viero et al. (2014) Viero, M. P., Asboth, V., Roseboom, I. G., et al. 2014, ApJS, 210, 22
- Virtanen et al. (2020) Virtanen, P., Gommers, R., Oliphant, T. E., et al. 2020, Nature Methods, 17, 261
- Vito et al. (2018) Vito, F., Brandt, W. N., Luo, B., et al. 2018, MNRAS, 479, 5335
- Walter et al. (2009) Walter, F., Weiß, A., Riechers, D. A., et al. 2009, ApJ, 691, L1
- Wright (2006) Wright, E. L. 2006, PASP, 118, 1711
- Wright et al. (2010) Wright, E. L., Eisenhardt, P. R. M., Mainzer, A., et al. 2010, AJ, 140, 22