11email: adrian.bittner@eso.org22institutetext: Ludwig-Maximilians-Universität, Professor-Huber-Platz 2, 80539 München, Germany33institutetext: Departamento de Física de la Tierra y Astrofísica, Universidad Complutense de Madrid, E-28040 Madrid, Spain44institutetext: Instituto de Física de Partículas y del Cosmos, Universidad Complutense de Madrid, E-28040 Madrid, Spain55institutetext: Institute of Cosmology and Gravitation, University of Portsmouth, Burnaby Road, Portsmouth PO1 3FX, United Kingdom66institutetext: Max-Planck-Institut für Astrophysik, Karl-Schwarzschild-Str. 1, D-85748 Garching bei München, Germany77institutetext: Instituto de Astronomia, Geofísica e Ciências Atmosféricas, Universidade de São Paulo,
R. do Matão 1226, 05508-090 São Paulo, Brazil88institutetext: Instituto de Astrofísica de Canarias, Calle Vía Láctea s/n, E-38205 La Laguna, Tenerife, Spain99institutetext: Departamento de Astrofísica, Universidad de La Laguna, E-38200 La Laguna, Tenerife, Spain1010institutetext: Department of Astronomy and Atmospheric Sciences, Kyungpook National University, Daegu 702-701, Korea1111institutetext: Max-Planck Institut für Astronomie, Königstuhl 17, D-69117 Heidelberg, Germany1212institutetext: Departamento de Física Teórica y del Cosmos, Universidad de Granada, Facultad de Ciencias, E-18071, Granada, Spain1313institutetext: Instituto Universitario Carlos I de Física Teórica y Computacional, Universidad de Granada, E-18071 Granada, Spain1414institutetext: Observatorio Astronómico Nacional, C/Alfonso XII 3, Madrid E-28014, Spain1515institutetext: Caltech-IPAC, MC 314-6, 1200 E California Blvd, Pasadena, CA, 91125, USA1616institutetext: Department of Astrophysics, University of Vienna, Türkenschanzstraße 17, 1180 Wien, Austria
The inside-out formation of nuclear discs and the absence of old central spheroids in barred galaxies of the TIMER survey
The centres of disc galaxies host a variety of structures built via both internal and external processes. In this study, we constrain the formation and evolution of these central structures, in particular nuclear rings and nuclear discs, by deriving maps of mean stellar ages, metallicities and [/Fe] abundances. We use observations obtained with the MUSE integral-field spectrograph for the TIMER sample of 21 massive barred galaxies. Our results indicate that nuclear discs and nuclear rings are part of the same physical component, with nuclear rings constituting the outer edge of nuclear discs. All nuclear discs in the sample are clearly distinguished based on their stellar population properties. As expected in the picture of bar-driven secular evolution, nuclear discs are younger, more metal-rich, and show lower [/Fe] enhancements, as compared to their immediate surroundings. Moreover, nuclear discs exhibit well-defined radial gradients, with ages and metallicities decreasing, and [/Fe] abundances increasing with radius out to the nuclear ring. Often, these gradients show no breaks from the edge of the nuclear disc until the centre, suggesting that these structures extend to the very centres of the galaxies. We argue that continuous (stellar) nuclear discs may form from a series of bar-built (initially gas-rich) nuclear rings that grow in radius, as the bar evolves. In this picture, nuclear rings are simply the (often) star-forming outer edge of nuclear discs. Finally, by combining our results with those from a accompanying kinematic study, we do not find evidence for the presence of large, dispersion-dominated components in the centres of these galaxies. This could be a result of quiet merger histories, despite the large galaxy masses, or perhaps high angular momentum and strong feedback processes preventing the formation of these kinematically hot components.
Key Words.:
Galaxies: evolution – Galaxies: formation – Galaxies: spiral – Galaxies: stellar content – Galaxies: structure – Galaxies: bulges1 Introduction
Bars are prominent stellar structures frequently found in disc galaxies. Approximately 2/3 of all local disc galaxies exhibit a bar and this fraction is monotonically decreasing with increasing redshift, down to bar fractions of at (see e.g. Eskridge et al., 2000; Menéndez-Delmestre et al., 2007; Sheth et al., 2008; Aguerri et al., 2009; Méndez-Abreu et al., 2010; Kraljic et al., 2012; Sheth et al., 2012; Melvin et al., 2014). Nonetheless, in massive galaxies strong bars have been identified up to higher redshifts (; Simmons et al., 2014) and their existence at these redshifts has been inferred from studies of their stellar age distribution (see e.g. Gadotti et al., 2015; Pérez et al., 2017). In addition, it appears difficult to destroy bars, at least once they grew sufficiently strong (Athanassoula et al., 2005). Altogether, these studies suggest that bars influence the evolution of their host galaxies over timescales as long as about .
Bars evolve and influence galaxies in a variety of ways, which becomes clear when comparing barred and unbarred galaxies. For instance, the inner regions of barred galaxies show systematically higher metallicities and star formation rates (Ellison et al., 2011) as well as increased nuclear activity and accretion onto central black holes (Alonso et al., 2018). Moreover, bars typically exhibit flat age and metallicity gradients along their major axis, a clear indication of their influence on the inner discs of galaxies (see e.g. Sánchez-Blázquez et al., 2011; Fraser-McKelvie et al., 2019; Neumann et al., 2020). This influence is also evident in the fact that barred galaxies often show a light deficit in the disc surrounding the bar, an effect that is absent in unbarred galaxies and thought to be caused by the capture of disc stars (see e.g. James et al., 2009; James & Percival, 2016; Kim et al., 2016; Donohoe-Keyes et al., 2019).
One particularly interesting effect of bars is the creation of substructures in the nuclear region of disc galaxies such as nuclear rings and nuclear discs by redistributing angular momentum (Combes & Gerin, 1985). More specifically, the non-axisymmetric potential of the bar exerts strong tangential forces in the main disc which cause interstellar gas to shock and lose angular momentum. As a result, the gas streams inward along the leading edges of the bar. These large-scale streaming motions are typically highlighted by prominent dust lanes and are clearly evident in both numerical and observational studies (see e.g. Athanassoula, 1992b; Knapen, 2007; Cole et al., 2014; Fragkoudi et al., 2016). This inward gas flow is halted in the nuclear region of the galaxy, where the gas, due to its collisional nature, often settles in a nuclear ring where star formation proceeds. It has also been suggested that nuclear discs could be formed via the same mechanism, but extend to smaller radii (Piner et al., 1995; Sakamoto et al., 1999; Sheth et al., 2005; Sormani et al., 2015).
While there is convincing evidence that these nuclear rings and nuclear discs are built from gas that was funnelled to the centre by the bar, it remains unclear what physical mechanism determines the size of these structures. It has been suggested that the radius of nuclear rings is related to the Inner Lindblad Resonance (ILR) of the bar. Observationally, nuclear rings are often found close to the ILR and therefore it is argued that nuclear rings are a result of bar resonances111However, the ILR used in these studies only strictly holds in the mildly non-axisymmetric regime, and therefore is ill-defined for strong bars. (see e.g. Combes & Gerin, 1985; Knapen, 2005; Comerón et al., 2010). More precisely, Athanassoula (1992a, b) argues that the size of the nuclear ring is limited by the radial extent of the orbit family. However, Kim et al. (2012) suggests that the size of the nuclear ring is not determined by bar resonances, but instead given by the residual angular momentum of the inflowing gas. Another scenario was given by Sormani et al. (2018) who presents a mechanism for the origin of nuclear rings and finds that the size of the ring is set by the effect of viscous shear forces. Using numerical simulations, Seo et al. (2019) show that nuclear rings grow in size as the bar grows longer and funnels in gas from larger radii in the galactic disc. In line with this result, Knapen (2005), Comerón et al. (2010), and Gadotti et al. (subm., hereafter G20) find that the radii of nuclear rings and nuclear discs correlate with the bar length
Due to the collisional nature of the gas, the subsequent star formation generates stars in (near) circular orbits. More precisely, stellar nuclear discs are expected to be characterised by high rotational velocities and low velocity dispersions (see e.g. Cole et al., 2014). In an accompanying study, G20 uses the same integral-field spectroscopic observations of the TIMER survey (Time Inference with MUSE in Extragalactic Rings) employed in this study to confirm these expectations. In addition, they show that nuclear discs have exponential surface brightness profiles and dominate the stellar light in the centre of the galaxy. Similarly, numerical simulations expect nuclear discs to be younger and more metal-rich than the bar. In particular in the framework of secular evolution, nuclear discs form only after the formation of the bar and are thus expected to have stellar populations younger than those found in the bar. As star formation in these central regions continues one also expects their metal content to increase (Cole et al., 2014).
Numerical simulations show that the formation of nuclear discs can also be initiated by galaxy mergers (see e.g. Mayer et al., 2008; Chapon et al., 2013). However, the nuclear discs in these simulations are at least one order of magnitude smaller than those commonly produced in the bar-driven formation scenario. Interestingly, Comerón et al. (2010) finds that of all nuclear rings occur in unbarred galaxies. However, they show that in most of these cases there is evidence of some non-axisymmetry in the potential of the galaxy which might cause the formation of nuclear rings through mechanisms similar to those in the bar-driven scenario, albeit weaker.
Secular evolution continues to take effect within these stellar nuclear discs themselves. In fact, some nuclear discs develop bars themselves, resulting in the remarkable situation of having a small disc with a small bar embedded within a large disc with a large bar. These inner bars do not only resemble the shape of regular bars, but also seem to form and evolve in the same way main bars do (de Lorenzo-Cáceres et al., 2019b, 2020). In fact, inner bars buckle vertically just as main bars (Méndez-Abreu et al., 2019) and even exhibit the same correlation typically associated with bars (Bittner et al., 2019).
A variety of nomenclatures for these central substructures of galaxies has been established. Particularly common is the term “bulge” and its variations, as for instance “pseudo-bulge” and “disc-like bulge”. In this paper, we avoid the term “bulge” and instead use more physical descriptions of the stellar structures. In particular, we refer to a kinematically hot spheroid instead of using the term “classical bulge”. Bar-built central discs with typical sizes of hundreds of that are rotationally supported but kinematically distinct from the main galactic disc are denoted nuclear discs (see G20). This choice is made to avoid confusion with inner and outer discs in the context of breaks in the light profile of main discs of galaxies. Rings associated with the outermost edge of nuclear discs are named nuclear rings, in order to clearly distinguish them from inner and outer rings typically found close to and outside of the bar radius, respectively. Similarly, large scale bars found in main stellar discs of galaxies are simply denoted bars while smaller bars that form and evolve within nuclear discs themselves are called inner bars222In the literature inner bars are often also referred to as nuclear bars..
While the formation of nuclear rings and nuclear discs is thought to be bar-driven, the connection between nuclear rings and nuclear discs is still elusive. In particular, little is known about how the settling of gas near the ILR can originate a stellar disc that seems to extend from the nuclear ring inwards. In the present study, we build upon an accompanying study which investigates the stellar kinematics of nuclear discs (G20). Here we characterise nuclear discs based on their spatially resolved, mean stellar population properties. For the first time we observe nuclear discs in sufficiently high spatial resolution ( or less) to investigate detailed spatial changes in their population properties, even including [/Fe] abundances. In addition, we aim to establish if nuclear discs extend all the way to the galactic centre and how their properties compare to those of nuclear rings. Thanks to the superb quality of the data, we further explore the presence of composite structures consisting of nuclear discs and kinematically hot spheroids in the centres of these galaxies (see e.g. Méndez-Abreu et al., 2014; Erwin et al., 2015).
This paper is organised as follows. In Sect. 2 we introduce the TIMER survey and summarise its observation and data reduction strategy. The measurement of mean stellar population properties is described in Sect. 3 and its reliability and uncertainties discussed in Sect. 4. Our main observational results are presented in Sect. 5 and we discuss their physical implications in Sect. 6. We close with a summary of our findings in Sect. 7.
2 The TIMER survey
The TIMER project is a survey aiming to reconstruct the star formation histories of nuclear structures in order to constrain the formation time of bars and establish when the main discs of galaxies became dynamically mature. Building upon the results of a pilot study of NGC 4371 (Gadotti et al., 2015), the current TIMER sample consists of 24 barred galaxies with a large variety of bar-built central structures, such as nuclear rings, nuclear discs, and inner bars (Gadotti et al., 2019). To date, 21 galaxies have been observed with the Multi-Unit Spectroscopic Explorer (MUSE; Bacon et al., 2010) on the Very Large Telescope.
The TIMER sample has been selected from the Spitzer Survey of Stellar Structure in Galaxies (S4G; Sheth et al., 2010), thus naturally constraining the sample to nearby (), bright (), and large () objects. In addition, we required all galaxies to have inclinations below and central substructures as classified by Buta et al. (2015). The resulting sample covers a range in stellar mass from .
All observations were taken in ESO’s period 97 between April and September 2016. Using the wide-field-mode of the MUSE spectrograph, we obtained observations covering a wavelength range from with a spectral sampling of and a field of view of at a spatial sampling of . The typical seeing of the observations was . Each galaxy was observed with approximately one hour of integration on source and dedicated sky exposures.
The data reduction is based on version 1.6 of the MUSE data reduction pipeline (Weilbacher et al., 2012). In summary, bias, flat-fielding, and illumination corrections are applied, the data is calibrated in flux and wavelength, and telluric features are removed. Thanks to the dedicated sky exposures, the sky background is removed exploiting a principal component analysis. Finally, the observations are accurately registered astrometrically. A detailed accounting of the physical properties of the TIMER sample, observations, and data reduction is presented in Gadotti et al. (2019).
3 Data analysis
The analysis of the data, as reviewed in detail below, is conducted within the modular analysis framework of the GIST pipeline333http://ascl.net/1907.025 (Galaxy IFU Spectroscopy Tool; Bittner et al., 2019). More specifically, this software provides an all-in-one framework for the analysis of spectroscopic data, including all tasks from the preparation of the input data, over its scientific analysis, to the generation of publication quality plots.
We spatially bin the data to a signal-to-noise ratio of approximately 100 per bin, exploiting the adaptive Voronoi tessellation routine of Cappellari & Copin (2003). The signal-to-noise ratio per spaxel is measured within the wavelength range of , identical to the fitted wavelength range. The notably high signal-to-noise ratio is chosen to assure the robustness of the analysis, in particular as the derivation of stellar population properties is a signal-to-noise sensitive measurement. In a series of tests we found that increasing the signal-to-noise ratio from 40 to 80 results in more homogeneous stellar populations across contiguous spatial bins, as illustrated in Fig. 1. In other words, using a higher signal-to-noise ratio reduces the level of stochasticity in the stellar population properties in adjacent bins. This is at least partly due to an improved accuracy in the subsequent emission-line subtraction (see below). Further increasing the signal-to-noise ratio from 80 to 100 has only little effect on the obtained population properties. Nonetheless, we prefer to follow the more conservative approach of using a signal-to-noise level of 100. Owing to the high quality of our data, this does not significantly reduce the obtained spatial resolution in the nuclear discs. We further note that spaxels which surpass this signal-to-noise threshold, as commonly found in the centre of our fields, remain unbinned. Spaxels below the isophote level which has an average signal-to-noise level of 3 are excluded from the analysis, in order to avoid systematic effects in the low surface brightness regime.
Prior to any analysis, we de-redshift the spectra to rest-frame based on an initial guess of the systemic redshift. We further adopt as line-spread function the udf-10 parametrisation by Bacon et al. (2017) and broaden all template spectra to this resolution before conducting any fits. In a series of tests we explore the effect of different wavelength ranges on the derivation of stellar population properties. The results indicate that the red part of the spectra (beyond ) is, in contrast to the derivation of stellar kinematics, not suited for the measurement of the stellar population content. In particular, the lower sensitivity to stellar population properties in this part of the spectrum, small residuals from the sky subtraction, and absorption features from the interstellar medium add difficulties to the analysis. Therefore, we restrict the analysis to the wavelength range from .
The actual analysis is conducted in three separate steps. Firstly, we derive the stellar kinematics by performing an unregularised run of the pPXF routine (Cappellari & Emsellem, 2004; Cappellari, 2017). In order to account for small differences in the shape of the continuum between spectra and templates, we include a low order multiplicative Legendre polynomial in the fit. At this stage, all emission lines are masked. In the next step, we model emission lines by fitting single Gaussian templates with pyGandALF (Bittner et al., 2019), a new Python implementation of the original GandALF routine (Sarzi et al., 2006; Falcón-Barroso et al., 2006). The fitting routine linearly combines Gaussian emission-line templates with a set of spectral templates to obtain the emission-line properties. In this process, the stellar continuum and emission-lines are fit simultaneously, while keeping the stellar kinematics of the continuum fixed to those obtained before. Instead of a Legendre polynomial, pyGandALF exploits a two-component reddening correction. This correction accounts for “screen-like” dust extinction of the entire spectrum as well as for reddening that affects only the emission line regions. We note that the kinematics of the H and [OIII] lines are kept as free parameters in the fit, while the kinematics of [NI] are tied to that of [OIII]. If the amplitude-to-residual noise ratio of a measured emission line is at least four, we consider the line detection significant and subtract the emission line from the observed spectrum. In this way, we obtain emission-subtracted spectra. In addition to this quantitative check, the quality of the emission-line modelling is inspected visually. While the quality of the fits is good for the majority of the spectra, deviations are found in some regions that show starbursts or a significant AGN contribution. This is a result of the different dynamics and the superposition of distinct components (star-forming regions, AGN, etc.) in these regions which therefore cannot be modelled by a single Gaussian template. However, performing a detailed multi-component emission-line analysis for the entire sample is beyond the scope of this study, in particular as these small deviations in starbursting and AGN-affected regions do not affect our general conclusions on nuclear discs.
Finally, based on these emission-subtracted spectra, we perform a regularised run of the pPXF routine to estimate the mean stellar population properties. In order to avoid possible degeneracies between velocity dispersion and metallicity (see e.g. Sánchez-Blázquez et al., 2011), we fix the stellar kinematic to those obtained before. In addition, we apply a 8th order multiplicative Legendre polynomial in the fit that also accounts for extinction and other continuum effects. pPXF estimates non-parametric star formation histories by assigning weights to the spectral templates such that the observed spectrum is best reproduced. However, this measurement represents an inverse, ill-conditioned problem. Therefore, in order to obtain a physically meaningful solution, pPXF applies a regularisation during the fit (Press et al., 1992; Cappellari, 2017). Thus, of all equally consistent solutions, the regularised run of pPXF returns the smoothest solution that is still statistically consistent with the data in consideration. While the strength of the regularisation can have a substantial impact on the shape of individual star formation histories, the derived mean population properties we consider in this study show only little dependence on the chosen regularisation. Nonetheless, we follow the procedure of determining the maximum allowed regularisation parameter, as described, for instance, in McDermid et al. (2015). Firstly, the noise is rescaled in such a way that the resulting of the unregularised run is unity. Subsequently, the regularisation strength is increased iteratively until the of the regularised run exceeds that of the unregularised run by approximately , with being the number of spectral pixels included in the fit. This procedure is applied to the bin with the highest signal-to-noise ratio in each cube. In case of contamination of this spectrum by strong extinction, features from active galactic nuclei, or intense star formation, a spatial bin with similarly high signal-to-noise ratio in its close vicinity is used instead. The obtained regularisation strength is then applied to the entire galaxy. We note that for NGC 1365 and NGC 5728 the above procedure allowed conspicuously high regularisation strengths, possibly due to large-scale outflows from the active galactic nuclei. For these cases we therefore chose a lower regularisation strength of , similar to that obtained for the rest of the sample.
In Sect. 4, we investigate if the derived population properties depend on whether the [/Fe] enhancement is modelled in the pPXF fit or not. Therefore we repeat the analysis with two variants of the MILES single stellar population (SSP) models. Firstly, we use the MILES “base models” which follow the abundance pattern of stars in the solar neighbourhood (Vazdekis et al., 2010). At low metallicities these models show elevated values of [/Fe] enhancements, although the used isochrones are scaled-solar, while at high metallicities the [/Fe] values resemble the solar abundance. Secondly, we employ a combination of scaled-solar and [/Fe] enhanced MILES models (Vazdekis et al., 2015). These provide two values of [/Fe], namely (solar abundance) and (supersolar abundance). While the use of a SSP model library that covers only two values of [/Fe] is not optimal, pPXF is capable of interpolating between these two values and returns intermediate [/Fe] enhancements (see also Pinna et al., 2019). We note that full-spectral fitting codes are typically measuring an average [/Fe] ratio. In other words, in the models all elements are increased/decreased while in realistic galaxies different elements are decoupled from each other. In addition, different wavelength ranges are more sensitive to different elements. Therefore, the [/Fe] abundances returned by pPXF are a convoluted average of the underlying abundances of individual elements. For the sake of clarity, we choose to refer to [/Fe] abundances throughout this study.
Both sets of SSP models assume a Kroupa Revised IMF with a slope of 1.30 (Kroupa, 2001), use BaSTI isochrones (Pietrinferni et al., 2004, 2006, 2009, 2013), and have a spectral resolution of (Falcón-Barroso et al., 2011). The parameter space is sampled in 53 values of age between and and 12 values of stellar metallicity ([M/H]) between and .
Over the past years, several fitting routines for the measurement of stellar population properties have been implemented. In order to assess the systematic effects related to different software implementations, we again repeat the analysis with STECMAP (Ocvirk et al., 2006a, b). To this end, we employ the same emission-subtracted spectra and fix the stellar kinematics to those initially obtained with pPXF. Since STECMAP is not designed to model [/Fe] abundances, we only use the base models here.
The above analysis is performed in such a way that light-weighted results are obtained. This is achieved by normalising each spectral template by its own mean flux within the used wavelength range. In order to convert those light-weighted stellar population properties to mass-weighted ones, we employ the mass-to-light ratio predictions of the SSP models. In particular, this mass-to-light ratio includes not only the remaining mass in the stellar component but also the mass of all resulting stellar remnants.
The light- and mass-weighted population properties are averaged via
| (1) | |||||
| (2) | |||||
| (3) |
with the weight assigned to the th template with age , metallicity , and an [/Fe] enhancement of . Hence, stellar ages are averaged in linear scale while metallicities and [/Fe] abundances are averaged logarithmically.
4 Stability and errors of the measurements
In this section we further explore the reliability of the derived mean stellar population properties. First, we discuss the effect that modelling the [/Fe] abundances has on ages and metallicities, before comparing results obtained with the pPXF and STECMAP routines. We do not intend to provide a thorough software comparison here, but simply mean to check our results with a second, independent analysis. This also allows us to better understand error estimates on the derived stellar populations properties.
4.1 Population properties with and without [/Fe] modelling
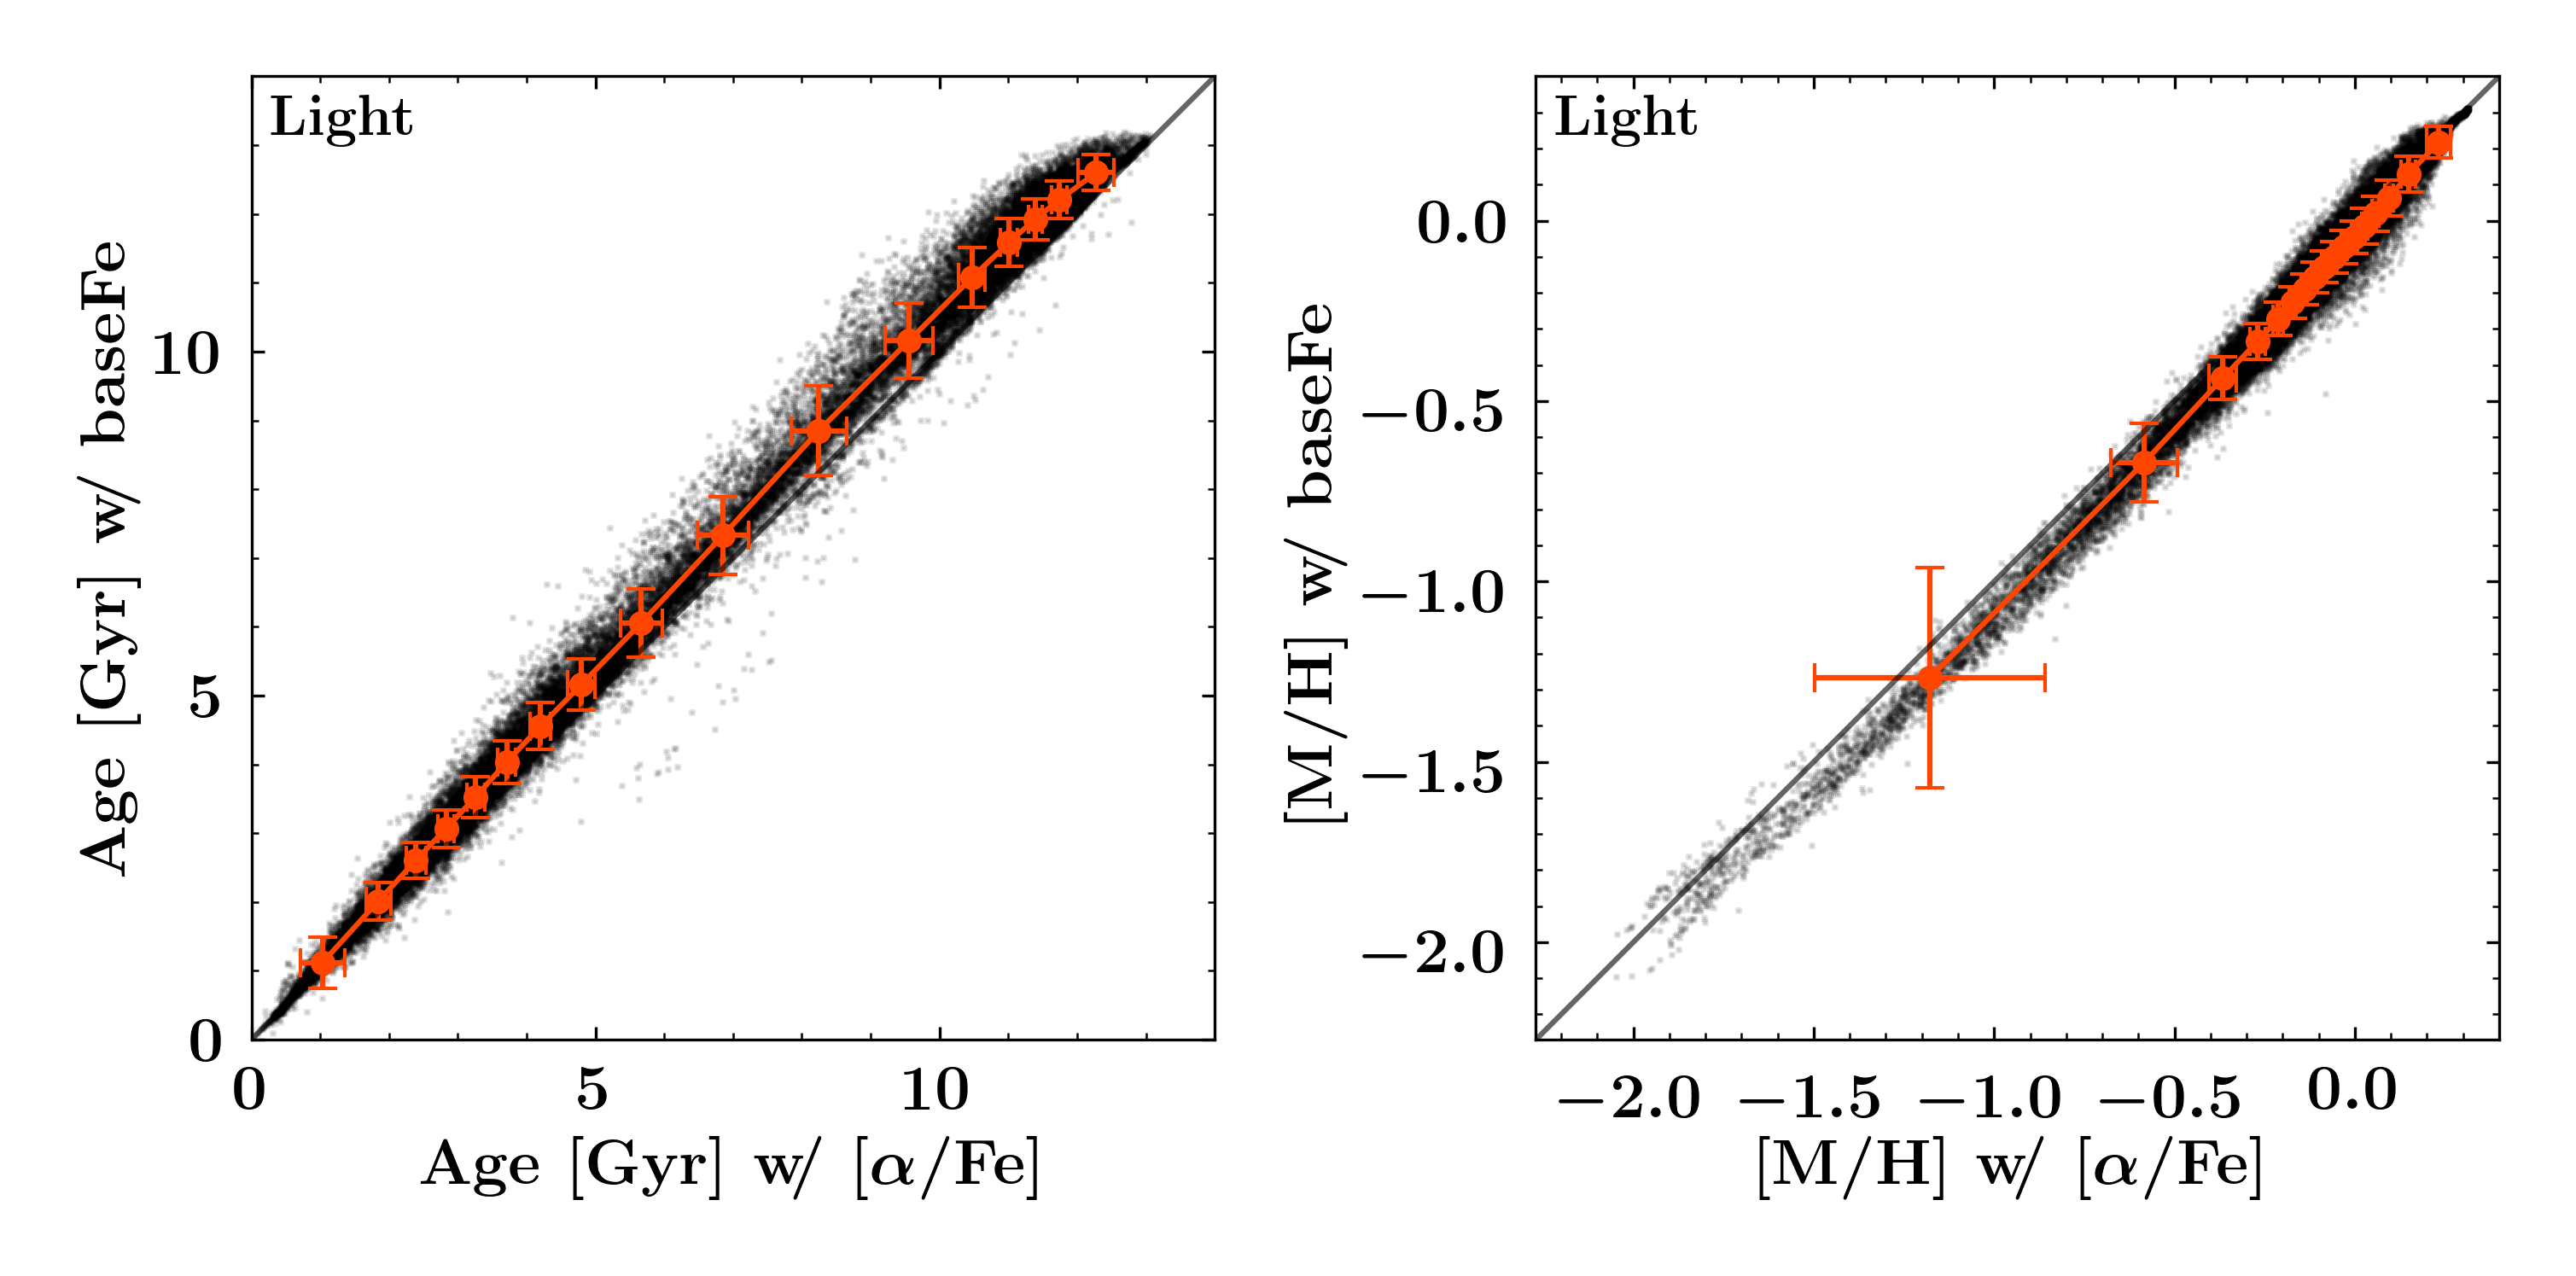
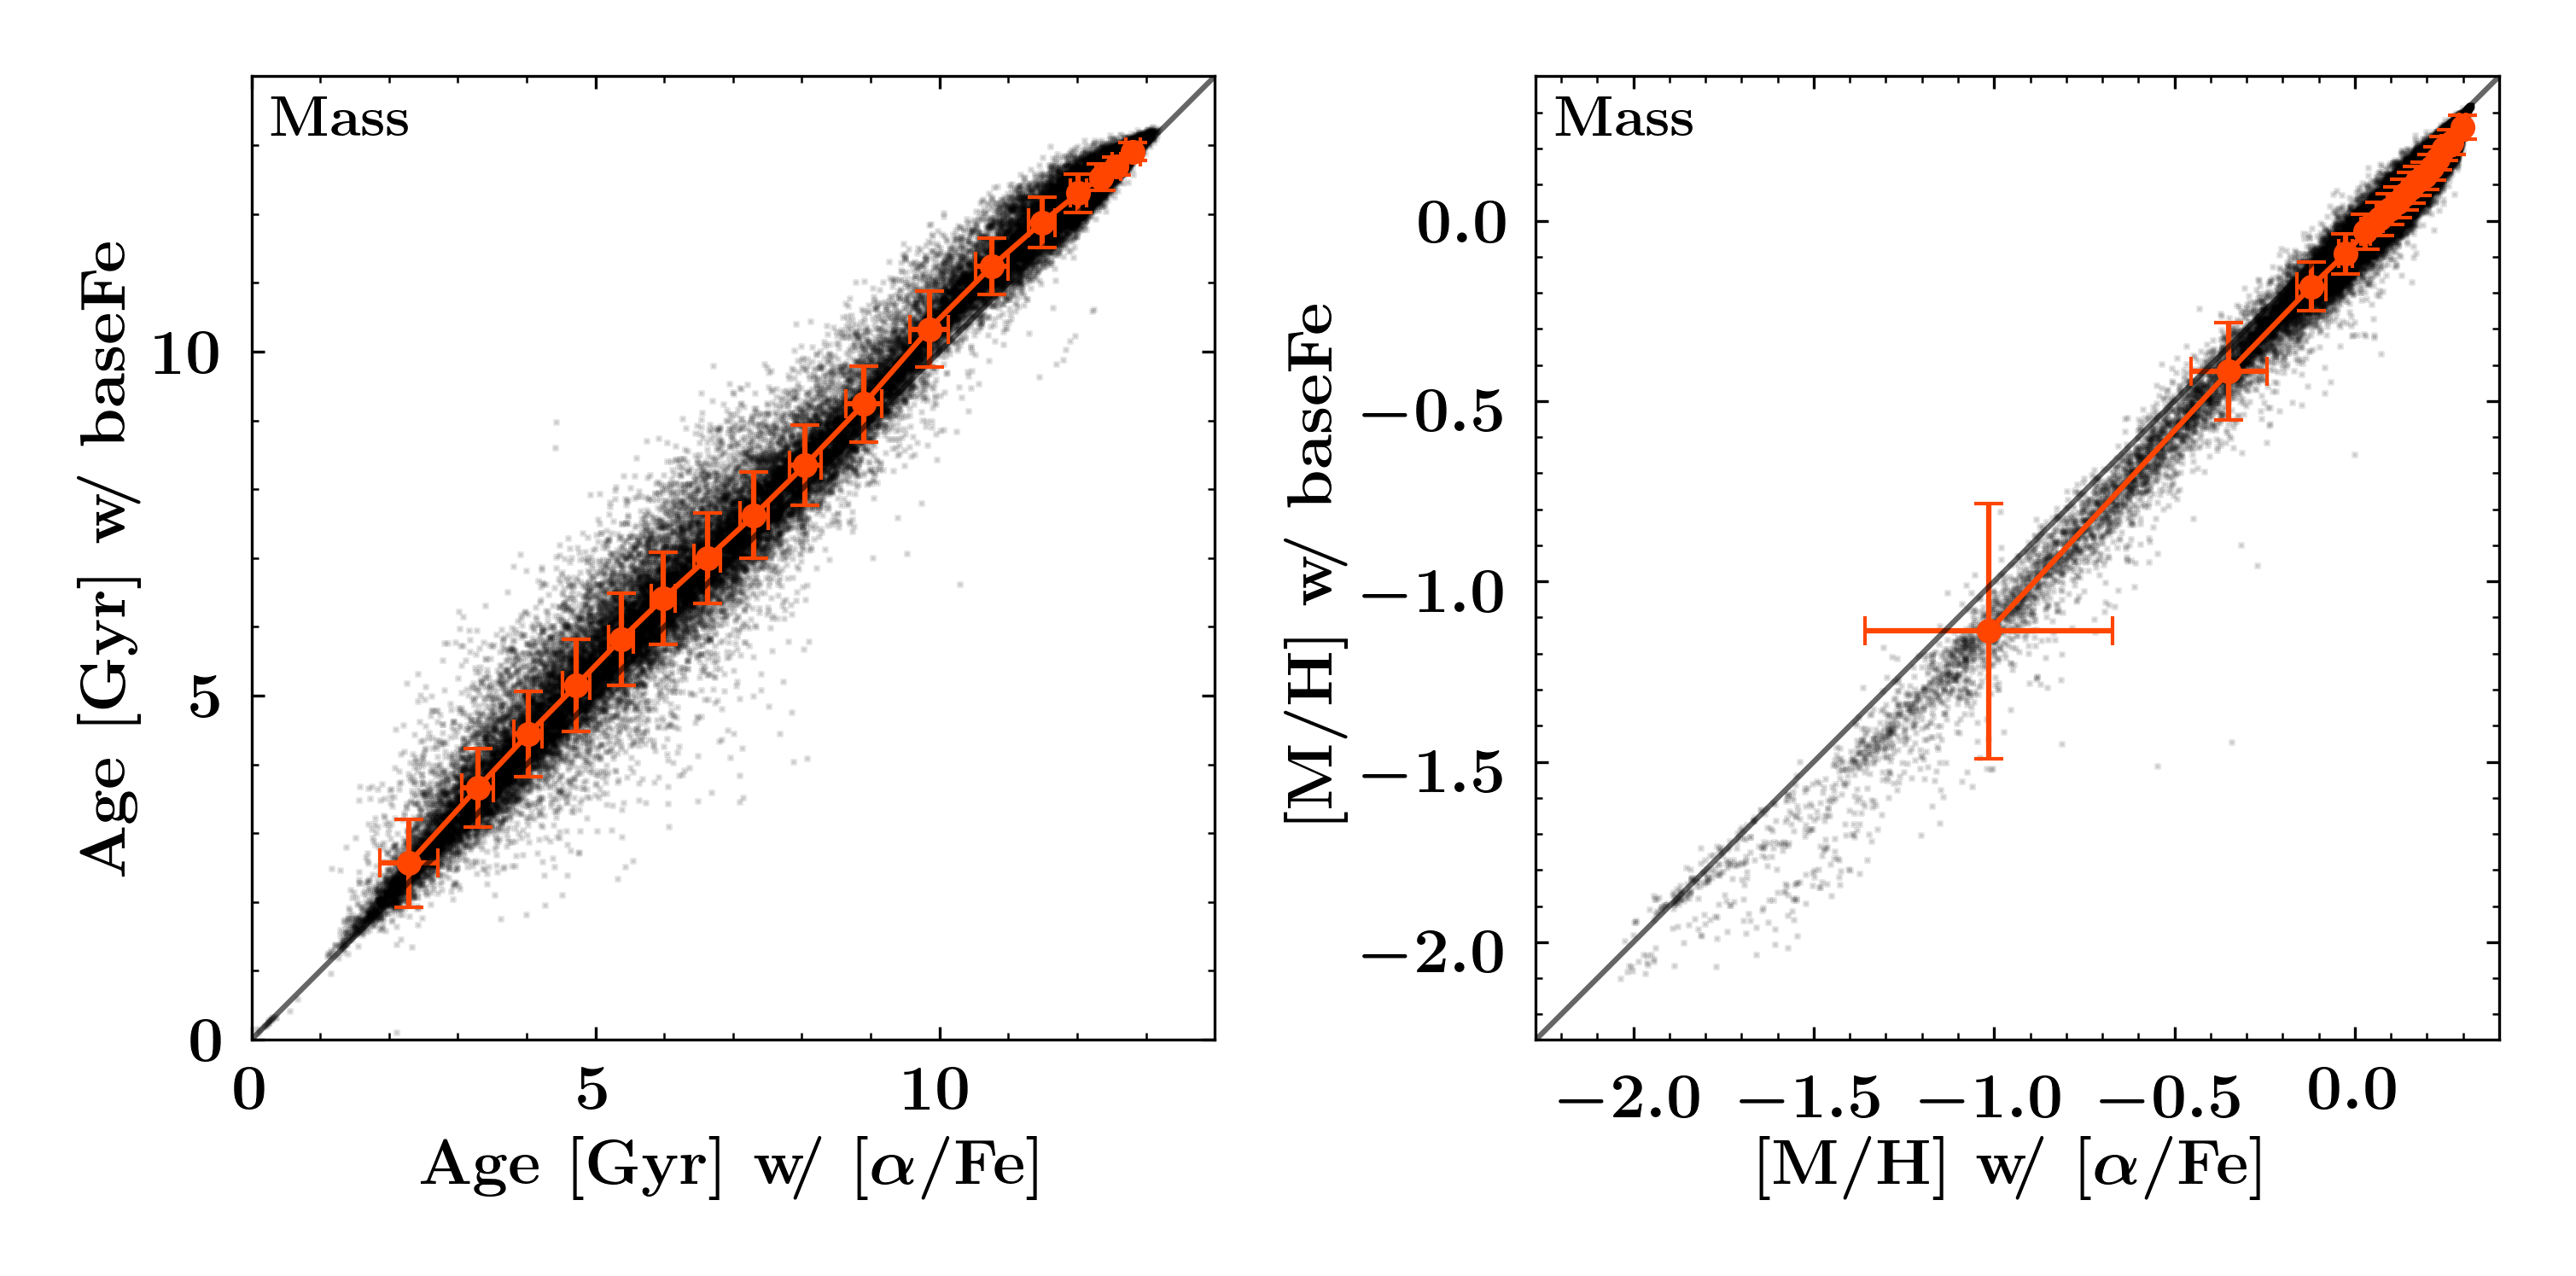
To date, most stellar population spectral libraries do not provide spectra with varying [/Fe] abundances. Similarly, not all full spectral fitting codes are designed to model [/Fe] enhancements in the fitting process. Here we test whether stellar ages and metallicities obtained with or without the modelling of [/Fe] abundances are consistent. In Fig. 2 we plot population properties derived with pPXF without the modelling of [/Fe] and using base models as a function of those derived with [/Fe] modelling and the enhanced templates.
In the case of the light-weighted results, we find a very good agreement between the two runs, with the median standard deviation of all 17 bins being and in age and [M/H], respectively. For the mass-weighted results, the correspondence is good as well, with slightly older ages and lower metallicities being obtained without the [/Fe] modelling. The corresponding median standard deviation of all bins is in age and in metallicity. We thus conclude that ages and metallicities obtained with pPXF depend only little on whether [/Fe] abundances are included in fitting processes or not.
Nonetheless, we find a small systematic offset in the measured metallicities. At the lowest metallicities, the fit that uses the MILES base models returns systematically lower metallicities. This effect seems to be related to the chemical composition of the base models that might differ from the abundance pattern of the observed spectra. This is confirmed by repeating the analysis of NGC 1097, now using models with [/Fe] enhancements of and separately. While the analysis using models with [/Fe] = 0.00 returns slightly lower metallicities compared to the run with varying [/Fe] abundances, the fits with [/Fe] = 0.40 return systematically higher metallicities. In fact, this behaviour is expected, as the typical [/Fe] abundances measured in the low metallicity bins of NGC 1097 is approximately . Nonetheless, the measured systematic differences of approximately are slightly smaller than the typical errors estimated for this measurement (, see Sect. 4.3) and only a relatively small number of bins in the TIMER sample have such low metallicities.
4.2 Population properties from pPXF and STECMAP
Over time, a large set of well-known fitting routines for the derivation of non-parametric star formation histories was developed, for instance MOPED (Heavens et al., 2000), pPXF (Cappellari & Emsellem, 2004; Cappellari, 2017), STARLIGHT (Cid Fernandes et al., 2005), STECKMAP (Ocvirk et al., 2006a, b), VESPA (Tojeiro et al., 2007), ULySS (Koleva et al., 2009), FADO (Gomes & Papaderos, 2017), or FIREFLY (Wilkinson et al., 2017). As different routines are based on distinct fitting methodologies with diverse code implementations, the results obtained with different software might vary. Therefore, it is important to repeat the data analysis with various routines, to better understand the involved systematics. In the following we compare the stellar population properties obtained with the pPXF and STECMAP routines.
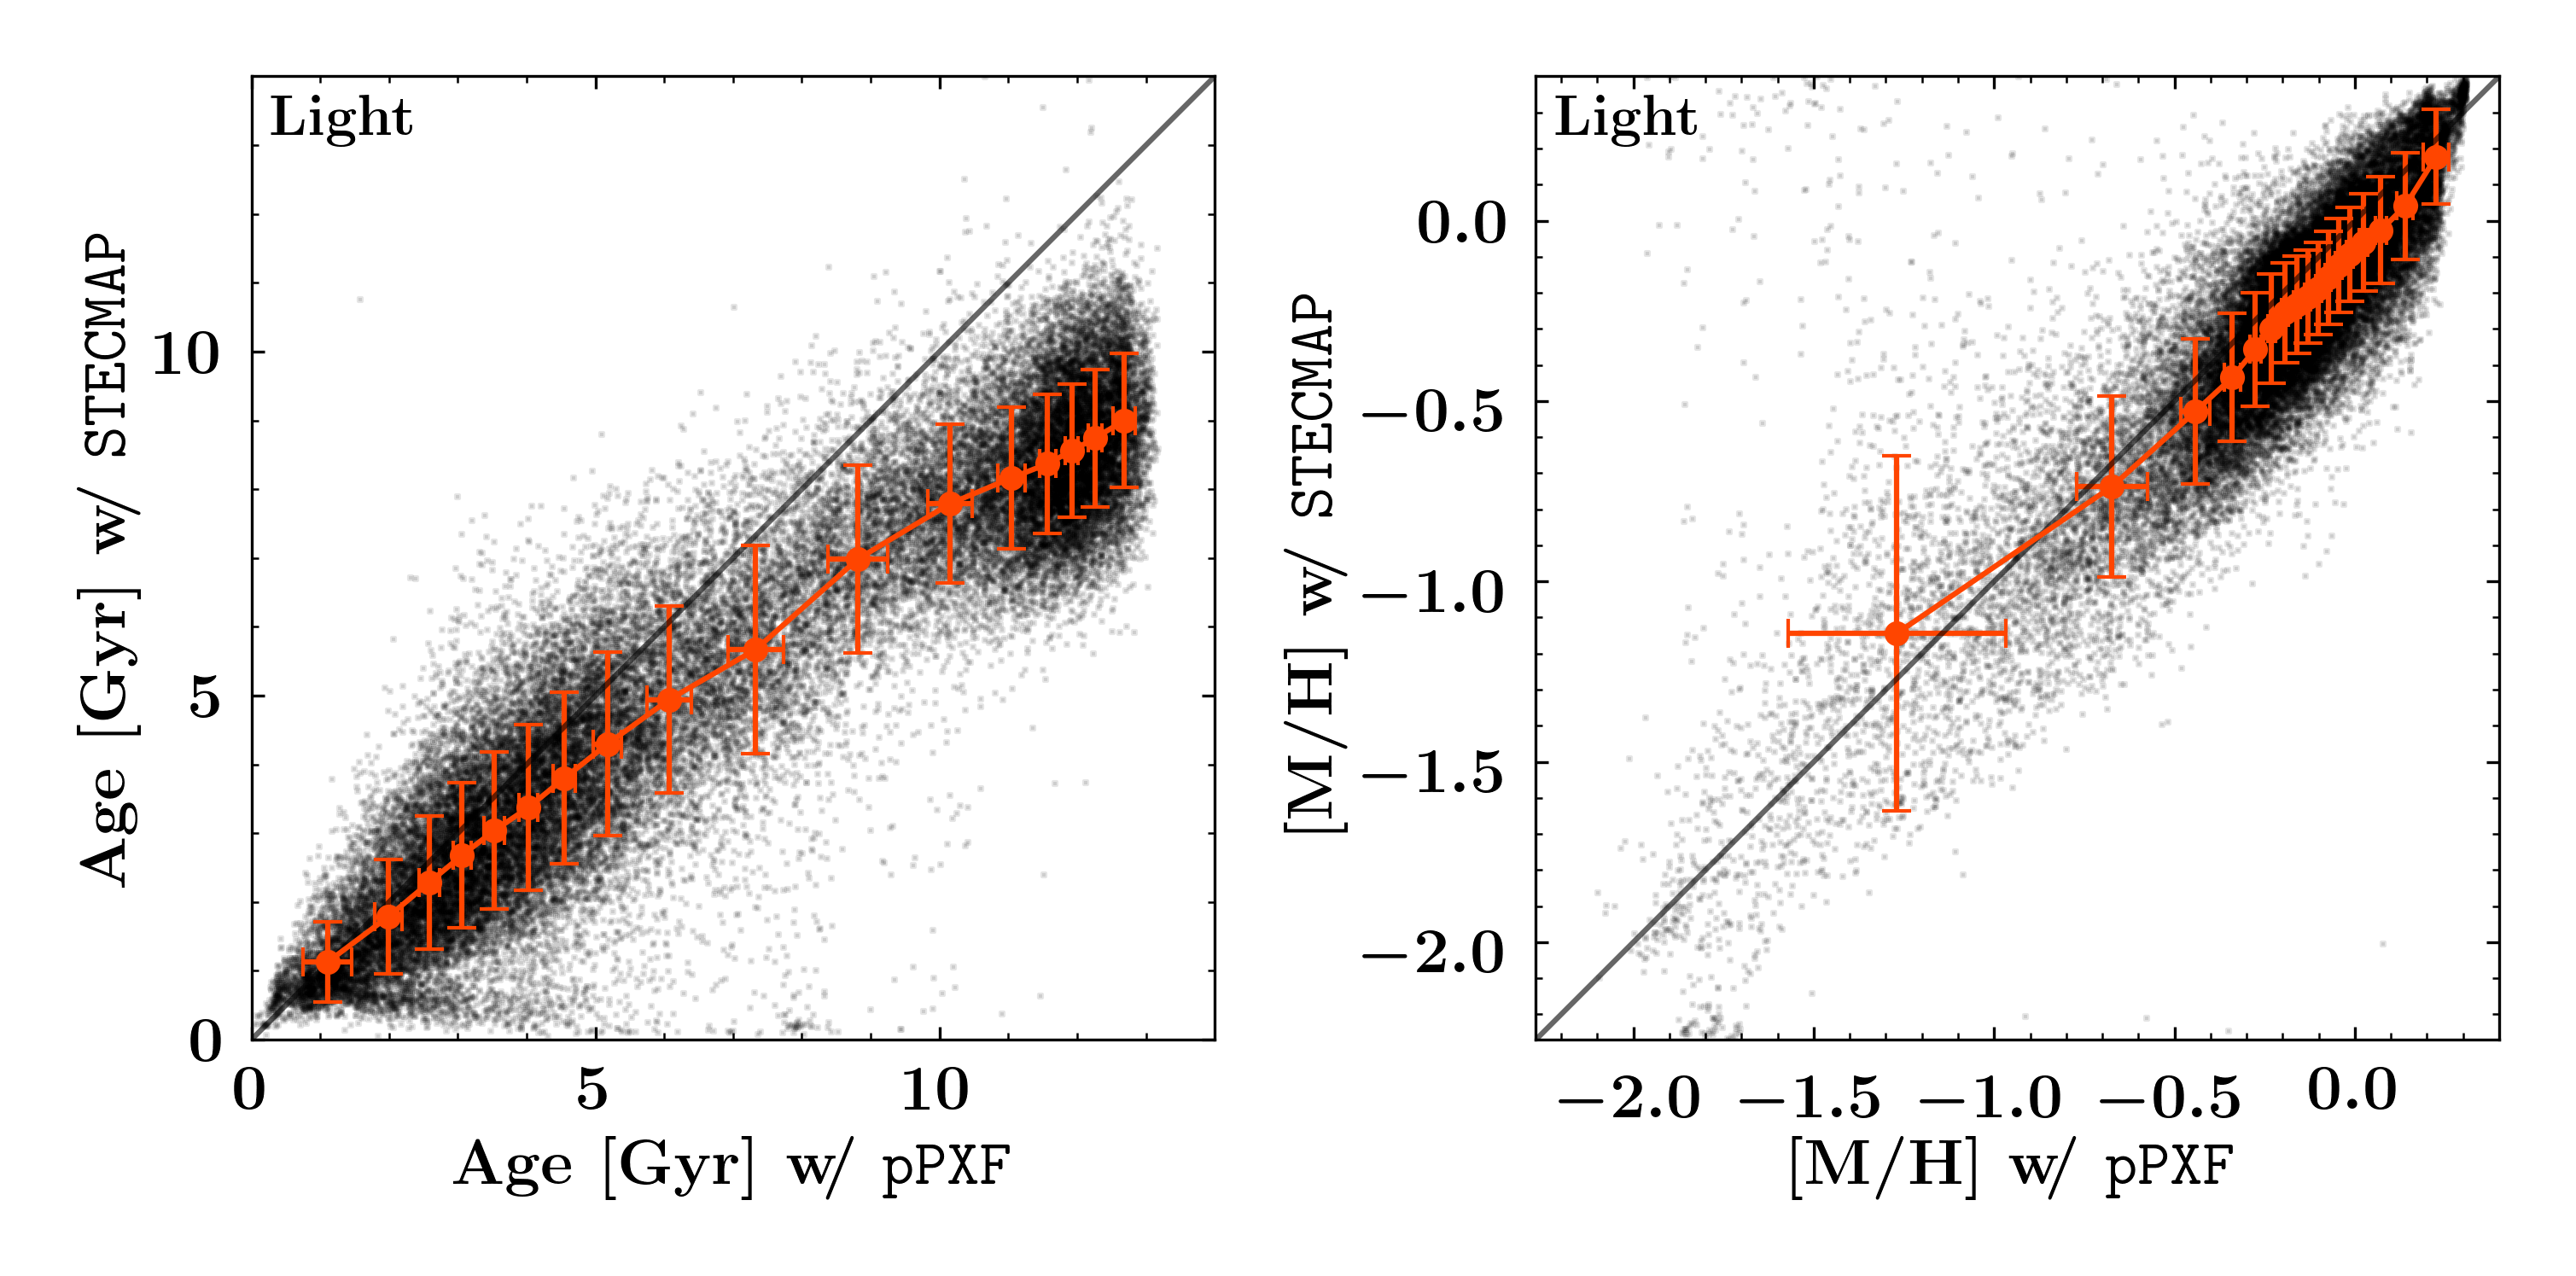
In Fig. 3 we plot population properties derived with STECMAP as a function of those measured with pPXF. We emphasise that we perform both runs using exactly the same emission-subtracted spectra, MILES base models, and stellar kinematics, in order to isolate the differences due to the fitting algorithms. The light-weighted age results obtained with pPXF and STECMAP are in reasonable agreement, as indicated by the median standard deviation of all 17 bins being . However, STECMAP returns systematically lower stellar ages. More precisely, the deviation between pPXF and STECMAP is increasing with age: little deviation is found at low ages ( at ) while the discrepancy for old populations is the largest ( at ). The measured metallicities conform well, with STECMAP providing slightly lower [M/H] values at all but the lowest metallicities. The median standard deviation of all bins is .
We find only a few outliers at low ages, in particular at STECMAP ages below and pPXF ages of , which is caused by two strongly starbursting regions in NGC 5236. A visual inspection of the corresponding spectra and fits has shown complex H profiles for which the emission line modelling with pyGandALF is imperfect. In fact, this discrepancy is absent when repeating the analysis of this galaxy while masking all wavelength regions affected by emission lines. We emphasise that the derived stellar population quantities in all other parts of this galaxy are identical, whether or not emission-lines are masked or subtracted. A more detailed modelling of such complex emission-line profiles for the entire sample is beyond the scope of this study. However, as there are no other clear discrepancies found, the emission-line modelling appears to be sufficiently good for all other galaxies.
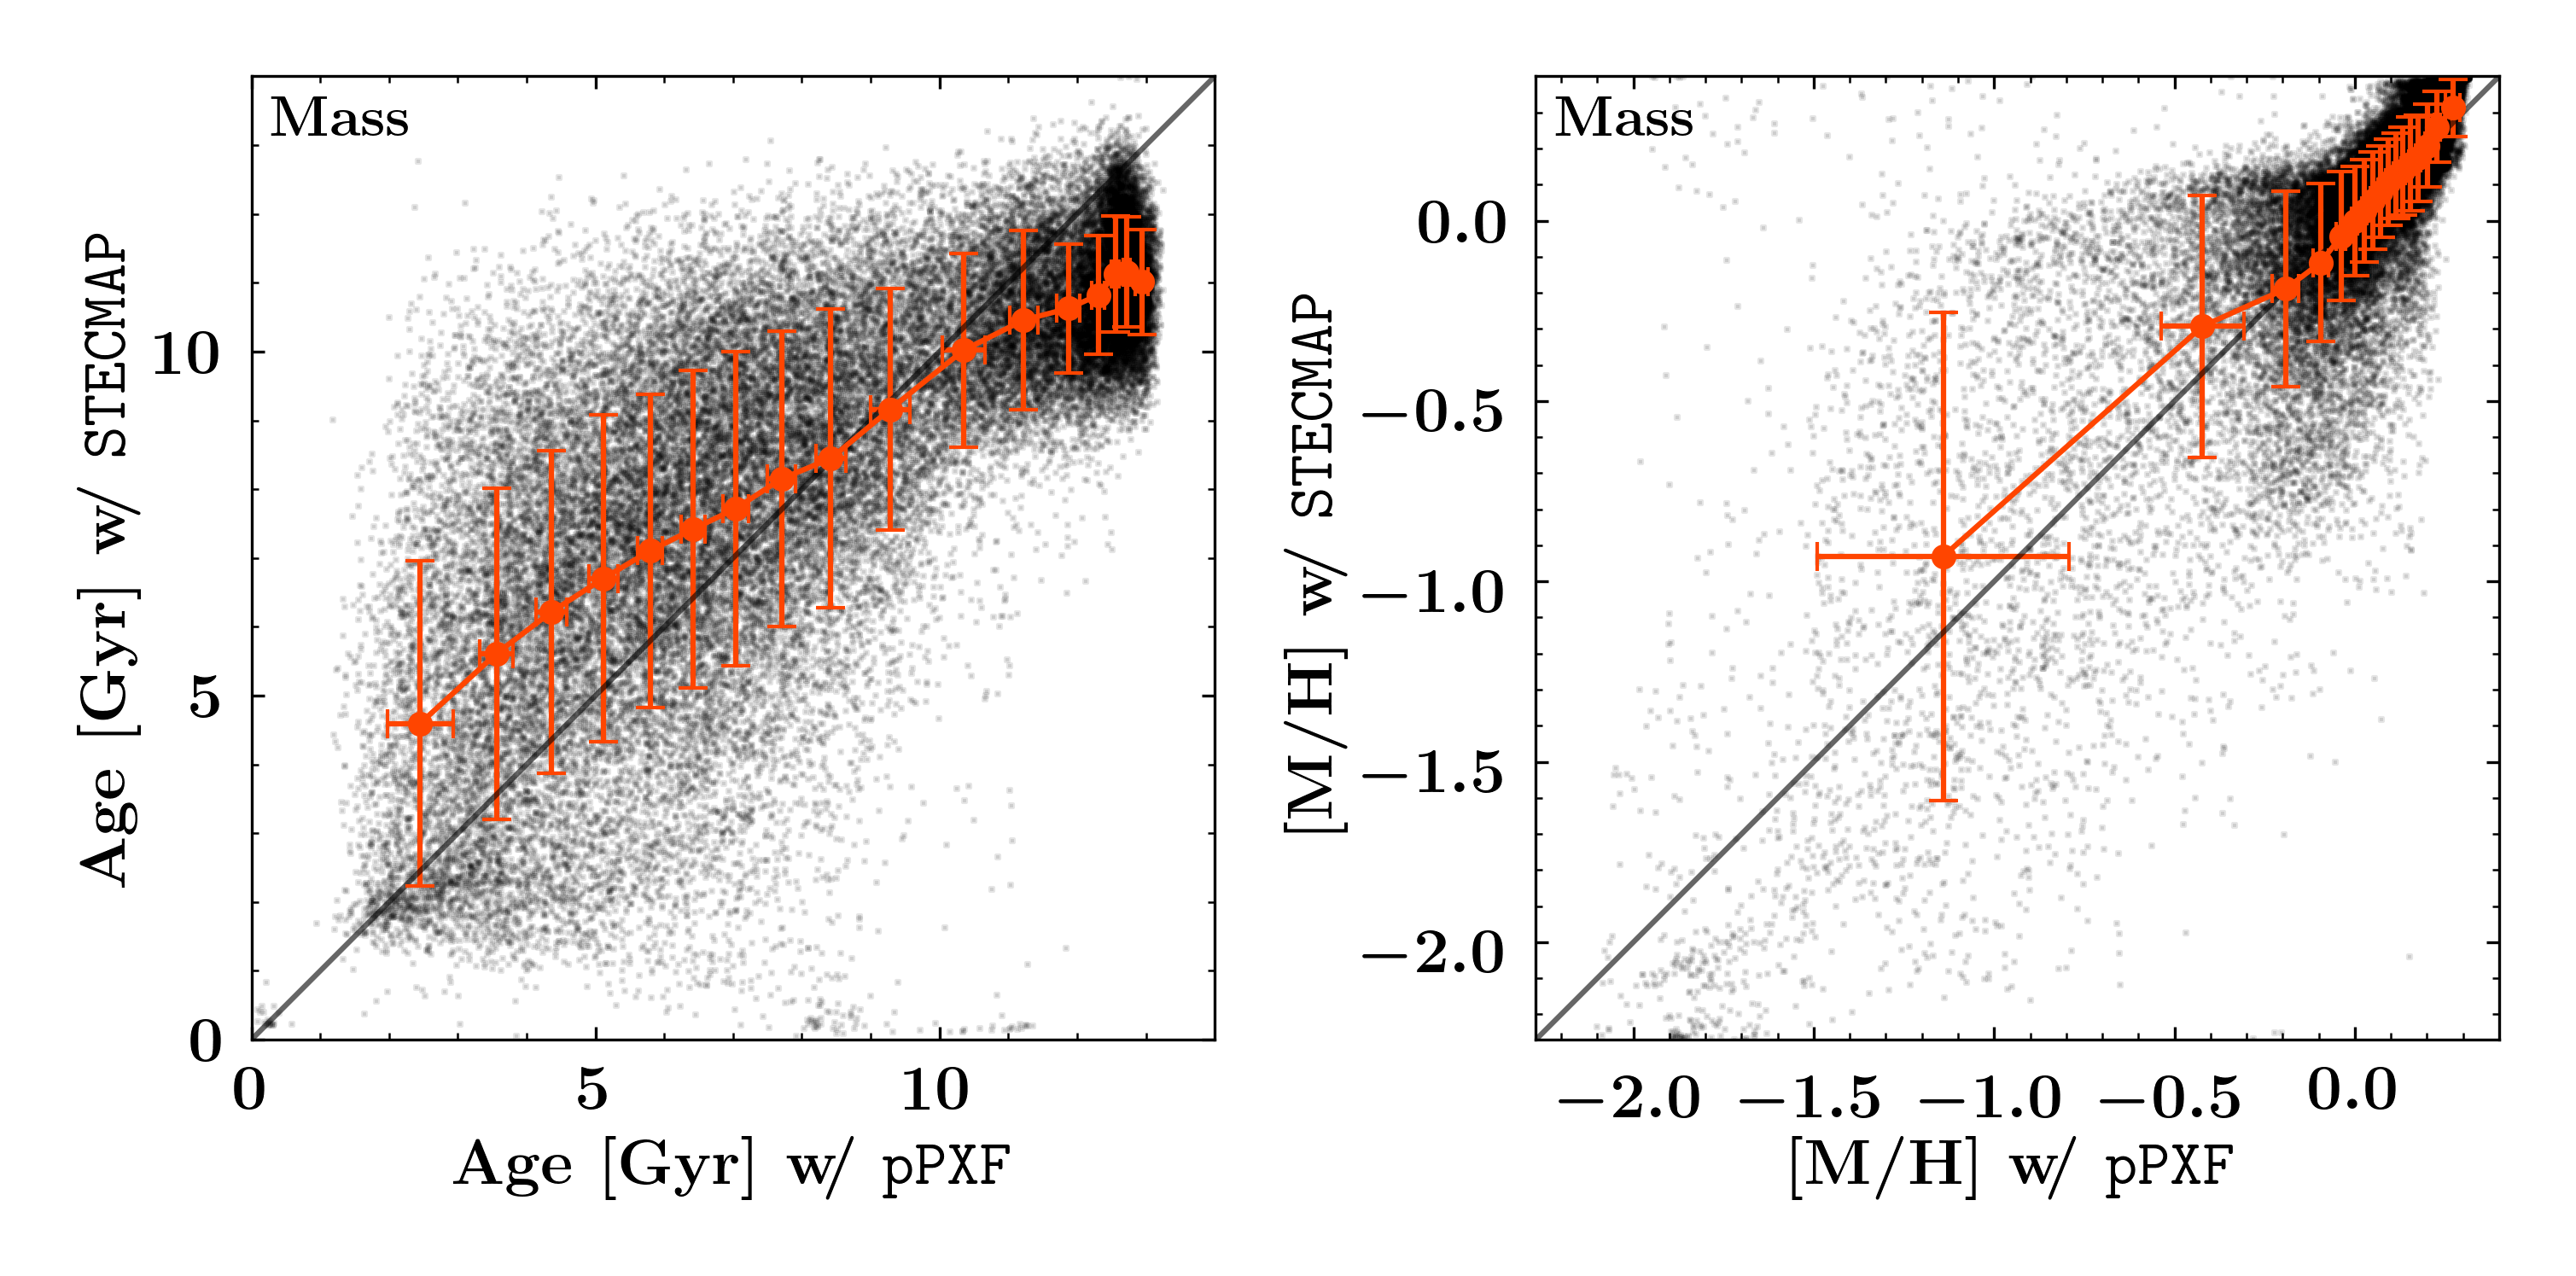
For mass-weighted stellar population properties the scatter is substantially higher, as compared to the light-weighted results. However, mean ages and metallicities within each bin are still in reasonable agreement. Similarly to the comparison of light-weighted ages, a systematic deviation of the measured ages is found. At young ages STECMAP detects older stellar populations while for old ages it derives younger stellar ages, as compared to pPXF. The median standard deviation of all bins amounts to . Metallicities again conform well, with a similar median standard deviation of . We speculate that this increased deviation between pPXF and STECMAP might be a result of the conversion from light- to mass-weighted population properties. This conversion is calculated using mass-to-light ratio predictions of the employed SSP models. These predictions have intrinsic uncertainties which result from the used stellar evolution models, but are also a function of both the derived stellar age and metallicity. Thus, the mass-weighted ages and metallicities depend on the uncertainty in both light-weighted ages and metallicities, as well as the mass-to-light ratio predictions themselves. Therefore, it is not surprising that the obtained uncertainties are significantly higher for mass-weighted results.
4.3 Error estimates on stellar population properties
Estimating measurement uncertainties on mean stellar population properties or non-parametric star formation histories derived with full spectral fitting is not trivial. Firstly, it is not possible to assign formal errors, as the population properties are simply averaged from the used subset of spectral templates and not measured in the actual fitting process. Secondly, errors derived by repeating the measurement on multiple Monte-Carlo realisations of the data, as commonly used for the estimation of errors on the stellar kinematics, might be significantly underestimated due to the effect of regularisation.
Here we propose to use the median standard deviations from the comparisons between pPXF and STECMAP, as stated in Sect. 4.2, as error estimates. While such an uncertainty does not represent a real measurement error, the scatter between two different fitting routines does provide a realistic estimate. Of course, this approach cannot account for errors introduced by other systematics, such as intrinsic problems with the spectral models, template mismatch, or IMF variations. Nonetheless, these error estimates compare well to those discussed by other authors.
For instance, Gadotti et al. (2019) repeat the analysis on 100 Monte-Carlo realisations, in order to estimate errors. Using STECMAP at a signal-to-noise level of 40, they find typical errors in age of and in metallicities (Z) which translate to errors of approximately in [M/H] when evaluated at solar metallicity. In addition, their error estimates depend on both age and metallicity, and whether light- or mass-weighted results are considered. They further conclude that for STECMAP the chosen initial conditions and smoothness parameter have no effects. In contrast, Pinna et al. (2019) use 50 Monte-Carlo realisations and also investigate how much the applied corrective polynomial and regularisation parameter of pPXF affect the resulting error estimates. Fitting stellar kinematics and population properties simultaneously at a signal-to-noise level of 40 they find typical errors of , , and for mass-weighted age, [M/H], and [/Fe]. Ruiz-Lara et al. (2015) performs an extensive comparison of star formation histories derived from colour-magnitude diagrams of resolved stars and the analysis of integrated light spectroscopy with STECMAP, ULySS, and STARLIGHT and reach similar conclusions.
5 Results
In this section we present our general findings concerning the mean stellar population properties in the central regions of all TIMER galaxies. In addition, we complement these results by presenting maps of H emission-line fluxes, which help inform our analysis. We do not focus on the properties of individual objects here but instead intend to provide an overview of the common characteristics of nuclear discs. We refer the reader to Appendix A for more detailed descriptions of each observed galaxy.
Observationally it seems that the gaseous nuclear ring simply highlights the outer edge of the stellar nuclear disc. In this section we will provide further evidence supporting this picture. We remind the reader that the term nuclear disc refers to the kinematically cold and regularly rotating stellar discs in the central regions of the galaxies. According to the kinematic analysis of the TIMER sample in an accompanying paper (see G20), these nuclear discs extend to the centres of the galaxies and have a well-defined outer edge. In contrast, we use the term nuclear ring only to describe the outermost part of these nuclear discs, as these regions are often highlighted by gaseous nuclear rings. Therefore, the denomination nuclear disc includes both the stellar nuclear disc and the gaseous nuclear ring, while the term nuclear ring refers only to the outer edge of the nuclear disc.
| Galaxy | PA | Spatial scale | H | Central | Age | |||
| morphology | emission | gradient | ||||||
| (1) | (2) | (3) | (4) | (5) | (6) | (7) | (8) | (9) |
| Non-star-forming nuclear rings | ||||||||
| IC 1438 | 24 | -25.4 | 3.1 | 164 | 604 | NR | LINER | SYM |
| NGC 1291 | 11 | -8.9 | 5.8 | 42 | — | IRR | LINER | — |
| NGC 1300 | 26 | -45.9 | 3.8 | 87 | 332 | NR | LINER | FLAT |
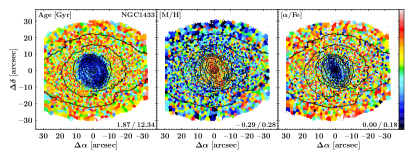
| NGC 1433 | 34 | 18.2 | 2.0 | 49 | 381 | IRR | LINER | FLAT |
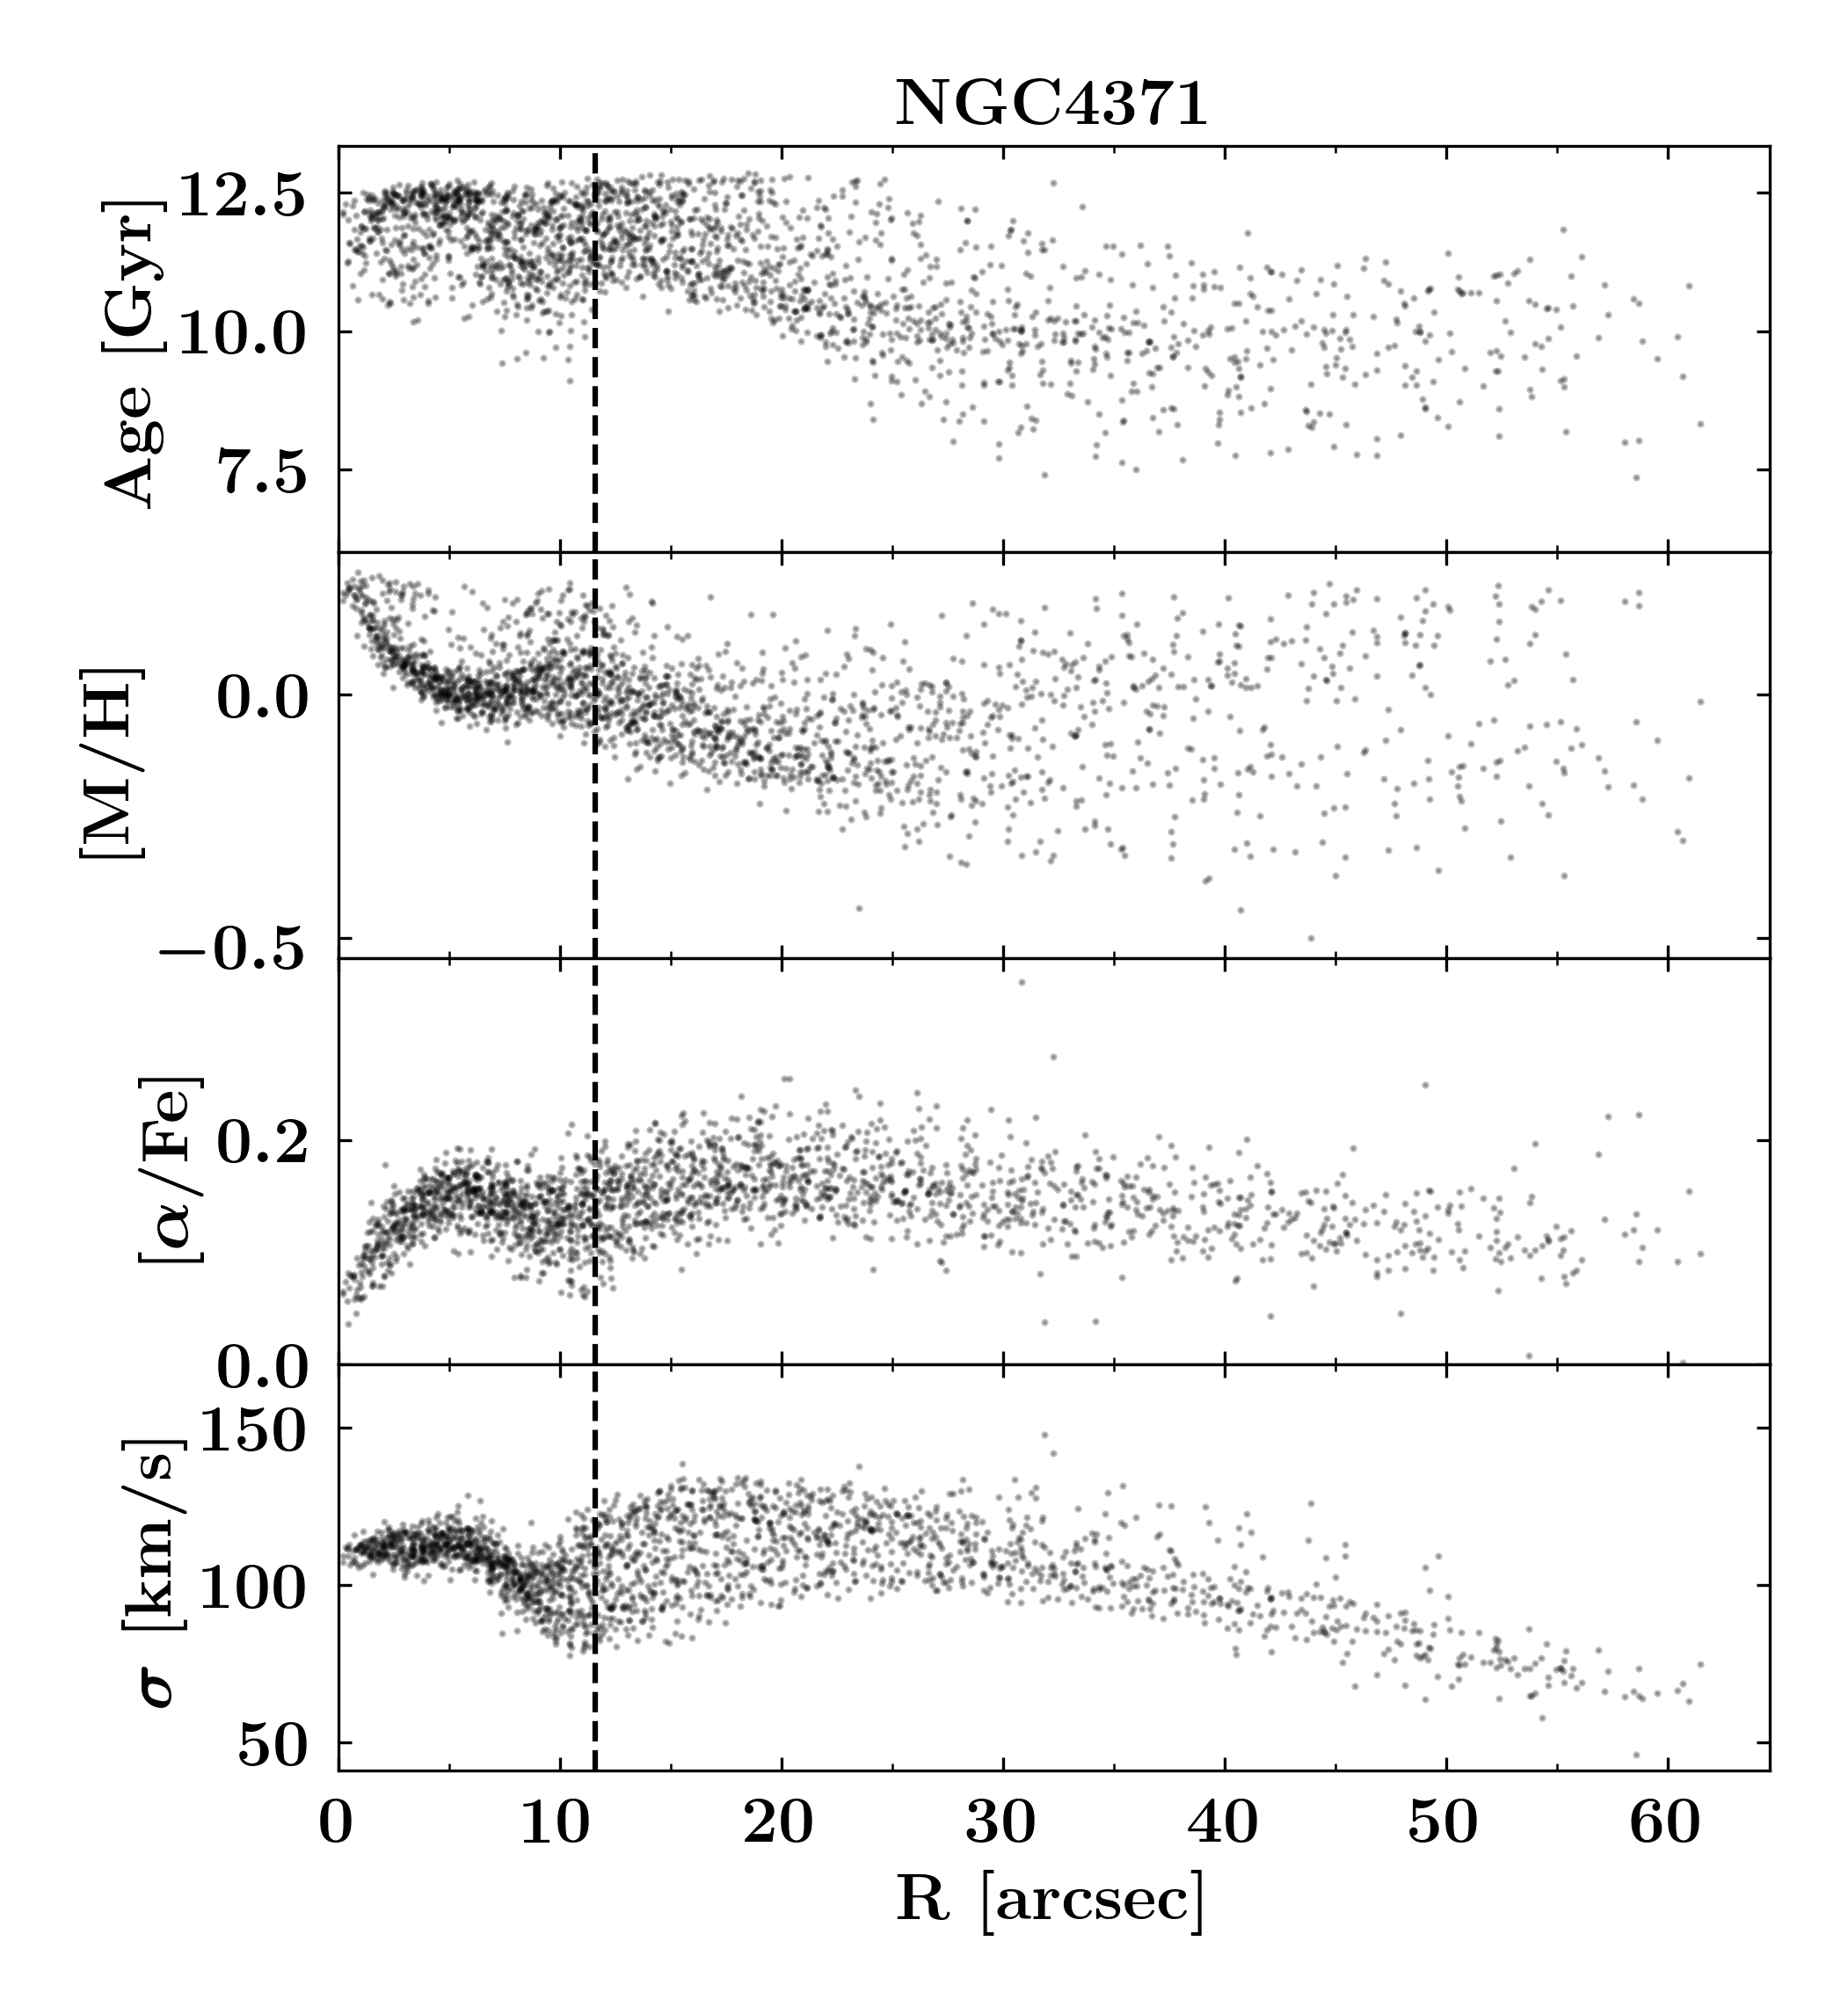
| NGC 4371 | 59 | 88.1 | 3.2 | 82 | 952 | NO | NO | — |
| NGC 4643 | 44 | 55.5 | 10.7 | 125 | 495 | C | LINER | SYM |
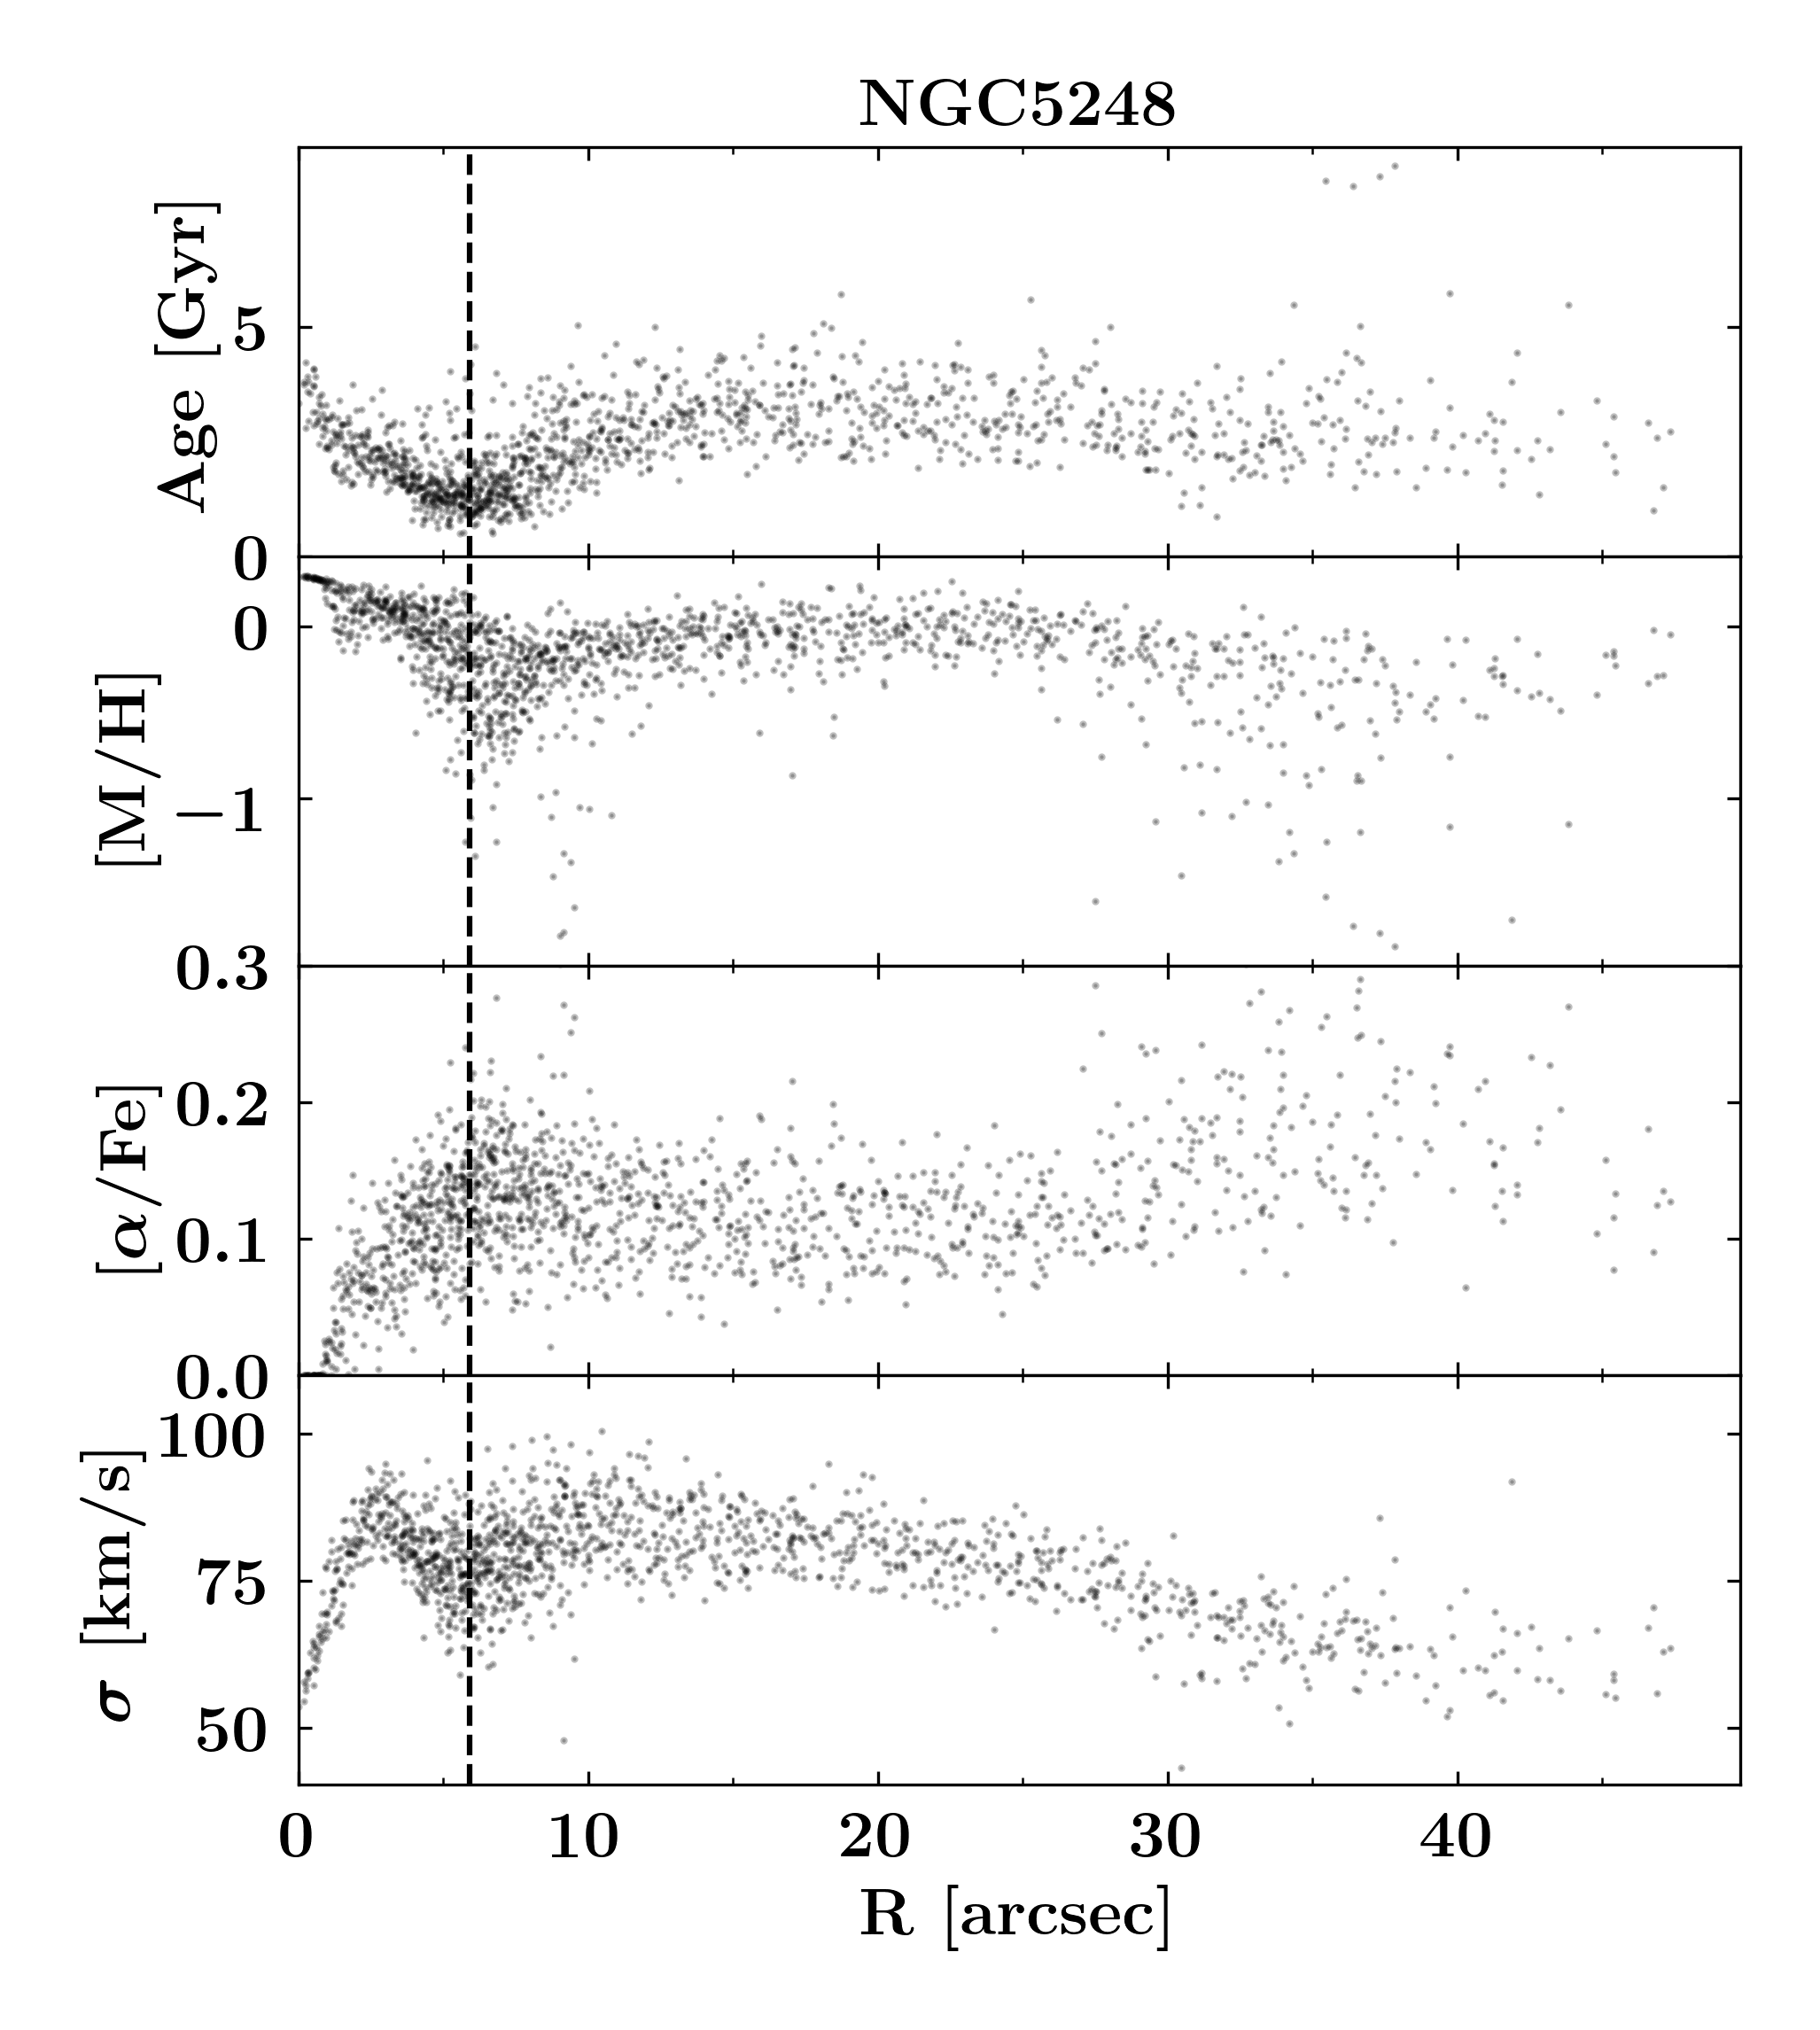
| NGC 5248 | 41 | -75.6 | 4.7 | 82 | 489 | U | SF/LINER | SYM |
| NGC 5850 | 39 | -26.5 | 6.0 | 112 | 796 | C | NO | SYM |
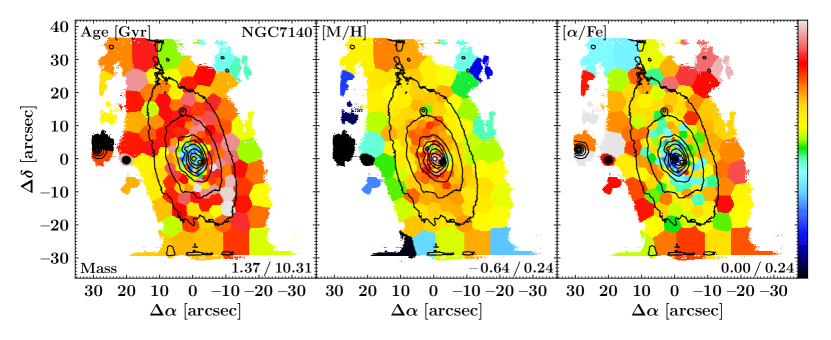
| NGC 7140 | 51 | 4.1 | 5.1 | 180 | 634 | NR | SF | FLAT |
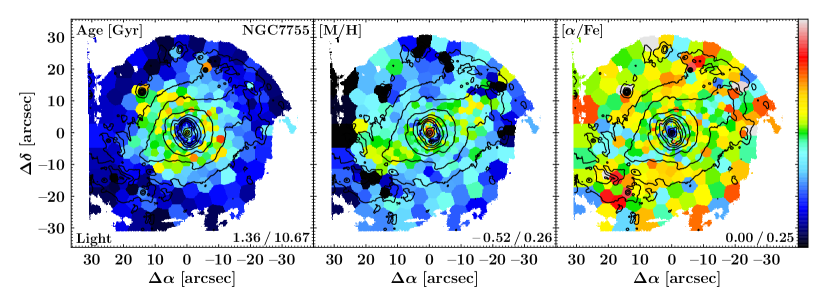
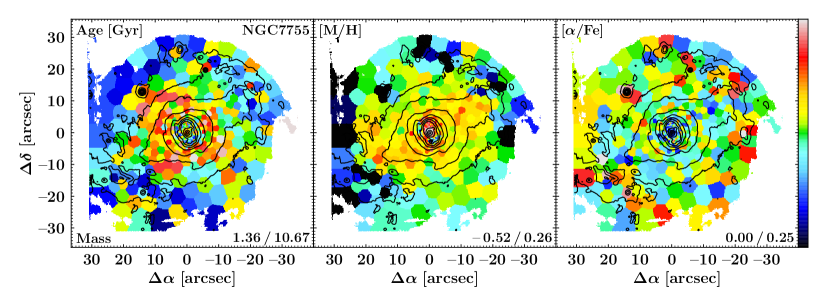
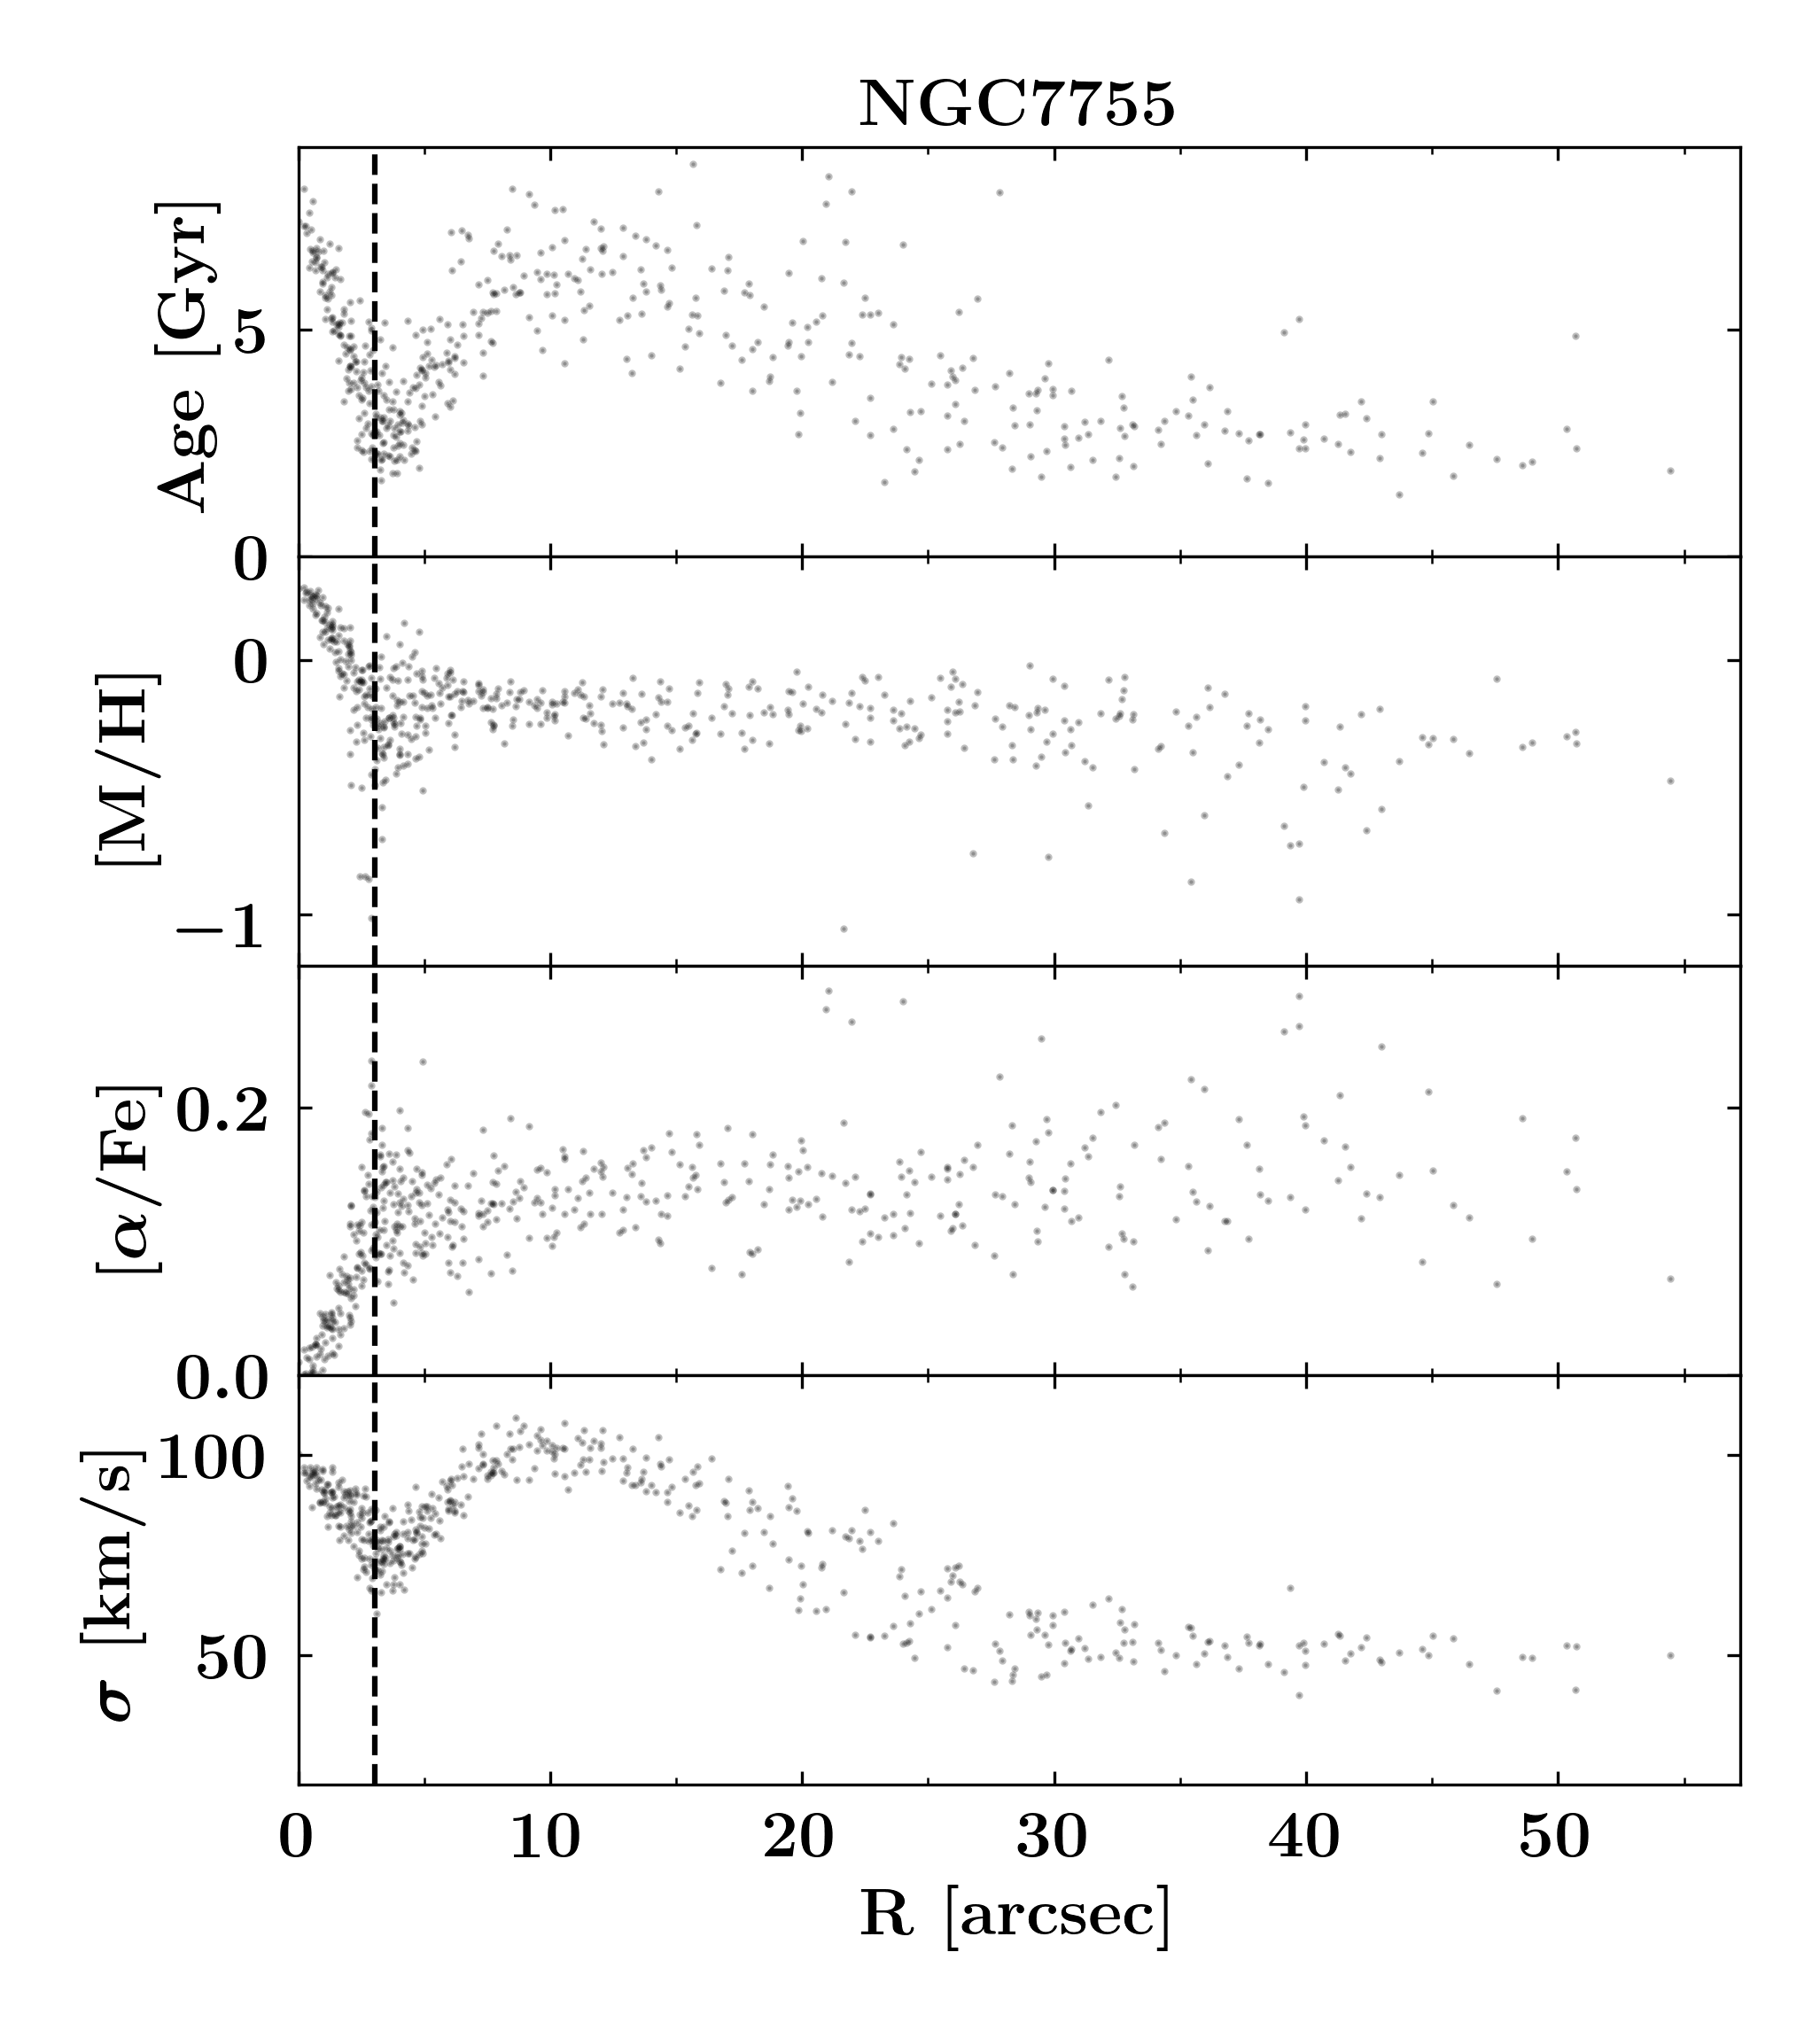
| NGC 7755 | 52 | 23.9 | 4.0 | 153 | 466 | NR | LINER | SYM |
| Star-forming nuclear rings | ||||||||
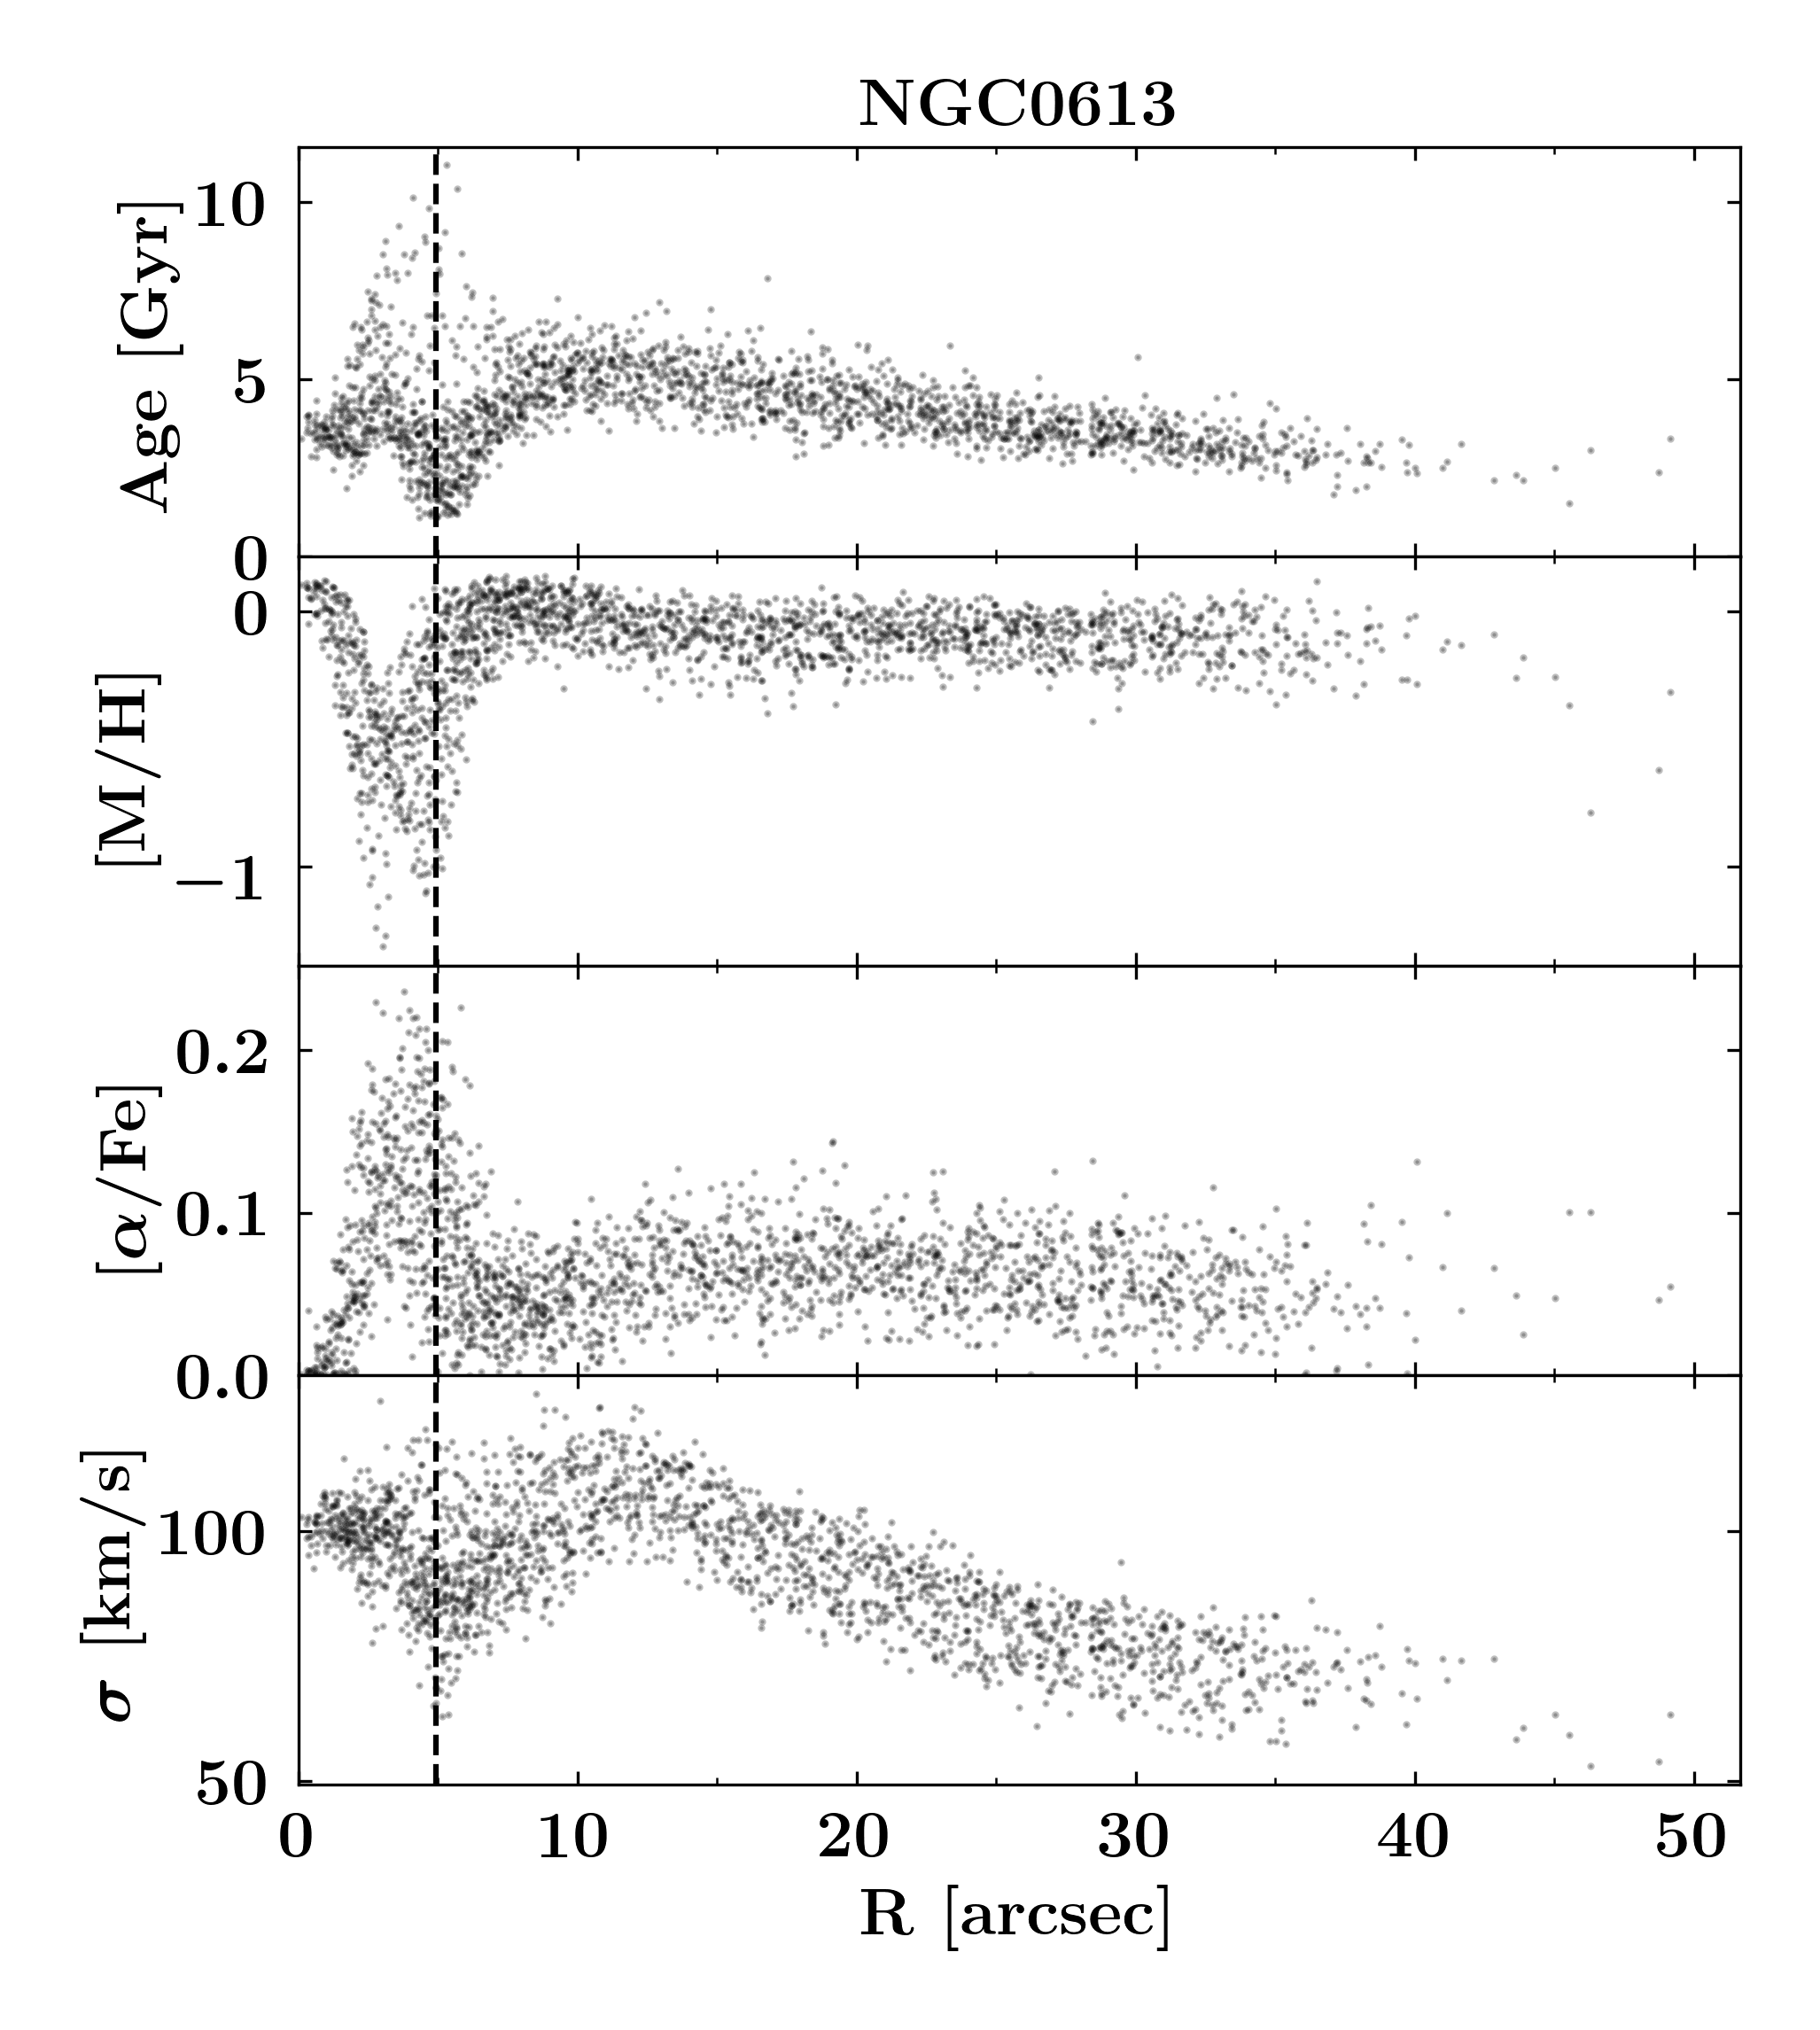
| NGC 613 | 39 | -50.1 | 12.2 | 120 | 590 | NR | LINER | — |
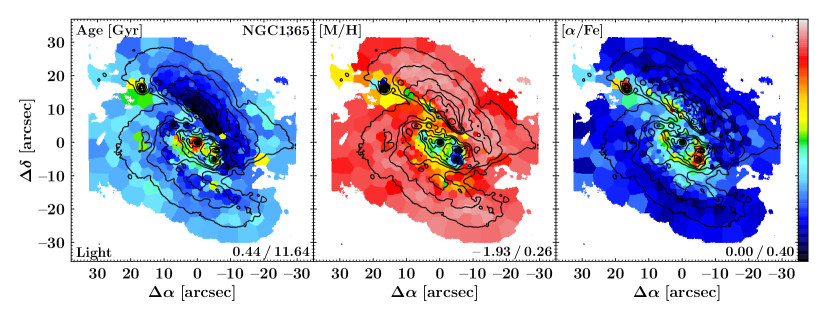
| NGC 1097 | 51 | -52.1 | 17.4 | 100 | 1072 | NR | LINER | — |
| NGC 3351 | 42 | 11.2 | 3.1 | 49 | 236 | NR | SF | — |
| NGC 4303 | 34 | -36.7 | 7.2 | 80 | 214 | NR | LINER | — |
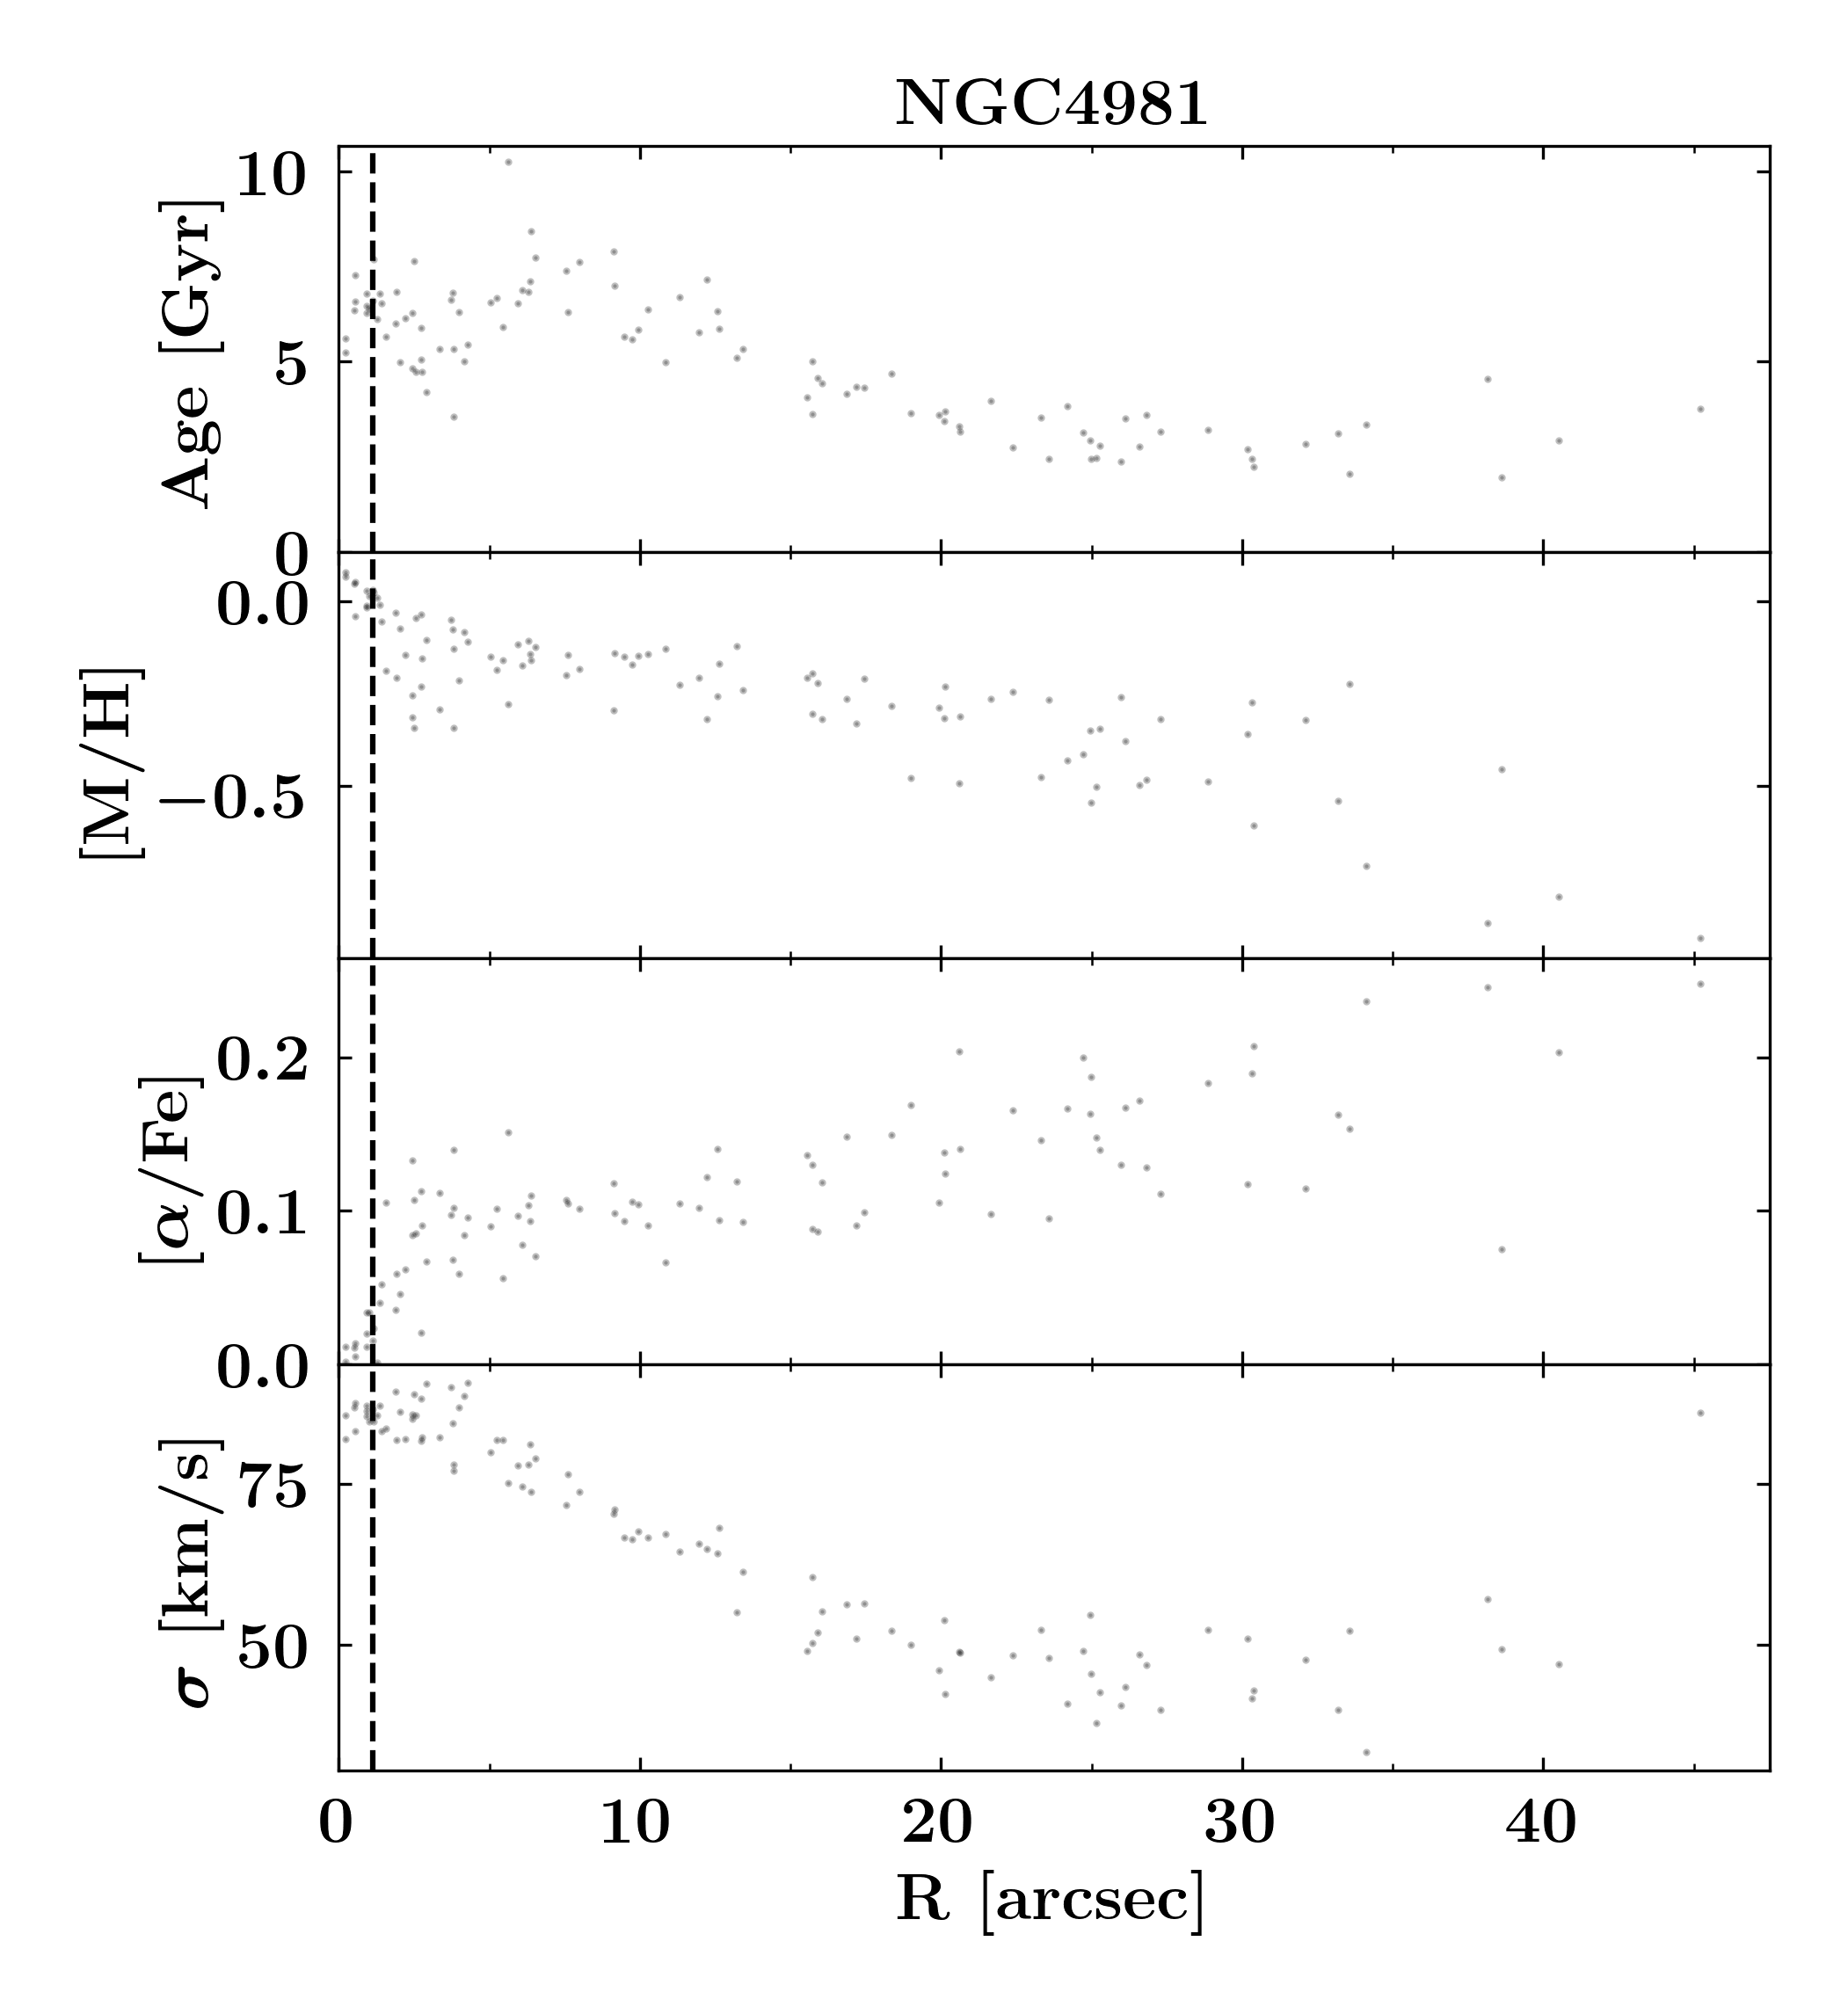
| NGC 4981 | 54 | -28.2 | 2.8 | 120 | 139 | NR | LINER | — |
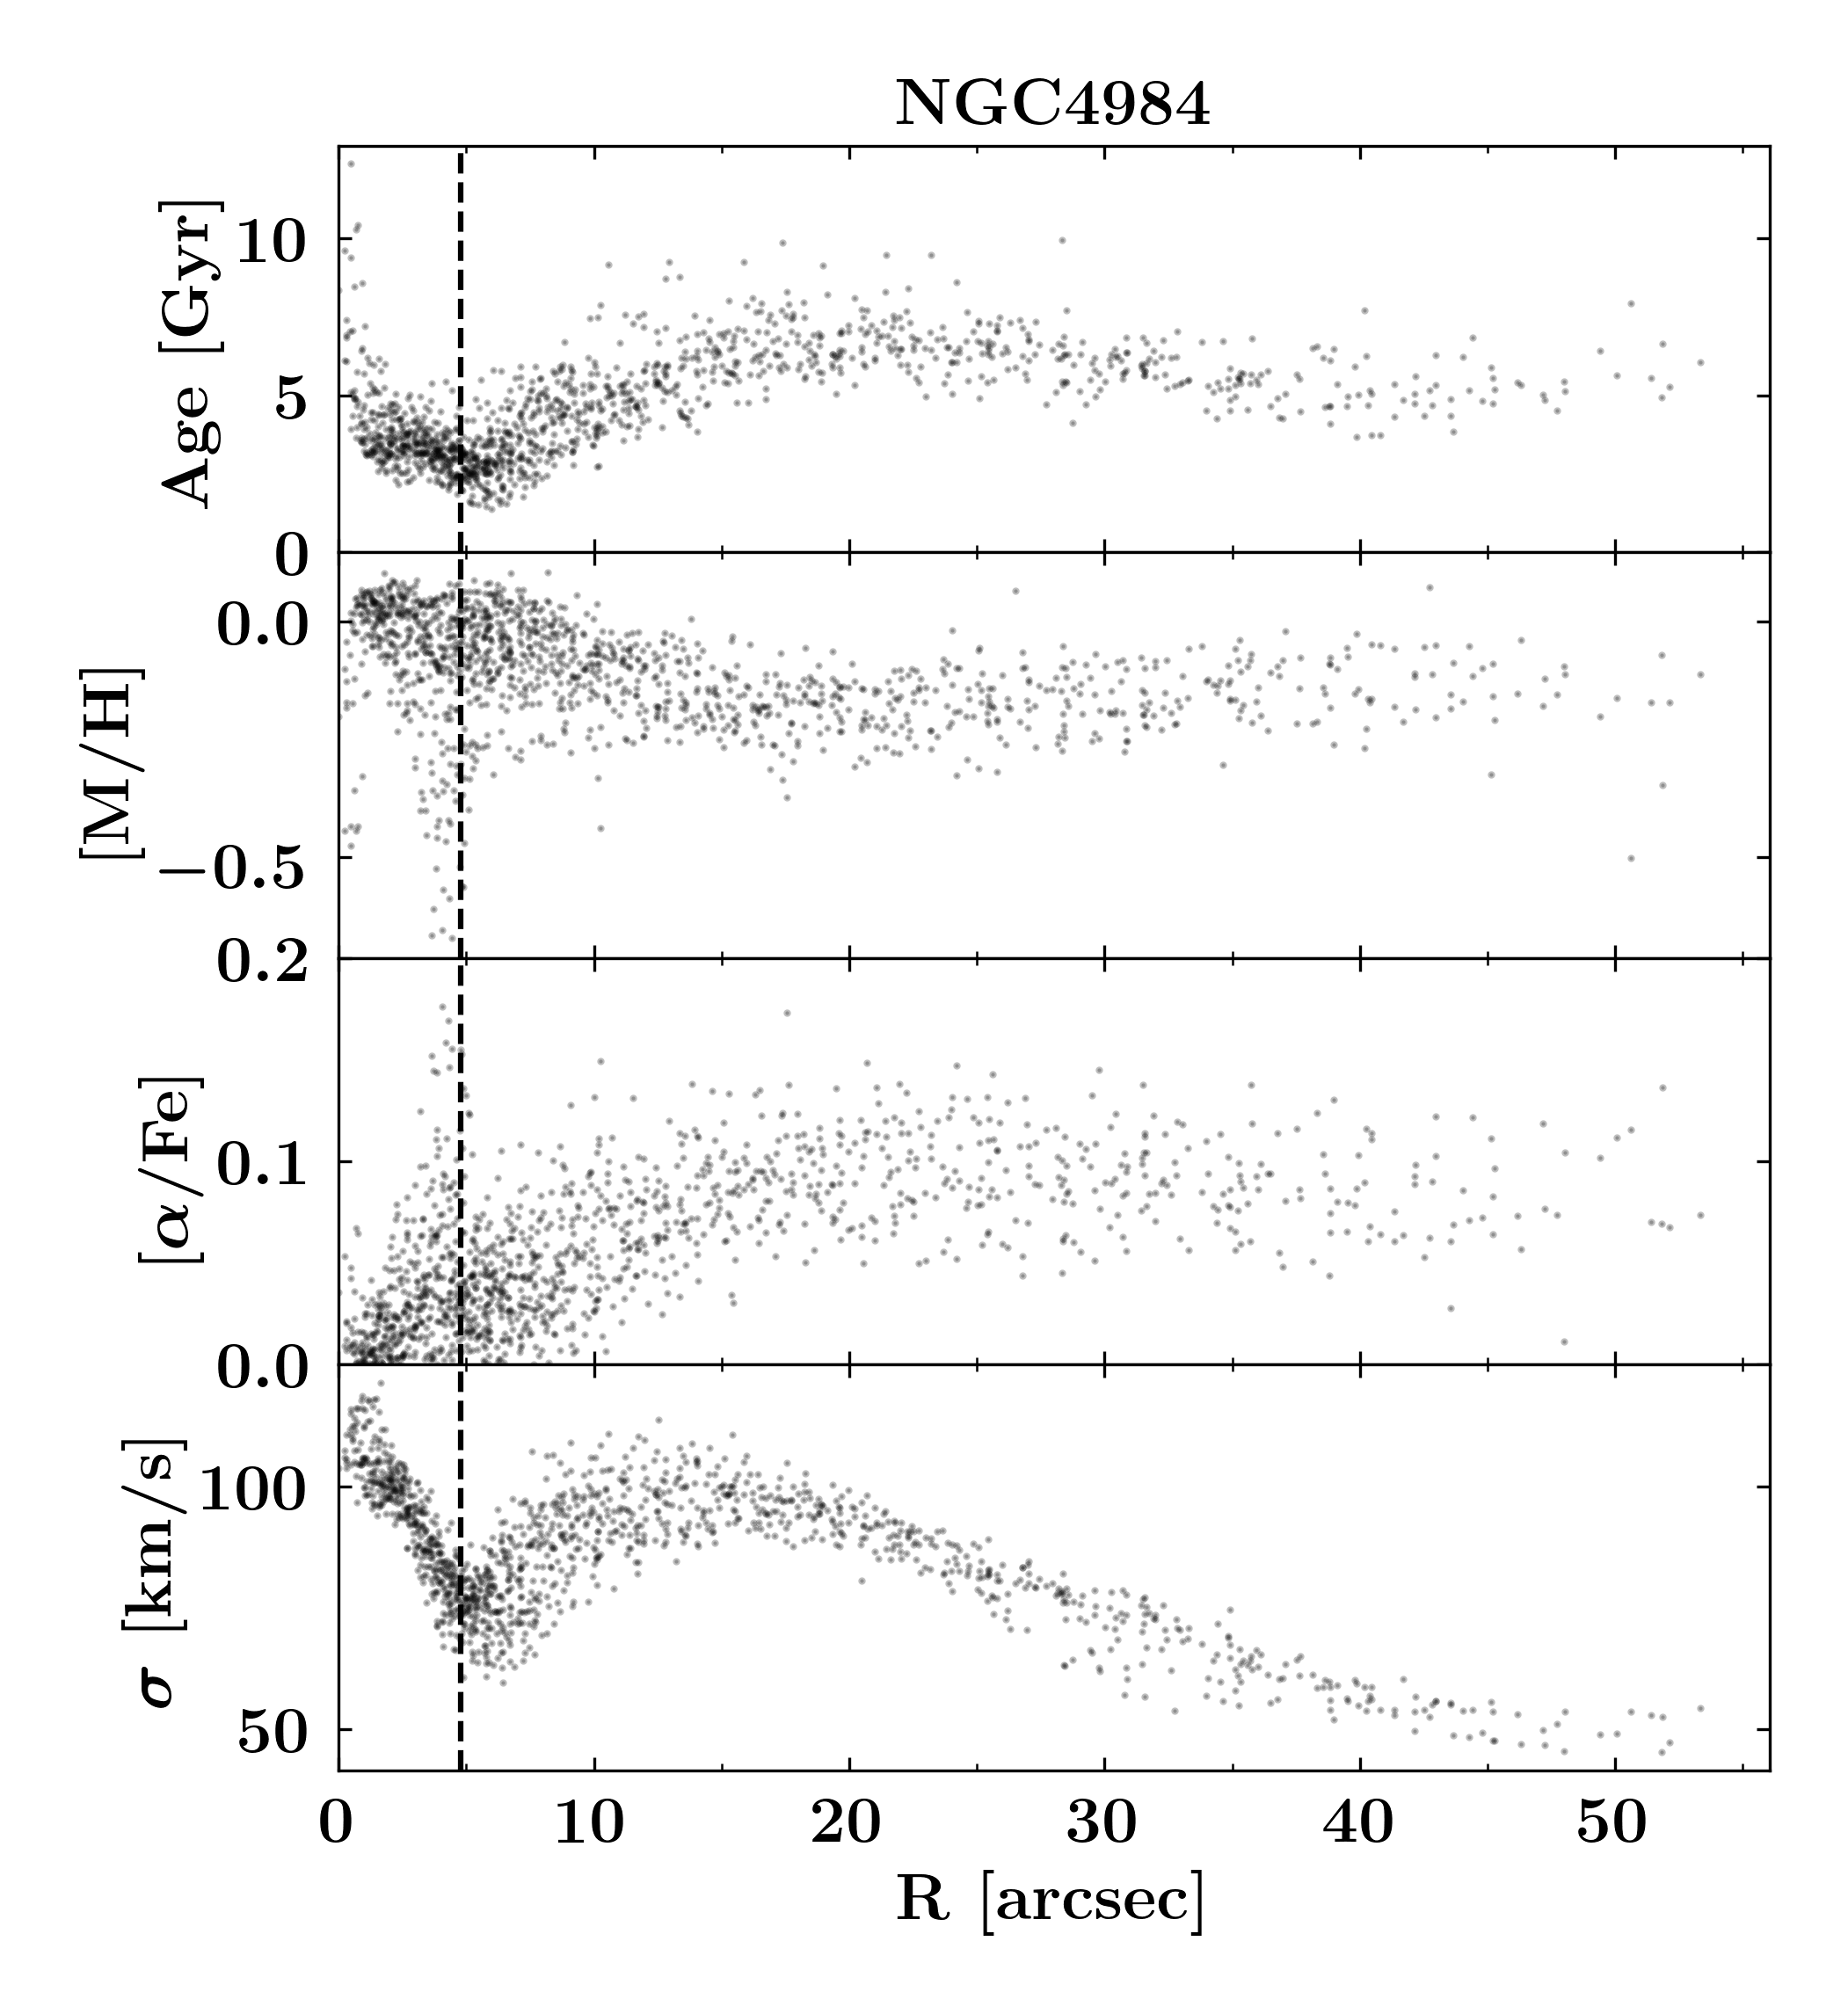
| NGC 4984 | 53 | 29.6 | 4.9 | 103 | 491 | NR/C | AGN | — |
| NGC 5236 | 21 | 47.0 | 10.9 | 34 | 368 | IRR | SF | — |
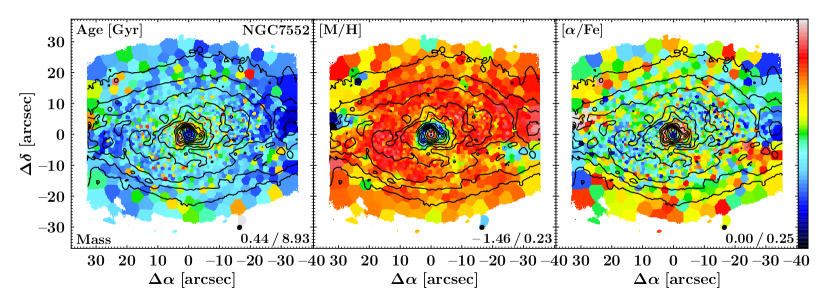
| NGC 7552 | 14 | 54.9 | 3.3 | 83 | 332 | NR | SF | — |
| Peculiar nuclear regions | ||||||||
| NGC 1365 | 52 | 42.0 | 9.5 | 87 | — | NR/IRR | AGN | — |
| NGC 5728 | 44 | 1.1 | 7.1 | 149 | 628 | NR/C | AGN | — |
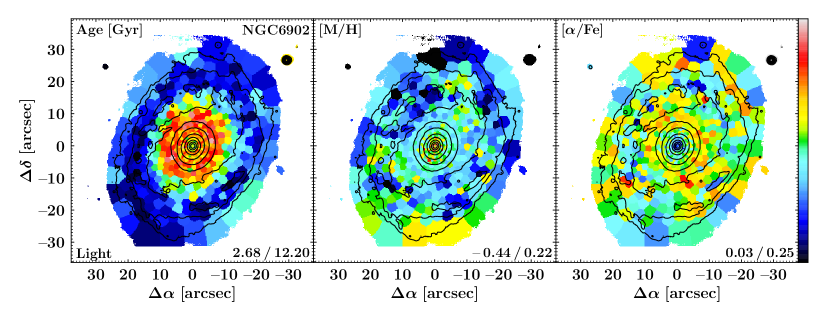
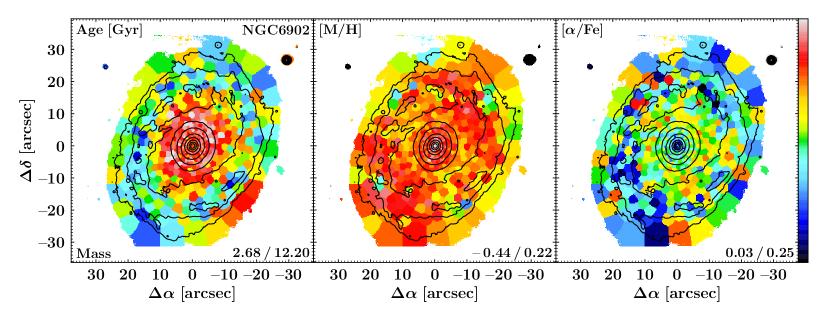
| NGC 6902 | 37 | -49.6 | 6.4 | 187 | — | PECULIAR | NO | — |
5.1 Maps of dust-corrected H emission-line fluxes
We use H emission-line fluxes as a tracer of HII regions, in order to reliably distinguish star-forming from non-star-forming nuclear rings/discs in the TIMER sample. This distinction allows to investigate their stellar population properties separately and detect areas in which the derived stellar population content might have been affected by strong star formation.
For the purpose of deriving emission-line fluxes, it is not necessary to spatially bin the data to high signal-to-noise ratios, as the signal-to-noise ratios of individual emission lines are typically higher compared to that of the stellar continuum. Therefore, we prefer to consider H maps on a spaxel-by-spaxel basis. To this end, we use results derived in previous TIMER papers (Gadotti et al., 2019; Neumann et al., 2020), exploiting the software PyParadise, an extended Python implementation of Paradise (Walcher et al., 2015). The obtained emission-line fluxes are corrected for dust extinction by measuring the Balmer decrement and applying the models of Calzetti et al. (2000) to account for the wavelength dependency.
In Fig. 9 we present the maps of the dust-corrected H fluxes for all TIMER galaxies. The maps reveal a large variety of ionised gas structures in the galaxy centres. While some galaxies exhibit little to no H emission, other objects show large amounts of H emission. In most galaxies, in particular in the cases with significant H emission, the star formation is concentrated in a well-defined nuclear ring. In order to compare the stellar population properties of galaxies with and without such star-forming nuclear rings, we split the sample in two groups of galaxies. All nuclear rings with H emission-line fluxes above are classified as star-forming, while galaxies with lower H emission-line fluxes are classified to host non-star-forming nuclear rings. We note that this threshold is an empirical finding chosen to reproduce the morphological differences evident in the galaxies. The classification in star-forming and non-star-forming nuclear rings does not depend on the precise value of this threshold. An overview about the different subsamples and the basic properties of the respective galaxies, in particular their H morphology, is provided in Table 1.
A total of 8 galaxies is found to have star-forming nuclear rings (NGC 613, NGC 1097, NGC 3351, NGC 4303, NGC 4981, NGC 4984, NGC 5236, NGC 7552). The high H emission-line fluxes in the nuclear rings of these galaxies suggest strong ongoing star formation or even a starburst episode. Only in the case of NGC 5236 the ionised gas emission is not concentrated to the nuclear ring, but irregularly distributed in the centre of the galaxy. We note that the derived stellar population properties might be affected by the strong star formation in these regions, for instance by residuals in the emission-line subtraction of the H line. Moreover, the measurement of stellar population properties might be affected by the nebular continuum and contributions from active galactic nuclei (AGN). However, the nebular continuum is only important in very young, star-forming regions, while possible AGN contributions are restricted to the centremost spaxels. In addition, unphysical results might be obtained if the stellar light is dominated by a population that is not represented in the employed set of SSP models. In our set-up this could be the case for stellar populations with ages below , as this is the youngest population included in the MILES models. In any case, distinguishing the ages of stellar populations younger than is not relevant for our conclusions presented in Sect. 6.
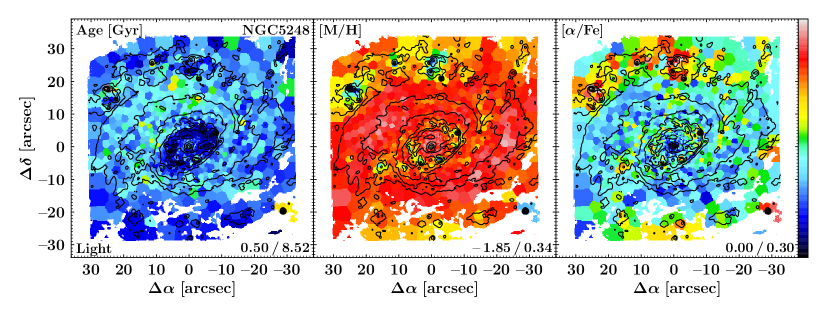
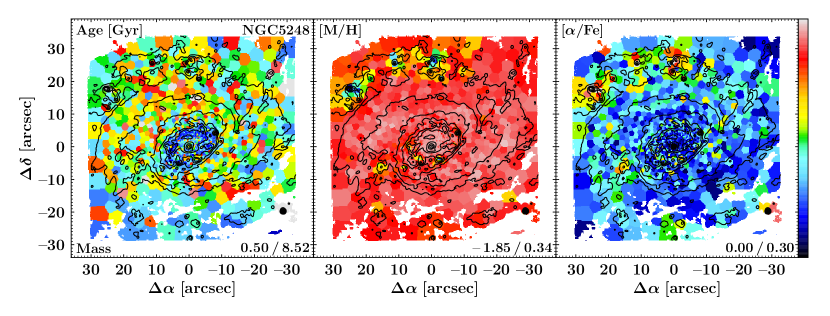
The subsample of non-star-forming nuclear rings consists of 10 galaxies (IC 1438, NGC 1291, NGC 1300, NGC 1433, NGC 4371, NGC 4643, NGC 5248, NGC 5850, NGC 7140, NGC 7755). The H morphology in the centres of these galaxies shows a larger variety. While NGC 4371 does not show any ionised gas emission, other galaxies show irregular emission patterns (NGC 1291, NGC 1433), centrally concentrated emission (NGC 4643, NGC 5850), or a more uniform gas disc (NGC 5248). Nonetheless, IC 1438, NGC 1300, NGC 7140, and NGC 7755 still show some concentration of gas in a nuclear ring. We note that in these galaxies the derived stellar populations are presumably not affected by low star-formation activity.
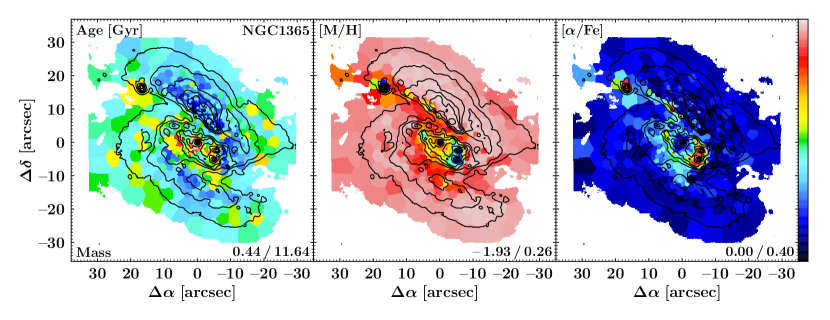
Three galaxies are excluded from above subsamples. NGC 1365 and NGC 5728 are significantly affected by outflows from their AGN (see e.g. Venturi et al., 2018; Durré & Mould, 2018) on large spatial scales. However, we note that other galaxies in the sample, for instance NGC 613 (Falcón-Barroso et al., 2014), host AGN outflows as well, but these appear weaker and do not significantly affect the derived stellar population properties (see also Appendix A). The third excluded galaxy is NGC 6902 which is only weakly barred and does not show unequivocal signatures of a nuclear disc. Unless specifically noted, these galaxies are excluded from the discussions below.
While star formation is an efficient ionisation source, the observed H emission could also be triggered by AGN. In order to distinguish between ionisation from star formation and AGN, we apply the standard BPT methodology (Baldwin et al., 1981). We find that the H emission in the very centres of many galaxies, at spatial scales much smaller than that of the nuclear disc, is often generated by AGN or LINER (see Table 1 for an overview). However, we also confirm that the H emission observed in the nuclear rings and the large majority of the nuclear discs indeed originates from star formation. We refer the reader to Gadotti et al. (2019) for a detailed analysis and classification of the emission-line ratios and ionisation sources of all TIMER galaxies.
5.2 Maps of mean stellar population properties
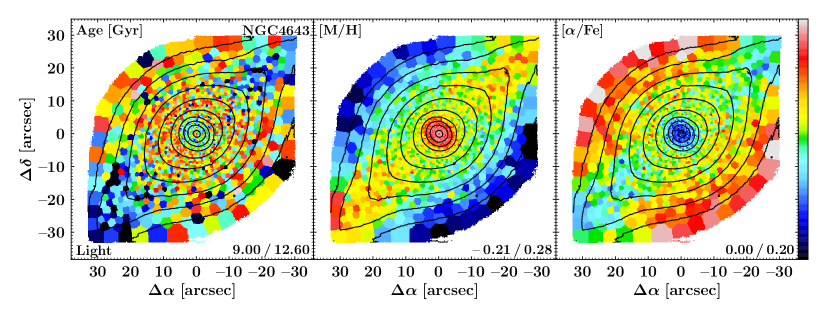
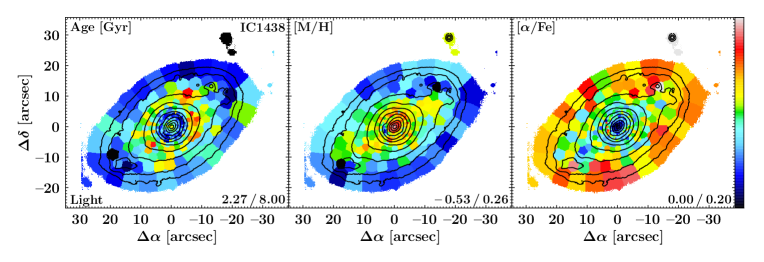
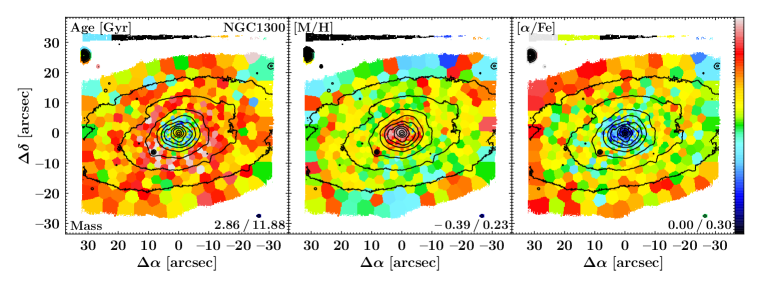
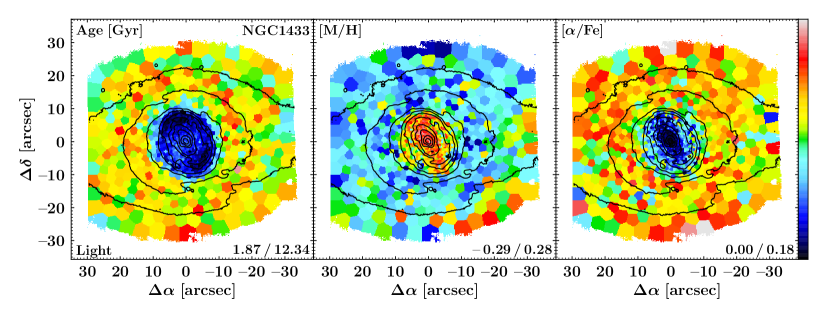
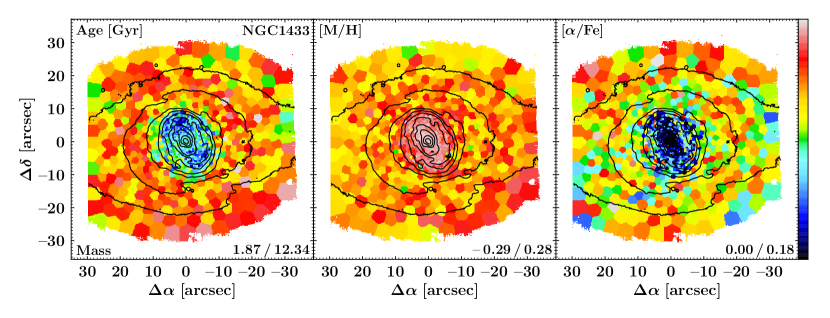
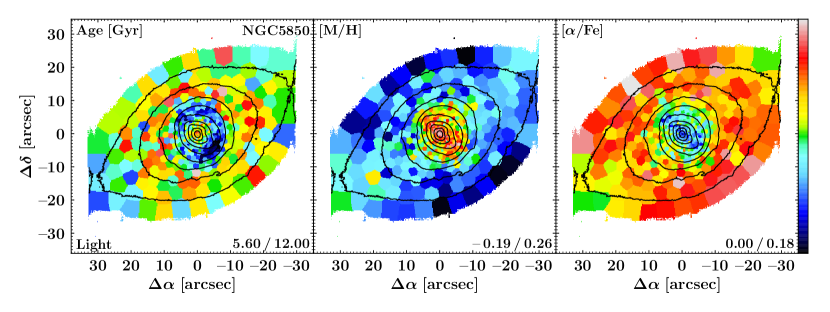
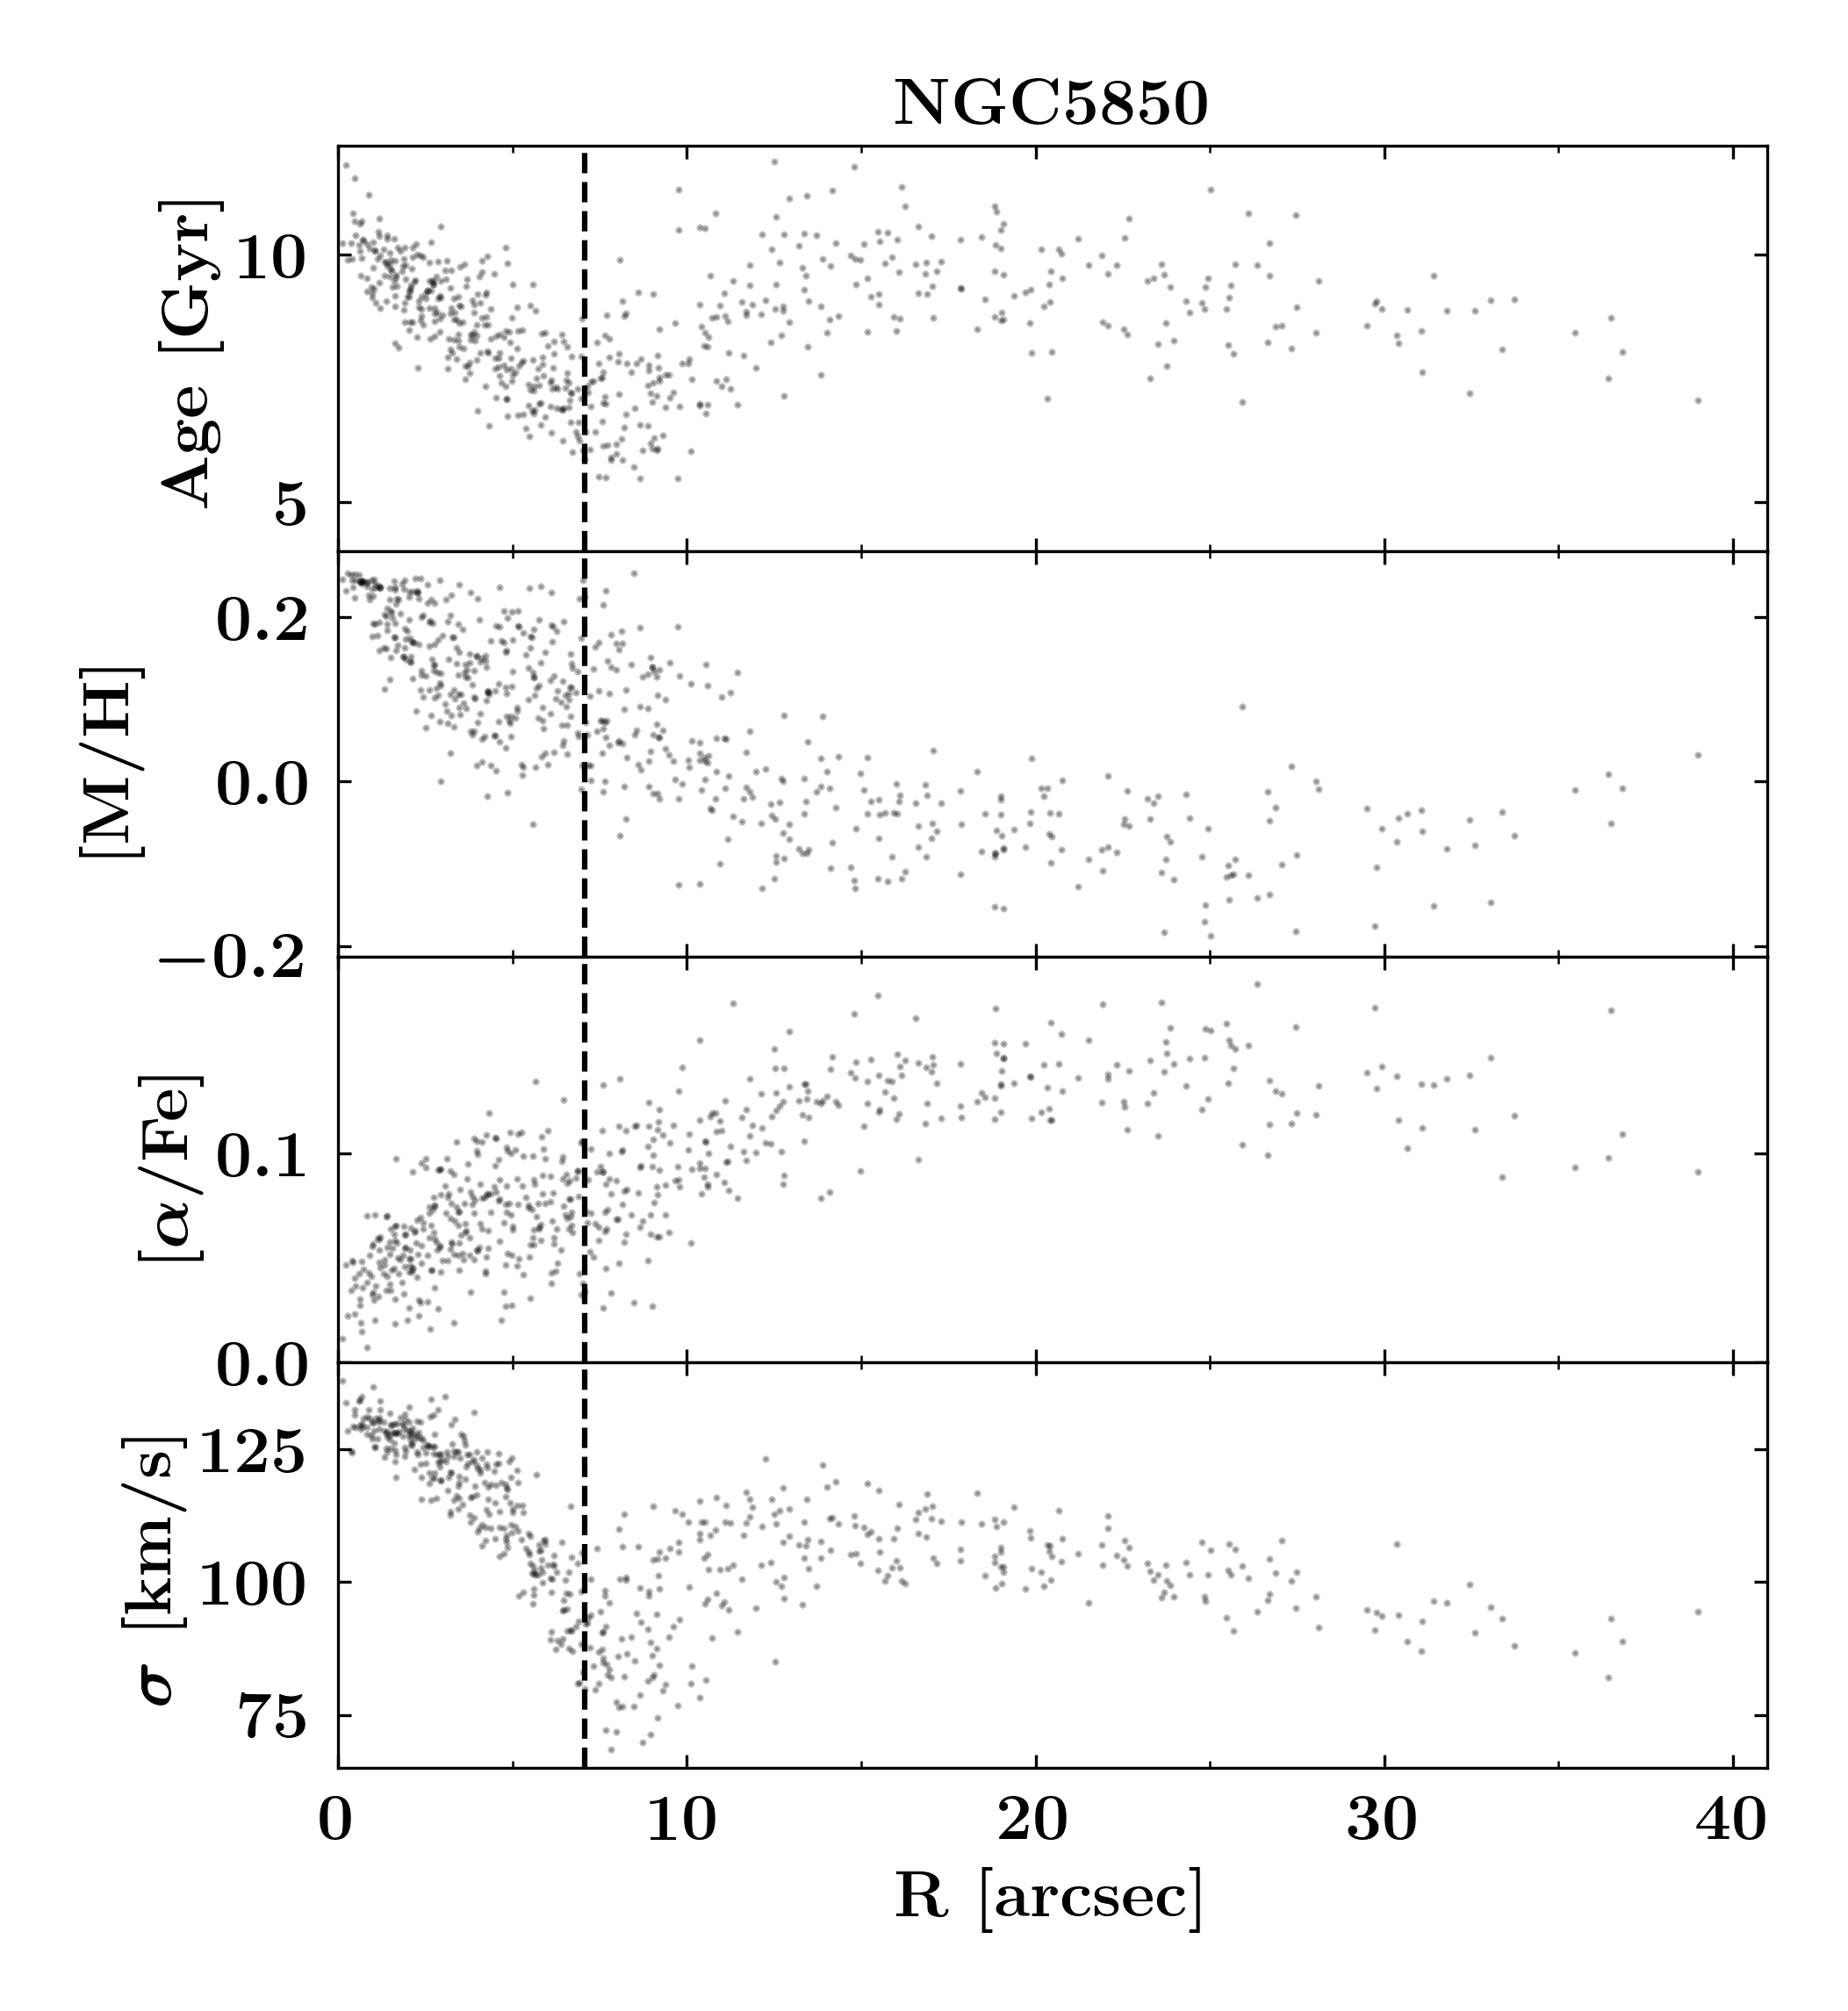
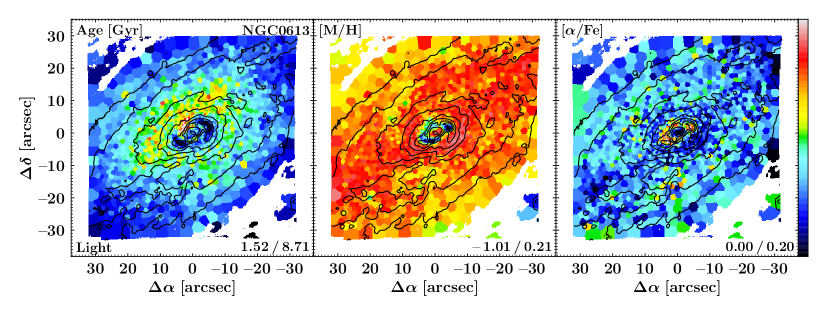
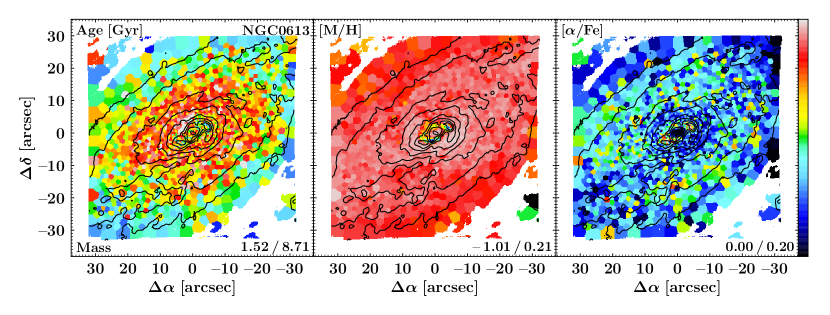
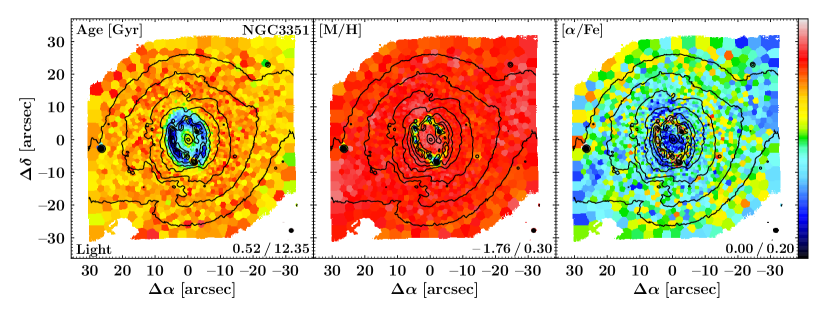
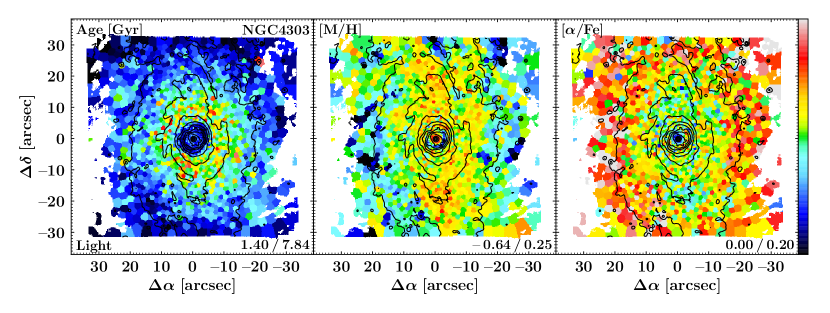
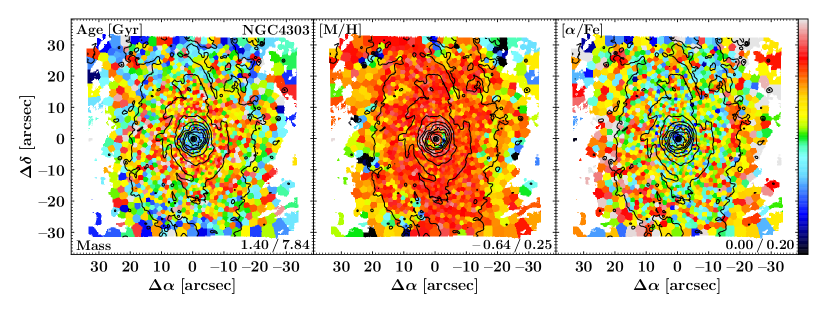
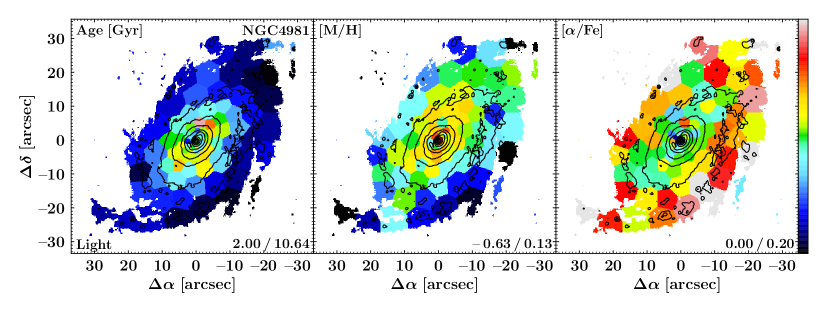
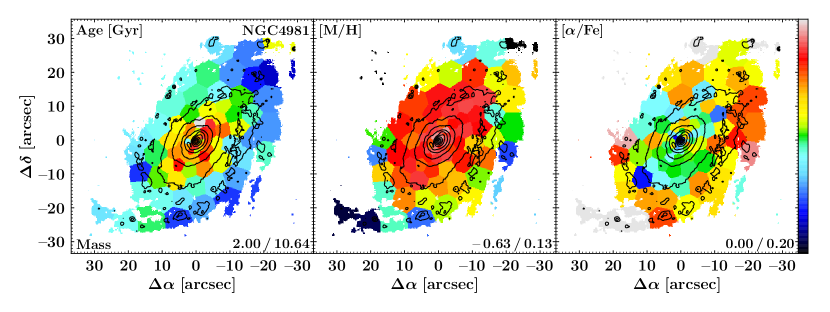
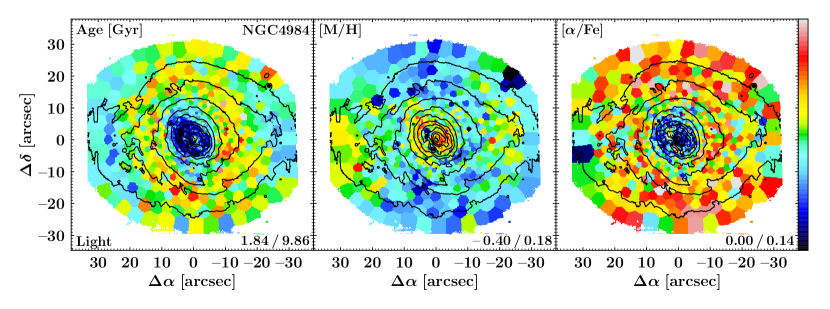
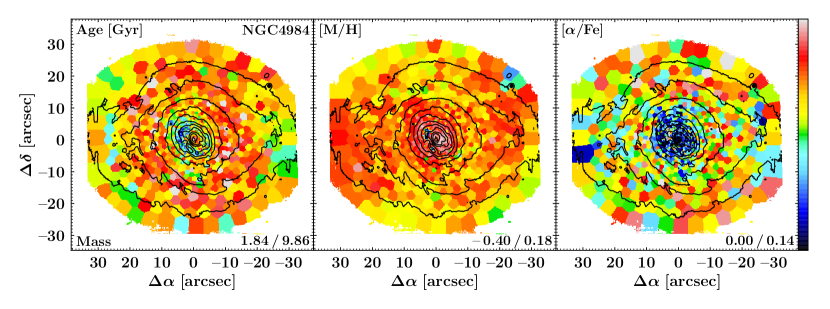
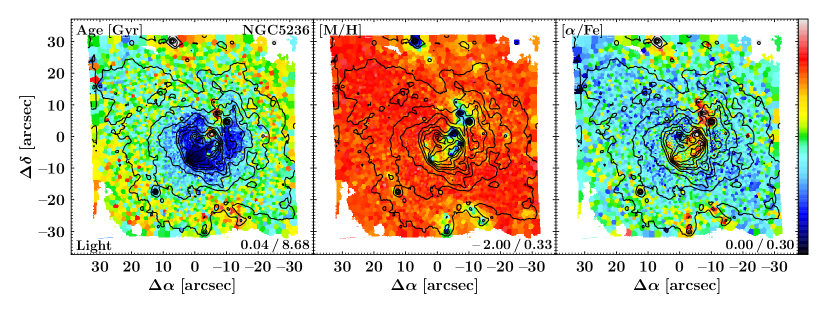
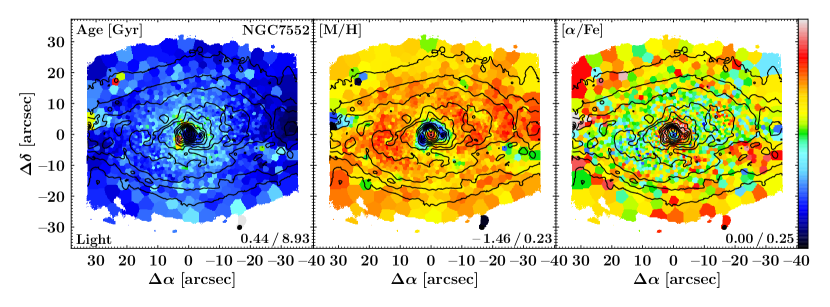
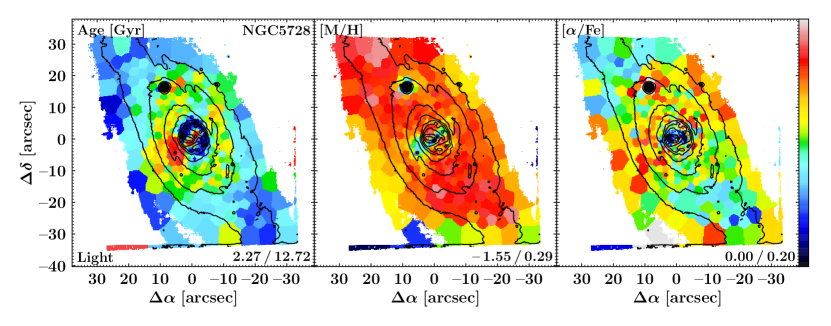
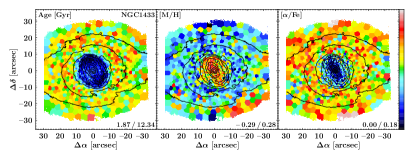
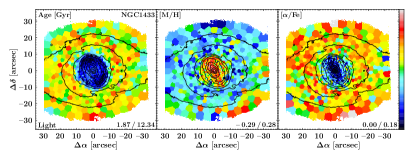
The kinematic analysis of the sample in an accompanying study (see G20) has already shown that nuclear discs are clearly present in all TIMER galaxies except perhaps NGC 6902, which is a rather peculiar object. These nuclear discs are also found in the maps of the mean stellar population properties (see left columns of Figs. 4 and Appendix C). While these structures are unambiguously present, the general appearance of nuclear discs and nuclear rings varies significantly between the star-forming and non-star-forming subsample.
Nuclear discs in the non-star-forming subsample appear as well-defined discs with mean stellar populations that are younger, more metal-rich, and less [/Fe] enhanced as compared to their immediate surroundings. Since these galaxies do not host a starbursting nuclear ring, the maps of the mean stellar population properties do also not show signs of such nuclear rings, i.e. significantly different populations at the outer edges of the nuclear discs.
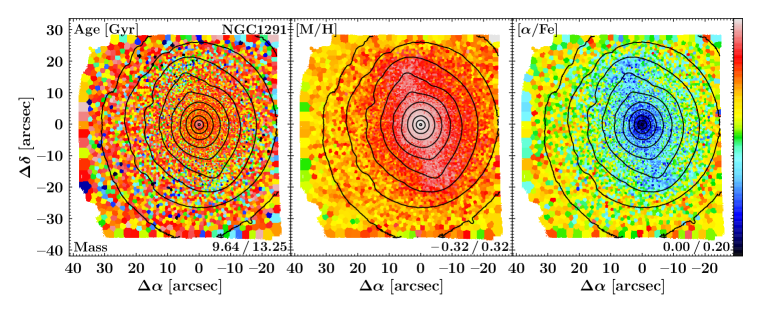
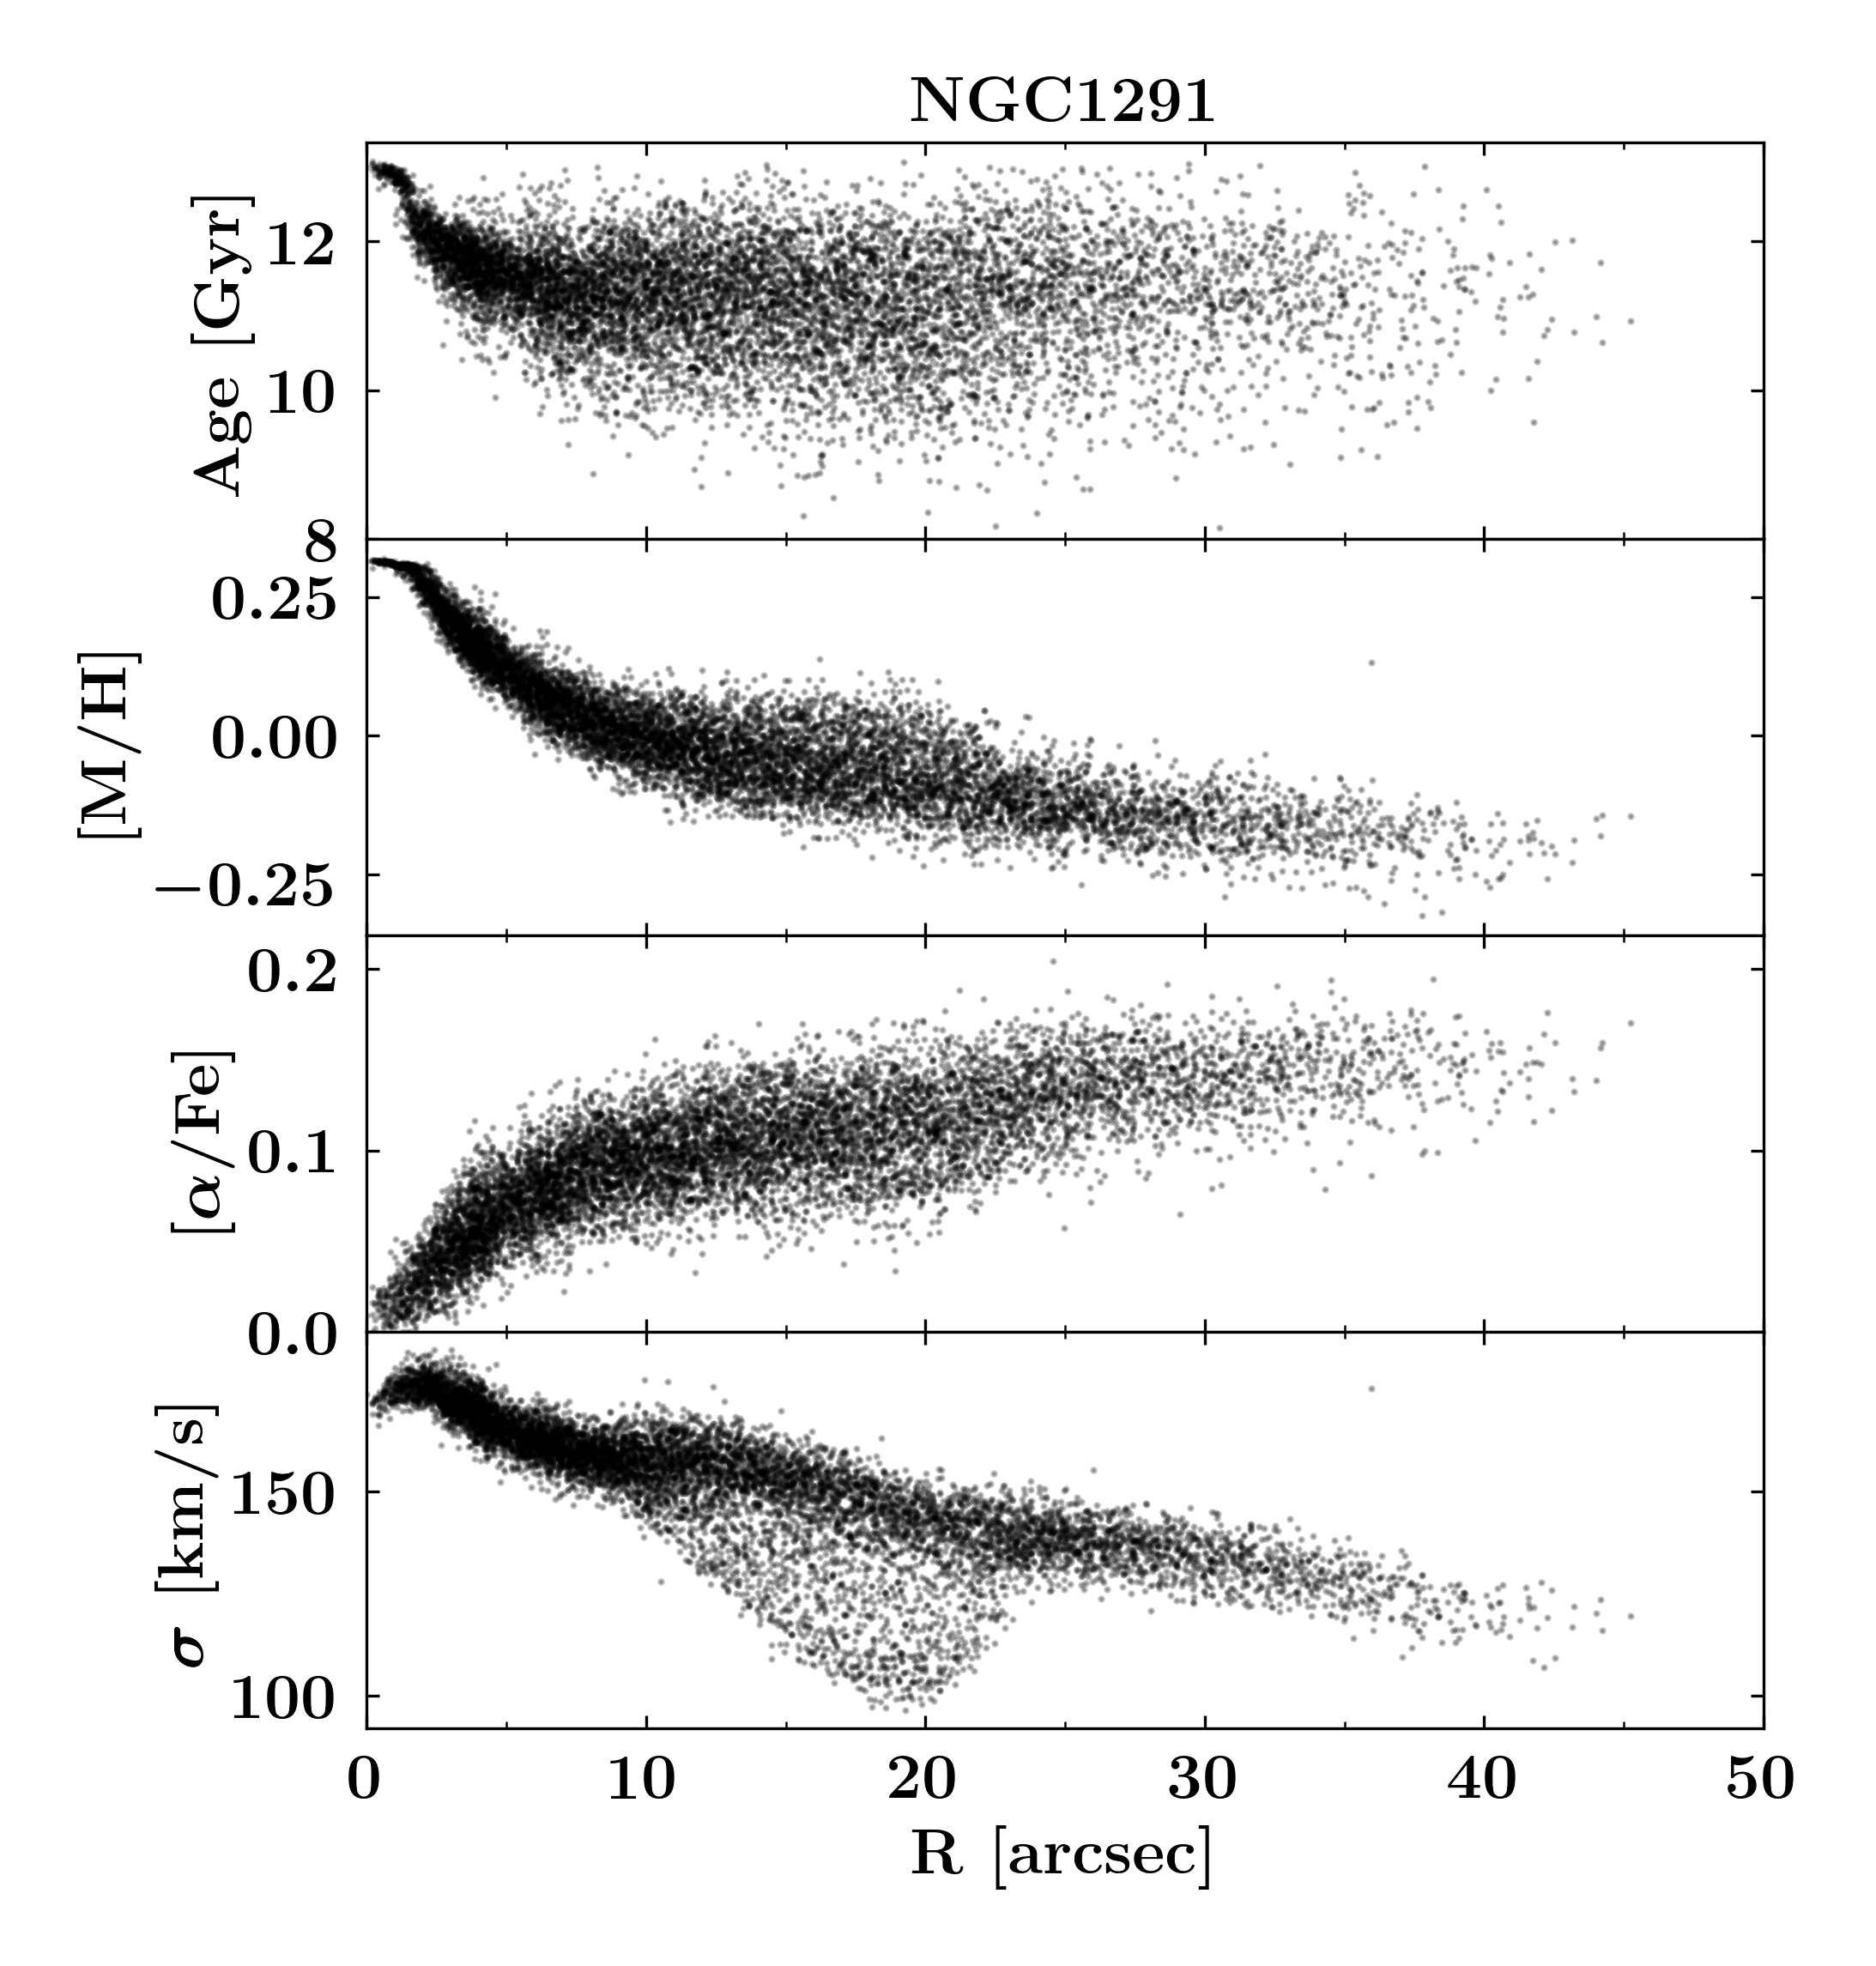
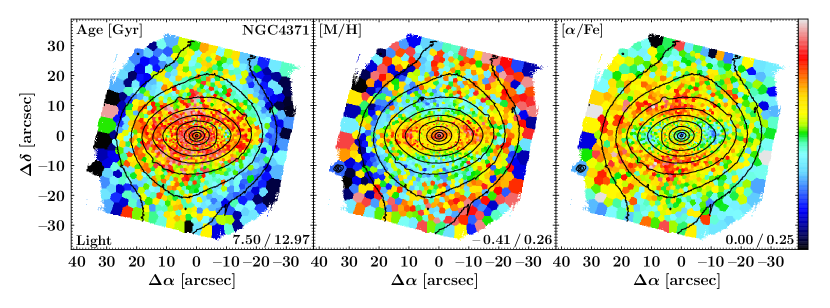
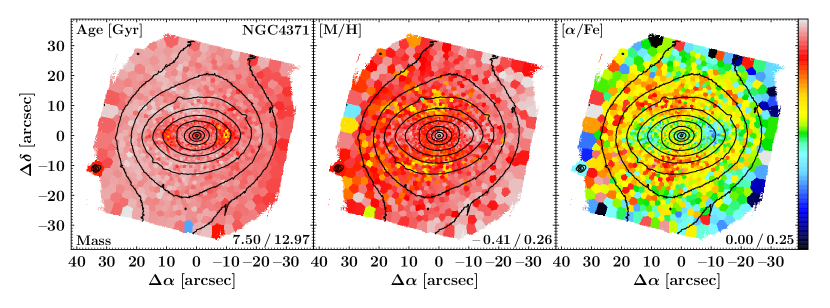
A particularly notable nuclear disc in the non-star-forming subsample is hosted by NGC 1291. Previous studies of the TIMER team have already claimed that this galaxy hosts a nuclear disc with an effective radius of , as determined through photometric decompositions (de Lorenzo-Cáceres et al., 2019b; Méndez-Abreu et al., 2019), and the stellar populations in its centre are dominated by an inner bar. This is most clear in the maps of metallicities and [/Fe] enhancements where the inner bar is clearly visible. In addition, the ends of this inner bar exhibit younger stellar populations, as compared to the rest of the field of view. de Lorenzo-Cáceres et al. (2019b) already discussed the different stellar populations in the inner bar, nuclear disc, and all other components in this complex galaxy and we will complement this analysis in a dedicated, forthcoming study. Only in NGC 4371 the nuclear disc is not immediately apparent, but this is a result of projection effects. The high inclination of together with the fact that the bar is seen almost end-on makes the detection of the nuclear disc challenging. Nonetheless, a inspection of the stellar population map reveals the same trends found for the other non-star-forming galaxies. The nuclear disc appears almost edge-on, with young, metal-rich, and [/Fe] depleted stellar populations observed approximately east and west of the galaxy centre. For a detailed analysis of this galaxy we refer the reader to Gadotti et al. (2015).
Nuclear discs in the star-forming subsample follow, in general, the same trends. Over the majority of the radial extent of the nuclear discs these appear as well younger, more metal-rich, and [/Fe] depleted. However, the star-forming nuclear rings, i.e. the outer edges of the nuclear discs, show significantly different stellar population properties. These nuclear rings are often characterised by very low ages (often below ), exceptionally low metallicities (even below [M/H] = -1.5), and significantly enhanced [/Fe] abundances (up to [/Fe] = 0.30). In fact, these distinctive nuclear rings spatially coincide with the regions of elevated H emission-line fluxes and, based on the standard BPT methodology, are attributed to effects from ongoing star formation or a starburst episode (see Sect. 5.1). As discussed above, in these cases, the derived population properties might be unreliable, as the light in the star-forming regions could be dominated by very young stellar populations (below ) which are not included in the employed set of SSP models, or affected by uncertainties in the H emission-line subtraction.
In the surroundings of the nuclear discs other structural components of the galaxies are evident. In some cases (almost) the entire bar is covered by the MUSE field of view. In these galaxies (see e.g. IC 1438, NGC 4643, NGC 7755) the bar is visible through its elevated metallicities and low [/Fe] enhancements (see also Neumann et al., 2020). Nonetheless, the metallicities and [/Fe] abundances of the bars are not as elevated/depleted as those detected in the nuclear discs. In almost all galaxies the nuclear discs are also surrounded by a region of older stellar populations. A comparison with the kinematic analysis of G20 shows that these areas spatially coincide with regions showing a correlation between radial velocity and the higher order moment of the line-of-sight velocity distribution or drops in the higher order moment along the bar major axis. These are kinematic signatures of the strongly elongated stellar orbits in bars and their vertically thickened, box/peanut structure. Therefore, the regions of old stellar populations surrounding the young nuclear discs are probably related to the main bars in these galaxies.
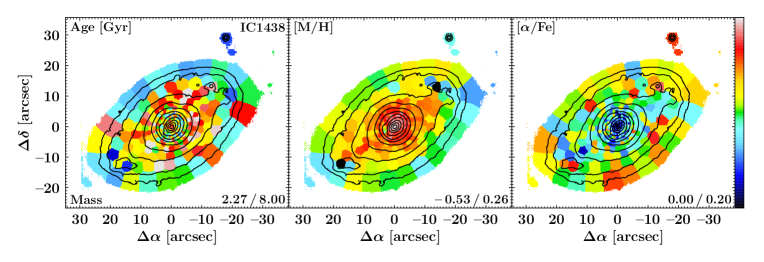
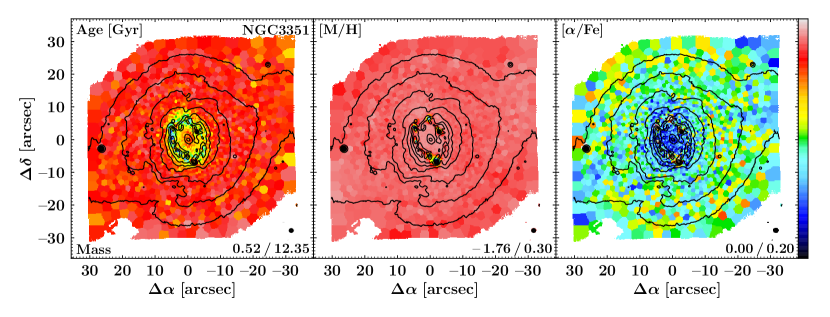
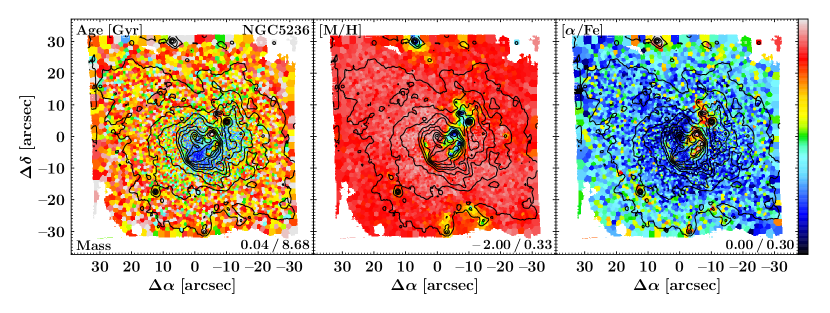
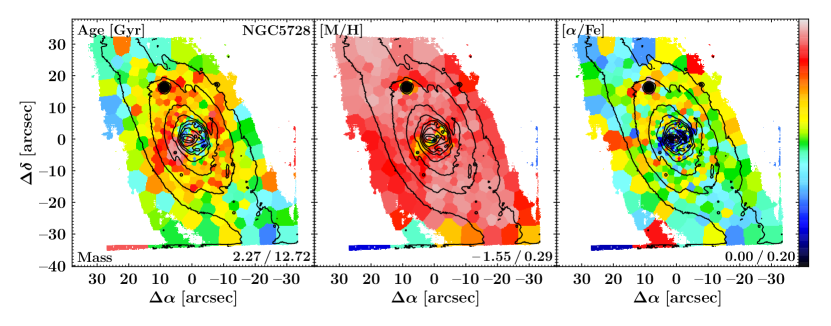
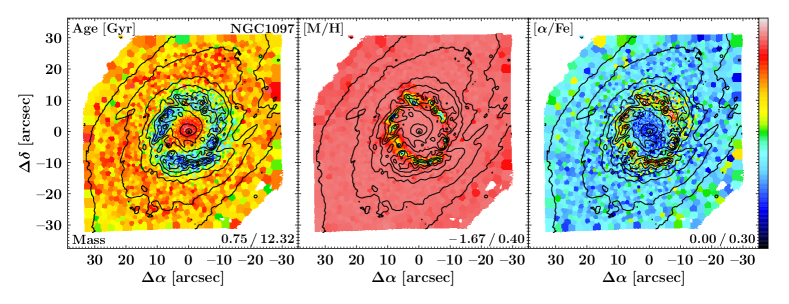
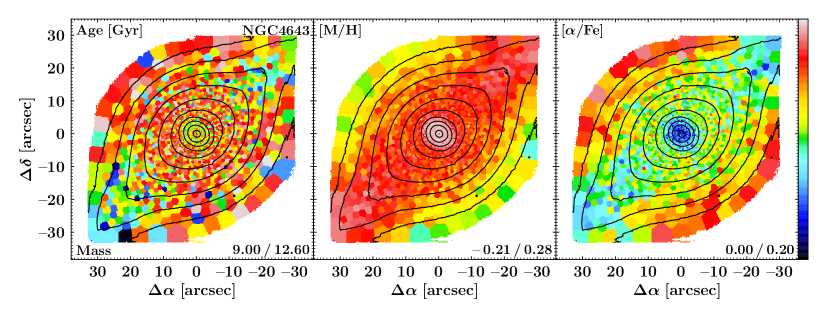
The light- and mass-weighted stellar population maps compare generally well and show qualitatively the same results. Mass-weighted maps indicate, as expected, systematically higher ages and metallicities, but similar (or in some cases lower) [/Fe] abundances. Nuclear discs often appear less pronounced in mass-weighted age maps; however, this is expected, as mass-weighted results highlight the old stellar component while nuclear discs are generally found to be comparatively young.
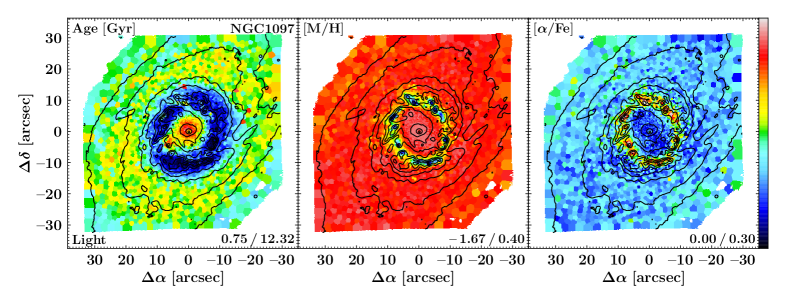
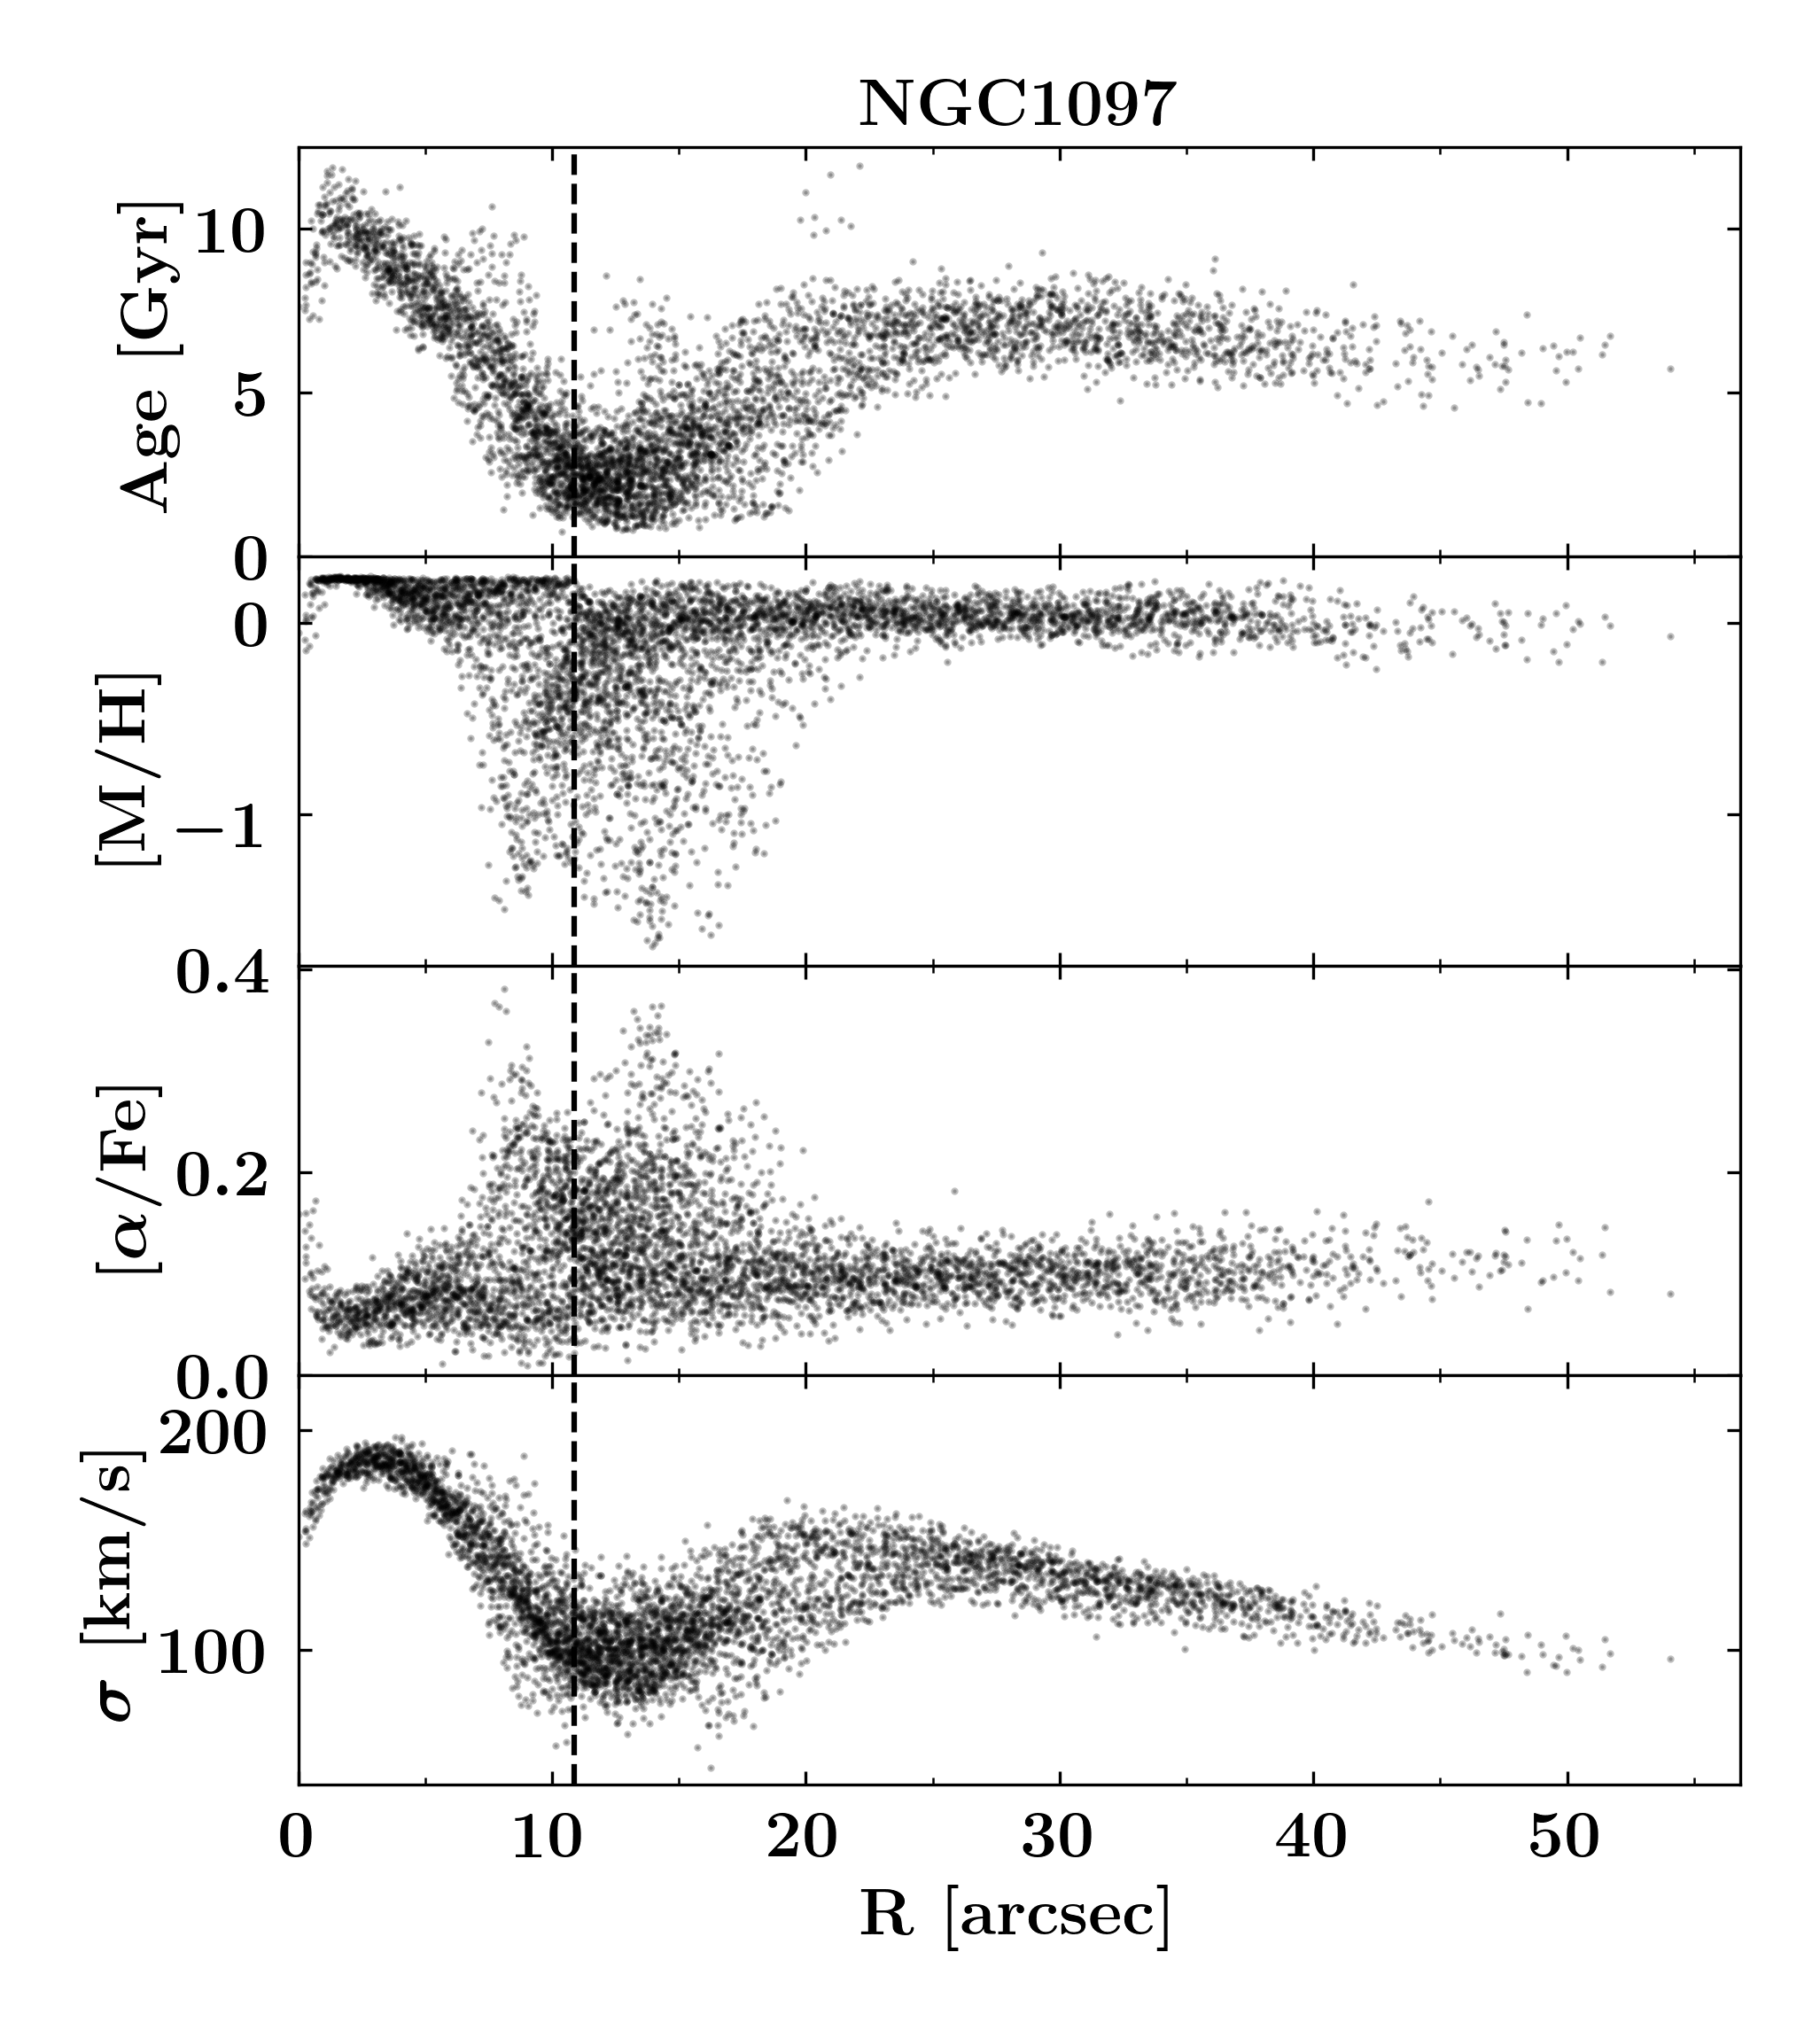
Interestingly, the orientation of the nuclear ring in NGC 1097 seems to vary between the map of stellar age and those of metallicity and [/Fe] enhancement. While the age map the nuclear ring is elongated in the north-west direction (along the bar major axis), the metallicity and [/Fe] maps indicate an elongation towards the north-east (perpendicular to the bar major axis). However, this apparent discrepancy is an effect of the chosen colourbar limits in the maps and the fact that ages are displayed linearly while metallicities are plotted on a logarithmic scale. In fact, the regions with the youngest stellar populations correspond precisely to the regions with the lowest metallicities and [/Fe] abundances. Hence, there is no physical difference in the orientation of the nuclear between the age and metallicity map.
5.3 Radial profiles of mean stellar population properties
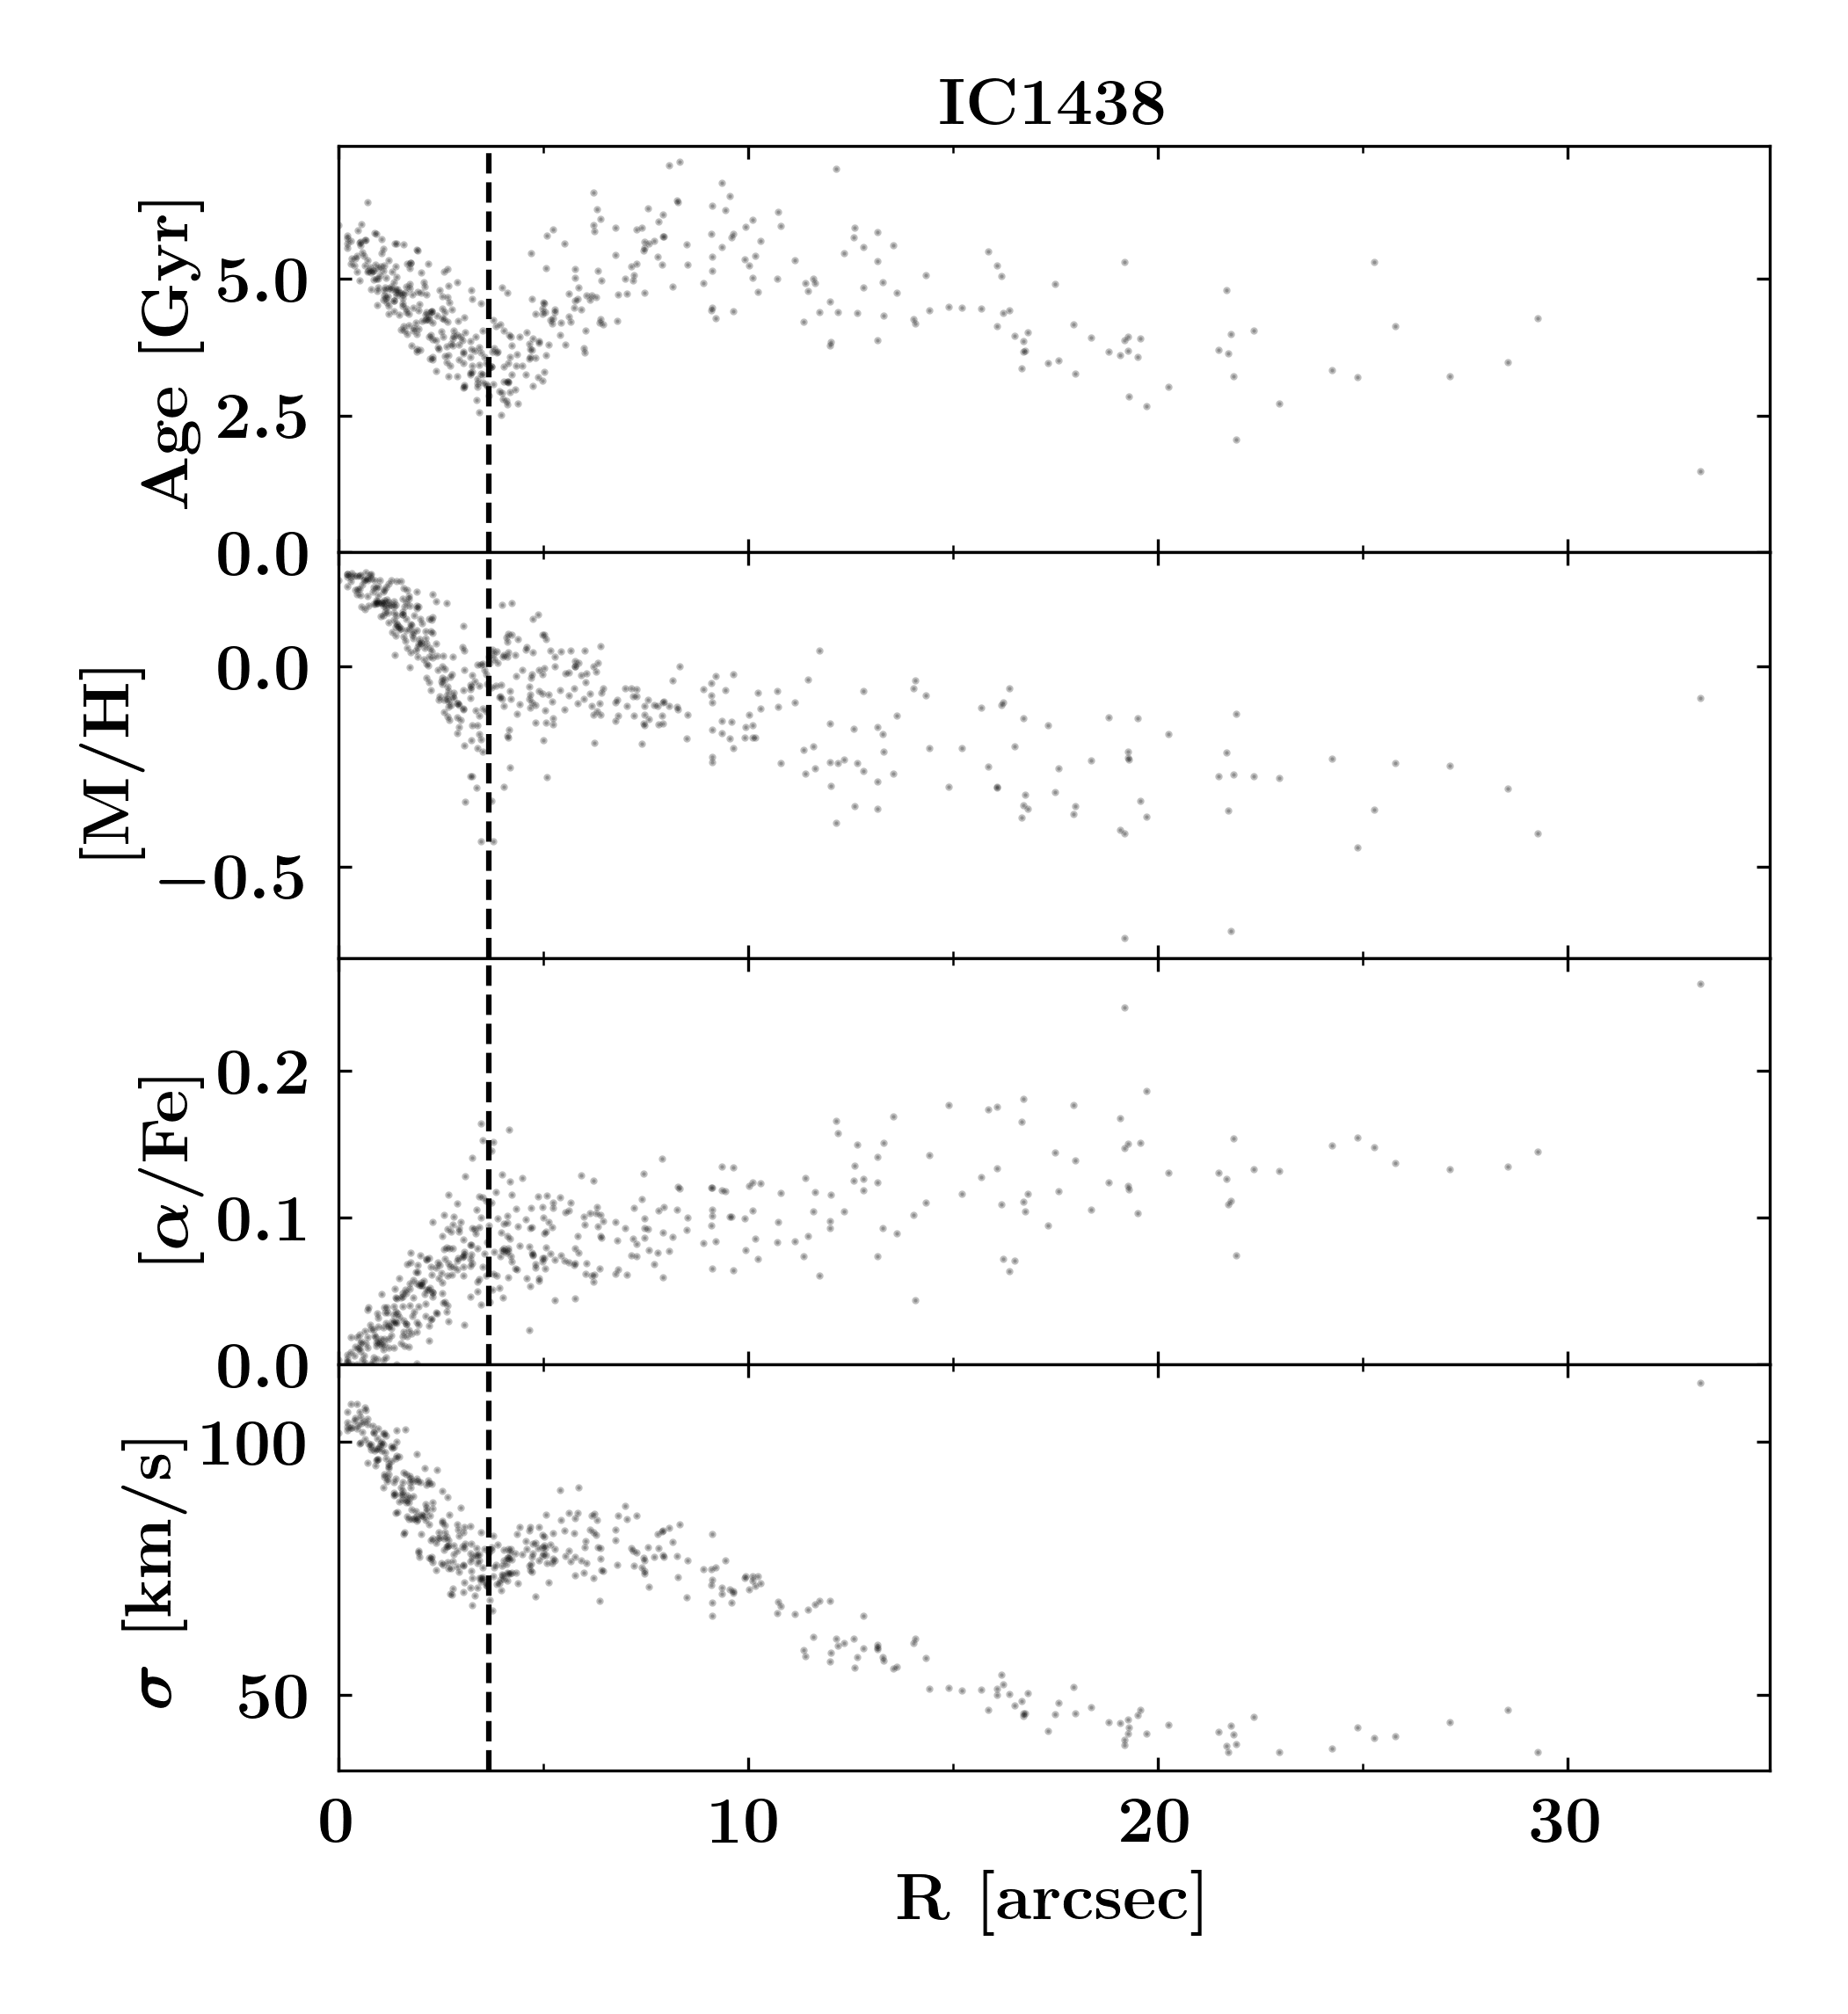
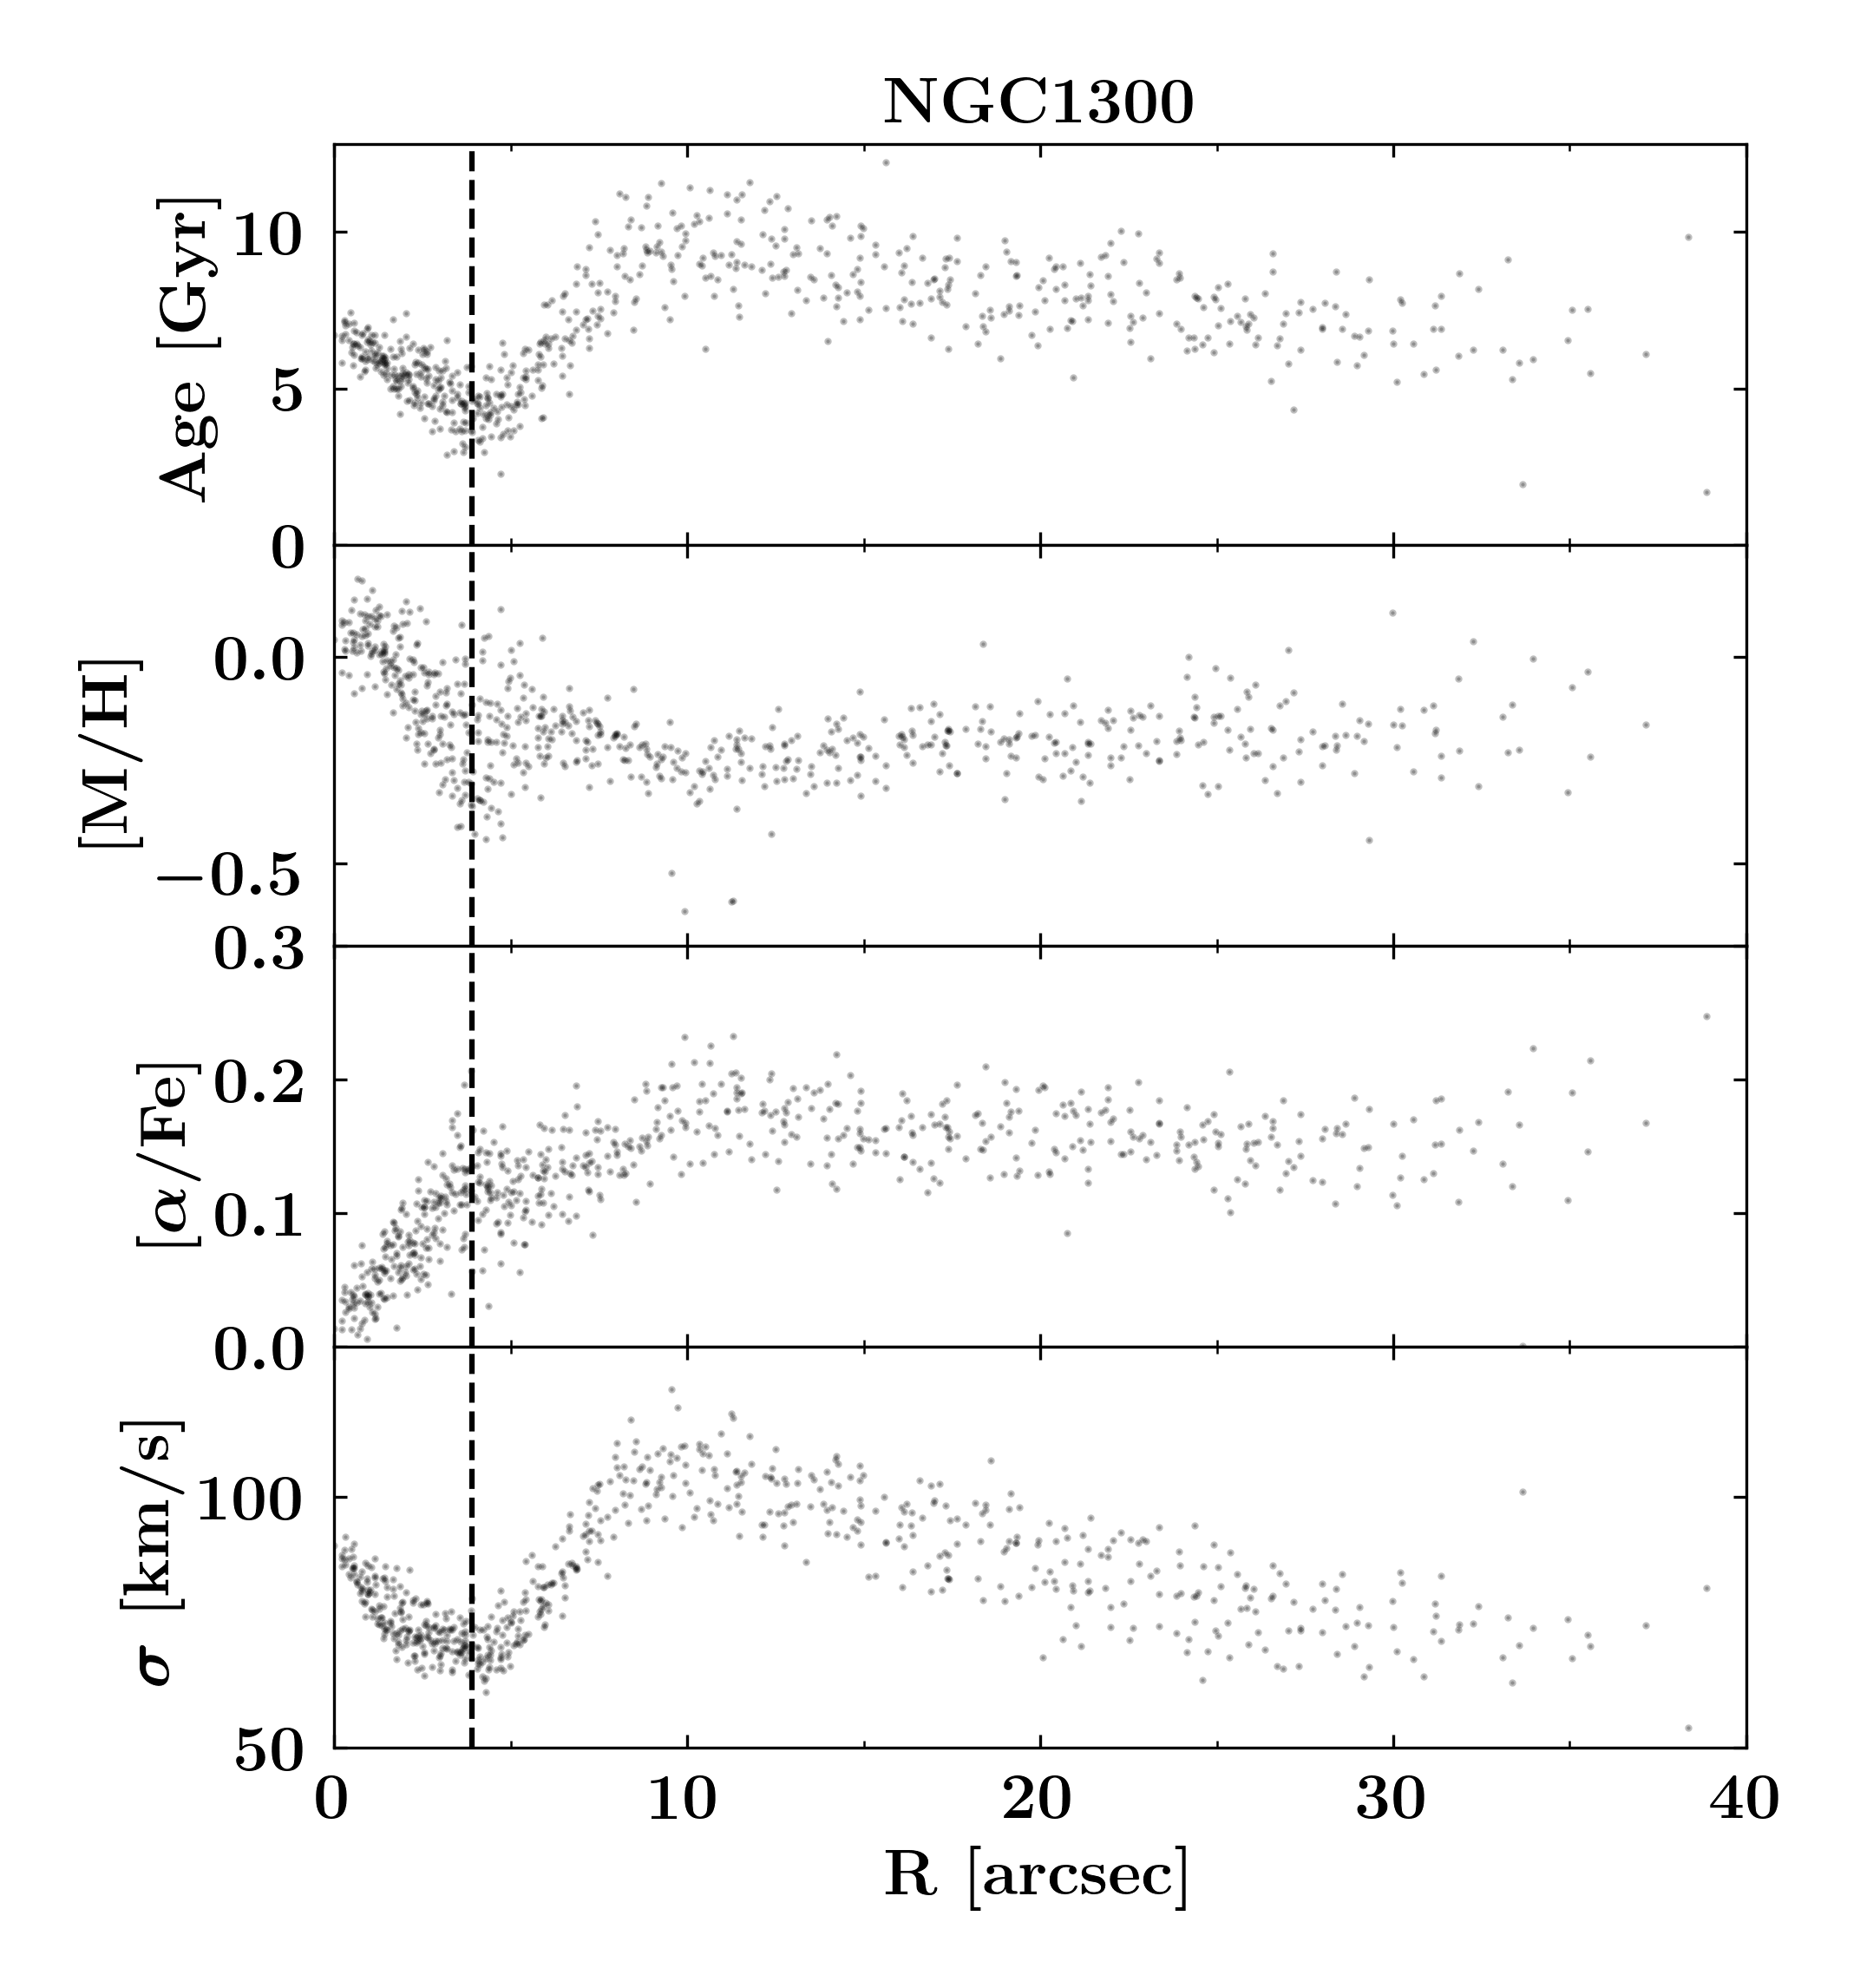
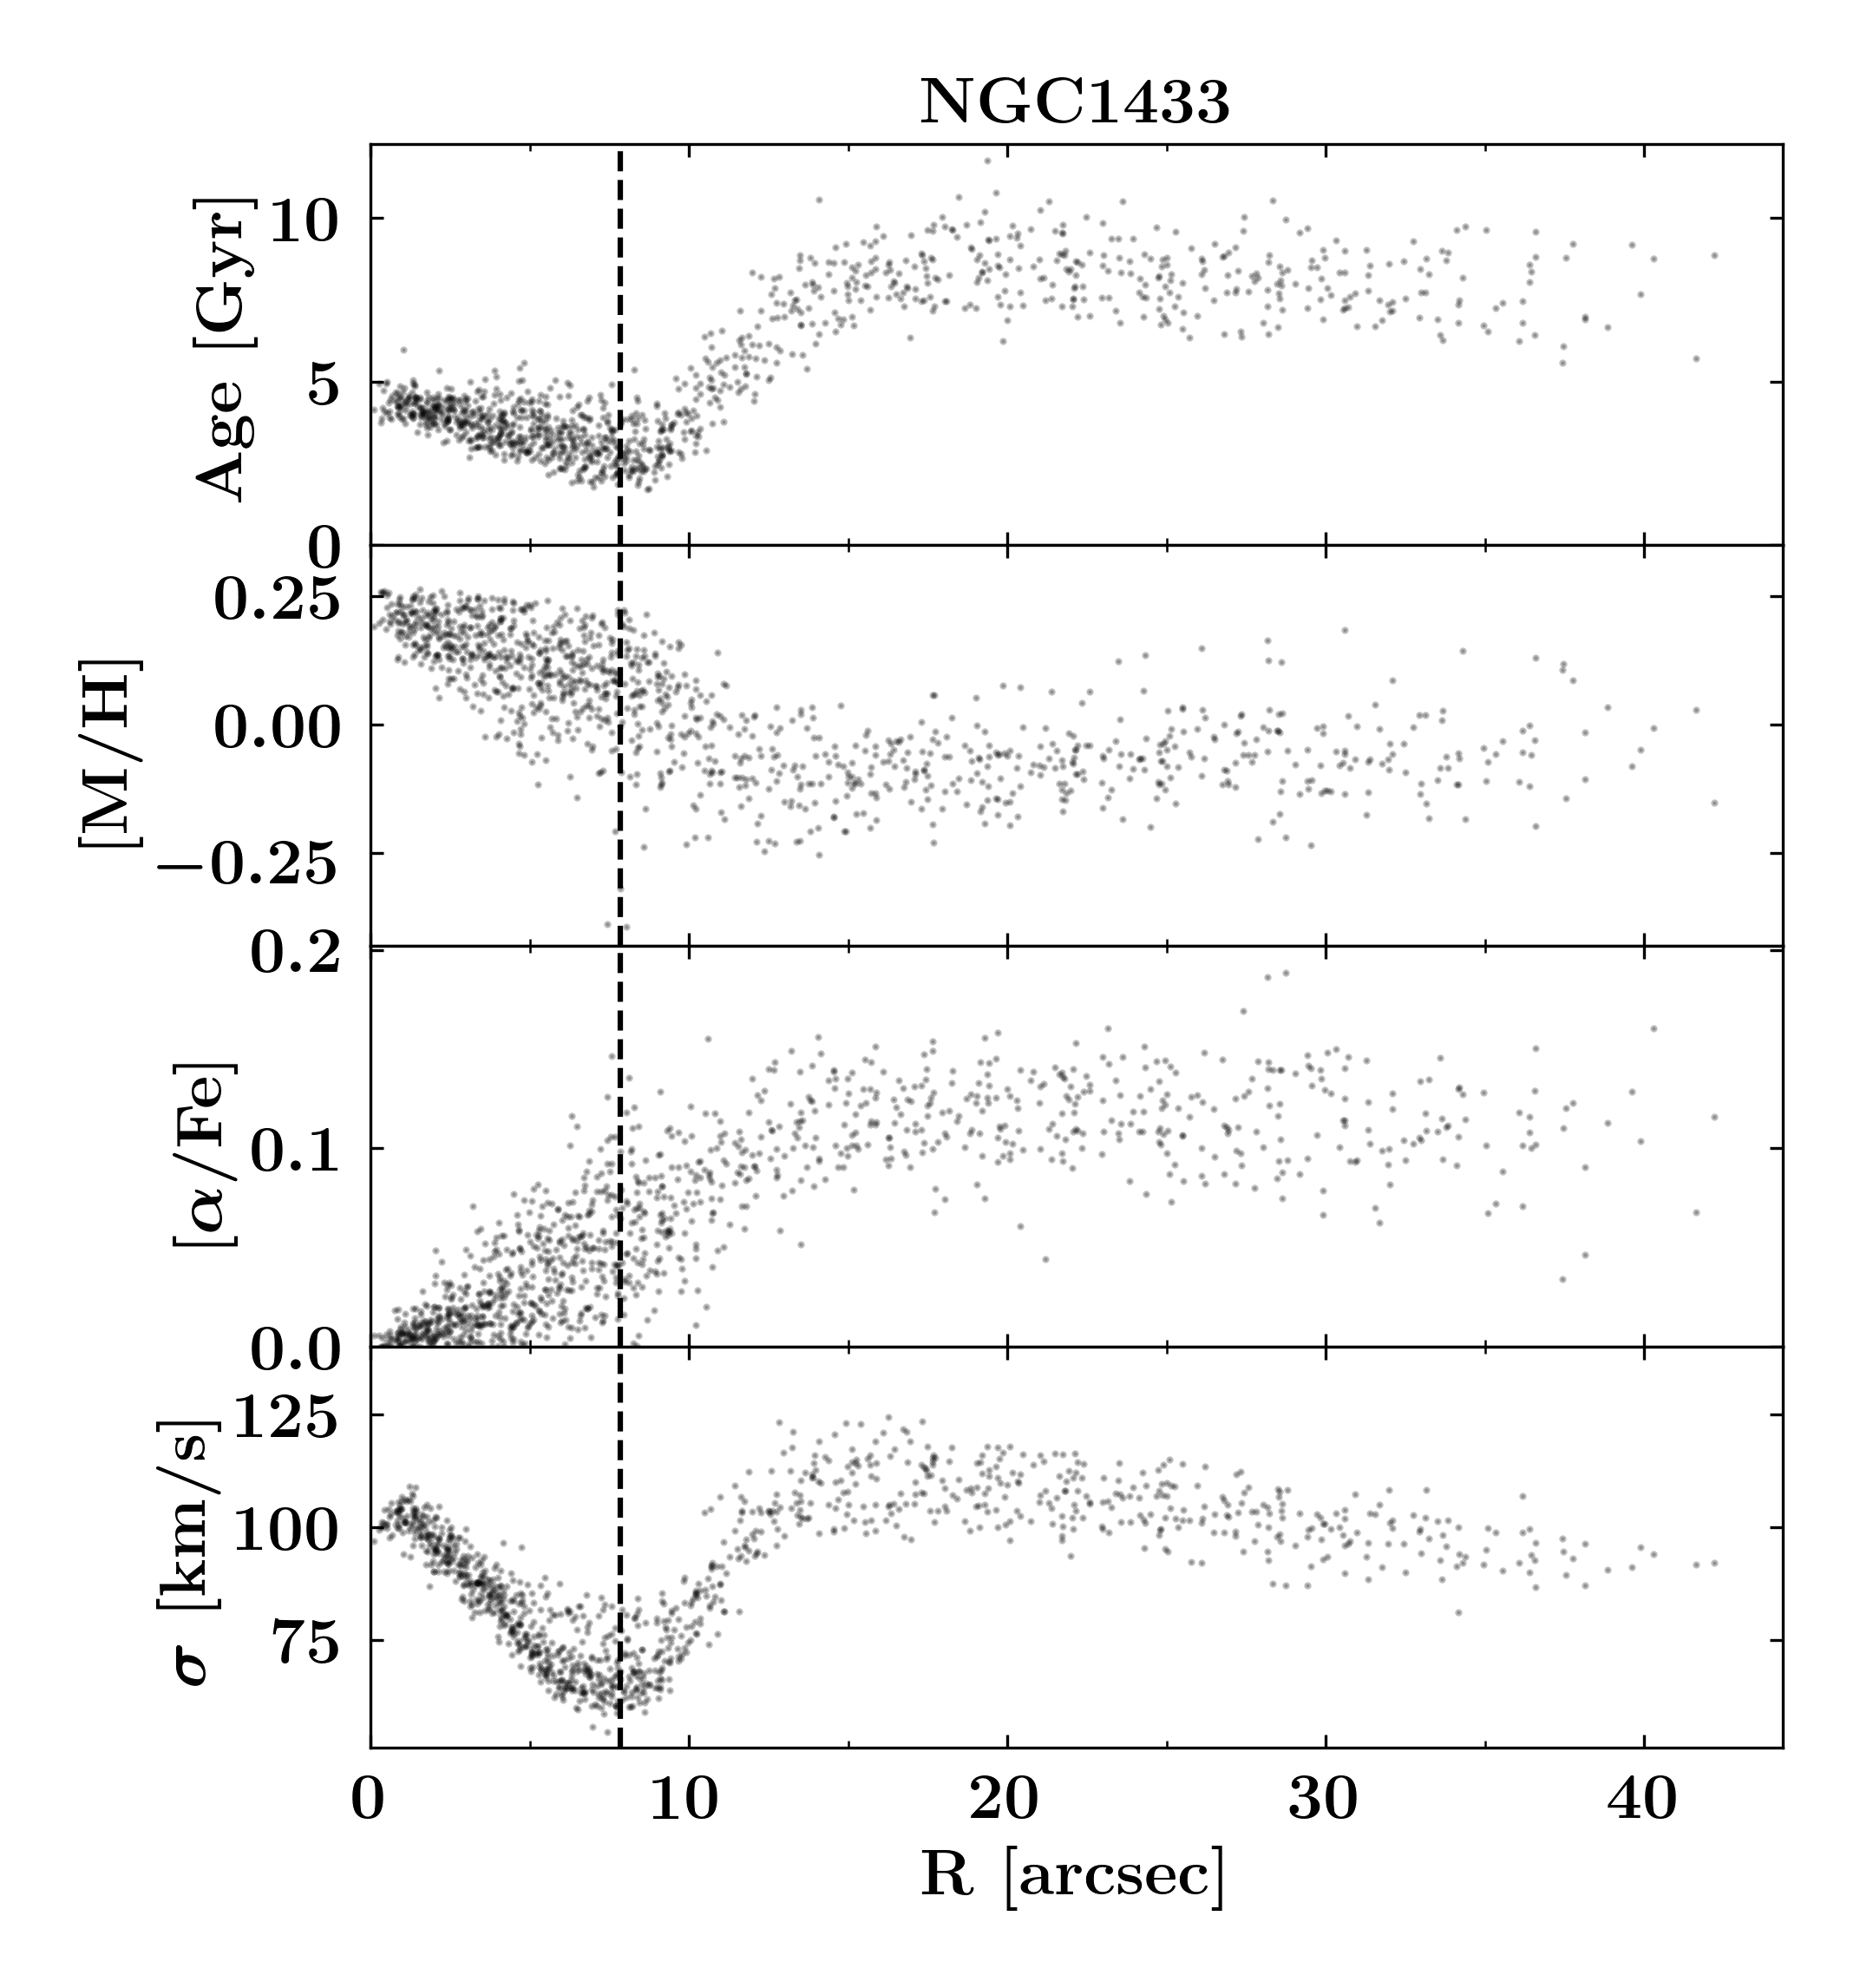
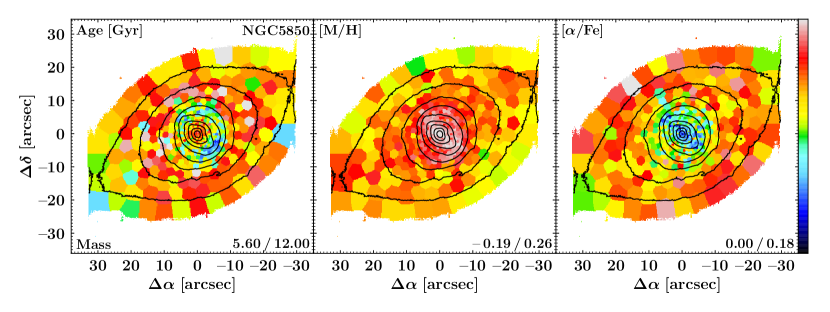
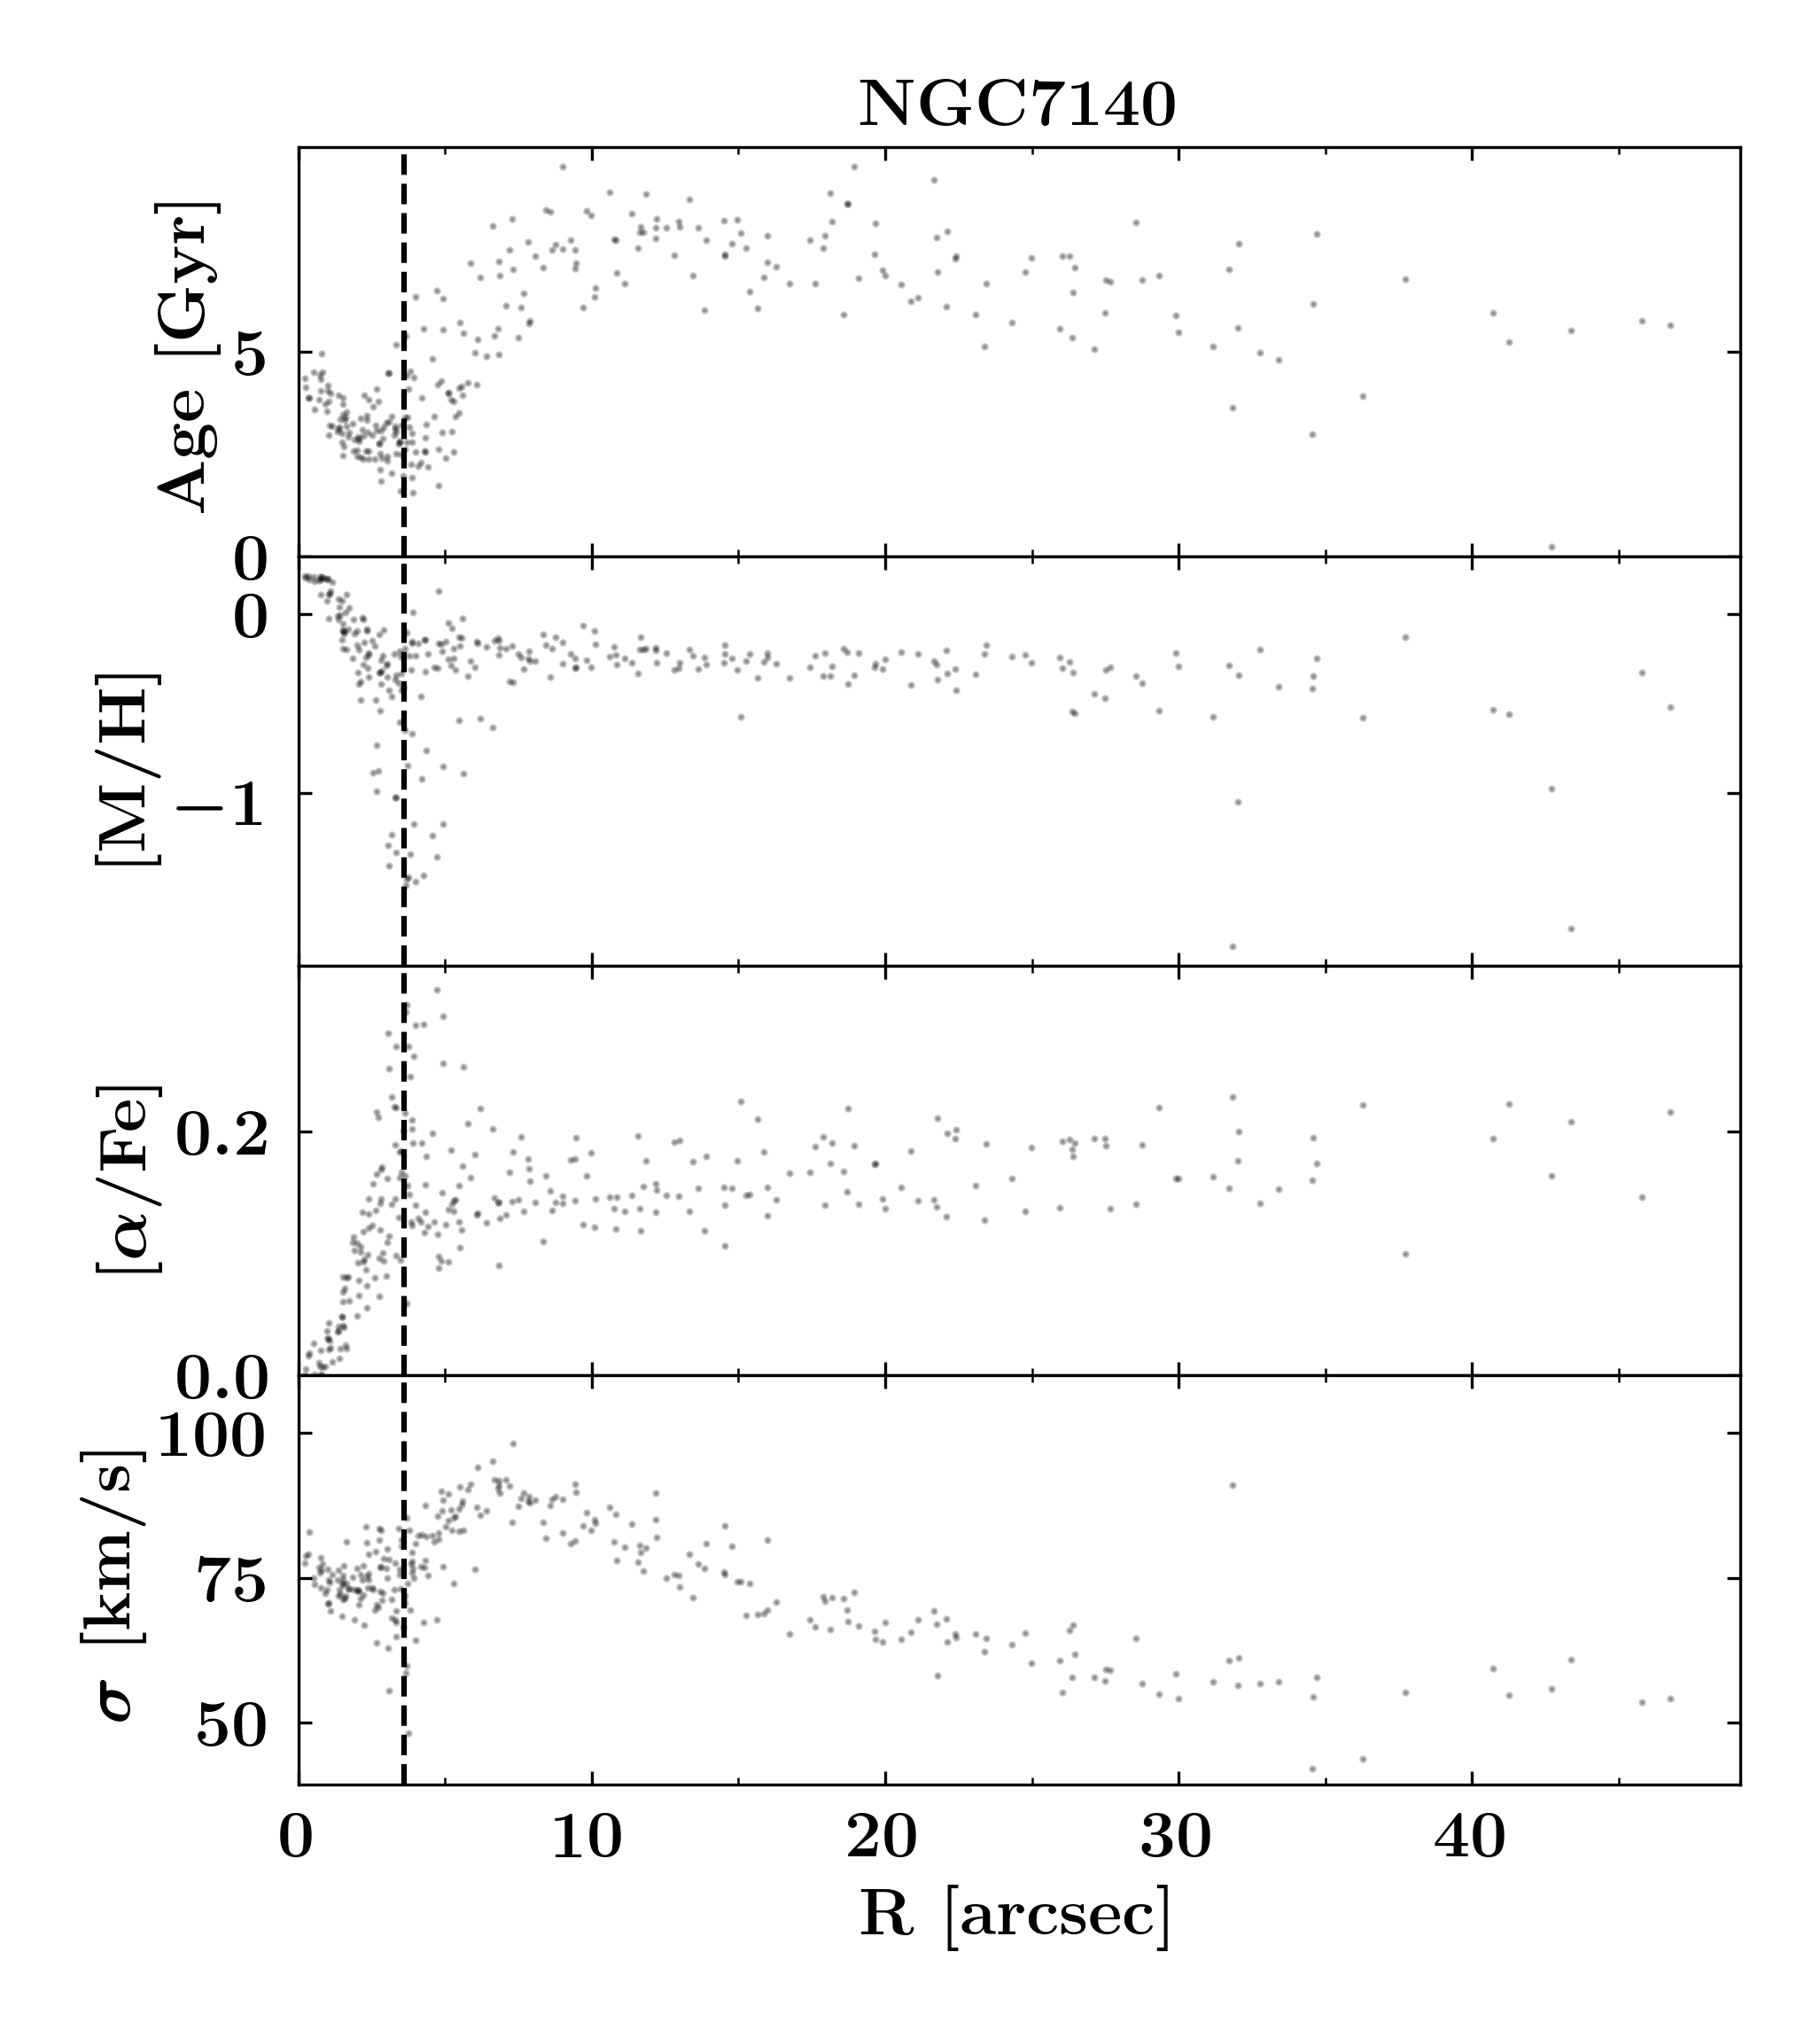
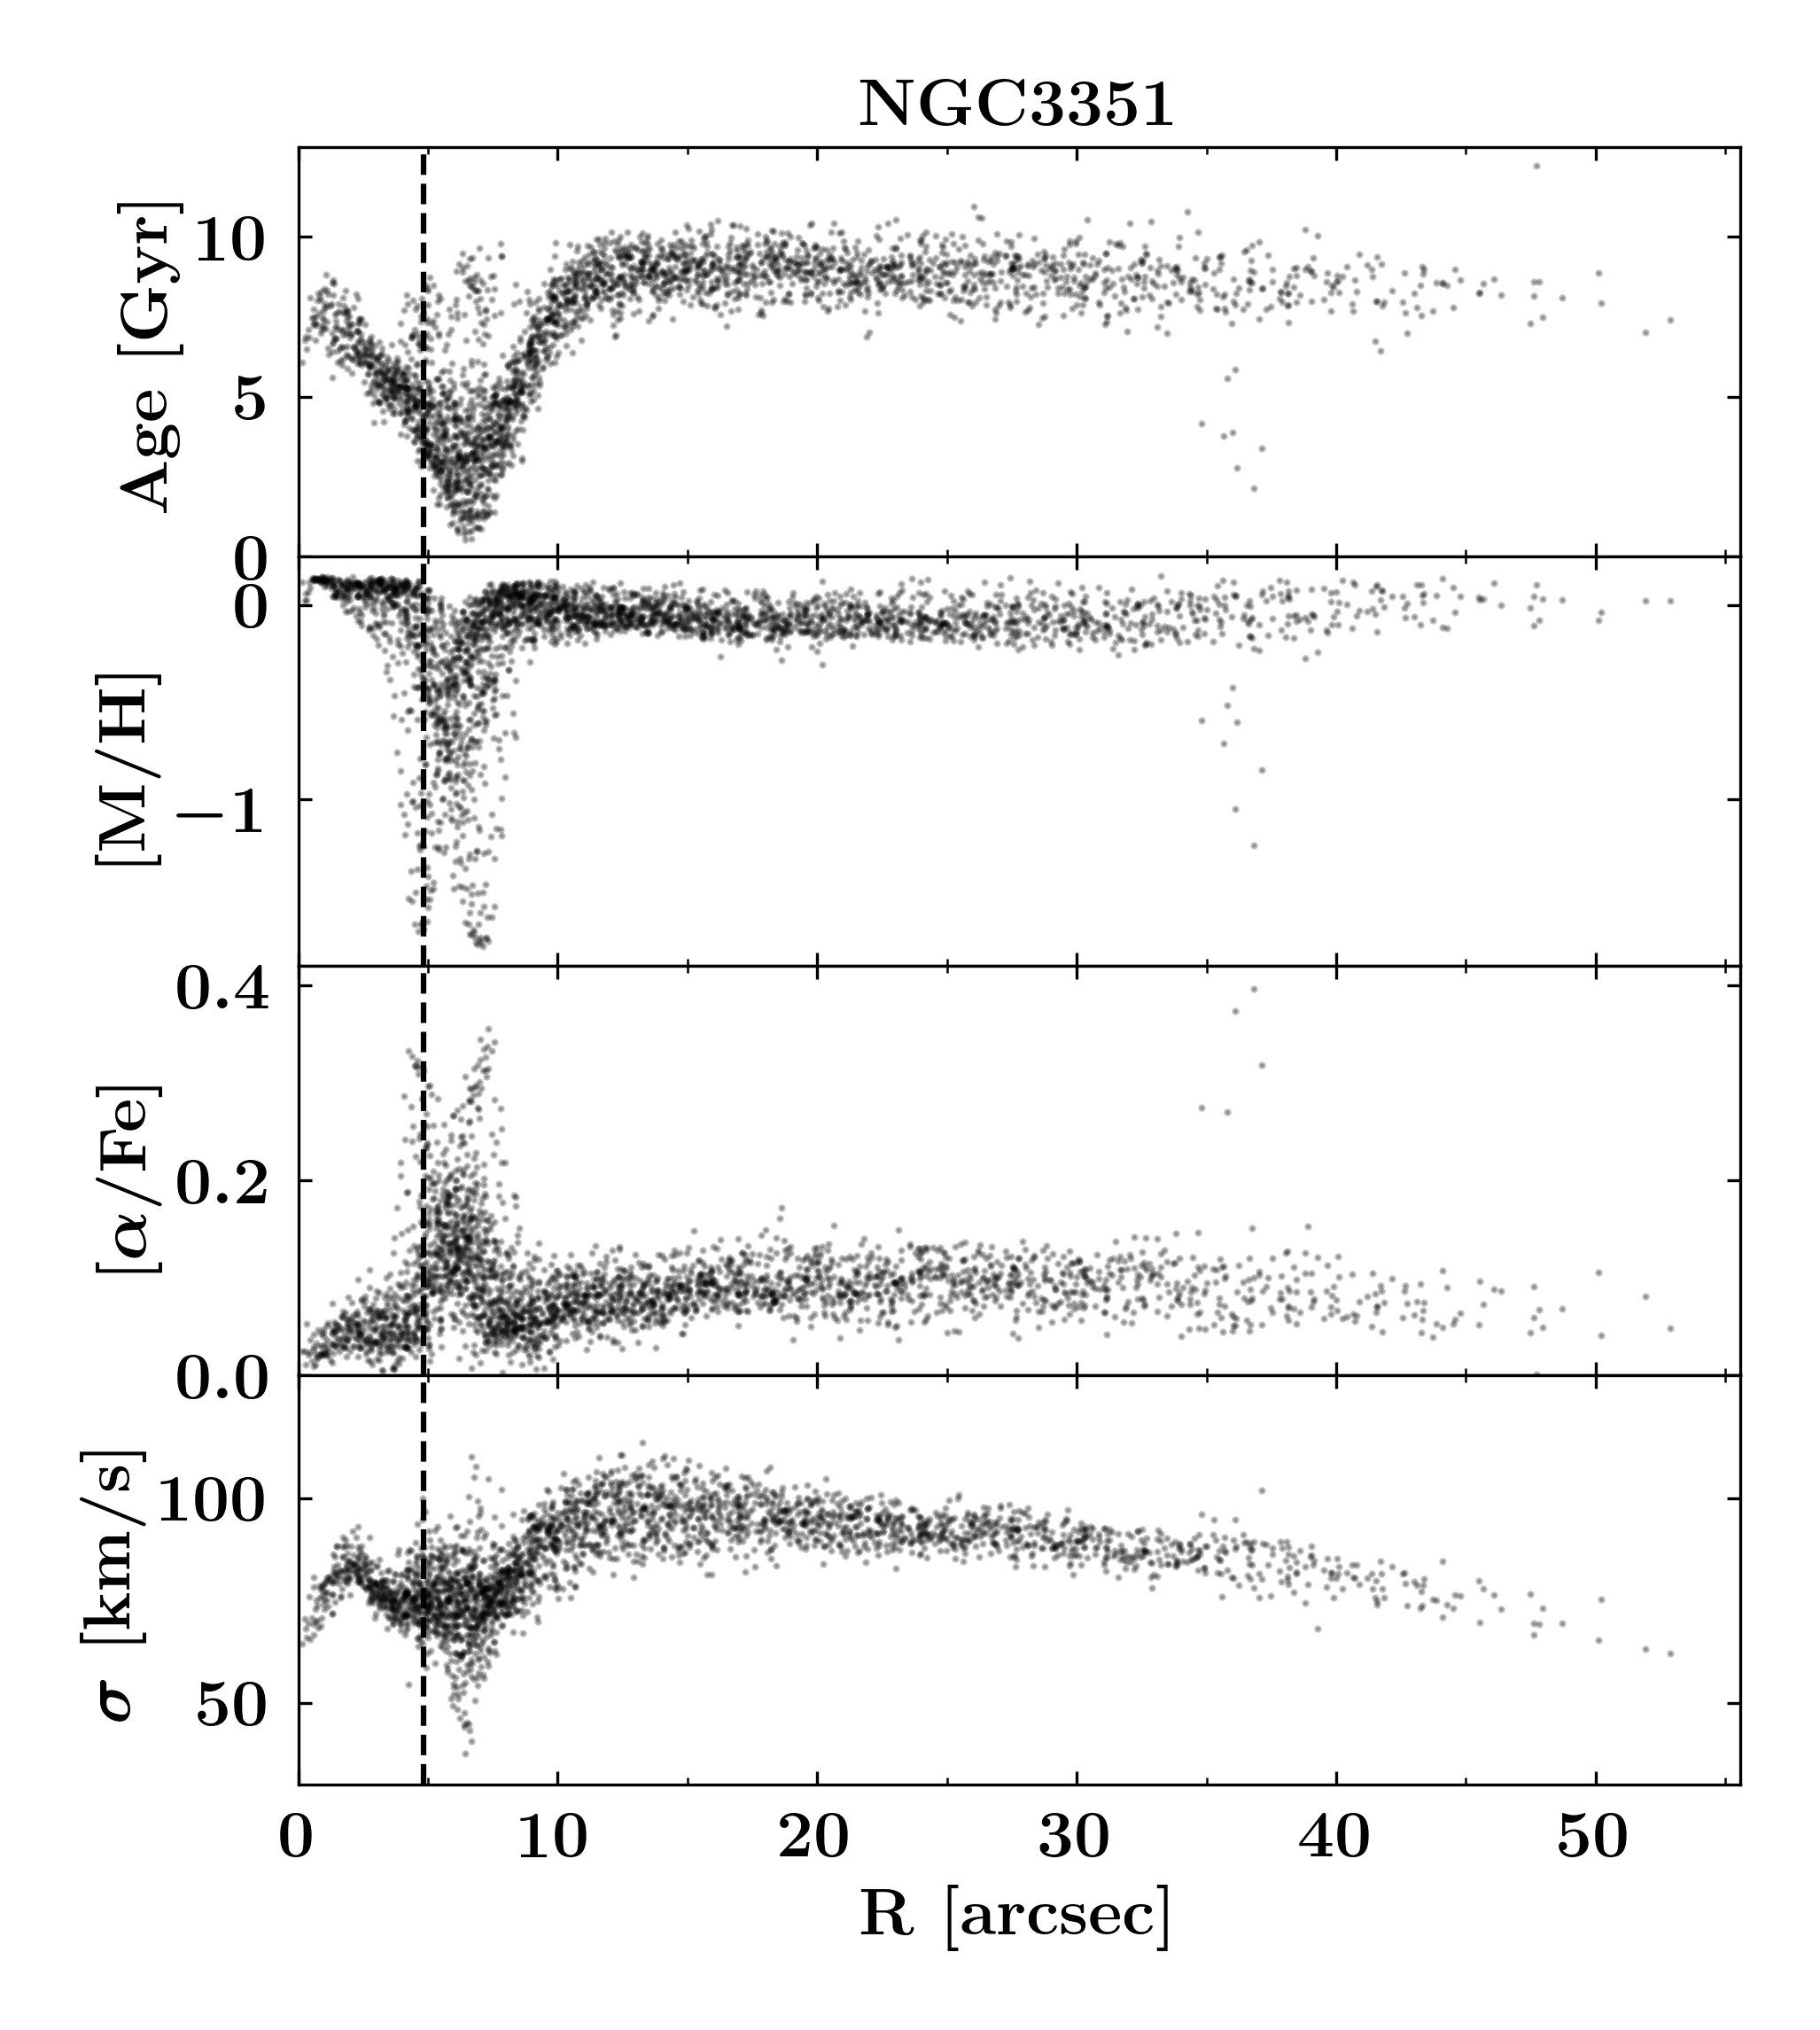
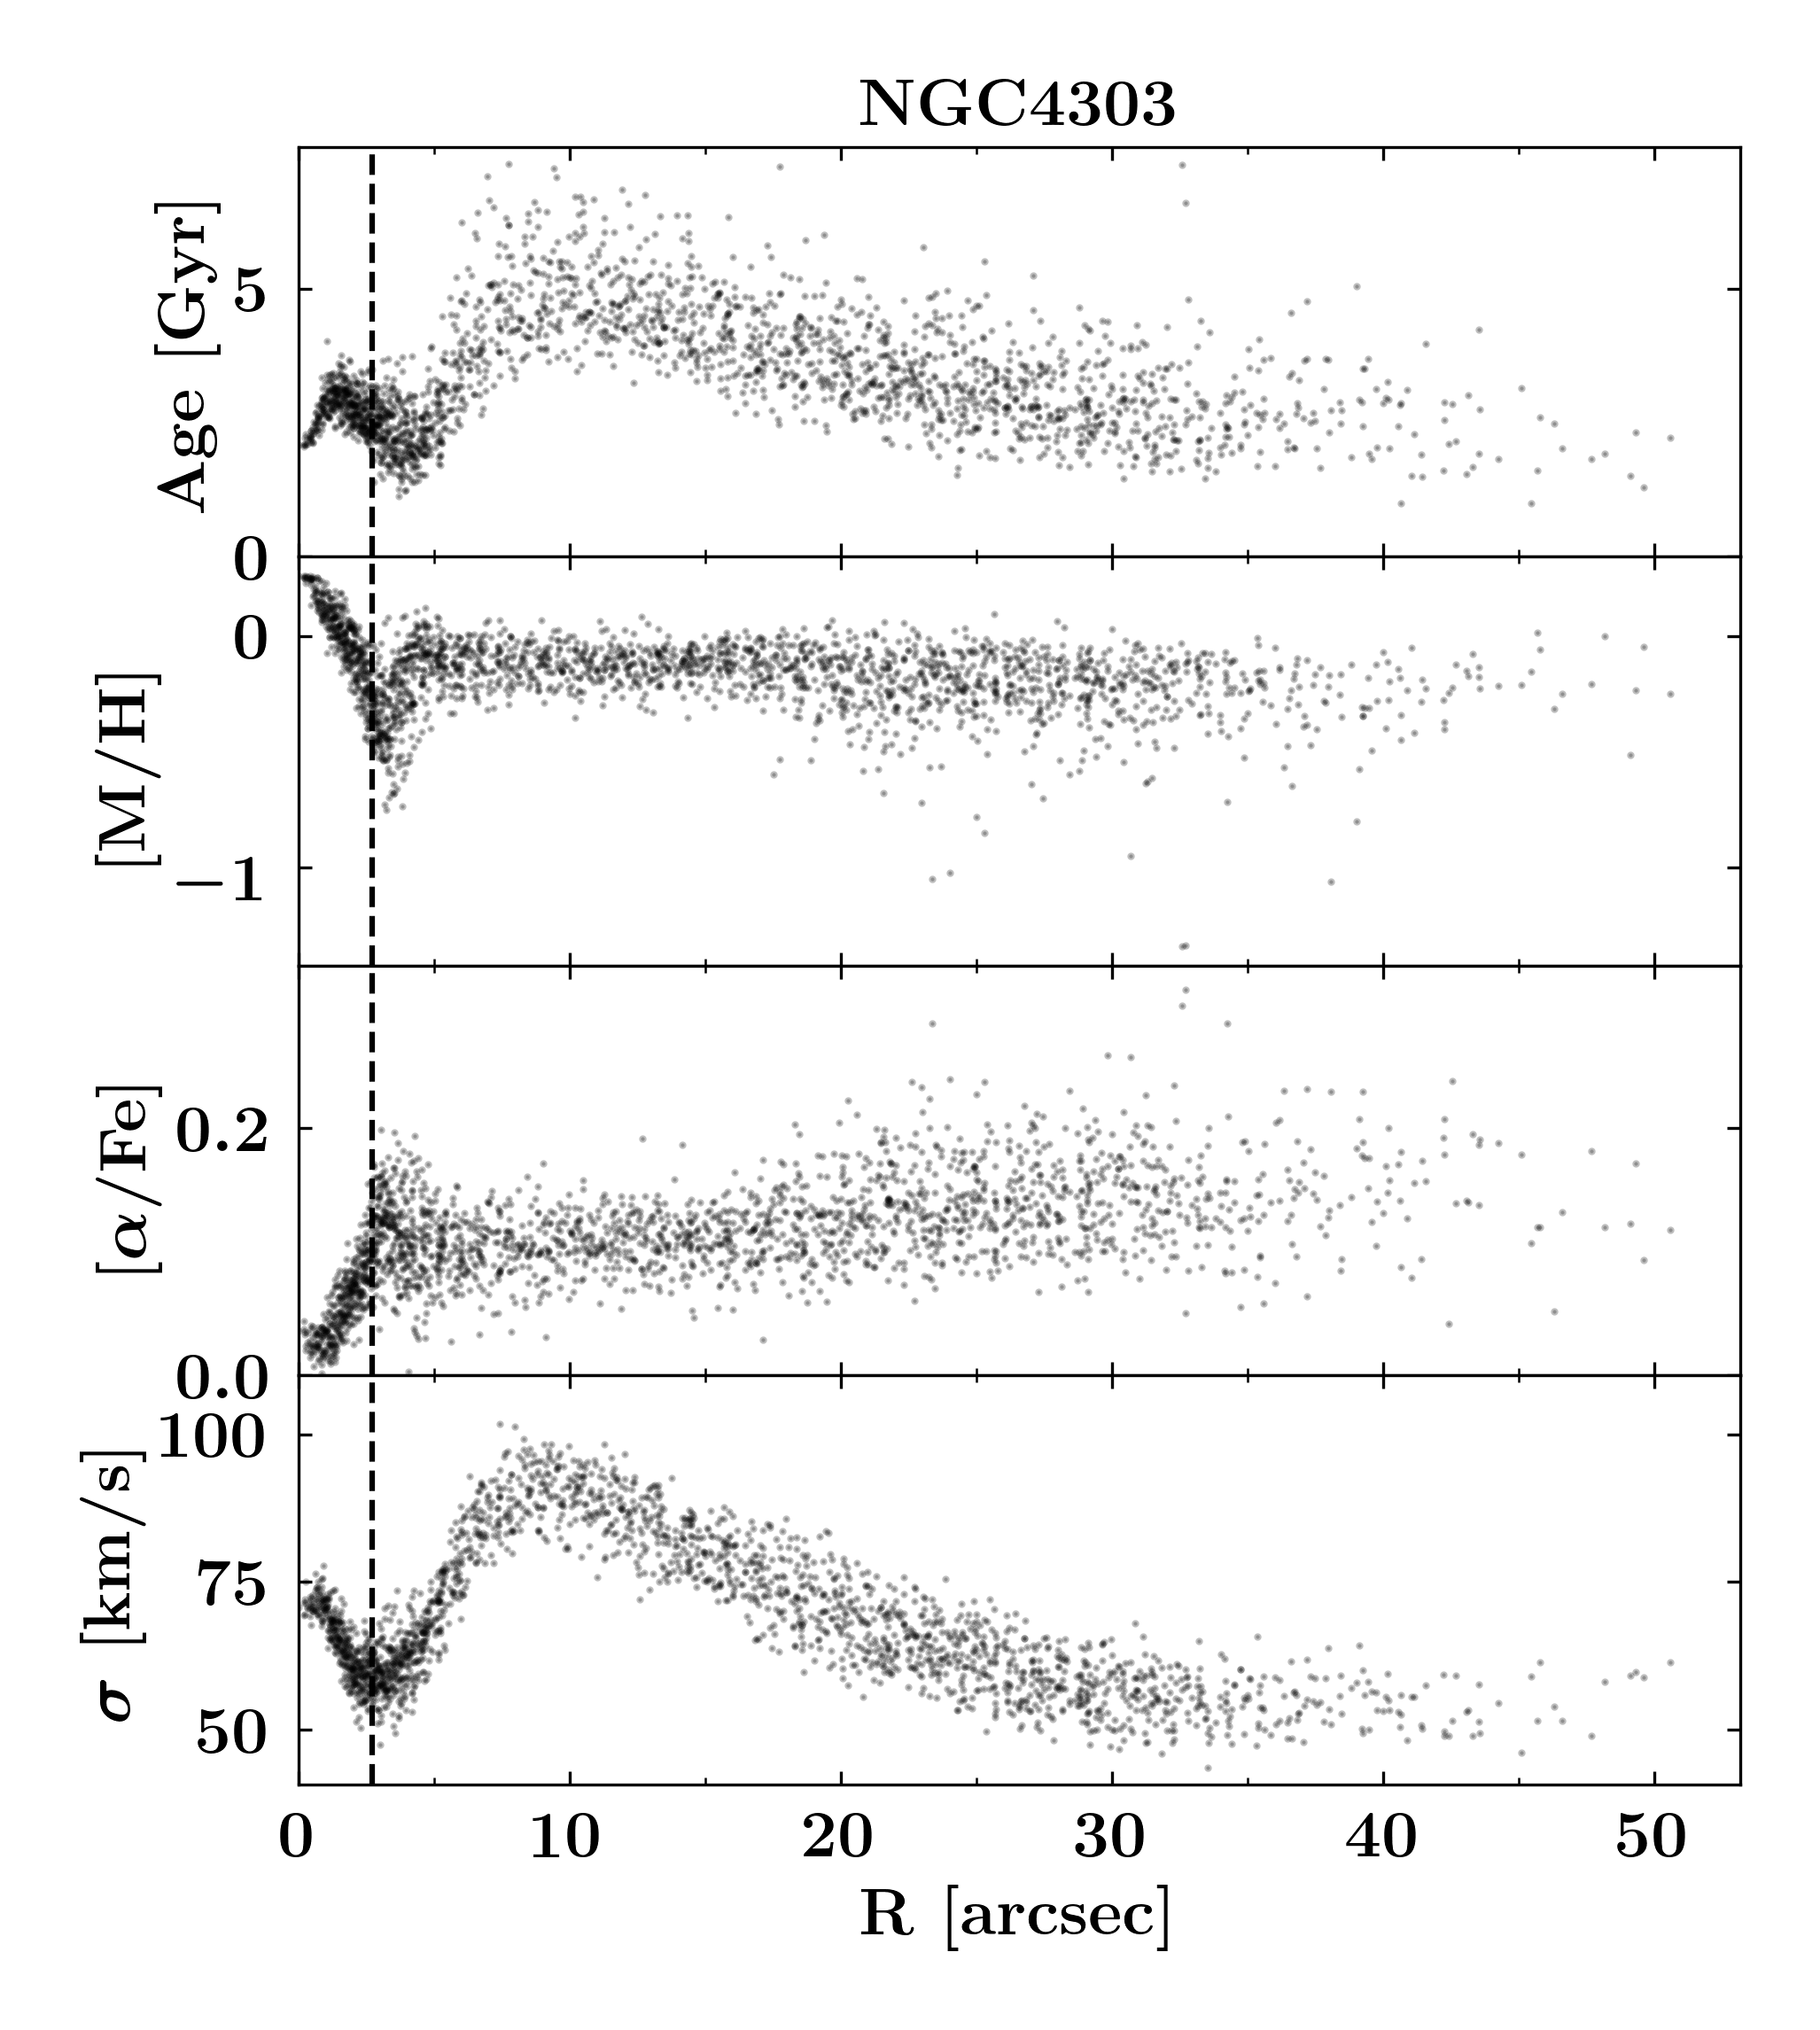
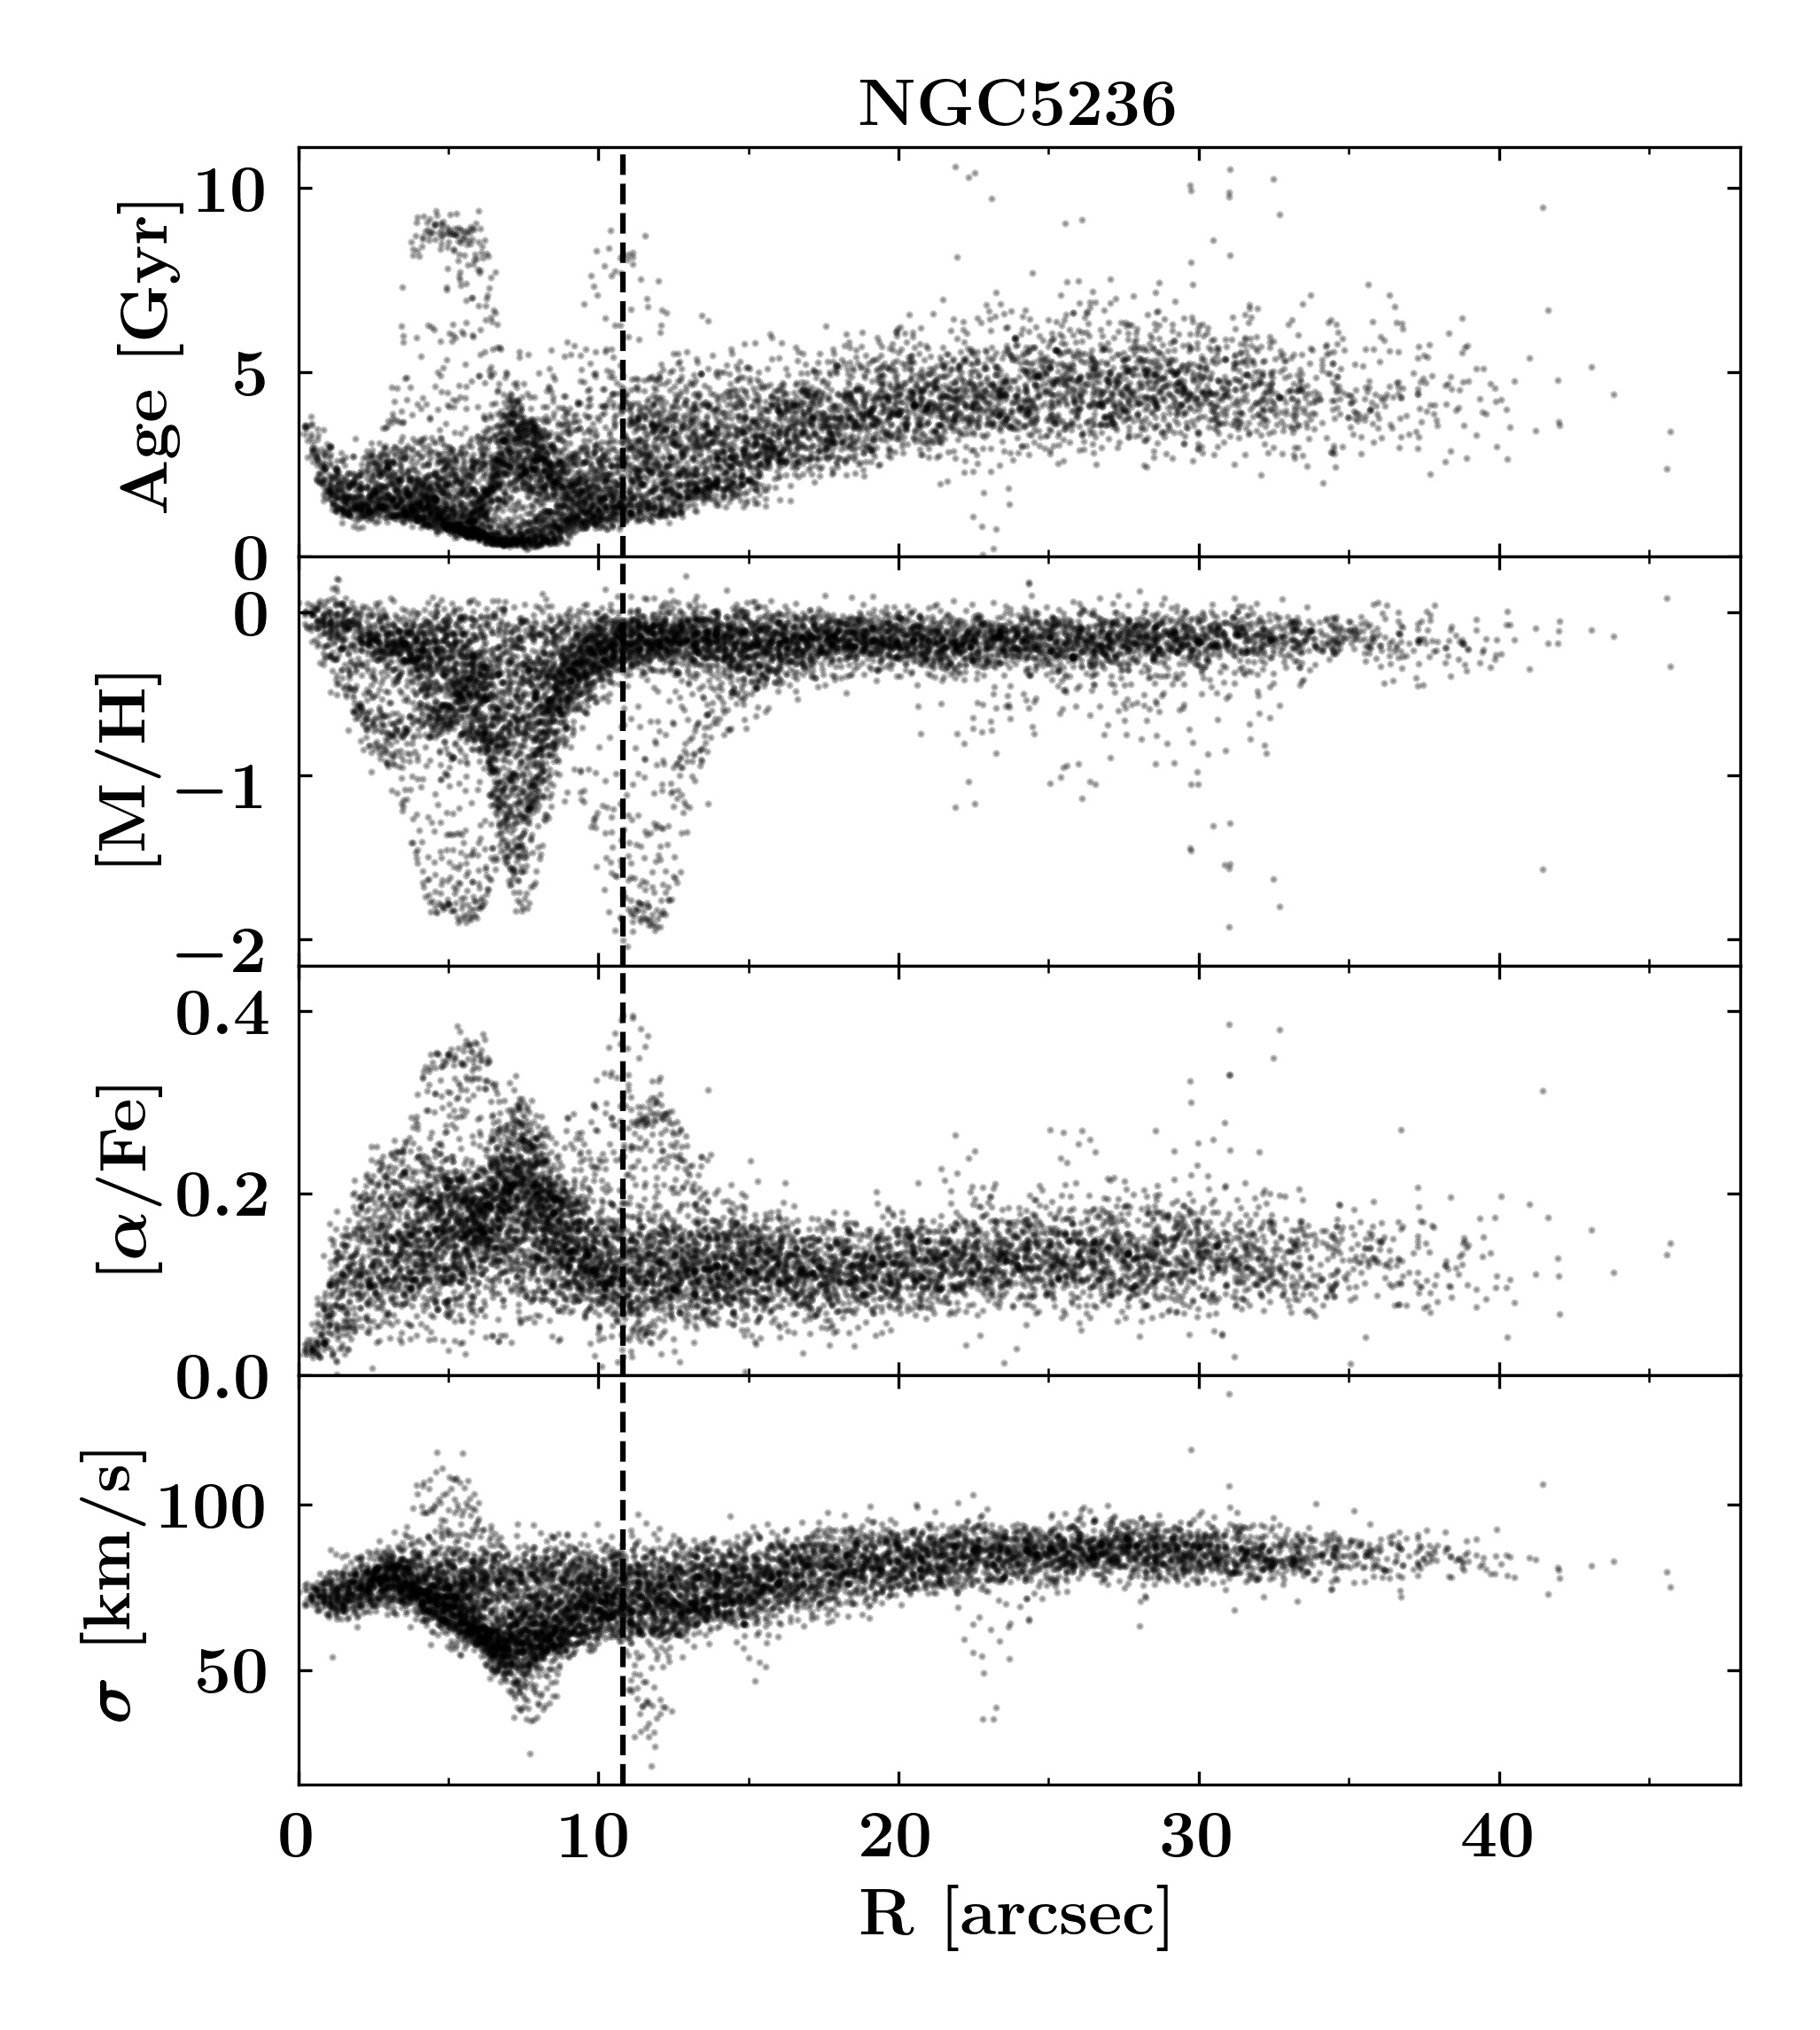
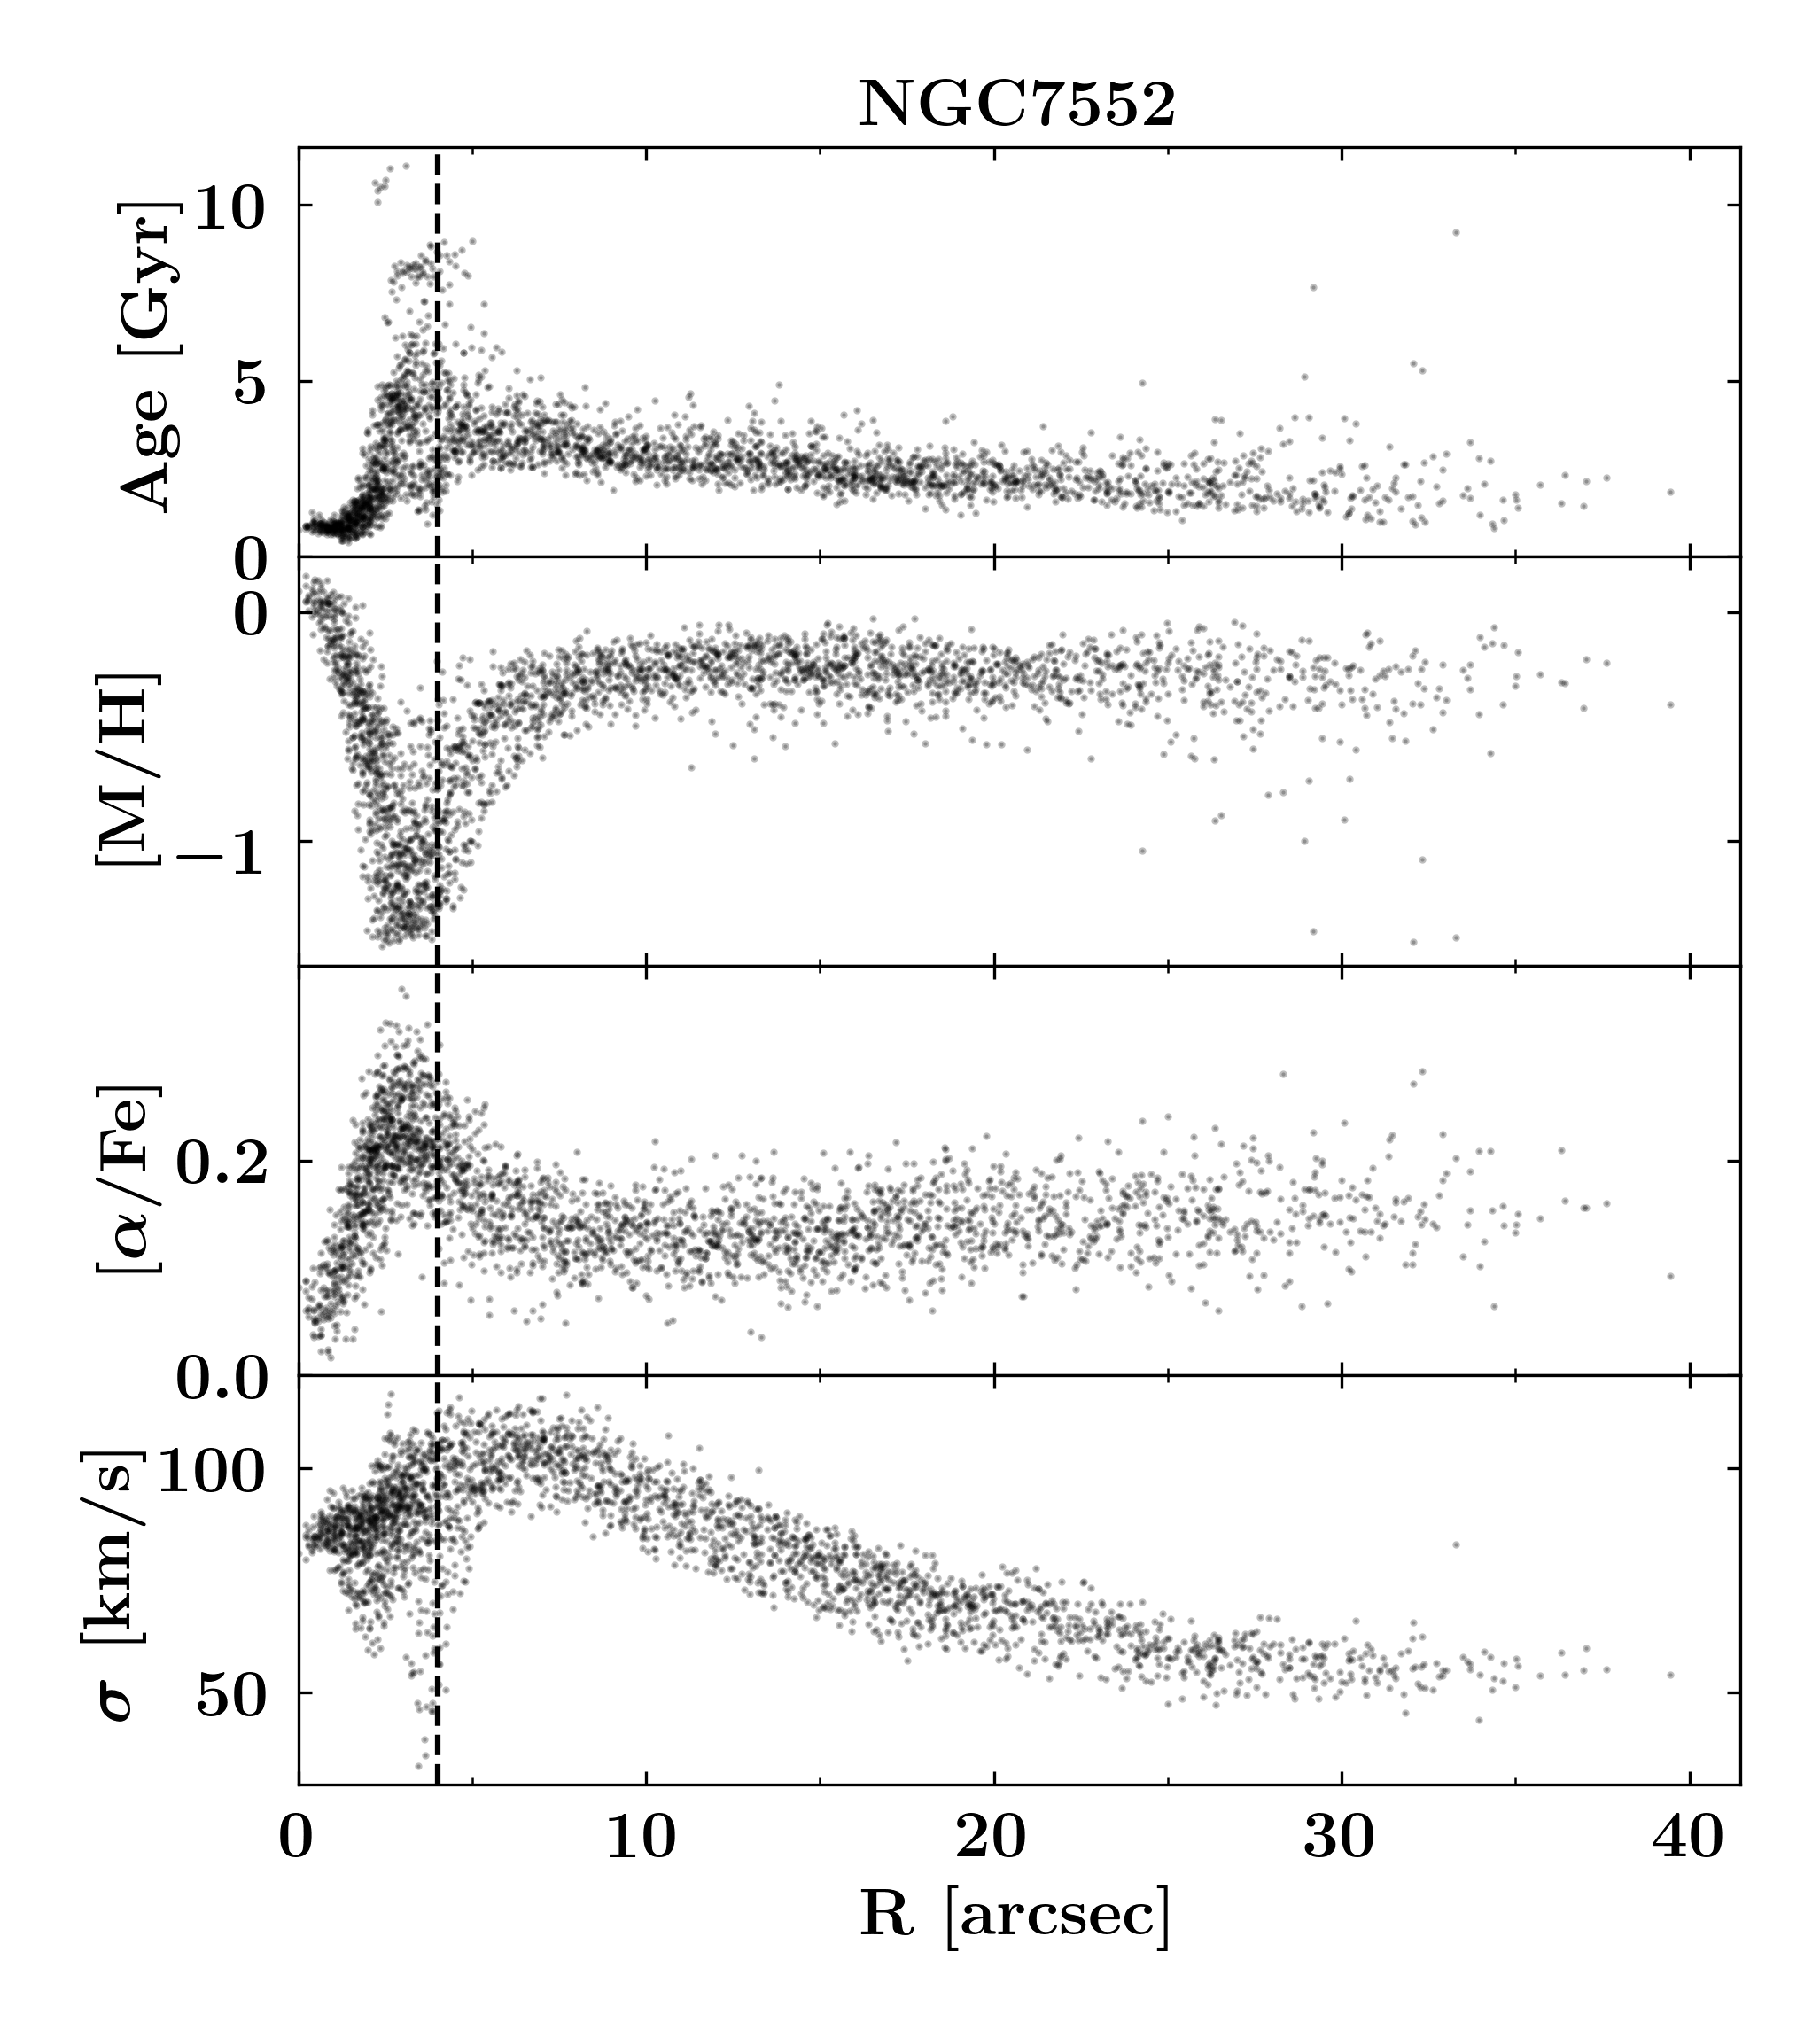
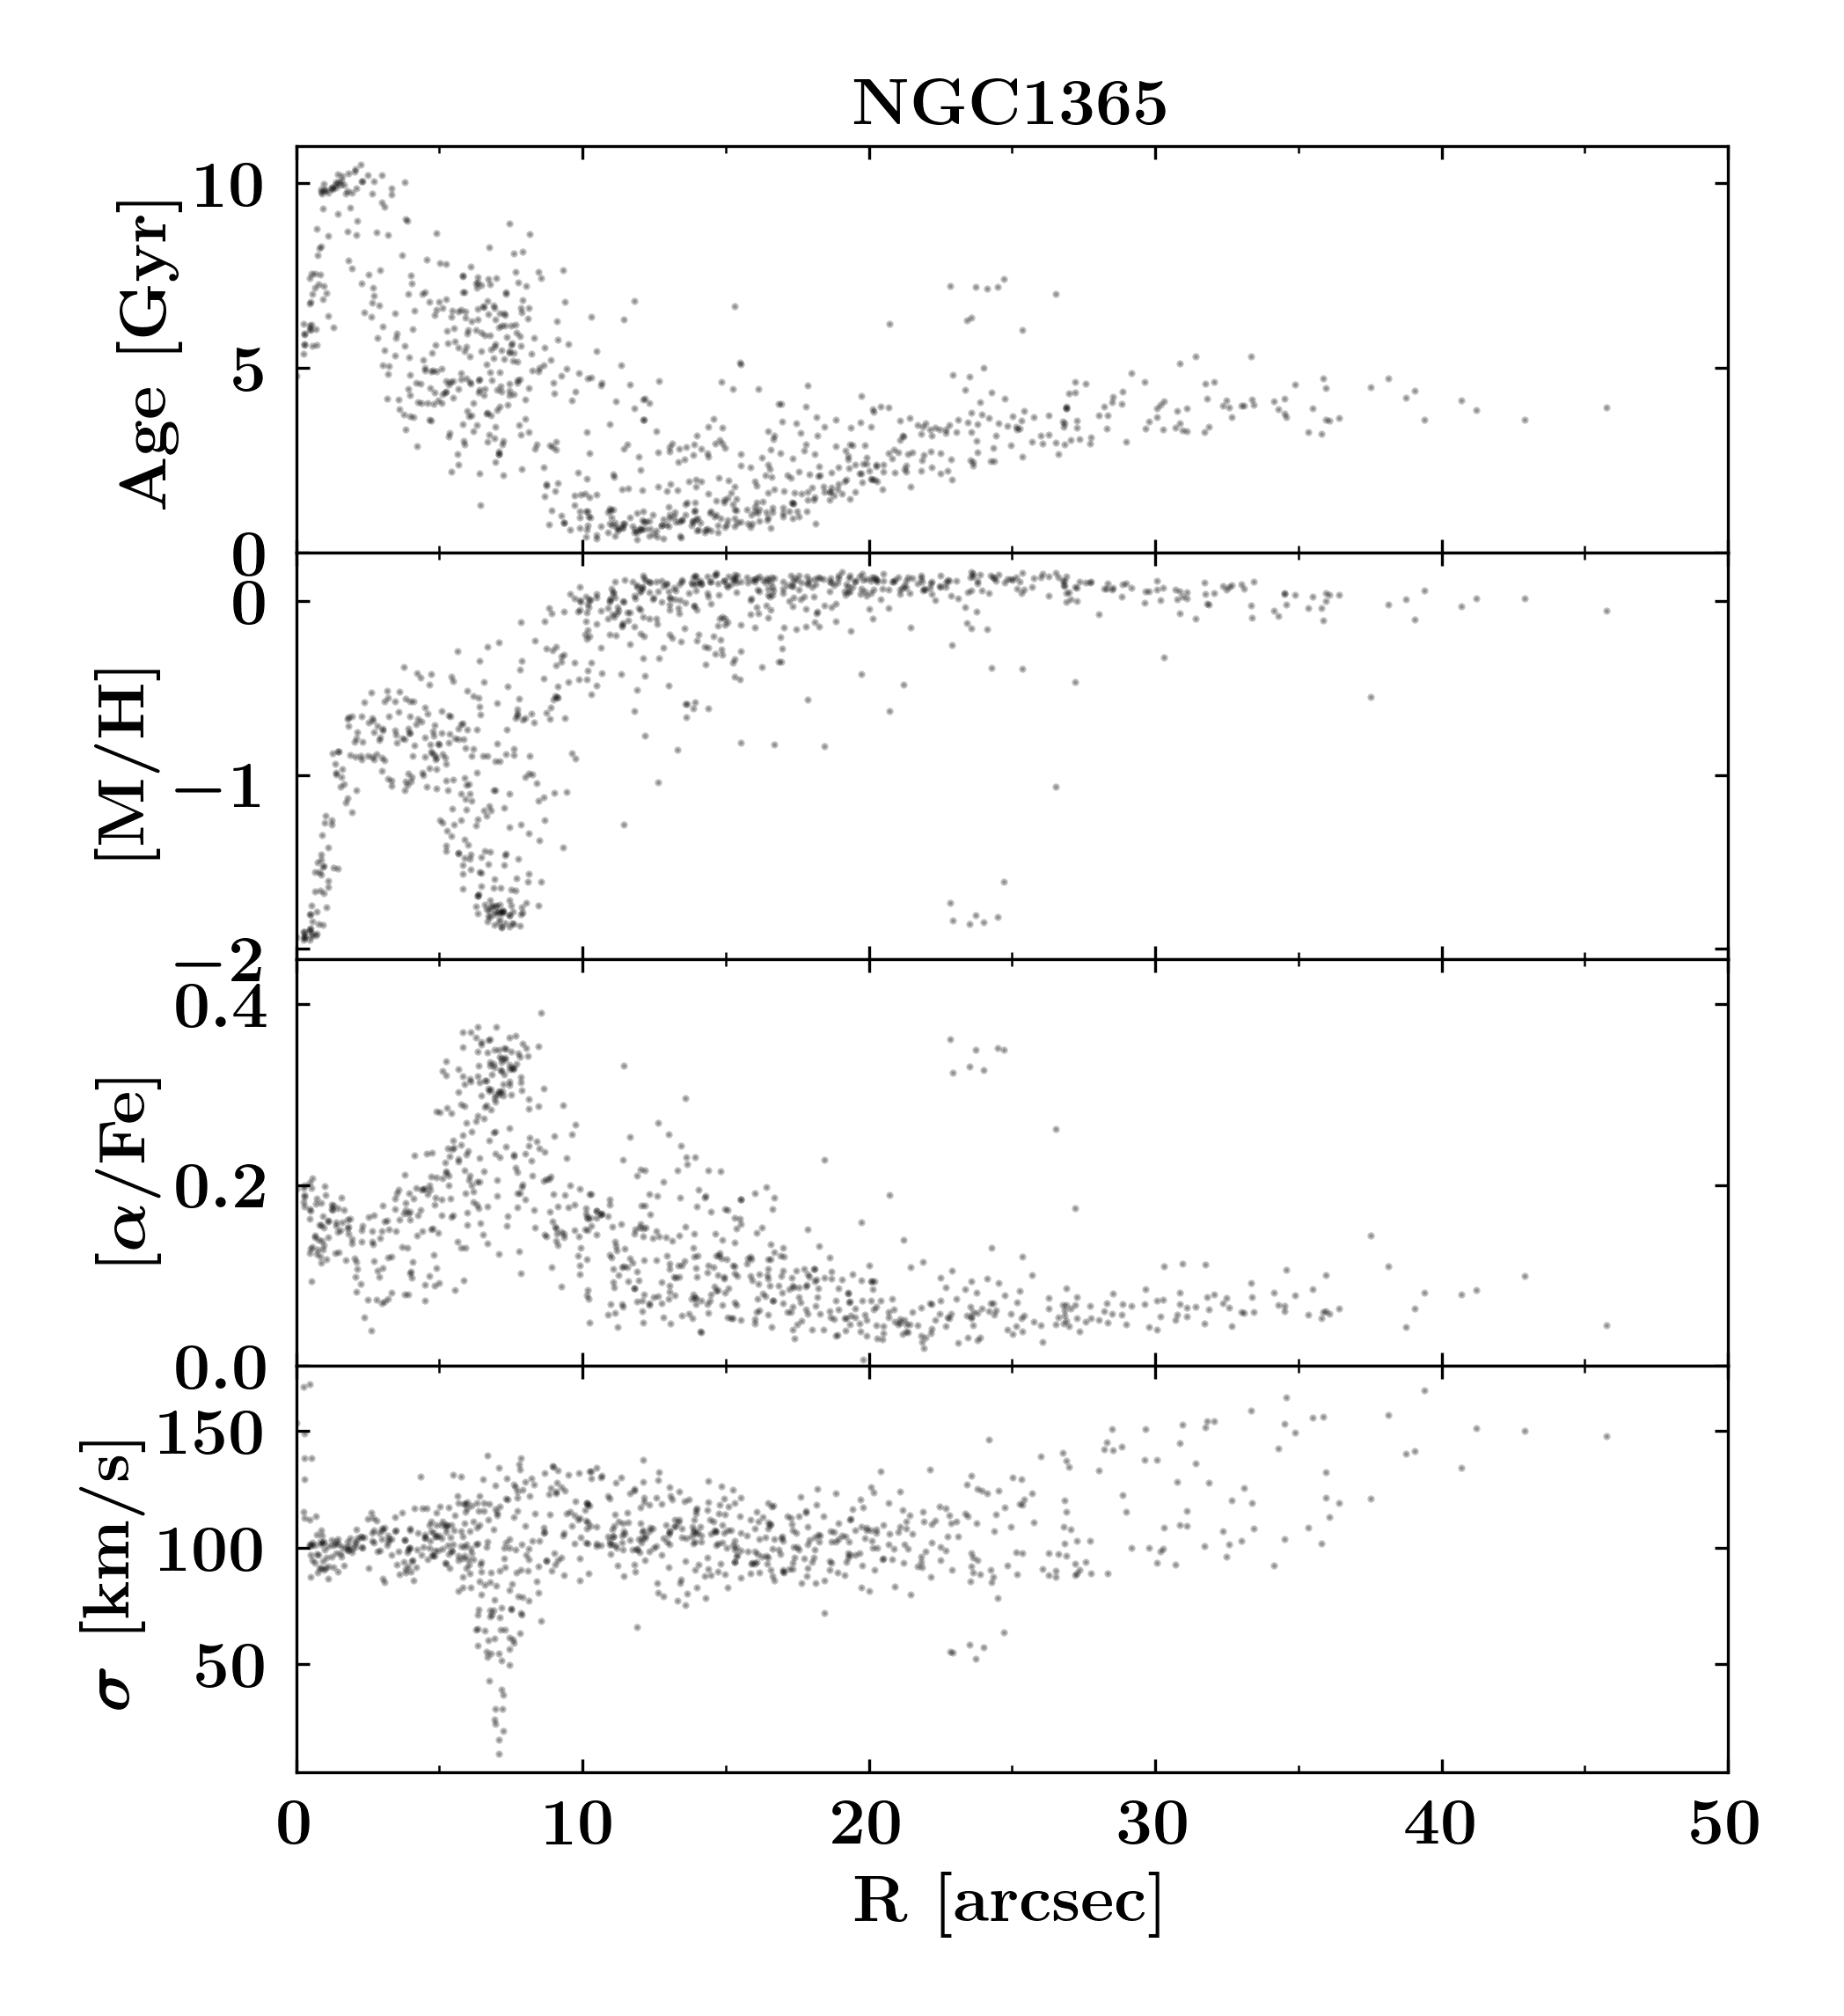
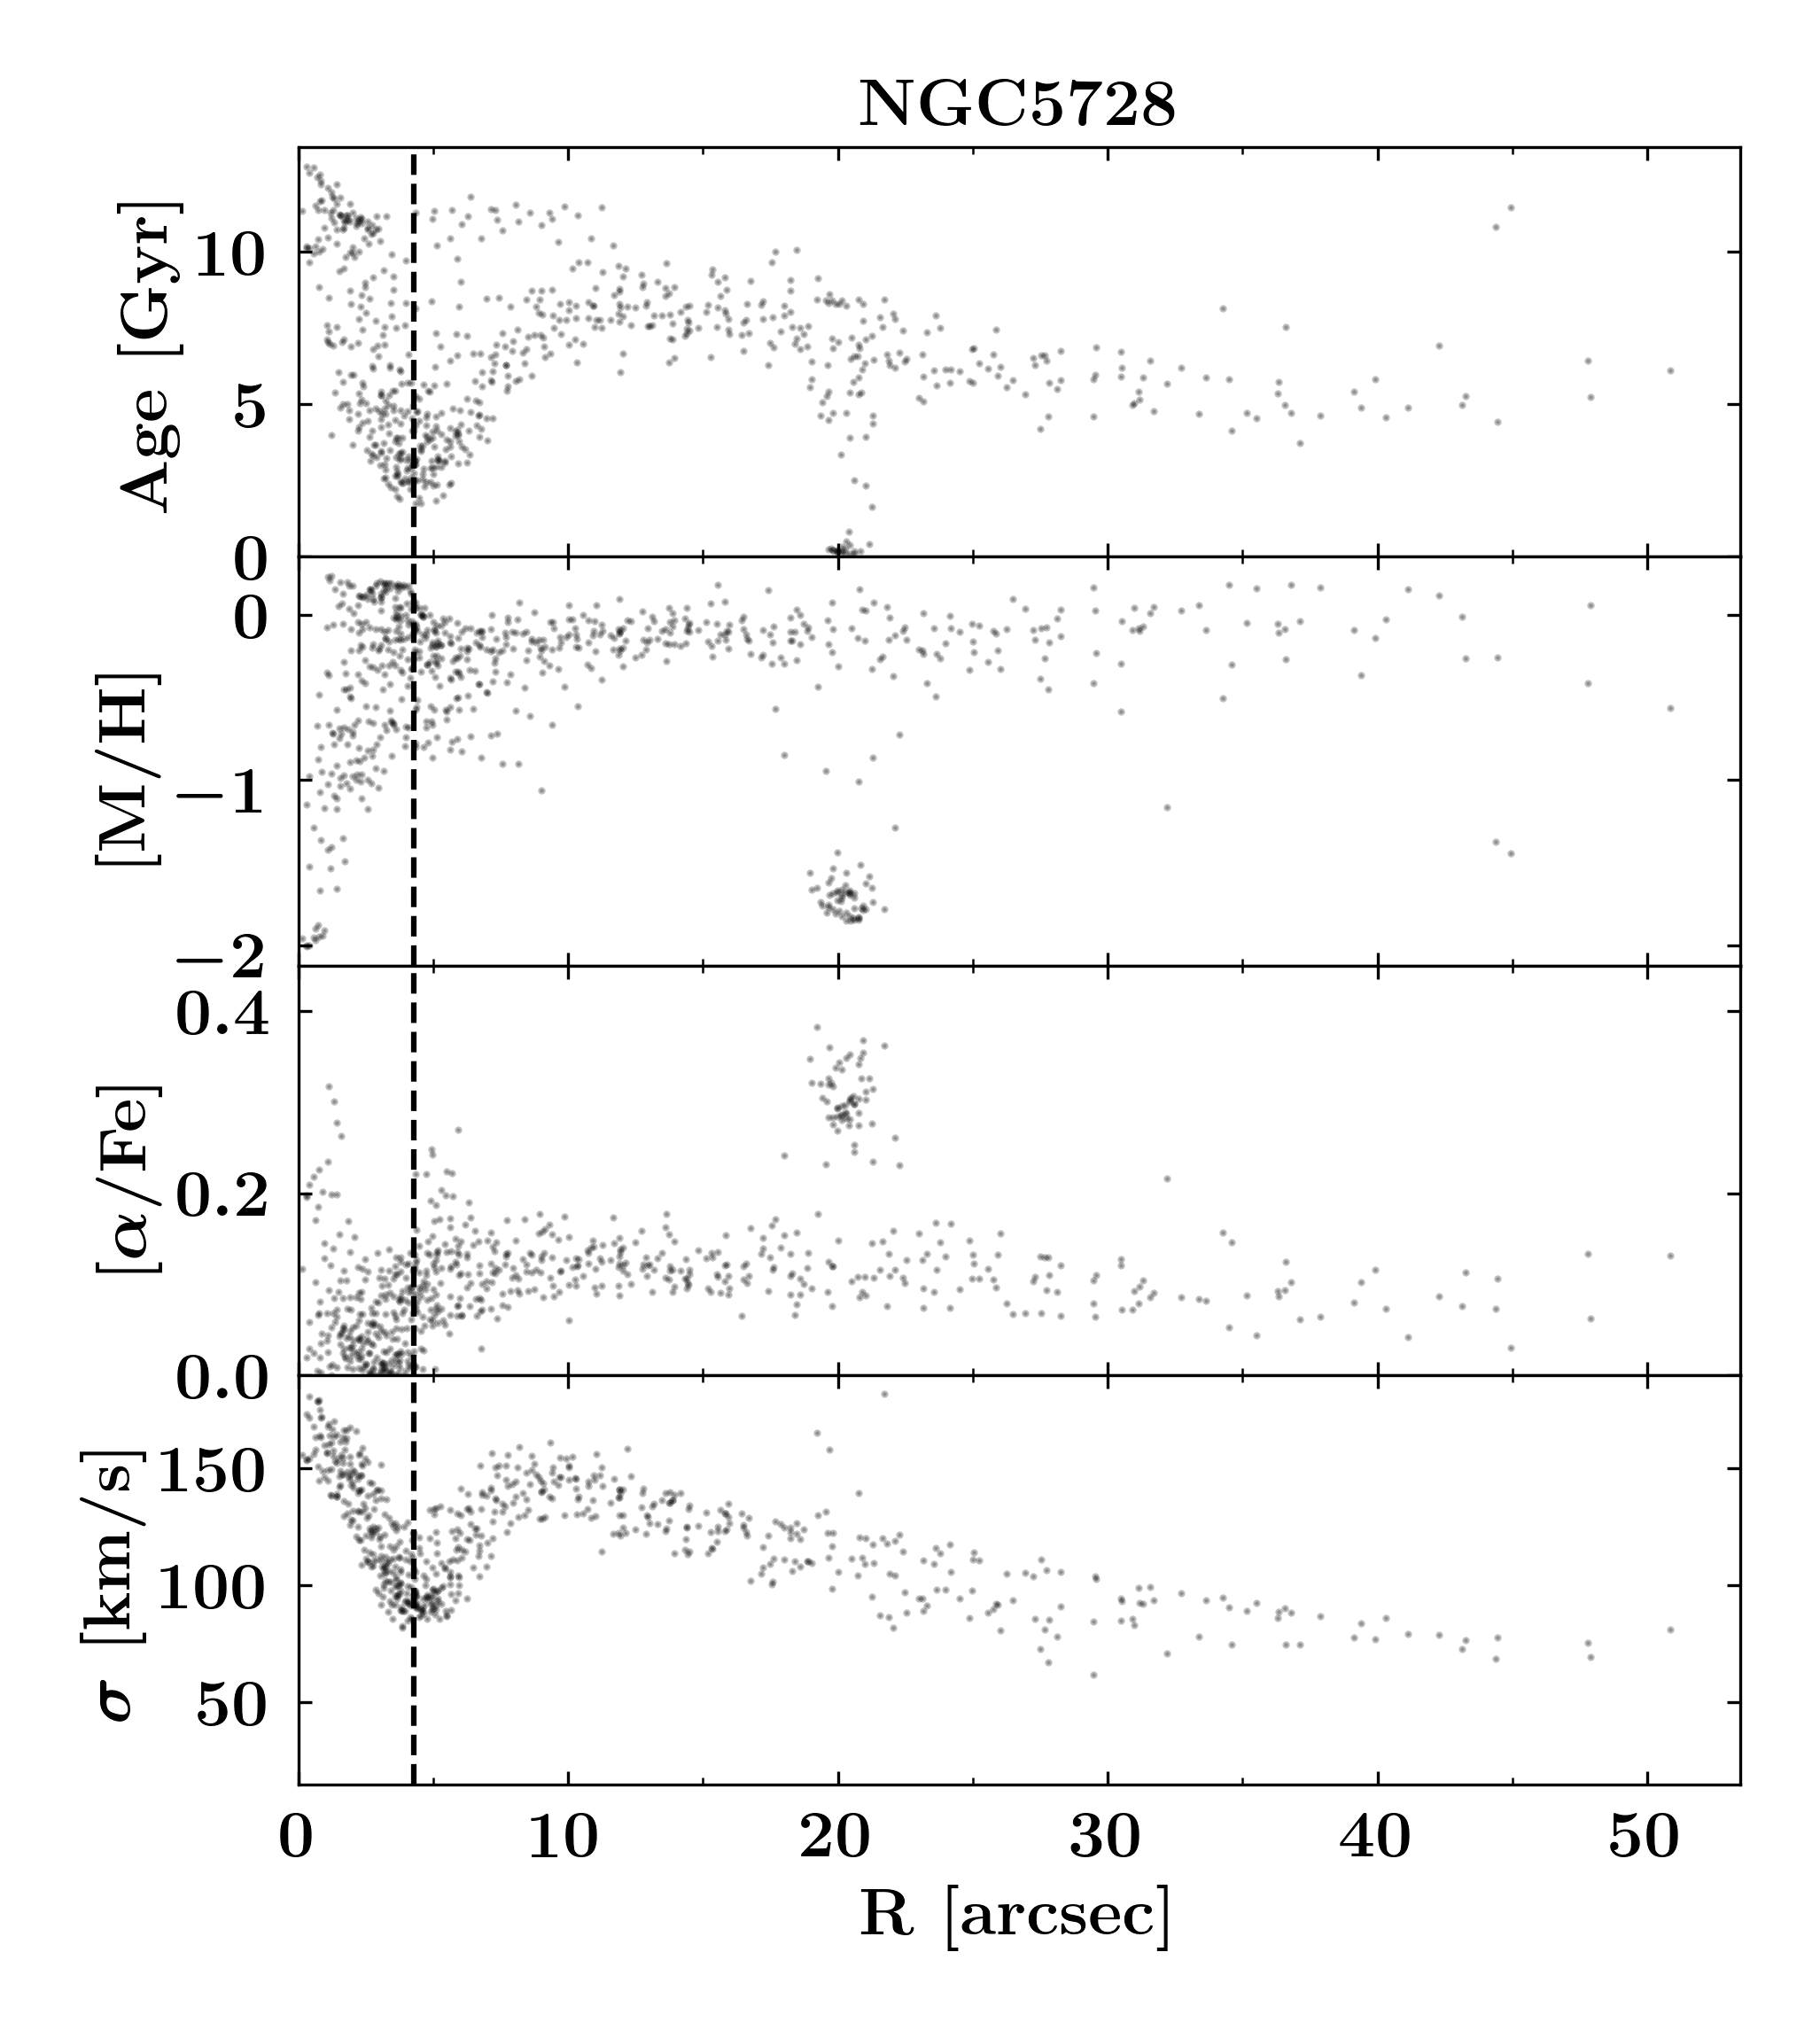
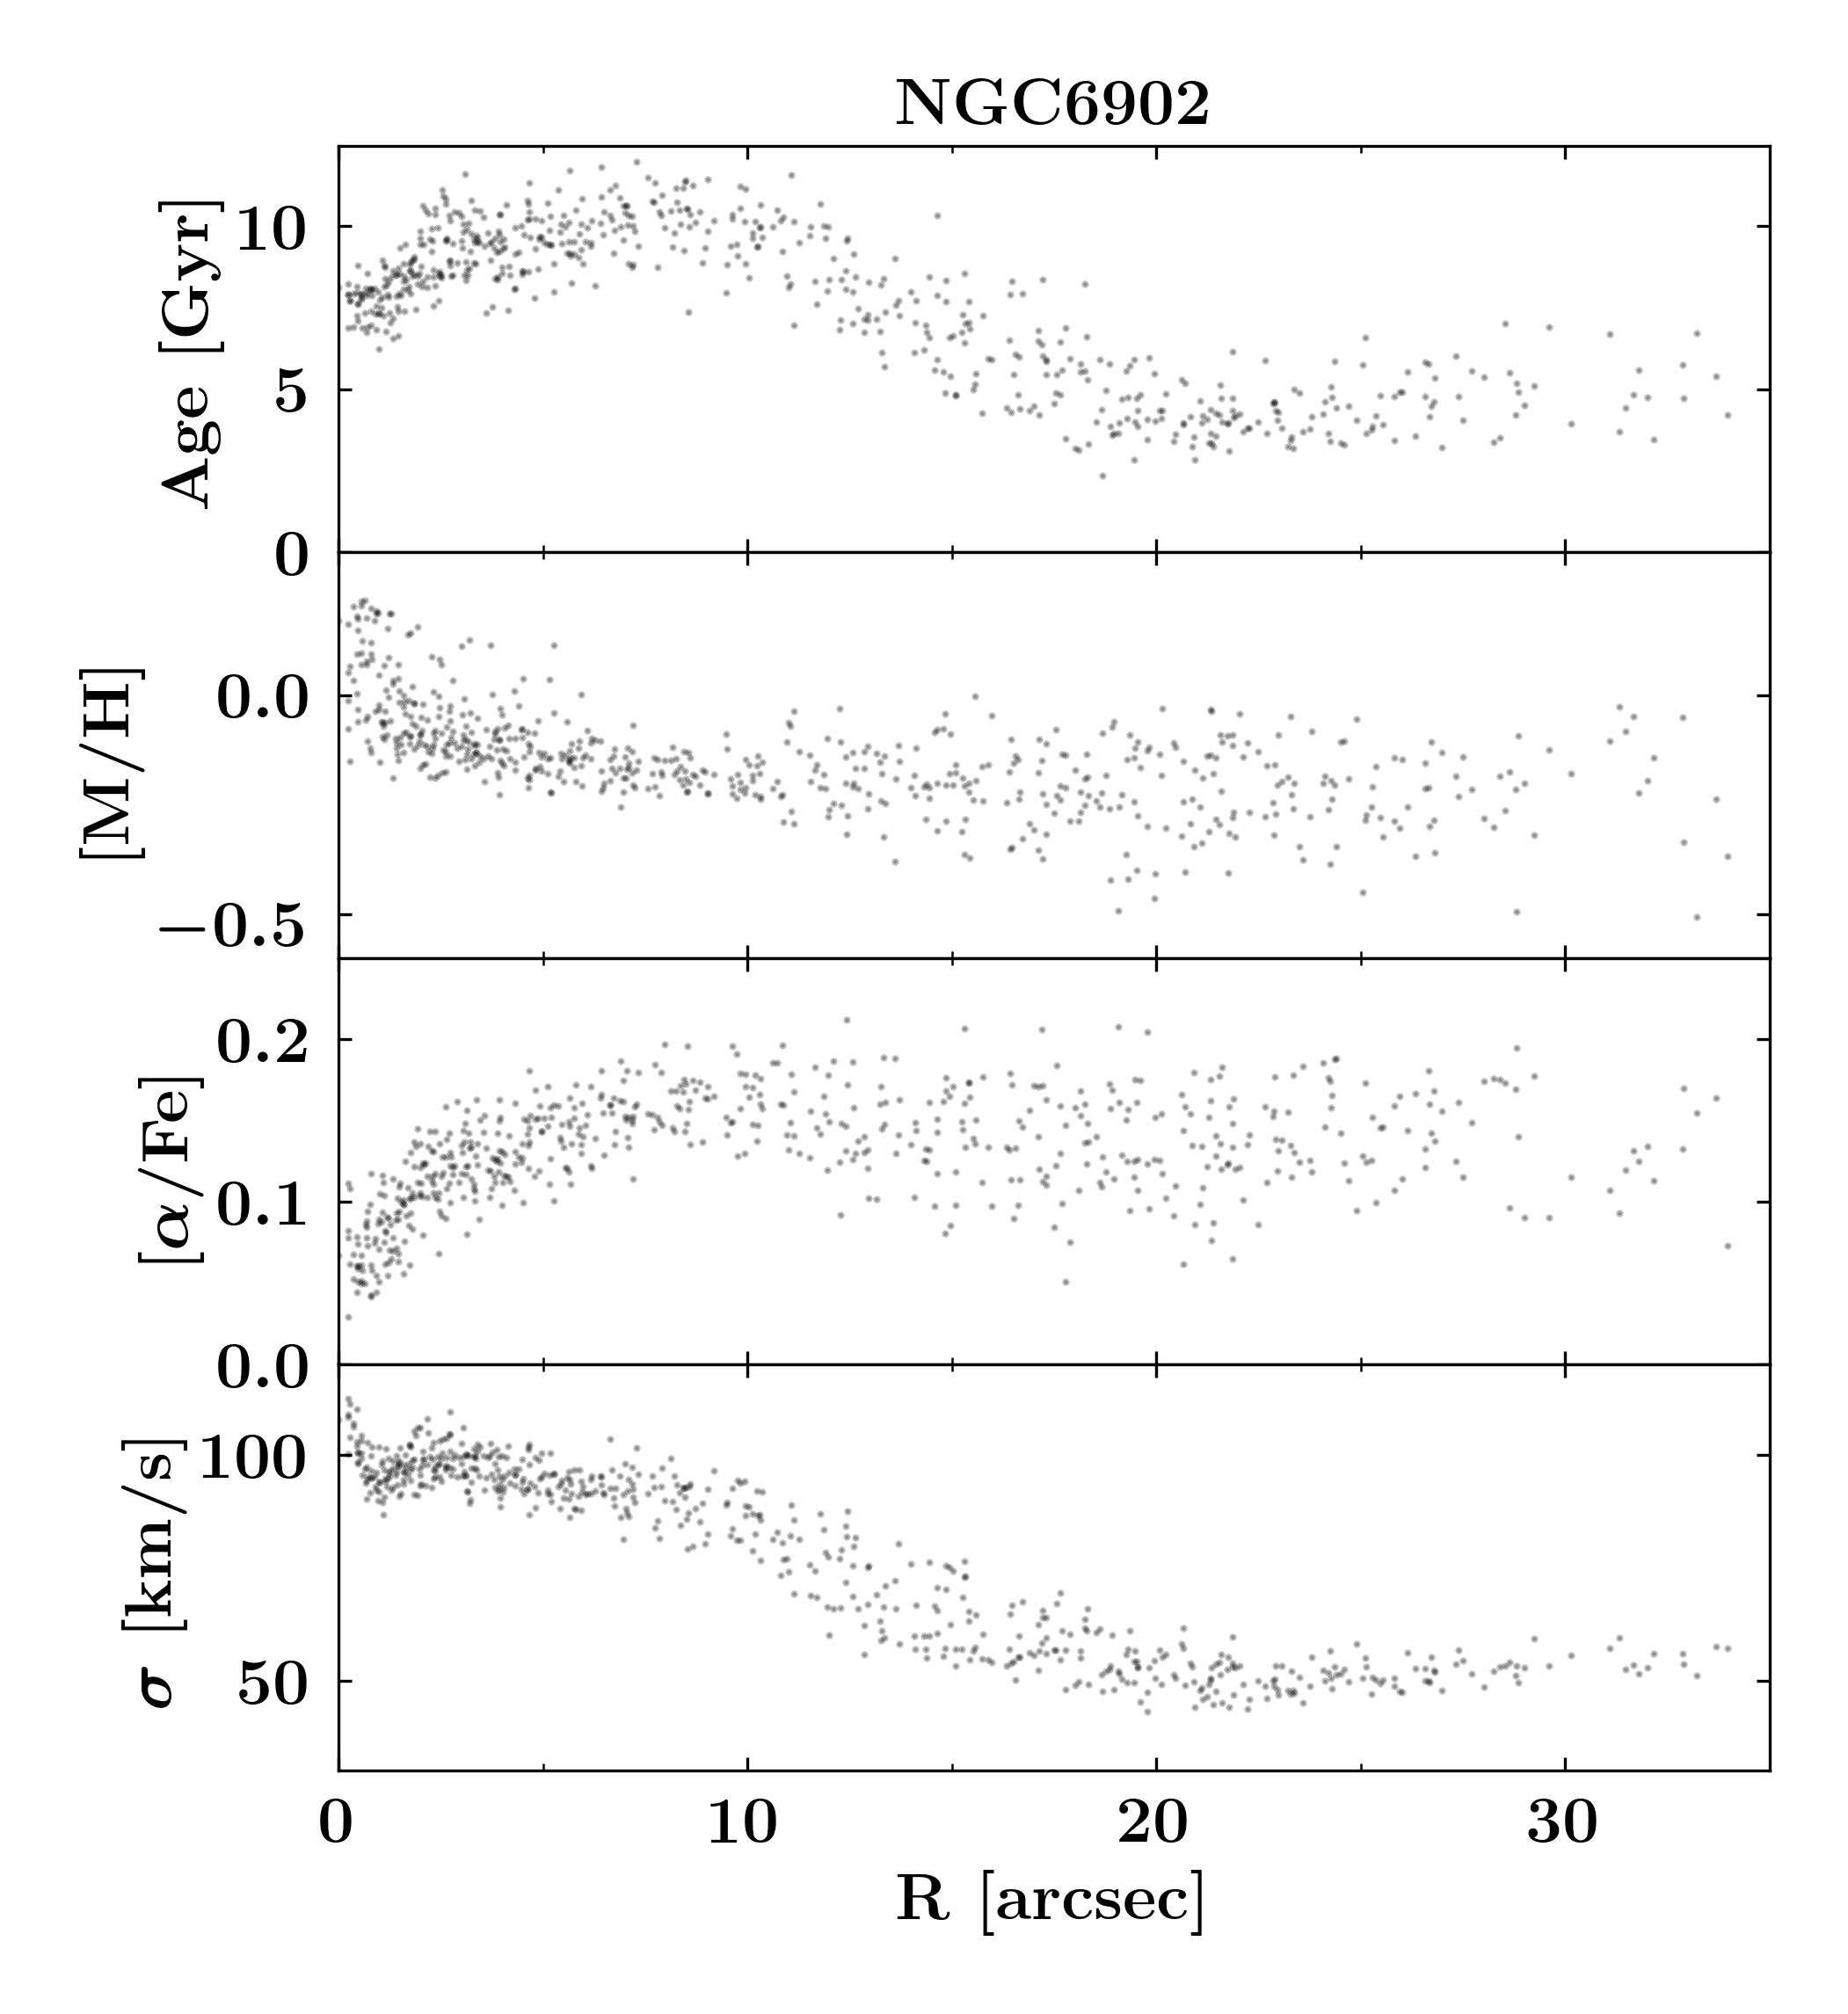
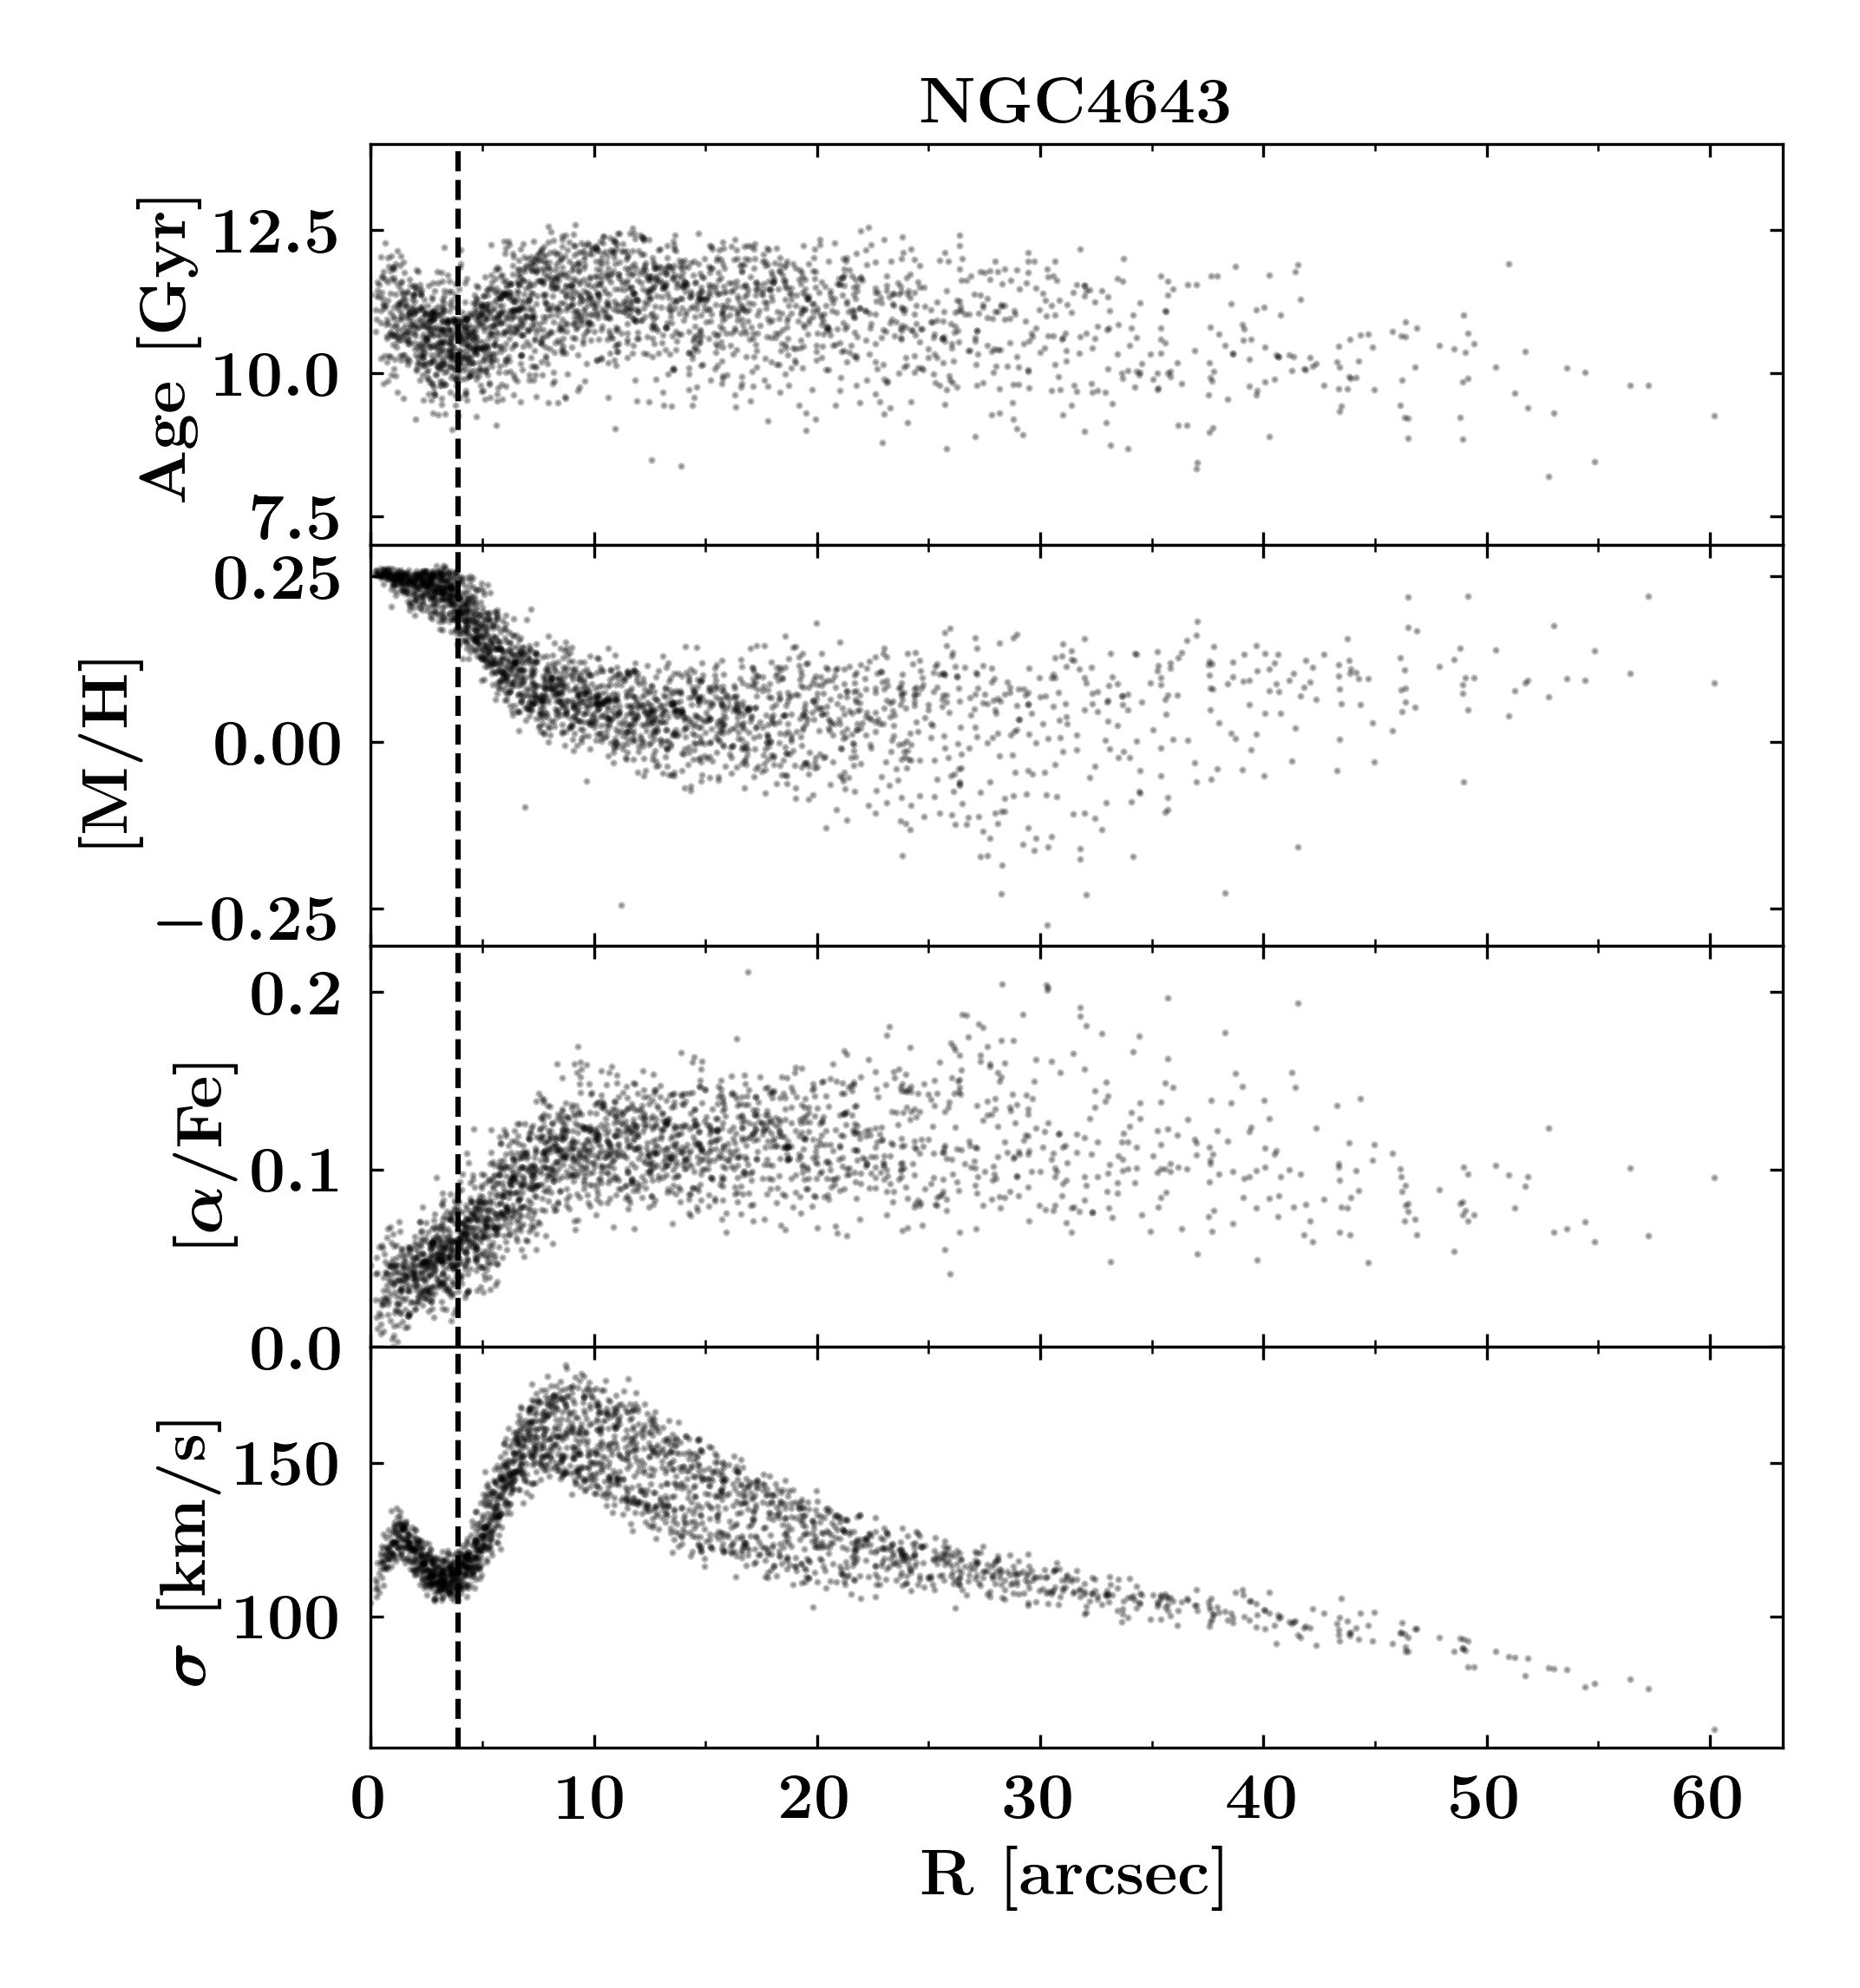
Spatially resolved maps are an indispensable tool to investigate how stellar population properties vary between different structural components of a galaxy. Nevertheless, it can be instructive to reduce those maps to one dimension, in order to emphasise, for instance, the dependency of the population properties on the galactocentric radius. In the right-hand side of Fig. 4 and Appendix C we plot light-weighted stellar ages, metallicities, [/Fe] enhancements, and velocity dispersions as a function of the deprojected galactocentric radius of the respective spatial bin.
All galaxies in the non-star-forming subsample exhibit well-defined radial profiles in the regions of the nuclear discs. More specifically, we find that ages and metallicities are radially decreasing while [/Fe] abundances are increasing with radius. Interestingly, the lowest [/Fe] enhancements are always found in the very centre of the galaxies and almost always reach values of . Outside the nuclear disc the stellar ages increase again, and the kinematic radii coincide with this turn-around point in age. Similarly, metallicities and [/Fe] abundances frequently show changes in their radial profiles close to the kinematic radius, often exhibiting flat profiles outside the nuclear discs. The fact that the slopes of these profiles appear to be constant throughout the nuclear discs, and in most cases to the very centre, supports the idea that nuclear discs are radially continuous components often extending all the way to the centres of the galaxies. Only NGC 1291 and NGC 4371 show more complicated radial profiles, but this is due to the prominent inner bar in NGC 1291 and the high inclination and projection effects in NGC 4371 (see above).
In contrast, galaxies in the star-forming subsample show a more complicated behaviour. The galaxies show distinctive extrema of low ages, low metallicities, and high [/Fe] enhancements, in particular at the outer edge of the nuclear discs, i.e. their kinematic radii. These are again the nuclear rings with distinct stellar populations and high H emission-line fluxes discussed above. These features appear to be a result of ongoing star formation or a present starburst. Thus, the well-defined radial trends found in the non-star-forming subsample might actually be present in all galaxies but could be temporarily outshone by current star formation. In fact, in various galaxies, for instance NGC 1097, the radial profiles inside of the starbursting nuclear ring appear similar to the well-defined gradients observed in galaxies unaffected by star formation. Only NGC 5236 exhibits strongly irregular radial profiles in which extrema of young ages, low metallicities, and increased [/Fe] abundances are not confined to the nuclear ring. Instead, these are widely distributed within the nuclear disc, in line with our findings from the maps of the stellar population content and H emission-line fluxes.
A few galaxies (e.g NGC 1097, NGC 4303, NGC 4984) show abrupt changes of their population content in the very centres of these galaxies. More precisely, these changes appear on radial scales much smaller than that of the nuclear disc, i.e. are confined to the innermost spaxels. We speculate that these changes are connected to AGN activity and we will explore this aspect in a dedicated TIMER study.
5.4 Mean stellar population content in nuclear discs and nuclear rings
The maps and radial profiles presented above indicate that the stellar population content of nuclear discs and nuclear rings are significantly different from the populations detected in their direct surroundings (e.g. the inner part of the main bar). To better quantify these differences, we calculate light-weighted mean ages, metallicities, and [/Fe] abundances in the radial region of the nuclear disc (), nuclear ring (), and outside of these structures (). Figure 5 illustrates the results.
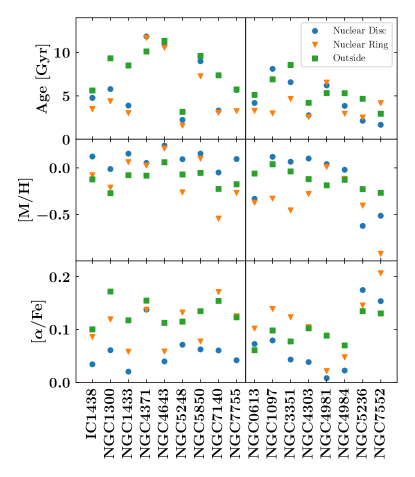
The figure highlights the large range of mean ages covered by nuclear discs, especially when considering the non-star-forming subsample. While some galaxies (e.g. NGC 5248) have young nuclear discs with ages around , other galaxies (e.g. NGC 4371, NGC 4643) have nuclear discs which are dominated by old stellar populations with ages above .
Regardless of the observed absolute mean ages, all nuclear discs in the non-star-forming subsample are younger, more metal-rich, and less [/Fe] enhanced as compared to their immediate surroundings. Nuclear rings, as the outer edges of the nuclear discs, often show slightly younger ages compared to the nuclear discs, as expected from the radial profiles, and intermediate values of metallicities and [/Fe] abundances. Only in three cases (NGC 5248, NGC 7140, and NGC 7755) nuclear rings exhibit lower metallicities and elevated [/Fe] abundances, probably a result of weak star-formation activity. The only galaxy with a deviating behaviour is NGC 4371, but this is a result of projection effects, as discussed above. The same trends are found for the star-forming subsample. In general, nuclear discs are found to be younger, more metal-rich, and less [/Fe] enhanced. Nuclear rings often exhibit low metallicities and elevated [/Fe] abundances. This dichotomy is a result of the ongoing star formation that is concentrated in the nuclear rings but relatively low throughout the nuclear discs (see also Sect. 5.1). In contrast to the non-star-forming subsample, more exceptions are evident, for instance the metal-poor and [/Fe] enriched nuclear discs of NGC 5236 and NGC 7552, and the old nuclear discs in NGC 1097 and NGC 4981. In fact, the mean values substantially depend on where and how violent star formation proceeds in the nuclear rings of these galaxies. Therefore we urge the reader to carefully inspect both maps and profiles of these galaxies in addition to the mean values presented in Fig. 5.
6 Discussion
In this section we put our observational results in the context of secular evolution. In addition, we discuss the connection between nuclear rings and nuclear discs, the coevolution of bars and nuclear discs, as well as the possible rejuvenation of an old nuclear disc in NGC 1097. We further investigate the absence of central spheroids in the TIMER sample in the context of galaxy formation.
6.1 The connection between nuclear rings and nuclear discs
Nuclear discs and nuclear rings are intimately connected through their bar-driven formation histories. Nonetheless, these structures are more or less prominent in different galaxies. Based on our high-resolution observations of stellar population properties, and in the context of H emission-line fluxes, as well as previously derived kinematic maps, we explore similarities and differences between these two components in greater detail. In Fig. 6 we illustrate these similarities and differences by presenting maps of , [/Fe] abundances, and H emission-line fluxes focussed on the spatial region of the nuclear disc. We show the maps of the galaxy NGC 4643 from the non-star-forming subsample and NGC 1097 which is a poster child example of a galaxy with a prominent, starbursting nuclear ring.
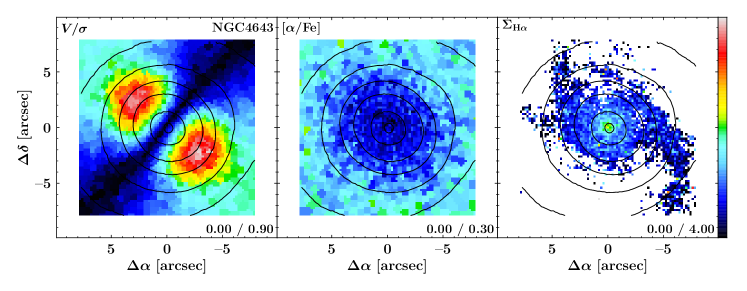
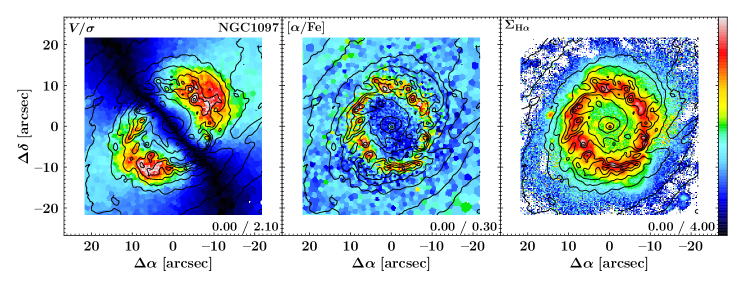
In G20, we have shown that the kinematic signatures of nuclear discs in the TIMER sample are strikingly clear. Nuclear discs are well aligned with the main disc, show stellar kinematics with a strong rotational support and low velocity dispersion, and thus appear as kinematically distinct components in maps. Based on such maps, no specific signatures of nuclear rings as a separate stellar component are evident, and thus the two structures appear indistinguishable regardless of whether the galaxy is part of the star-forming or a non-star-forming subsample. This is further highlighted in the left-hand panels of Fig. 6 where we show maps of for two TIMER galaxies, one with and the other without a star-forming nuclear ring.
As shown above, nuclear discs are also spatially well-defined features in maps of mean stellar population properties, show clear radial gradients in their stellar populations, and extend to the very centre of their host galaxy. However, the stellar population properties at the outer edge of the nuclear discs depend significantly on whether a star-forming nuclear ring is present or not (see central and right-hand panels of Fig. 6). In the cases of non-star-forming nuclear regions, one cannot distinguish nuclear rings and nuclear discs. The outer edges of these nuclear discs are their youngest, most metal-poor, and highest [/Fe] region, which only sometimes show faint H emission. Nevertheless, these features are smoothly connected to the radial gradients of the nuclear disc. In contrast, in the star-forming subsample nuclear rings are much more significantly young, metal-poor, and show very high [/Fe] abundances, features that are also clearly visible as discontinuities in the radial profiles. While some of these findings might be spurious due to the fact that young stellar populations () are not included in the employed set of SSP models, it still illustrates how starbursting nuclear rings are distinguished in their measured mean population properties.
These observations suggest that nuclear rings and nuclear discs should not be referred to as two separate physical components, nor should their denomination be used interchangeably. Instead, nuclear rings are simply the outermost part of nuclear discs. In galaxies with non-star-forming nuclear regions, the nuclear ring represents the youngest and outermost part of the nuclear disc. In the galaxies of the star-forming subsample however, the nuclear ring merely highlights the region in which the majority of the gas is located and efficiently forms stars. As above, this region is the outermost part of the nuclear disc.
6.2 Nuclear discs in the global context of secular evolution
A number of studies has established a theoretical framework for the formation of nuclear structures. If nuclear rings and discs are indeed built by secular, bar-driven processes, this provides theoretical expectations on the stellar kinematics and population properties of these structures. While in G20 we have recently shown that the kinematics of nuclear discs, in particular their high rotational velocities and low velocity dispersions, are consistent with the picture of bar-driven secular evolution, here we further consider their stellar population properties.
To some extent, secular evolution in disc galaxies first requires a sequential process: a bar can only arise after the main stellar disc becomes dynamically unstable to bar formation, while the formation of a nuclear disc fundamentally depends on the presence of such a bar. More precisely, stars in the nuclear disc/ring form in-situ from gas that has been funnelled to the centre by the bar (see e.g. Athanassoula 1992a, b; Piner et al. 1995; but also Kormendy & Kennicutt 2004 for a review). Following this sequential process, one naturally expects that nuclear discs are on average younger compared to the other galaxy components. The finding that this holds for the mean stellar population properties, as observed in Sect. 5.2, is consistent with this picture. More precisely, the bar is efficient in transporting gas from the main galaxy disc to its centre. However, at least at low redshifts, there is typically no star formation observed along the bar, as strong shear forces suppress the collapse of gas clouds (see e.g. Reynaud & Downes, 1998; Emsellem et al., 2015; Neumann et al., 2019). Instead, the gas aggregates in a small volume in the centres of the galaxies, which typically constitutes a nuclear ring (i.e. the outer edge of the nuclear disc). Star formation progresses in this nuclear ring and, depending on the amount of available gas, can be very intense. While star formation might also proceed in other parts of the galaxy, in particular the main disc, at least in some cases the star-formation density is higher in the nuclear rings. This would result in a nuclear ring whose mean ages appear younger compared to the main disc. Even if star-formation proceeds at similar rates in the nuclear ring and the main disc, one expects at least similar ages in these structures. In fact, similar ages in the nuclear ring and main disc are, for instance, observed in IC 1438. Both at the radius of the nuclear ring () and at the largest radii in the field of view (e.g. ) stellar ages of approximately are evident. However, we note that the present TIMER observations sample the main discs of the galaxies only partially. In fact, the outer parts of the main disc might still appear younger than the nuclear discs.
The mean ages of the nuclear discs and rings vary significantly across different galaxies. In fact, the nuclear rings of some nuclear discs are as young as , while other nuclear discs are older than in their entire radial extent. This is not surprising as the initial formation time of the nuclear disc depends on various factors, such as the availability of gas, and is further limited by that of the bar itself and, thus, the cosmic epoch at which the main galaxy disc first settled. In fact, according to this scenario, the oldest nuclear discs indicate an early formation of the bar.
The increased metallicities detected throughout all non-star-forming nuclear discs are also in agreement with our present understanding of bar-driven secular evolution. As the nuclear disc is built from gas brought there from other parts of the galaxy, in particular the main disc, this gas should typically be as metal-enriched as the gas in these other galaxy components. With the formation of the nuclear disc and subsequent generations of stars, the metallicity in this central component should continuously increase. This is further supported by the fact that nuclear discs are located in the centres of their host galaxies where the deep potential well confines the produced metals. This result also corroborates previous numerical studies. For instance, Cole et al. (2014) finds increased values of [Fe/H] in nuclear discs compared to the surrounding bar, as a result of continuing star formation in the nuclear discs.
We have also, for the first time, derived [/Fe] element abundances in spatially resolved nuclear discs. We find that all nuclear discs in the non-star-forming subsample have low [/Fe] enhancements, indicating that their build-up takes a long time and is indeed a slow and continuous process, just as expected in the context of bar-driven secular evolution. In fact, if nuclear discs were built by more violent processes such as mergers (Davies et al., 2007; Chapon et al., 2013), one would expect a singular, rapid period of star formation that results in more elevated values of [/Fe], similar to those found in elliptical galaxies. In addition, the entire nuclear disc would be formed at the same time, either through star formation or the violent re-distribution of existing stars. In both cases, one would expect to find flat age profiles, in contrast to the observations presented here (see Breda et al., 2020, for a detailed account of radial age profiles in galaxy bulges).
The extremely low metallicities and increased [/Fe] abundances detected in the nuclear rings of the star-forming subsample could result from uncertainties in the measurement (see Sect. 3). However, such low-metallicity populations in the nuclear rings could also be consistent with the bar-driven formation scenario, if external, low metallicity gas is accreted onto the galaxy. Such low metallicity gas could originate from the circum-galactic-medium of the galaxy, or encounters with dwarf galaxies. If the subsequent bar-driven gas inflow to the nuclear ring proceeds rapidly enough to avoid the enrichment of the gas in the main galaxy disc, a nuclear ring showing very low metallicities can be formed. The elevated [/Fe] enhancements in the nuclear rings are probably just a transient signatures of the strong, ongoing star formation from low metallicity gas and not a persistent property of the underlying stellar nuclear disc, in particular since all nuclear discs in the non-star-forming subsample show low [/Fe] abundances.
6.3 Do nuclear discs and bars grow simultaneously?
The bar-driven transport of gas to the centre of a galaxy is a rather well-understood process. In the galaxy centre the gas is usually deposited in a nuclear ring with a well-defined inner and outer edge, although it remains unclear what physical process determines the width of these nuclear rings. In fact, the presence of gaseous nuclear discs without more prominent gaseous nuclear rings is uncommon. However, the results above suggest that often stellar nuclear discs extend from the radial region of the nuclear ring all the way to the very centre of the galaxy. These extended nuclear discs are not only detected in the maps of stellar population properties presented here, but also found based on stellar kinematics and photometric studies (see G20, and references therein). To date, it remains unclear if and how initially gaseous nuclear rings with well-defined inner and outer edges are transformed into the observed stellar nuclear discs that extend to the very centres of the galaxies.
It is also not clear what physical process determines the radius of the gaseous nuclear rings. Studies suggest that the sizes of nuclear rings are related to bar resonances (see e.g. Piner et al., 1995), determined by viscous shear forces (Sormani et al., 2018; Sormani & Li, 2020), or simply set by the residual angular momentum of the inflowing gas (Kim et al., 2012; Seo et al., 2019). In Sect. 5.3 we have shown that the kinematic radii are a good tracer of the radius of nuclear discs and, thus, their nuclear rings. In an accompanying study, G20 show that these kinematic radii correlate well with the bar length and other properties, corroborating the scenario in which nuclear discs are built by bars.
Interestingly, many studies argue that bars grow longer and stronger as they evolve (see e.g. Athanassoula 2003; Martinez-Valpuesta et al. 2006; Gadotti 2011, but also de Lorenzo-Cáceres et al. 2020 for inner bars). If indeed bars grow longer with time and the radii of nuclear rings depend in some way on the bar length, one expects that bars and nuclear rings evolve simultaneously. Following the mechanism suggested by Seo et al. (2019), as the bar grows longer it triggers the inflow of gas from larger radii in the main galaxy disc. This gas has a larger residual angular momentum and, thus, settles at larger radii in the galaxy centre resulting in a larger nuclear ring. However, the residual angular momentum of the inflowing gas might not only depend on the length of bar, but also on various other bar properties, for instance the axial ratio of the bar. Therefore, one might question a direct causal connection between the bar length and the radius of the gaseous nuclear ring. Other studies argue that the size of the nuclear ring is not linked to the residual angular momentum of the gas, but instead limited by the radial extent of the bar orbits, a parameter that fundamentally depends on the axisymmetric central mass concentration and the bar pattern speed (see e.g. Athanassoula, 1992a, b; Fragkoudi et al., 2017). In fact, the bar pattern speed typically decreases, as bars are transferring angular momentum to the disc and halo, while simultaneously increasing the central mass concentration through gas inflow, thus allowing more extended orbits and the nuclear ring to grow with time. In this framework, a correlation between bar length and nuclear ring radius might naturally arise as well, without requiring a direct causal connection between nuclear ring radius and bar length. While it remains unclear which physical mechanism determines the size of the nuclear rings, both mechanisms hint towards a scenario in which nuclear rings continuously increase their radius as bars evolve.
In this framework, star formation only needs to proceed in the gaseous nuclear ring in order to produce a continuous stellar nuclear disc. As the radius of the location of the nuclear ring increases, a star-forming nuclear ring is located at a given point in time at a range of radii, thus producing stars on near-circular orbits at all such radii, or, in other words, a disc. In this way a continuous stellar nuclear disc can be formed without the necessity of forming a gaseous nuclear disc.
This possible scenario translates into predictions that are in good agreement with the nuclear discs found in the TIMER sample. While H emission is predominantly detected in nuclear rings at the outer edge of the nuclear discs, the nuclear discs themselves are continuous and extend to the centres of the galaxies. It is also in agreement with the fact that nuclear discs are rapidly rotating and exhibit low velocity dispersions. Similarly, it predicts that nuclear discs are relatively old in the centre and become increasingly younger towards their outer edge. This behaviour is evident in the radial gradients presented in Sect. 5.3. We note that the negative gradients in [M/H] do not necessarily contradict this picture. In fact, old stars are not always less metal-enriched than young stars, in particular since metallicities can increase very rapidly in star-forming systems. In addition, the more the gas is bound in the potential well of the galaxy, the more difficult it is for feedback processes to expel this gas. Therefore, it is expected that in most evolved systems, regardless of their formation history, the metallicity increases towards the centre.
This formation mechanism still predicts the presence of an inner edge of the stellar nuclear disc, in particular at the radius at which the first gaseous nuclear ring formed. Such an inner edge is not obvious from the observations presented here. While a few galaxies show systematically different population properties in their very centre, these features might well be caused by contamination of the stellar continuum from an AGN. In addition, such an inner edge might be well beyond the resolution limit of our MUSE observations which is typically around or less.
Seo et al. (2019) suggest the same mechanism for the formation of nuclear discs, based on a numerical study. They perform simulations of individual Milky Way-like galaxies () with varying gas fractions (between ) and velocity anisotropy parameters. Depending on the simulation set-up, they find that the initial nuclear ring is very small (down to ) and subsequently grows as the bar grows longer and funnels in gas from larger radii. Gas located in preceding nuclear rings is quickly consumed by star formation. In this way an increase in radius of the nuclear ring of up to a factor of is found, which matches the typical sizes of the nuclear discs we find in TIMER.
The proposed mechanism of nuclear disc formation is based on the assumption that gas and star formation are predominantly located in the nuclear ring. While this is in agreement with the observational appearance of nuclear discs and nuclear rings, the presence of gas within the nuclear disc itself is not surprising and does not contradict the above picture. Star formation in the nuclear rings is often very strong and thus it is expected that stellar feedback significantly affects the gas. More precisely, a fraction of the gas should be expelled from within the nuclear ring to both larger and smaller radii, a process studied in detail for NGC 3351 by Leaman et al. (2019). Therefore, the presence of gas and continuing star formation within the nuclear disc is expected, although in small amounts as compared to the nuclear ring. This further supports the continuing enrichment of the nuclear disc with metals, as evident in the metallicity maps. In addition, this also explains why there is no sharp, step-like transition between the stellar populations of the nuclear discs and the regions outside. Instead a gradual change in stellar populations is observed, e.g. the typical V-shape in age, that might result from the contamination of these regions by gas expelled from the star-forming nuclear ring.
Our observational results in combination with the current theoretical framework of bar evolution hint towards an inside-out formation of nuclear discs through a series of star-forming nuclear rings. Nonetheless, various crucial questions related to their bar-driven formation remain unanswered, in particular which physical processes determine the size and the width of nuclear rings. Further studies are needed to answer these questions, especially numerical models of nuclear disc formation in a cosmological context. These studies will shed light on alternative scenarios (e.g., formation from a gaseous disc) that will have to reproduce the radial gradients of stellar age, metallicities, and [/Fe] abundances reported in this study.
6.4 The absence of kinematically hot spheroids
In Sect. 5.3 we find well-defined radial gradients in the stellar population properties of nuclear discs. Above we argue that these gradients, in particular the negative gradient in stellar age, might suggest that nuclear discs form out of consecutive generations of gaseous nuclear rings. However, one might speculate if such gradients could also be caused by a superposition of physically different stellar components with the nuclear discs, such as for instance a kinematically hot spheroid, the main galactic disc, or the bar and its box/peanut.
In fact, a superposition of the nuclear disc and the main disc as well as bar is likely, in particular since these components are dynamically expected to extend to the spatial region covered by the nuclear disc. Indeed, such a superposition becomes evident in the observed kinematic properties (see G20), indicated by elevated values of the higher-order moment of the Gauss-Hermite parametrisation of the line-of-sight velocity distribution. This kinematic analysis nevertheless indicates that the nuclear discs clearly dominate the stellar light, as rapidly rotating discs with low velocity dispersions are evident. This shows that there is no major dispersion-dominated component in the central region, excepts perhaps in NGC 6902. A small, kinematically hot spheroid could, nevertheless, be located at the very centre of the galaxies (see Erwin et al., 2015). In fact, due to the typically large photometric concentrations of kinematically hot spheroids, one might expect that these components, if present, dominate the stellar light at least in the innermost part of the nuclear discs.
To further assess the presence of small, kinematically hot spheroids, we carefully inspect radial profiles of the stellar velocity dispersion. The majority of all galaxies show relatively low velocity dispersions throughout the nuclear discs. Nonetheless, seven galaxies exhibit velocity dispersions in their centre which surpass the velocity dispersions measured just outside of their nuclear discs. These galaxies are IC 1438, NGC 1097, NGC 1291, NGC 4984, NGC 5728, NGC 5850, and NGC 6902, and their velocity dispersion profiles are shown in the left-hand panel of Fig. 7. The central and right-hand panels display the remaining galaxies of the non-star-forming and star-forming subsamples, respectively.
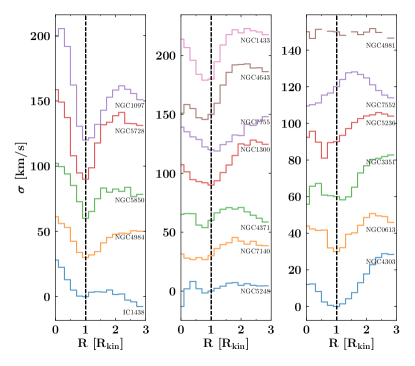
Although the large velocity dispersions in the centres of these galaxies can be connected to kinematically hot spheroids, at least some of the signatures found here can be attributed to other galaxy components. More precisely, NGC 5728 is significantly influenced by AGN activity and a large-scale outflow. Thus, the increased central velocity dispersion in this galaxy might not be a property of the underlying stellar component but related to the AGN. While the other galaxies do not show such strong AGN activity, deviations from a single velocity dispersion profiles in the innermost spaxels could indeed be related to AGN activity. In contrast, NGC 6902 is only weakly barred and does not show clear signatures of a rapidly rotating nuclear disc (see G20). The stellar velocity dispersion continuously increases towards its centre, consistent with the presence of a kinematically hot spheroid that dominates the stellar light in the centre of this galaxy. On the other hand de Lorenzo-Cáceres et al. (2019b) claim that NGC 1291 and NGC 5850 host a small, kinematically hot spheroid within their (more prominent) nuclear discs (see also Méndez-Abreu et al., 2019; de Lorenzo-Cáceres et al., 2019a), and thus constitute galaxies with composite bulges. Only the elevated central velocity dispersions in IC 1438, NGC 1097, and NGC 4984 might indeed be related to previously undetected kinematically hot spheroids.
Signatures of kinematically hot spheroids are not only expected in the kinematics but also in the stellar population properties. Therefore, we present an overview of the radial profiles of ages, metallicities, and [/Fe] enhancements for the non-star-forming subsample in Fig. 8.
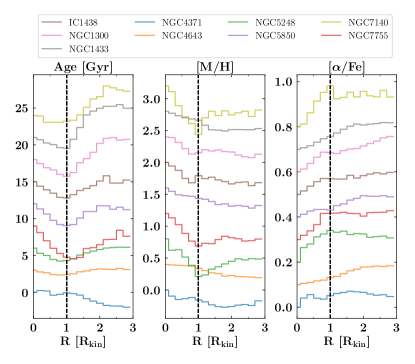
These gradients, in particular that of stellar age, do not show breaks within the radial range of the nuclear disc. In other words, in most galaxies with non-star-forming nuclear discs the slopes of the population gradients are constant from the very centre to the nuclear ring. However, if there was a distinct physical component dominating in a given radial range, one would expect the mean population properties to change there, in particular since nuclear discs are relatively young components while kinematically hot spheroids are expected to be old. Such breaks should be further enhanced by the different central concentrations of nuclear discs and hot spheroids. The only two galaxies in the non-star-forming subsample that show breaks in their age profiles are NGC 4371 and NGC 1291. The deviations in NGC 4371 may be a result of the peculiar geometrical projection of this galaxy, in which the nuclear disc is seen almost edge-on (see Gadotti et al. 2015 for a detailed discussion, but see also Erwin et al. 2015). In NGC 1291 the stellar populations in the nuclear disc are dominated by an inner bar and we explore these stellar population profiles in a dedicated study. Nonetheless, previous studies of the TIMER team suggest that the centre of NGC 1291 is dominated by a kinematically hot spheroid (de Lorenzo-Cáceres et al., 2019b; Méndez-Abreu et al., 2019). This idea is consistent with the stellar population and velocity dispersion profiles presented here: the oldest ages, highest metallicities, and highest velocity dispersion are detected in the centre of the galaxy. In addition, the radial gradients of the hot spheroid clearly deviate from the flat gradients associated with the inner bar and nuclear disc.
Identifying possible breaks in the stellar population profiles of the star-forming subsample is challenging, as any gradients are often outshone or confused with the starbursting regions. Breaks in the stellar population profiles that do not seem to be associated with star-forming regions are only detected in a few galaxies, namely NGC 1097, NGC 4303, NGC 4984, and NGC 5728. However, the breaks in NGC 1097 and NGC 4984 are confined to the innermost spaxels, hinting towards a possible contamination with light from the AGN in these galaxies (Gadotti et al., 2019). The same seems to be the case for NGC 5728 which is affected from a large-scale AGN outflow. These aspects will be explored further in a forthcoming study of the TIMER team. Only NGC 4303 shows a significant break in its age profile at around , but not so in the profiles of [M/H], [/Fe] abundances, and velocity dispersions. In fact, the low central velocity dispersion of approximately does not hint towards the presence of a kinematically hot spheroid.
Interestingly, the inspection of the stellar population profiles of NGC 6902 is consistent with the presence of a massive, kinematically hot spheroid in this galaxy. In contrast to the non-star-forming nuclear discs, the stellar populations in the centre of this galaxy are comparably old and show high velocity dispersions. In addition, no well-defined, single gradients are observed. Moreover, this galaxy lacks clear kinematical signatures of a rapidly rotating nuclear disc but shows a v- anticorrelation at all radii from the main disc of the galaxy to its central region (see G20). In other words, NGC 6902 exhibits properties that are consistent with a the presence of a kinematically hot spheroid as well as a regularly rotating disc.
In fact, kinematically hot spheroids are expected to be very old, as these are typically thought to form in the early phases of galaxy formation444If a substantial merger had happened within the last few , its effects on the galaxy would be directly observable, for instance as tidal tails.. But as described above, often we see that the oldest stars in the TIMER galaxies reside in the bar and not in the centre. This fact, connected to the typical absence of breaks in the stellar population gradients from the nuclear ring all the way to the centre and the relatively low velocity dispersions in the galaxy centres, suggests that in almost all TIMER galaxies no kinematically hot spheroids are present. More precisely, the stellar light in the centres of these galaxies is dominated by the nuclear disc and not by kinematically hot spheroids. Only NGC 6902 shows some signatures that are consistent with the presence of a dynamically hot spheroid and in NGC 1291 and NGC 5850 such a spheroid dominates only at radii much smaller than that of the nuclear disc. In a few cases the evidence is unclear, but the unambiguous presence of nuclear discs, as inferred from the kinematic and stellar population analysis, shows that these components dominate the stellar light.
Nonetheless, some minor contribution from kinematically hot spheroids might be present, but remain undetected in the analysis of the mean stellar population properties performed here. A careful analysis of star formation histories could provide further insights and show to what extent underlying, old stellar populations are present in the nuclear discs of the TIMER galaxies. While this analysis is beyond the scope of this paper, we will report on this aspect in a forthcoming study.
At least in the context of a CDM cosmology, kinematically hot spheroids are expected in the central regions of massive disc galaxies. However, the considerations above show that in the large majority of the present TIMER sample no kinematically hot spheroids, not even small ones, contribute substantially to the stellar light in the nuclear regions. How much this is a challenge to CDM cosmology is not clear. For example, the large majority of the bulges found in the Auriga cosmological simulations are classified as pseudo or composite bulges, while none are identified to be kinematically hot spheroids (Gargiulo et al., 2019). Moreover, in approximately of the Auriga galaxies the fraction of stars in the galaxy centres that formed ex-situ (and thus would end up in a spheroid) is below (Fragkoudi et al., 2019). In addition, strong feedback processes may preferentially remove low angular momentum gas in mergers, allowing for the formation of a disc but preventing the formation of central, kinematically hot components (Brook et al., 2011, 2012). On the other hand, Kormendy et al. (2010) also highlight on statistical grounds that the large presence of massive bulgeless galaxies is a challenge in the current galaxy formation paradigm (see also Kormendy, 2016, and references therein). Clearly, this issue has to be addressed with further analyses of the results from cosmological simulations and a TIMER-like study including a wider variety of galaxies.
6.5 Rejuvenation of an old nuclear disc in NGC 1097?
NGC 1097 is a poster child example of a galaxy with a bright, starbursting nuclear ring with a clearly defined inner and outer edge. However, in the framework of the downsizing scenario it is a rather intriguing case. The downsizing scenario (see e.g. Cowie et al., 1996; Thomas et al., 2010; Sheth et al., 2012) predicts that more massive galaxies form earlier, i.e. their discs become dynamically mature at an earlier cosmic epoch resulting in an earlier bar formation (see e.g. Sheth et al., 2008). Hence, considering the large stellar mass of NGC 1097 (; see e.g. Gadotti et al., 2019), one would expect a comparably old bar and for the same reason also an old nuclear disc. However, although this galaxy is the most massive one in the present sample, it exhibits a prominent and extremely young starbursting ring, in contrast to the less massive but extremely old galaxies in TIMER (see e.g. NGC 4371, as discussed by Gadotti et al., 2015). In the following, we discuss how an interaction of NGC 1097 with a small companion galaxy could explain this peculiarity, consistent with the expectations from the downsizing scenario.
As discussed above and illustrated in Fig. 6, the starbursting ring of NGC 1097 is characterised by high H fluxes, young ages, extremely low metallicities and elevated [/Fe] abundances. While the H measurements are robust, the derived population properties might be erroneous (see Sect. 5.1). In particular, the extremely low metallicity and elevated values of [/Fe] could simply be a result from ongoing star formation. Nevertheless, the galaxy seems to show signatures of an old nuclear disc within the nuclear ring, in particular at radii below . This feature exhibits well defined gradients in its population properties, just as found for many other nuclear discs in the sample.
A possible interpretation for this peculiar composition of stellar population and galaxy properties could be the rejuvenation of an old nuclear disc, in particular since NGC 1097 is interacting with its companion NGC 1097A (see e.g. Ondrechen et al., 1989; Prieto et al., 2019). In this picture, the bar forms very early, as expected within the downsizing scenario, and naturally triggers the formation of a nuclear disc. The subsequent evolution of the galaxy presumably continued with star formation in the nuclear ring, as discussed in Sect. 6.3, or proceeded more quiescent, similar to the current state of, for instance, NGC 4643. At a later point in time, NGC 1097 started to interact with its small companion. In fact, the tidal forces exerted by this companion might efficiently promote the inflow of gas. This inflowing gas could originate from the outskirts of the main disc of NGC 1097, the companions itself, or the surrounding circumgalactic medium. Our observations are not suited to determine the precise origin of the gas, but if it indeed originated from outside of the main disc of NGC 1097, it is expected to be metal-poor. Although the measured low metallicities in the nuclear ring are somewhat unreliable, this measurement is well consistent with this picture. If this is true, it would further indicate that the gas inflow proceeds very rapidly hence preventing any significant metal enrichment of the gas in the main galaxy disc, before its accumulation in the nuclear ring.
In summary, the set-up of population properties in the centre of NGC 1097 might simply originate from the rejuvenation of an old nuclear disc by an interaction-driven gas inflow. However, the discussed picture assumes that the inner region of NGC 1097 indeed contains an old nuclear disc. While the gradients of the population properties in this region look very similar to those of other TIMER galaxies with nuclear discs unaffected by significant star formation, the kinematic analysis indicates elevated velocity dispersions in the centre. This is rather untypical for nuclear discs, but there might be mechanisms that efficiently heat them. It remains unclear if the passage of the companion could be responsible for the heating of the nuclear disc. In fact, the high velocity dispersion might as well be explained by the presence of a small, kinematically hot spheroid (see Sect. 6.4).
7 Summary and conclusions
We have used MUSE observations of the central regions of 21 massive, barred galaxies obtained within the TIMER survey. The galaxies exhibit a large variety of bar-built central structures, such as nuclear rings, nuclear discs, and inner bars. In this study we have derived high-resolution, spatially resolved maps of their mean stellar population properties in order to determine present properties of nuclear rings and nuclear discs, and further investigate processes related to their formation and evolution. To this end, we performed the analysis with both the pPXF and STECMAP routines and found that the obtained results are consistent within standard deviations of in age and in metallicity, yet with STECMAP returning systematically lower stellar ages. In addition, we show that derived ages and metallicities do not depend on whether [/Fe] enhancements are modelled in the fitting process or not. Our main results are as follows:
(i) Nuclear discs are clearly distinguished from other galaxy components by their mean population properties. All non-star-forming nuclear discs appear younger, more metal-rich, and less [/Fe] enhanced compared to their immediate surroundings, as expected in the framework of bar-driven secular evolution. In particular, these findings corroborate that the formation of nuclear discs is a slow and continuous process thus clearly contradicting the idea of merger-built nuclear discs.
(ii) The mean ages of nuclear discs vary significantly across different galaxies. While some nuclear discs/rings are very young and star forming, other objects exhibit extremely old nuclear discs that appear to have evolved quiescently over the past . Based on the example of NGC 1097, we discuss how such old nuclear discs can be rejuvenated by recently accreted gas.
(iii) In all non-star-forming nuclear discs, we detect exceptionally well-defined radial gradients of the mean population properties. More specifically, stellar ages and metallicities are decreasing with radius with a single slope within the nuclear disc while [/Fe] enhancements are increasing, again with a single slope. Interestingly, the lowest [/Fe] abundances are always found in the very centre. The absence of breaks in these gradients within the nuclear discs suggest that nuclear discs are extending all the way from the nuclear ring to the very centre of the galaxies. Breaks in these population profiles, associated with the outer edge of nuclear discs, are consistent with their kinematic radii determined by G20.
(iv) To date, it remains unclear how radially extended nuclear discs can be formed by star formation that typically proceeds in radially well-defined and relatively narrow nuclear rings. Based on the detected radial stellar population gradients and recent observational and numerical results, we argue that nuclear rings and bars evolve simultaneously, resulting in nuclear rings that grow in radius. In this way a continuous nuclear disc could simply be built by a series of nuclear rings that have increasing radii with time.
(v) Combining the results from this study with those in G20 we find no clear evidence for large, kinematically hot spheroids in most of the sample. This is indicated by the smooth stellar population gradients within the nuclear discs and the fact that the very centre is often dominated by a stellar population that is younger, or has the same age, as that in the bar and low stellar velocity dispersion. Most of the galaxies in fact show no signatures of even a small spheroid.
Acknowledgements.
We thank the referee for a prompt and constructive report. Based on observations collected at the European Southern Observatory under programmes 060.A-9313(A), 094.B-0321(A), 095.B-0532(A), and 097.B-0640(A). J. F-B, AdLC, and PSB acknowledge support through the RAVET project by the grants PID2019-107427GB-C31, AYA2016-77237-C3-1-P, and AYA2016-77237-C3-2-P from the Spanish Ministry of Science, Innovation and Universities (MCIU). J. F-B and AdLC acknowledge support through the IAC project TRACES which is partially supported through the state budget and the regional budget of the Consejería de Economía, Industria, Comercio y Conocimiento of the Canary Islands Autonomous Community. The Science, Technology and Facilities Council is acknowledged by JN for support through the Consolidated Grant Cosmology and Astrophysics at Portsmouth, ST/S000550/1. PC acknowledges financial support from Fundação de Amparo à Pesquisa do Estado de São Paulo (FAPESP) process number 2018/05392-8 and Conselho Nacional de Desenvolvimento Científico e Tecnológico (CNPq) process number 310041/2018-0. JMA acknowledges support from the Spanish Ministry of Economy and Competitiveness (MINECO) by grant AYA2017-83204-P. GvdV acknowledges funding from the European Research Council (ERC) under the European Union’s Horizon 2020 research and innovation programme under grant agreement No 724857 (Consolidator Grant ArcheoDyn). TK was supported by the Basic Science Research Program through the National Research Foundation of Korea (NRF) funded by the Ministry of Education (No. 2019R1A6A3A01092024). This research has made use of the SIMBAD database, operated at CDS, Strasbourg, France (Wenger et al., 2000); NASA’s Astrophysics Data System (ADS); Astropy (http://www.astropy.org), a community-developed core Python package for Astronomy (Astropy Collaboration et al., 2013, 2018); NumPy Oliphant (2006); SciPy (Virtanen et al., 2020); and Matplotlib (Hunter, 2007).References
- Aguerri et al. (2009) Aguerri, J. A. L., Méndez-Abreu, J., & Corsini, E. M. 2009, A&A, 495, 491
- Alonso et al. (2018) Alonso, S., Coldwell, G., Duplancic, F., Mesa, V., & Lambas, D. G. 2018, A&A, 618, A149
- Astropy Collaboration et al. (2018) Astropy Collaboration, Price-Whelan, A. M., Sipőcz, B. M., et al. 2018, AJ, 156, 123
- Astropy Collaboration et al. (2013) Astropy Collaboration, Robitaille, T. P., Tollerud, E. J., et al. 2013, A&A, 558, A33
- Athanassoula (1992a) Athanassoula, E. 1992a, MNRAS, 259, 328
- Athanassoula (1992b) Athanassoula, E. 1992b, MNRAS, 259, 345
- Athanassoula (2003) Athanassoula, E. 2003, MNRAS, 341, 1179
- Athanassoula et al. (2005) Athanassoula, E., Lambert, J. C., & Dehnen, W. 2005, MNRAS, 363, 496
- Bacon et al. (2010) Bacon, R., Accardo, M., Adjali, L., et al. 2010, in Society of Photo-Optical Instrumentation Engineers (SPIE) Conference Series, Vol. 7735, Proc. SPIE, 773508
- Bacon et al. (2017) Bacon, R., Conseil, S., Mary, D., et al. 2017, A&A, 608, A1
- Baldwin et al. (1981) Baldwin, J. A., Phillips, M. M., & Terlevich, R. 1981, PASP, 93, 5
- Bittner et al. (2019) Bittner, A., Falcón-Barroso, J., Nedelchev, B., et al. 2019, A&A, 628, A117
- Breda et al. (2020) Breda, I., Papaderos, P., Gomes, J. M., et al. 2020, A&A, 635, A177
- Brook et al. (2011) Brook, C. B., Governato, F., Roškar, R., et al. 2011, MNRAS, 415, 1051
- Brook et al. (2012) Brook, C. B., Stinson, G., Gibson, B. K., et al. 2012, MNRAS, 419, 771
- Buta et al. (2015) Buta, R. J., Sheth, K., Athanassoula, E., et al. 2015, ApJS, 217, 32
- Calzetti et al. (2000) Calzetti, D., Armus, L., Bohlin, R. C., et al. 2000, ApJ, 533, 682
- Cappellari (2017) Cappellari, M. 2017, MNRAS, 466, 798
- Cappellari & Copin (2003) Cappellari, M. & Copin, Y. 2003, MNRAS, 342, 345
- Cappellari & Emsellem (2004) Cappellari, M. & Emsellem, E. 2004, PASP, 116, 138
- Chapon et al. (2013) Chapon, D., Mayer, L., & Teyssier, R. 2013, MNRAS, 429, 3114
- Cid Fernandes et al. (2005) Cid Fernandes, R., Mateus, A., Sodré, L., Stasińska, G., & Gomes, J. M. 2005, MNRAS, 358, 363
- Cole et al. (2014) Cole, D. R., Debattista, V. P., Erwin, P., Earp, S. W. F., & Roškar, R. 2014, MNRAS, 445, 3352
- Combes & Gerin (1985) Combes, F. & Gerin, M. 1985, A&A, 150, 327
- Comerón et al. (2010) Comerón, S., Knapen, J. H., Beckman, J. E., et al. 2010, MNRAS, 402, 2462
- Cowie et al. (1996) Cowie, L. L., Songaila, A., Hu, E. M., & Cohen, J. G. 1996, AJ, 112, 839
- Davies et al. (2007) Davies, R. I., Müller Sánchez, F., Genzel, R., et al. 2007, ApJ, 671, 1388
- de Lorenzo-Cáceres et al. (2019a) de Lorenzo-Cáceres, A., Méndez-Abreu, J., Thorne, B., & Costantin, L. 2019a, MNRAS, 484, 665
- de Lorenzo-Cáceres et al. (2020) de Lorenzo-Cáceres, A., Méndez-Abreu, J., Thorne, B., & Costantin, L. 2020, MNRAS, 494, 1826
- de Lorenzo-Cáceres et al. (2019b) de Lorenzo-Cáceres, A., Sánchez-Blázquez, P., Méndez-Abreu, J., et al. 2019b, MNRAS, 484, 5296
- Donohoe-Keyes et al. (2019) Donohoe-Keyes, C. E., Martig, M., James, P. A., & Kraljic, K. 2019, MNRAS, 489, 4992
- Durré & Mould (2018) Durré, M. & Mould, J. 2018, ApJ, 867, 149
- Ellison et al. (2011) Ellison, S. L., Nair, P., Patton, D. R., et al. 2011, MNRAS, 416, 2182
- Emsellem et al. (2015) Emsellem, E., Renaud, F., Bournaud, F., et al. 2015, MNRAS, 446, 2468
- Erwin (2004) Erwin, P. 2004, A&A, 415, 941
- Erwin et al. (2015) Erwin, P., Saglia, R. P., Fabricius, M., et al. 2015, MNRAS, 446, 4039
- Eskridge et al. (2000) Eskridge, P. B., Frogel, J. A., Pogge, R. W., et al. 2000, AJ, 119, 536
- Falcón-Barroso et al. (2006) Falcón-Barroso, J., Bacon, R., Bureau, M., et al. 2006, MNRAS, 369, 529
- Falcón-Barroso et al. (2014) Falcón-Barroso, J., Ramos Almeida, C., Böker, T., et al. 2014, MNRAS, 438, 329
- Falcón-Barroso et al. (2011) Falcón-Barroso, J., Sánchez-Blázquez, P., Vazdekis, A., et al. 2011, A&A, 532, A95
- Fragkoudi et al. (2016) Fragkoudi, F., Athanassoula, E., & Bosma, A. 2016, MNRAS, 462, L41
- Fragkoudi et al. (2017) Fragkoudi, F., Athanassoula, E., & Bosma, A. 2017, MNRAS, 466, 474
- Fragkoudi et al. (2019) Fragkoudi, F., Grand, R. J. J., Pakmor, R., et al. 2019, arXiv e-prints, arXiv:1911.06826
- Fraser-McKelvie et al. (2019) Fraser-McKelvie, A., Merrifield, M., Aragón-Salamanca, A., et al. 2019, MNRAS, 488, L6
- Gadotti (2011) Gadotti, D. A. 2011, MNRAS, 415, 3308
- Gadotti et al. (2019) Gadotti, D. A., Sánchez-Blázquez, P., Falcón-Barroso, J., et al. 2019, MNRAS, 482, 506
- Gadotti et al. (2015) Gadotti, D. A., Seidel, M. K., Sánchez-Blázquez, P., et al. 2015, A&A, 584, A90
- Garcia (1993) Garcia, A. M. 1993, A&AS, 100, 47
- Gargiulo et al. (2019) Gargiulo, I. D., Monachesi, A., Gómez, F. A., et al. 2019, MNRAS, 489, 5742
- Gomes & Papaderos (2017) Gomes, J. M. & Papaderos, P. 2017, A&A, 603, A63
- Heavens et al. (2000) Heavens, A. F., Jimenez, R., & Lahav, O. 2000, MNRAS, 317, 965
- Hunter (2007) Hunter, J. D. 2007, Computing in Science Engineering, 9, 90
- James et al. (2009) James, P. A., Bretherton, C. F., & Knapen, J. H. 2009, A&A, 501, 207
- James & Percival (2016) James, P. A. & Percival, S. M. 2016, MNRAS, 457, 917
- Kim et al. (2016) Kim, T., Gadotti, D. A., Athanassoula, E., et al. 2016, MNRAS, 462, 3430
- Kim et al. (2012) Kim, W.-T., Seo, W.-Y., & Kim, Y. 2012, ApJ, 758, 14
- Knapen (2005) Knapen, J. H. 2005, A&A, 429, 141
- Knapen (2007) Knapen, J. H. 2007, Astrophysics and Space Science Proceedings, 3, 175
- Koleva et al. (2009) Koleva, M., Prugniel, P., Bouchard, A., & Wu, Y. 2009, A&A, 501, 1269
- Kormendy (2016) Kormendy, J. 2016, Astrophysics and Space Science Library, Vol. 418, Elliptical Galaxies and Bulges of Disc Galaxies: Summary of Progress and Outstanding Issues, ed. E. Laurikainen, R. Peletier, & D. Gadotti, 431
- Kormendy et al. (2010) Kormendy, J., Drory, N., Bender, R., & Cornell, M. E. 2010, ApJ, 723, 54
- Kormendy & Kennicutt (2004) Kormendy, J. & Kennicutt, Robert C., J. 2004, ARA&A, 42, 603
- Kraljic et al. (2012) Kraljic, K., Bournaud, F., & Martig, M. 2012, ApJ, 757, 60
- Kroupa (2001) Kroupa, P. 2001, MNRAS, 322, 231
- Leaman et al. (2019) Leaman, R., Fragkoudi, F., Querejeta, M., et al. 2019, MNRAS, 488, 3904
- Martinez-Valpuesta et al. (2006) Martinez-Valpuesta, I., Shlosman, I., & Heller, C. 2006, ApJ, 637, 214
- Mayer et al. (2008) Mayer, L., Kazantzidis, S., & Escala, A. 2008, Mem. Soc. Astron. Italiana, 79, 1284
- McDermid et al. (2015) McDermid, R. M., Alatalo, K., Blitz, L., et al. 2015, MNRAS, 448, 3484
- Melvin et al. (2014) Melvin, T., Masters, K., Lintott, C., et al. 2014, MNRAS, 438, 2882
- Méndez-Abreu et al. (2019) Méndez-Abreu, J., de Lorenzo-Cáceres, A., Gadotti, D. A., et al. 2019, MNRAS, 482, L118
- Méndez-Abreu et al. (2014) Méndez-Abreu, J., Debattista, V. P., Corsini, E. M., & Aguerri, J. A. L. 2014, A&A, 572, A25
- Méndez-Abreu et al. (2010) Méndez-Abreu, J., Sánchez-Janssen, R., & Aguerri, J. A. L. 2010, ApJ, 711, L61
- Menéndez-Delmestre et al. (2007) Menéndez-Delmestre, K., Sheth, K., Schinnerer, E., Jarrett, T. H., & Scoville, N. Z. 2007, ApJ, 657, 790
- Muñoz-Mateos et al. (2015) Muñoz-Mateos, J. C., Sheth, K., Regan, M., et al. 2015, ApJS, 219, 3
- Neumann et al. (2020) Neumann, J., Fragkoudi, F., Pérez, I., et al. 2020, arXiv e-prints, arXiv:2003.08946
- Neumann et al. (2019) Neumann, J., Gadotti, D. A., Wisotzki, L., et al. 2019, A&A, 627, A26
- Ocvirk et al. (2006a) Ocvirk, P., Pichon, C., Lançon, A., & Thiébaut, E. 2006a, MNRAS, 365, 74
- Ocvirk et al. (2006b) Ocvirk, P., Pichon, C., Lançon, A., & Thiébaut, E. 2006b, MNRAS, 365, 46
- Oliphant (2006) Oliphant, T. E. 2006, A guide to NumPy, Vol. 1 (Trelgol Publishing USA)
- Ondrechen et al. (1989) Ondrechen, M. P., van der Hulst, J. M., & Hummel, E. 1989, ApJ, 342, 39
- Pérez et al. (2017) Pérez, I., Martínez-Valpuesta, I., Ruiz-Lara, T., et al. 2017, MNRAS, 470, L122
- Pietrinferni et al. (2004) Pietrinferni, A., Cassisi, S., Salaris, M., & Castelli, F. 2004, ApJ, 612, 168
- Pietrinferni et al. (2006) Pietrinferni, A., Cassisi, S., Salaris, M., & Castelli, F. 2006, ApJ, 642, 797
- Pietrinferni et al. (2013) Pietrinferni, A., Cassisi, S., Salaris, M., & Hidalgo, S. 2013, A&A, 558, A46
- Pietrinferni et al. (2009) Pietrinferni, A., Cassisi, S., Salaris, M., Percival, S., & Ferguson, J. W. 2009, ApJ, 697, 275
- Piner et al. (1995) Piner, B. G., Stone, J. M., & Teuben, P. J. 1995, ApJ, 449, 508
- Pinna et al. (2019) Pinna, F., Falcón-Barroso, J., Martig, M., et al. 2019, A&A, 623, A19
- Press et al. (1992) Press, W. H., Teukolsky, S. A., Vetterling, W. T., & Flannery, B. P. 1992, Numerical recipes in FORTRAN. The art of scientific computing
- Prieto et al. (2019) Prieto, M. A., Fernandez-Ontiveros, J. A., Bruzual, G., et al. 2019, MNRAS, 485, 3264
- Reynaud & Downes (1998) Reynaud, D. & Downes, D. 1998, A&A, 337, 671
- Ruiz-Lara et al. (2015) Ruiz-Lara, T., Pérez, I., Gallart, C., et al. 2015, A&A, 583, A60
- Sakamoto et al. (1999) Sakamoto, K., Okumura, S. K., Ishizuki, S., & Scoville, N. Z. 1999, ApJ, 525, 691
- Sánchez-Blázquez et al. (2011) Sánchez-Blázquez, P., Ocvirk, P., Gibson, B. K., Pérez, I., & Peletier, R. F. 2011, MNRAS, 415, 709
- Sarzi et al. (2006) Sarzi, M., Falcón-Barroso, J., Davies, R. L., et al. 2006, MNRAS, 366, 1151
- Seo et al. (2019) Seo, W.-Y., Kim, W.-T., Kwak, S., et al. 2019, ApJ, 872, 5
- Sheth et al. (2008) Sheth, K., Elmegreen, D. M., Elmegreen, B. G., et al. 2008, ApJ, 675, 1141
- Sheth et al. (2012) Sheth, K., Melbourne, J., Elmegreen, D. M., et al. 2012, ApJ, 758, 136
- Sheth et al. (2010) Sheth, K., Regan, M., Hinz, J. L., et al. 2010, PASP, 122, 1397
- Sheth et al. (2005) Sheth, K., Vogel, S. N., Regan, M. W., Thornley, M. D., & Teuben, P. J. 2005, ApJ, 632, 217
- Simmons et al. (2014) Simmons, B. D., Melvin, T., Lintott, C., et al. 2014, MNRAS, 445, 3466
- Sormani et al. (2015) Sormani, M. C., Binney, J., & Magorrian, J. 2015, MNRAS, 449, 2421
- Sormani & Li (2020) Sormani, M. C. & Li, Z. 2020, arXiv e-prints, arXiv:2002.10559
- Sormani et al. (2018) Sormani, M. C., Sobacchi, E., Fragkoudi, F., et al. 2018, MNRAS, 481, 2
- Thomas et al. (2010) Thomas, D., Maraston, C., Schawinski, K., Sarzi, M., & Silk, J. 2010, MNRAS, 404, 1775
- Tojeiro et al. (2007) Tojeiro, R., Heavens, A. F., Jimenez, R., & Panter, B. 2007, MNRAS, 381, 1252
- Vazdekis et al. (2015) Vazdekis, A., Coelho, P., Cassisi, S., et al. 2015, MNRAS, 449, 1177
- Vazdekis et al. (2010) Vazdekis, A., Sánchez-Blázquez, P., Falcón-Barroso, J., et al. 2010, MNRAS, 404, 1639
- Venturi et al. (2018) Venturi, G., Nardini, E., Marconi, A., et al. 2018, A&A, 619, A74
- Virtanen et al. (2020) Virtanen, P., Gommers, R., Oliphant, T. E., et al. 2020, Nature Methods, 17, 261
- Walcher et al. (2015) Walcher, C. J., Coelho, P. R. T., Gallazzi, A., et al. 2015, A&A, 582, A46
- Weilbacher et al. (2012) Weilbacher, P. M., Streicher, O., Urrutia, T., et al. 2012, in Society of Photo-Optical Instrumentation Engineers (SPIE) Conference Series, Vol. 8451, Proc. SPIE, 84510B
- Wenger et al. (2000) Wenger, M., Ochsenbein, F., Egret, D., et al. 2000, A&AS, 143, 9
- Wilkinson et al. (2017) Wilkinson, D. M., Maraston, C., Goddard, D., Thomas, D., & Parikh, T. 2017, MNRAS, 472, 4297
Appendix A Descriptions of individual galaxies
IC 1438: This is a typical example of a barred galaxy with a nuclear disc. The bar is fully included in the field of view and characterised by high [M/H] and low [/Fe] abundances. The nuclear disc shows even higher metallicities and lower [/Fe] enhancements, as compared to the bar. A young nuclear disc is clearly visible and surrounded by a region of older stellar populations.
NGC 613: The nuclear ring of this galaxy appears rather asymmetric, in particular in north-eastern part of the ring where a region of old stellar populations is detected. However, this detection of old stellar populations is probably not real: a visual inspection of the spectra show a broad emission-line component that is not included in the emission-line modelling performed here. According to high H emission-line fluxes, the ring is starbursting and we detect low metallicities and high [/Fe] abundances in the ring.
NGC 1097: A poster child example of a galaxy with a starbursting nuclear ring. Interestingly, the nuclear ring shows a significant width, especially in age, an exceptionally low metallicity, and elevated [/Fe] abundances. Since this galaxy is currently undergoing an interaction (see e.g. Ondrechen et al. 1989; Prieto et al. 2019), one might suspect this interaction as origin of the low metallicity gas. Within the starbursting nuclear ring, a nuclear disc with its typical gradients is evident. See Sect. 6.5 for a detailed discussion of this galaxy.
NGC 1291: This quiescent galaxy highlights a very prominent inner bar that almost fills the field of view. While the main bar is almost not visible, the inner bar appears clearly distinguished by its increased metallicity and low [/Fe] enhancement. Interestingly, the ends of the inner bar show slightly younger stellar populations as it is also seen in main bars (Neumann et al. 2020). The inner bar of this galaxy is discussed in greater detail in Méndez-Abreu et al. (2019), de Lorenzo-Cáceres et al. (2019b), and a forthcoming paper.
NGC 1300: This galaxy exhibits a typical nuclear disc with young ages, elevated metallicities, and low [/Fe] abundances. We highlight the excellent agreement between the kinematic radius of the nuclear disc and the minimum of the age profile.
NGC 1365: The analysis of this galaxy is hampered by various effects: strong dust extinction is found along a spiral-like pattern, several regions of violent ongoing star formation are evident, and a significant, large-scale contribution from an AGN is found, especially towards the south-east (see e.g. Venturi et al. 2018). In contrast to the other galaxies in the sample, the nuclear ring/disc is hard to distinguish.
NGC 1433: A noteworthy example of a young and metal-rich nuclear disc with low [/Fe] abundances. In contrast to previously shown stellar population maps of this galaxy (see Bittner et al. 2019), the maps shown here highlight a strongly elongated feature of increased [M/H] and low [/Fe], thanks to the higher signal-to-noise ratio employed in this paper. In fact, it has been proposed that this galaxy has an inner bar (Erwin 2004; Buta et al. 2015) and we will discuss this issue further in a forthcoming paper. We highlight the excellent agreement between the kinematic radius and changes in the stellar population profiles in this galaxy.
NGC 3351: Similar to NGC 1097, this galaxy hosts a starbursting nuclear ring with very low metallicities and increased [/Fe] enhancements. Intense stellar feedback originates from this starbursting ring (see Leaman et al. 2019). Interestingly, this galaxy is member of a group (see e.g. Garcia 1993) that might facilitate the accretion of low-metallicity gas. Encompassed within the nuclear ring, a nuclear disc consisting of comparably young and metal rich stellar populations with low [/Fe] enhancements is evident.
NGC 4303: In this galaxy, almost the entire bar is included in the field of view and characterised by high metallicities and low [/Fe] enhancements. In addition, a typical young nuclear disc with a star-forming nuclear ring, encompassed by a region of old stars, is found. The population gradients generally follow the typical well-defined profiles, except in the very centre of the galaxy where a clear break in these profiles is found which could result from effects of the AGN in the spectral analysis, or indicate the presence of an additional stellar component.
NGC 4371: This galaxy has a nuclear disc with the typical stellar population properties: young ages, low [/Fe] enhancement and high metallicity. However, it is peculiar in the sense that interior to that region one sees older ages and variations in metallicity and [/Fe] abundances. These may be produced by projection effects, since the inclination is and the line of nodes is almost perpendicular to the bar. Alternatively, it may be produced by additional stellar components (see Erwin et al. 2015). For a detailed discussion of this galaxy, we refer the reader to Gadotti et al. (2015).
NGC 4643: Another typical example of a nuclear disc: a young, metal-rich nuclear disc with low [/Fe] enhancement is embedded in a region of older stellar populations. The bar of the galaxy is oriented from the south-east to north-west and prominently highlighted by its relatively young ages, high metallicities and low [/Fe] abundances. Interestingly, these trends along the bar seem to become stronger with increasing radius. While H emission is barely detected, it is arranged in a small, two-armed spiral structure.
NGC 4981: After applying the spatial binning, this is the galaxy with the lowest spatial resolution of the present TIMER sample. In this galaxy it is difficult to distinguish nuclear structures but nonetheless the highest metallicities and lowest [/Fe] enhancements are observed in the centre of the galaxy.
NGC 4984: This galaxy hosts a typical nuclear disc, showing radial population gradients that appear similar but less well-defined than in other galaxies, most likely due to an inclination effect. The populations found in the very central bins deviate strongly from these profiles. In particular, old ages, low metallicities and high [/Fe] abundances are detected. We speculate that these deviations might be from effects on the spectral analysis caused by the AGN in this galaxy.
NGC 5236: This galaxy shows a highly irregular nuclear structure. Star formation, as traced by the H emission, is irregularly distributed in the central region, not forming a nuclear ring or nuclear disc. It is also heavily obscured by dust. As a result, also the stellar population maps and gradients do not show regular features.
NGC 5248: This galaxy has a typical nuclear disc. While the radial population gradients are well-defined, a slight deviation is evident in the central bins which, again, can be an AGN effect. In the region of the nuclear ring a few small, star-forming spots are found, showing significantly lower ages and metallicities and increased [/Fe] abundances. Interestingly, the H emission is not restricted to the nuclear ring but appears rather smoothly distributed over the entire nuclear disc.
NGC 5728: While this galaxy seems to host a common nuclear disc, the observed stellar population properties are severely contaminated by an AGN jet. This jet is strikingly visible in the maps as an elongated feature of old ages and low metallicities crossing the nuclear disc from north-west to south-east and extending into an even larger cone outside of the nuclear region (see e.g. Durré & Mould 2018).
NGC 5850: A prominent example of a galaxy hosting an inner bar. The inner bar is clearly visible by its elevated [M/H] and low [/Fe] enhancements, and shows regions with young stellar populations at its ends. We refer the reader to de Lorenzo-Cáceres et al. (2019b) for a detailed discussion of the double-barred structure of this galaxy. The nuclear disc shows the typical aforementioned properties.
NGC 6902: The galaxy NGC 6902 is a peculiar object. Combining the results from this study and G20, it is unclear whether the galaxy hosts a nuclear disc. A weak bar with slightly elevated metallicities and low [/Fe] abundances is found, encompassed by a star-forming inner ring at the bar radius. Within this inner ring, spatially coinciding with the bar, a kinematically hot spheroid is detected. Due to these peculiarities, this galaxy is not considered in any of the discussions in this study.
NGC 7140: This galaxy hosts a rather typical nuclear disc, which appearance is slightly contaminated by a singular star-forming spot in the nuclear ring. The moderate H emission in the nuclear region is rather smoothly distributed over the nuclear disc, but nonetheless shows some concentration in a nuclear ring.
NGC 7552: A heavily starbursting nuclear ring is evident in the galaxy. This is not only highlighted in the H emission-line maps, but also clearly visible in the radial population profiles as extrema of low metallicities and high [/Fe] enhancements. Within the nuclear ring a typical nuclear disc is seen with young ages, elevated metallicities and low [/Fe] enhancements. However, contrary to most nuclear discs, this nuclear disc shows a flat age profile.
NGC 7755: This galaxy hosts a typical nuclear disc with a ring of H emission at its outermost edge, embedded in a region of older stellar populations. It further highlights the typical population properties found in bars. In particular, the bar is visible by its high metallicities and low [/Fe] abundances. The reader is referred to Neumann et al. (2020) for further details on the bar properties.
Appendix B Maps of dust-corrected H fluxes
In Fig. 9 we present maps of dust-corrected H fluxes for all TIMER galaxies. We note that similar versions of the maps of IC 1438, NGC 4304, NGC 4371, NGC 4643, NGC 4981, NGC 4984, NGC 5248, NGC 6902, and NGC 7755 have already been presented in Neumann et al. (2020), but in order to facilitate the comparison with the maps of the stellar population properties we present these here again. We only display spaxels in which the amplitude-over-noise ratio of the H line exceeds 5. Fluxes are given in units of and the respective limits of the colour bar are stated in the lower-right corner of each panel. Based on reconstructed intensities from the MUSE cube, we display isophotes in steps of , identical to the ones displayed in the maps of the stellar population properties.
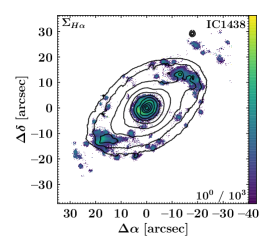
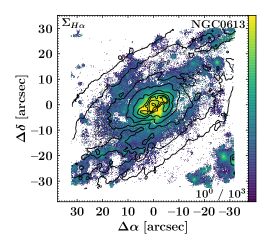
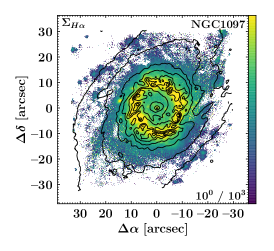
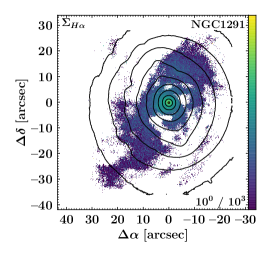
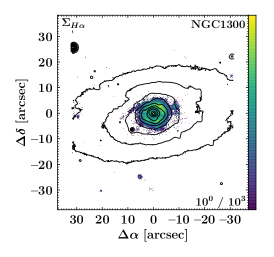
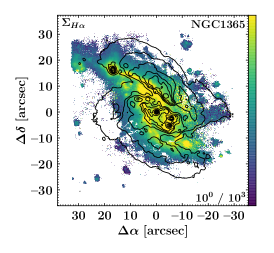
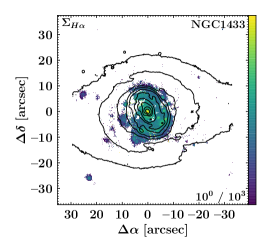
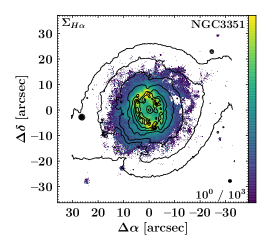
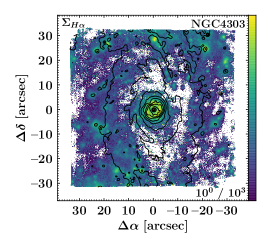
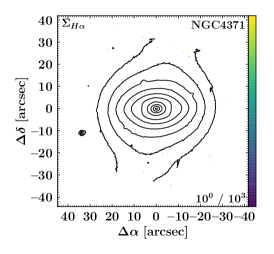
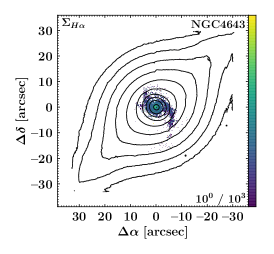
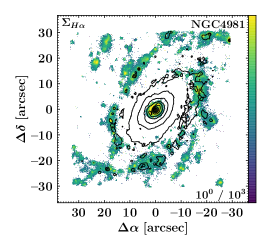
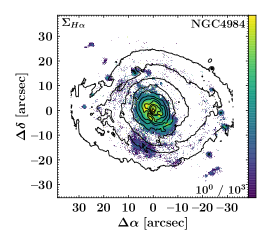
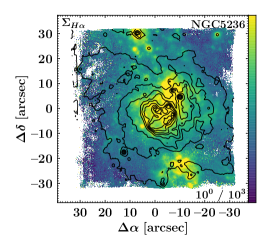
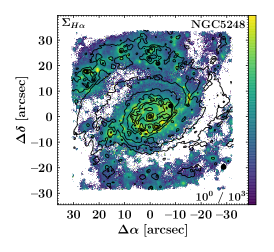
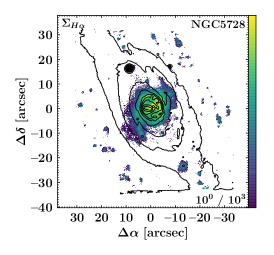
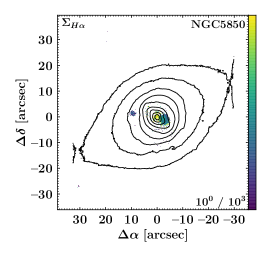
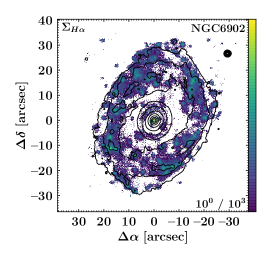
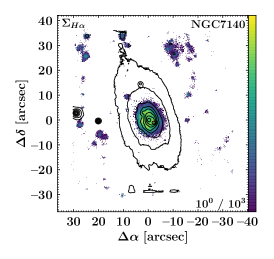
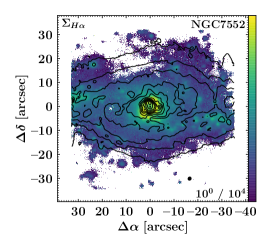
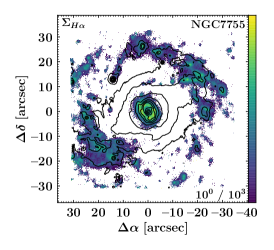
Appendix C Maps and radial profiles of mean stellar population properties
In the left column of Figs. 10, 11, and 12 we present maps of the light-weighted (upper panels) and mass-weighted (lower panels) mean stellar population properties of the non-star-forming and star-forming subsamples, as well as those with peculiar nuclear regions. All maps have been generated with pPXF and include the modelling of [/Fe] enhancements. The figures display age, metallicity, and [/Fe] abundances in the left-hand, central, and right-hand panels, respectively, while different galaxies are separated by horizontal lines. The limits of the colour bar are stated in the lower-right corner of each panel. Based on reconstructed intensities from the MUSE cube, we display isophotes in steps of . North is up; east is to the left.
In the right-hand side of the figures we plot light-weighted stellar ages (first panels), metallicities (second panels), [/Fe] enhancements (third panels), and velocity dispersions (fourth panels) as a function of the galactocentric radius of all spatial bins in the field of view. The profiles have been deprojected using inclinations and position angles derived in S4G (Muñoz-Mateos et al. 2015), as presented in Table 1. The vertical dashed lines represent the kinematic radii of the nuclear discs, which was defined in G20 as the radius at which reaches its maximum in the region dominated by the nuclear disc.