A revised view of the Canis Major stellar overdensity with DECam and Gaia: new evidence of a stellar warp of blue stars
Abstract
We present DECam imaging combined with Gaia DR2 data to study the Canis Major overdensity. The presence of the so-called Blue Plume stars in a low-pollution area of the color-magnitude diagram allows us to derive the distance and proper motions of this stellar feature along the line of sight of its hypothetical core. The stellar overdensity extends on a large area of the sky at low Galactic latitudes, below the plane, and between . According to the orbit derived for Canis Major, it presents an on-plane rotation around the Milky Way. Moreover, additional overdensities of Blue Plume stars are found around the plane and across the Galaxy, proving that these objects are not only associated with that structure. The spatial distribution of these stars, derived using Gaia astrometric data, confirms that the detection of the Canis Major overdensity results more from the warped structure of the Milky Way disk than from the accretion of a dwarf galaxy.
keywords:
(Galaxy): halo, (Galaxy): disc, (Galaxy): formation1 Introduction
The Galactic halo is partially the result of the continuous merging and accretion of minor satellites (e.g. Font et al., 2011; Rodriguez-Gomez et al., 2016). Large scale sky surveys, such as SDSS, 2MASS, DES and Gaia, have shown us the heterogeneous origin of the outer Milky Way by unveiling past accretion events (e.g. Helmi et al., 2018; Myeong et al., 2019; Torrealba et al., 2019), a population of stellar tidal streams and overdensities (e.g. Bernard et al., 2016; Shipp et al., 2018), and faint galaxies (e.g. Drlica-Wagner et al., 2015; Koposov et al., 2015, 2017; Torrealba et al., 2018). One of the main evidence of hierarchical formation in our Galaxy is the tidal stream generated by the accretion of the Sagittarius dwarf galaxy (Ibata et al., 1994; Martínez-Delgado et al., 2001; Majewski et al., 2003; Belokurov et al., 2006; Koposov et al., 2012), which is orbiting the Milky Way in almost a polar orbit. Since its discovery, a handful of new stellar overdensities, clumps and streams have been discovered in the halo and this family will keep growing as the coverage of the sky by new projects (e.g. LSST) and their completenesses increase.
The so-called Canis Major overdensity (CMa), an elliptical-shaped stellar overdensity centered at ()= (240∘, -8∘), was discovered by Martin et al. (2004) by analyzing the distribution of M-giant stars below and above the Galactic plane. Such a remarkable Milky Way halo substructure is spreading over a wide area ( sq deg) of the sky and seems to be located at only kpc (Bellazzini et al., 2004; Martin et al., 2004; Martínez-Delgado et al., 2005; Bellazzini et al., 2006; Butler et al., 2007).
For many years, the origin of that overdensity generated an intense debate. One of the hypothesis about its nature is that CMa is the core of a dwarf galaxy accreted at low Galactic latitudes. The first estimates, based on M-giant stars counts, suggested that CMa and the Sagittarius dwarf galaxy have a similar total mass (Martin et al., 2004). Moreover, its absolute magnitude () and central surface brightness ( mag arcsec-2) values seemed to locate this hypothetical galaxy in the same region of the luminosity - size and planes where other Milky Way satellites are located (Martínez-Delgado et al., 2005; Bellazzini et al., 2006; Butler et al., 2007). Moreover, a group of peculiar globular clusters (NGC 1851, NGC 1904, NGC 2298 and NGC 2808, among others) has been associated with CMa, what initially reinforced its definition as possible accreted galaxy within the inner Galactic halo (Forbes et al., 2004; Martin et al., 2004; Forbes & Bridges, 2010). Those globulars present extended halos and seem to be surrounded by an unexpected stellar population, what might confirm their accreted origin (see Carballo-Bello et al., 2018, and references therein), as also suggested by their position in the age-metallicity distribution of Galactic globular clusters (see Kruijssen et al., 2019). In addition, this family of globulars has been associated with the Gaia Sausage, a structure in the velocity space formed after the disruption of a massive galaxy (see Myeong et al., 2018; Forbes, 2020, and references therein). The scarce analyses of chemical abundances of CMa members found that some of those stars displayed abundance ratios clearly unusual for Galactic stars (e.g. Sbordone et al., 2005), thus confirming the extra-Galactic nature of that halo substructure.
The excess of bright blue stars in the color-magnitud diagrams (CMD) obtained for the central regions of CMa with respect to the ones derived for the symmetric fields above the Galactic plane, has been suggested as an additional evidence for the extra-Galactic origin of this overdensity (Bellazzini et al., 2004; Martínez-Delgado et al., 2005; de Jong et al., 2007). This possibly young ( Gyr) stellar population, namely the Blue Plume (BP), is bright enough to be detected even in shallow wide-field photometry and is found in a section of the CMD with very low levels of contamination by fore/background stars. Dinescu et al. (2005) measured the proper motions for a sample of BP stars in direction of the CMa core ( mas yr-1, mas yr-1) and derived, together with the radial velocity measured for M-giant stars in the same region (Martin et al., 2004, vr = 109 km s-1), a tentative orbit for this hypothetical dwarf galaxy. Their results show that CMa might have an in-plane rotation, similar to that of the thick-disk stars in that direction of the Galaxy but with a remarkable motion perpendicular to the plane ( km s-1). An alternative interpretation for the detection of BP stars along this line of sight suggests that this population, which is also detected at different longitudes across the third Galactic quadrant, might be associated with a out-of-plane spiral arm of the Milky Way instead of being part of the debris from a disrupted dwarf galaxy (Carraro, 2005; Moitinho et al., 2006; Carraro et al., 2008; Powell et al., 2008).
In fact, the Galactic origin of CMa was the alternative scenario considered since just after its discovery: the warped Milky Way disk, firstly suggested by Kerr (1957), widely studied using different tracers (e.g. Wouterloot et al., 1990; López-Corredoira et al., 2002; Levine et al., 2006; Witham et al., 2008; Chen et al., 2019; Romero-Gómez et al., 2019) and observed in many other spiral galaxies (e.g. Sanchez-Saavedra et al., 1990), might be responsible for the overpopulation of stars along the line of sight of CMa. A series of analyses of the expected and observed stellar counts (Momany et al., 2004; López-Corredoira, 2006; Momany et al., 2006; López-Corredoira et al., 2007) found plausible to reproduce the observed spatial distribution of CMa stars in the third Galactic quadrant with a warped+flared disk. Two large sets of physical mechanisms have been proposed to explain the non-planarity of the Galactic disk (Alfaro & Efremov, 1996; López-Corredoira et al., 2020): (i) the former is based on the existence of a Galactic magnetic field and its possible interaction, either with the intergalactic magnetic field (i.e. Battaner et al., 1990), or with the Galactic disk disturbances due to energy and momentum injection through collisions with high-velocity clouds (Santillán et al., 1999; Franco et al., 2002), dark-matter halos (Bekki, 2009), or satellite galaxies (Hu & Sijacki, 2018); the second group (ii) encompasses the different gravitational couplings that can occur when the angular momentum of different galactic subsystems (i.e. halo and disk) are misaligned (Dubinski & Chakrabarty, 2009). The first case would mainly affect gas, and only young stars, born from this material, would partially fit the gas pattern. If the stellar population, in a wide range of ages, showed the warped shape, then it would be more logical to think that the gravitational interaction between different subsystems of the Milky Way is its main driver. The latest results seem to show that the warp is present at different ranges of stellar ages which leads to think that gravitational interaction between Galactic subsystems is the main mechanism that drives the warp formation (Poggio et al., 2018).
Moreover, the lack of an excess of RR Lyrae stars at the position of CMa, as previously reported for other well-studied dwarf galaxies, was pointed out in the last work on this overdensity for the last decade and discarded once again its extra-Galactic origin (Mateu et al., 2009). The absence of RR Lyrae stars would imply that the alleged galaxy would have an old population which is either negligible or with very unique properties. Either case implies the stellar population of CMa is at odds with what is observed in the rest of dwarf spheroidal galaxies in the Local Group and around other nearby stellar systems.
To add more complexity to the interpretation of the CMa nature, early numerical simulations of the Monoceros ring, a vast stellar halo substructure surrounding the Milky Way (Newberg et al., 2002), placed the overdensity in a projected position compatible with that of the stream (Peñarrubia et al., 2005). However, this identification of CMa as the accreted progenitor galaxy of Monoceros was not conclusive and even the origin of the ring as a possible Galactic disk perturbation has recently been object of discussion (e.g. Xu et al., 2015).
In this paper, we combine new photometric data from our wide-field DECam survey of CMa with parallaxes and proper motions provided by the second Gaia data release (DR2) to map the extend of CMa and shed more light on its real nature. This dataset allows us to study the three-dimensional structure of this stellar overdensity by tracing BP stars across the area covered by our DECam survey. We also extend this study to the whole sky based on the photometry obtained by this space mission, which is crucial to confirm/discard the association of such a remarkable stellar feature with any of the components of the Milky Way.
2 Observations and cross-match with Gaia
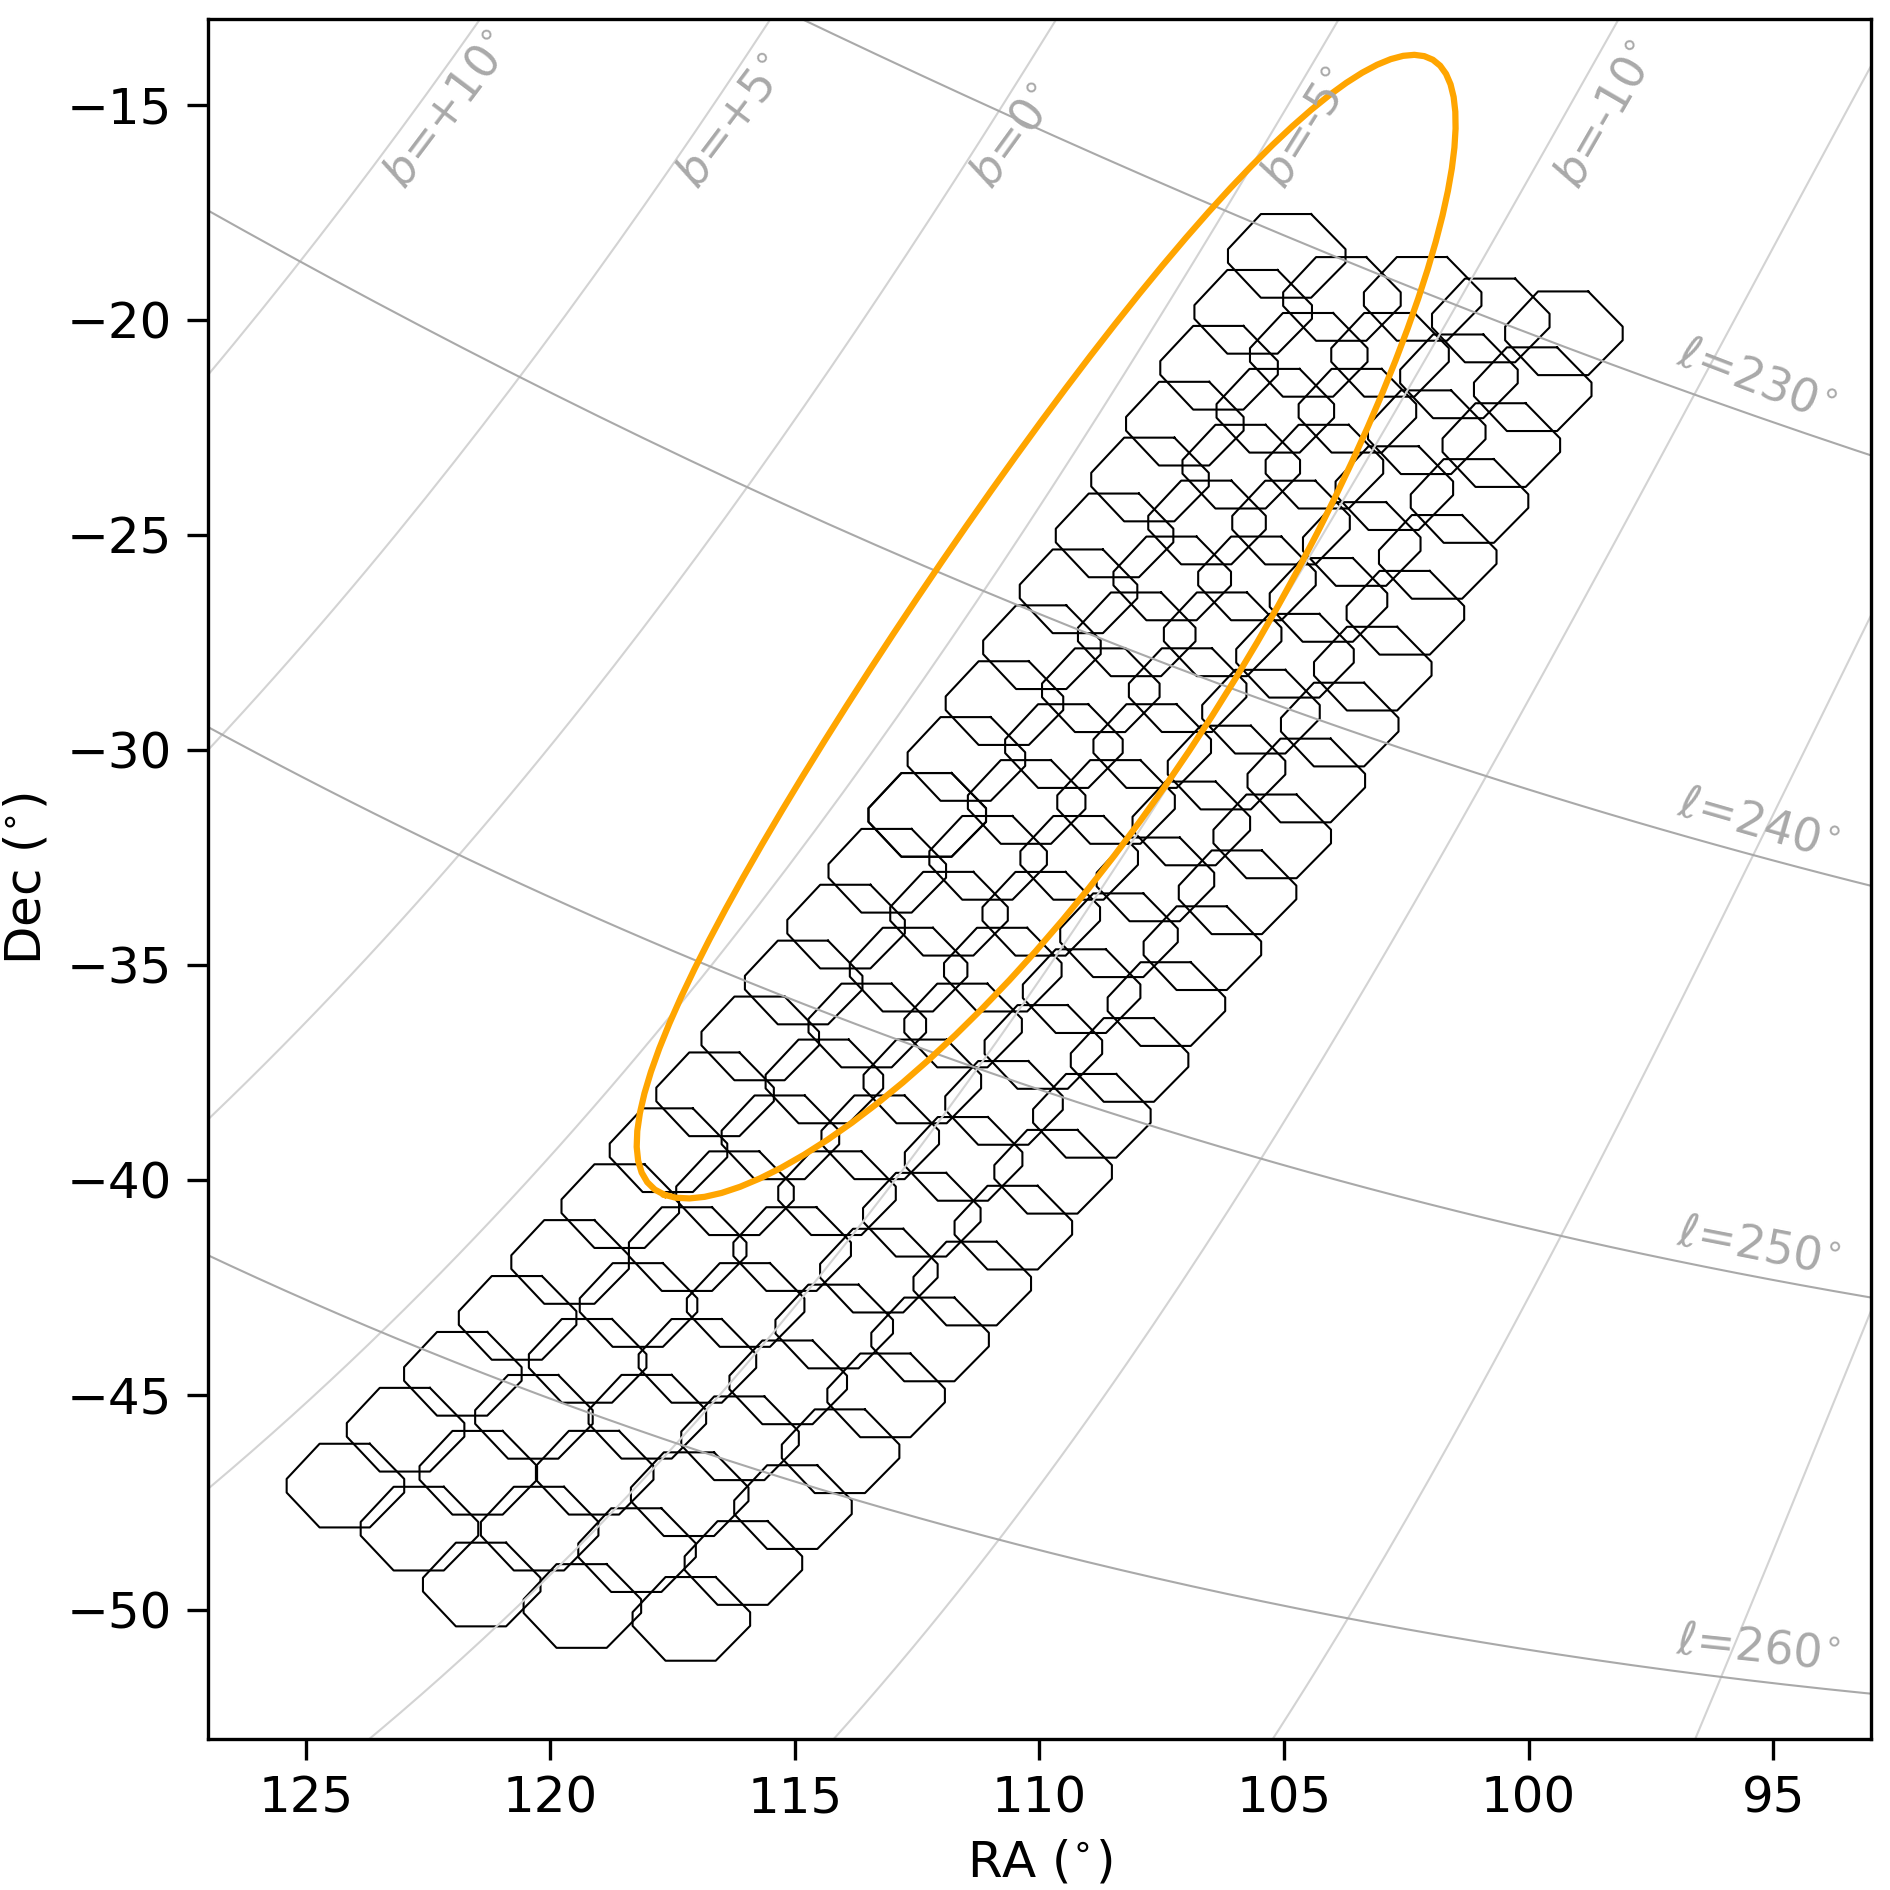
We have surveyed a region in the sky containing CMa using the Dark Energy Camera (DECam), which is mounted at the prime focus of the 4-m Blanco telescope at Cerro Tololo Inter-American Observatory (CTIO). DECam provides a 3 deg2 field of view with its 62 identical chips with a scale of 0.263 arcsec pixel-1 (Flaugher et al., 2015). The area to explore was confined to and , as shown in Figure 1. The exposure time was 20 s both for the and bands. A total of 115 DECam fields were observed in a single night (08.01.2014; proposal ID # 2013A-0615) with stable seeing conditions. We also observed 5 Sloan Digital Sky Survey (SDSS) fields at different airmasses to derive the atmospheric extinction coefficients for that night and the transformations between the instrumental magnitudes and the system.
The images were processed by the DECam Community Pipeline (Valdes et al., 2014) and accesed via the NOAO Science Archive. The photometry was obtained from the images with the PSF-fitting algorithm DAOPHOT II/ALLSTAR (Stetson, 1987). The final catalog only includes stellar-shaped objects with to avoid the unavoidable pollution by background galaxies and non-stellar sources. We also used DAOPHOT II to include in our images synthetic stars with magnitudes in the range and in order to estimate the completeness of our photometry. We applied our photometry pipeline with these altered images and the limiting magnitude was set at that of the synthetic stars that are only recovered in 50 of the cases. For and bands, the limiting magnitude in our catalogs are 20 mag and 20.5 mag, respectively. Extinction coefficients have been derived111https://github.com/kbarbary/sfdmap from Schlafly & Finkbeiner (2011) dust maps and we adopted the multiplicative coefficients estimated by the Dark Energy Survey collaboration ( and ; Abbott et al., 2018).
The European Space Agency (ESA) mission Gaia will provide precise positions, kinematics and stellar parameters for more than one billion stars aiming to understand the origin and evolution of our own Galaxy (Gaia Collaboration, 2016). So far, the second data release (Gaia Collaboration, 2018) has provided the five-parameter astrometric solution (positions, proper motions and parallaxes), making it possible to explore the structure of the Milky Way with unprecedented detail. In order to include this precious information in our final photometric catalog, we crossed-match our DECam results with the Gaia DR2 database.
Among the available information for each source, we ensure a good quality photometry and astrometry by using the excess factor, which measures the excess of flux in the and integrated photometry with respect to the band, and the number of visibility periods used in the astrometric solution, i.e., the number of distinct observation epochs. For this work, only those sources in Gaia with phot_bp_rp_excess_factor 1.5 and visibility_periods_used 5 were considered. We also adopted the formalism of the renormalized unit weight error (RUWE; Lindegren, 2018) and we assumed that only objects with RUWE 1.4 have an acceptable astrometry. Despite the slightly shallower photometry provided by that mission, only an average of of objects per field lack Gaia counterpart satisfying the conditions described above. Therefore, our DECamGaia dataset is almost identical to our initial photometry, with a final sample of stars of 11,663,496 stars. We have used the Gaia extinction coefficients provided by Gaia Collaboration (2018) and the photometric errors were computed using , where and are the error in the flux and photometric zeropoint, respectively (Evans et al., 2018).
3 Results and discussion
3.1 Tracing the Canis Major structure with Blue Plume stars in the DECam photometry
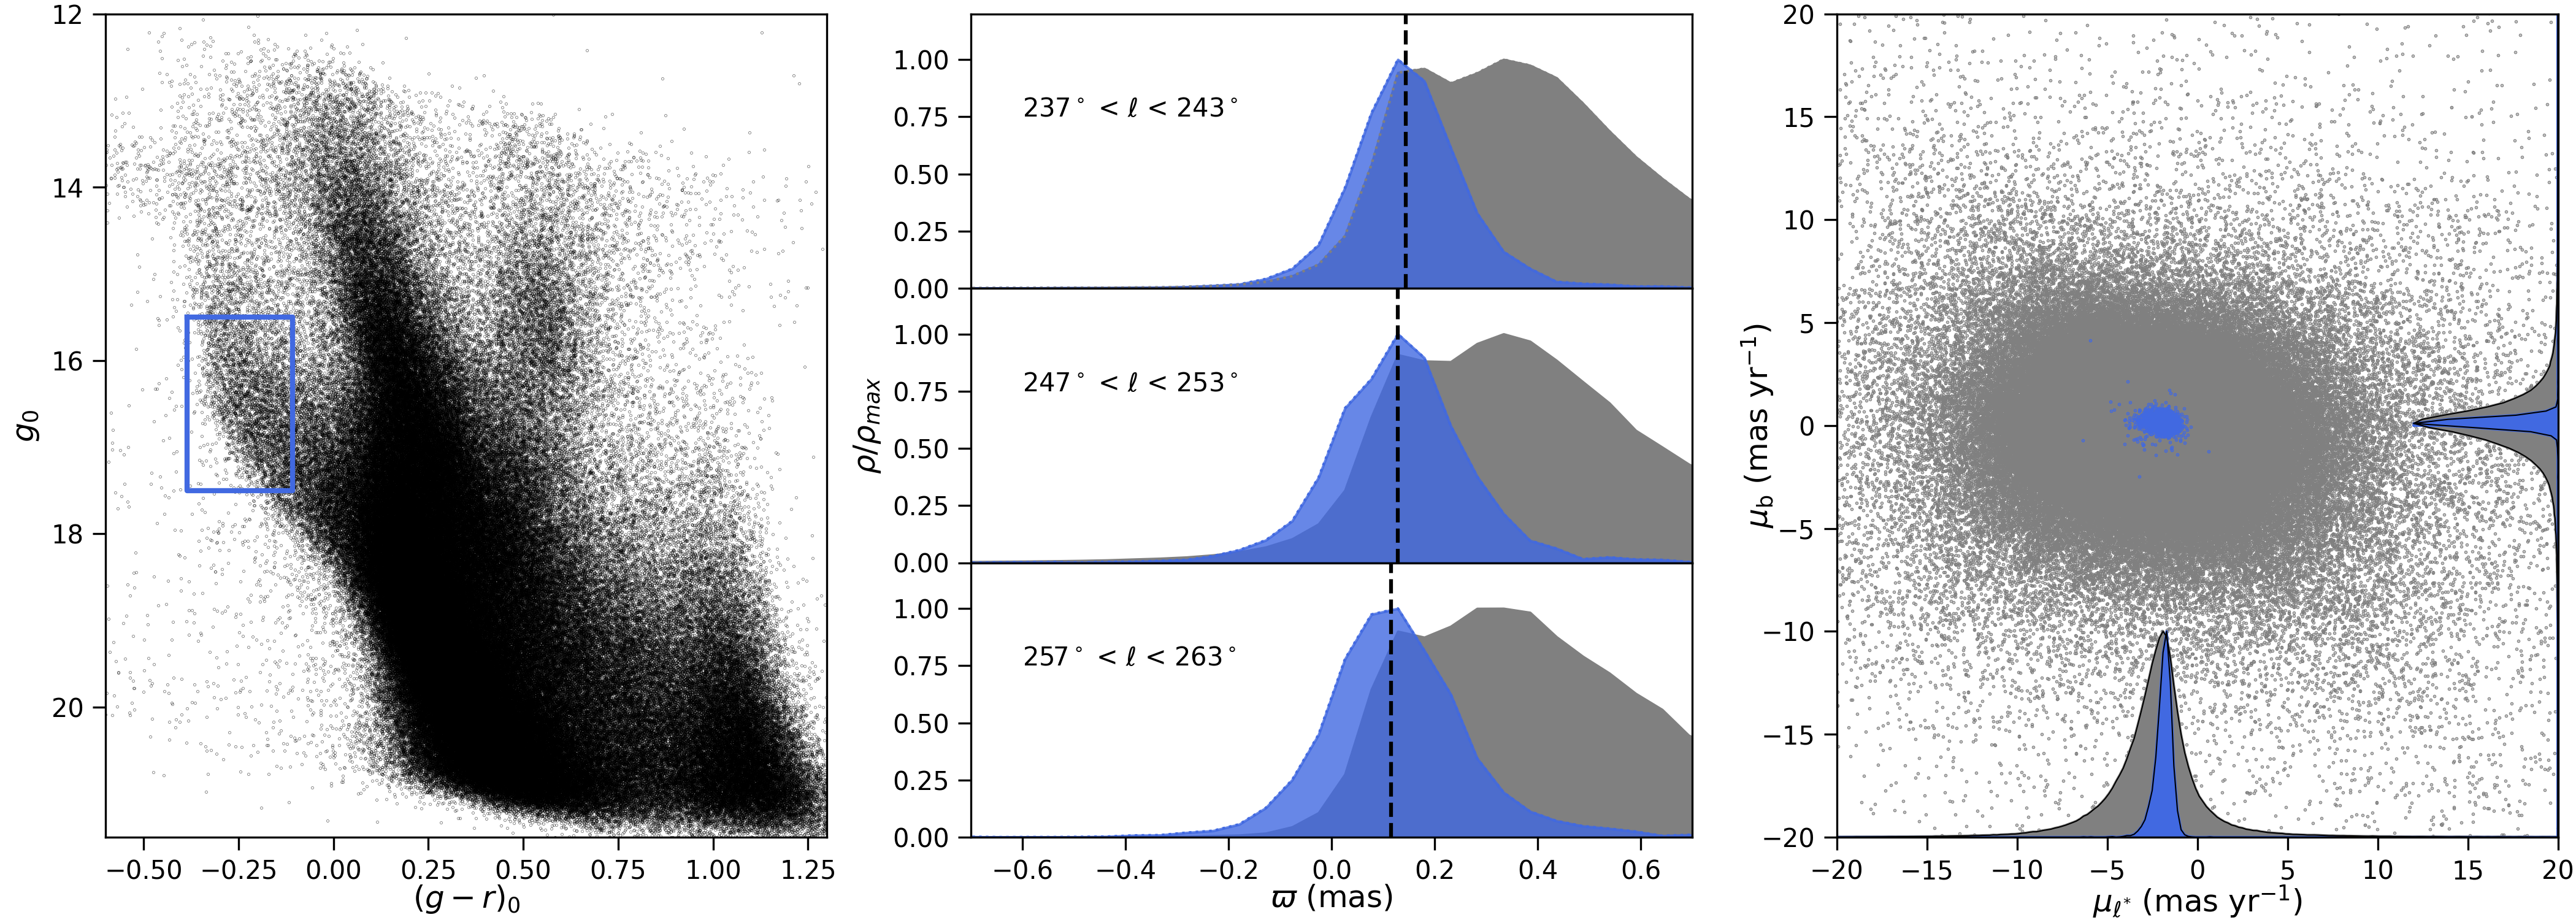
BP stars have been considered the best stellar tracers of the presence of CMa in the third Galactic quadrant. Indeed, in the CMD contained in Figure 2 corresponding to the center of the overdensity ( , according to the red-clump (RC) stars distribution obtained by Bellazzini et al., 2006), a feature composed of blue stars is observed in the ranges and . BP stars are very bright and significant bluer than the rest of foreground and background Milky Way population. This enables to use them as excellent tracers of the possible CMa population across the full sky, being also ideal targets for follow-up spectroscopy studies (even with intermediate-size telescopes) to derive their kinematics and chemical abundances. In order to obtain a sub-sample of CMa star candidates based on the proper motions and parallaxes provided by Gaia, we have selected the BP stars with , , and . Since hot subdwarf stars are the only possible polluters in this region of the CMD, we have checked that none of our BP stars are found in the Geier et al. (2019) catalogue. The selected section of the CMD is indicated in the left panel in Figure 2.
3.1.1 Parallaxes and distance
Parallax and distance are two related variables but they do not follow a linear function. Thus, inferring the distance from the angular parallax, either for individual stars or for coherent and compact stellar systems is not an easy task. With the publication of Gaia’s data this topic has received a lot of attention, and one can find numerous works in recent literature where various methods are proposed to estimate the distance from parallax and its error’s distribution (i.e. Lindegren et al., 2018; Luri et al., 2018; Bailer-Jones et al., 2018; Chen et al., 2018; Maíz Apellániz, 2019, among others).
The parallaxes catalogued in Gaia DR2 seem to be too small. The analysis of the zero-point correction provides different results depending on the type of objects studied (Lindegren et al., 2018; Maíz Apellániz, 2019; Chan & Bovy, 2020), their location within the Galaxy (Arenou et al., 2018), the spatial coherence of the sample (Khan et al., 2019), the apparent magnitudes (Arenou et al., 2018), or their photometric colors (Chen et al., 2018; Chan & Bovy, 2020). Most of these corrections are between 0.03 and 0.05 mas. We have corrected the listed parallaxes by a constant zero point of 0.04 mas, which is a representative value of the proposed zero-points distribution and coincides with the one suggested by Maíz Apellániz (2019) for the OB stars in the GOSSS catalogue. The same happens with the parallax error in Gaia DR2 that only reports the internal precision. A correction for the catalogued errors is given by the equation , where 1.08 and mas for stars with G 13 mag, as recommended by Lindegren et al. (2018).
We have obtained the parallax distribution for all the stars in the field brighter than and the BP stars, weighted by their error (), and using a bin size of mas. Although for single objects negative parallaxes make no physical sense, their removal from the analysis of a stellar system would bias the parallax distribution yielding erroneous estimates of its statistical moments (e.g. see Luri et al., 2018). Selection by parallax internal precision could also introduce some bias hard to detect and remove in most cases. We thus have made use of the complete photometric sample, just pruned from Gaia bad quality data choosing those objects matching the RUWE condition described in Section 2.
The resulting distributions are shown in the upper middle panel of Figure 2. While most of the field stars are concentrated in the mas, peaking at mas, the distribution for BP stars shows a fairly symmetrical distribution where mode, median, and mean are centred around 0.14 mas, thus suggesting the presence of a well differentiated substructure along this line of sight. Two-sample Kolmogorow-Smirnov and Wilcoxon tests show that both samples represent different statistical populations in term of parallaxes, at a confidence level of 99. The error in the weighted mean, for our selected BP stars, can be approached by (Chen et al., 2018). That error is 0.00008 mas, too low to be representative of the central parallax total uncertainty. The Gaia parallax zero-point correction applied here has taken into account only the blue color of these objects and choosing as a representative value the one given by Maíz Apellániz (2019) for OB stars. However, other authors propose a value of 0.03 mas for the same spectral-type stars. These approaches lead us to suggest that a more realistic estimate of the uncertainty in the obtention of the central parallax for CMa BP stars is not under 0.01 mas. We conclude that the population traced by the BP stars is located at an average distance of 7.1 kpc, which is in good agreement with the values previously reported ( kpc, Martin et al., 2004; Martínez-Delgado et al., 2005; Bellazzini et al., 2006; Butler et al., 2007). We repeat this procedure for two additional Galactic longitude ranges, which show similar distributions, as shown in the central panel in Figure 2 and derived the following heliocentric distances: 7.8 kpc () and 9.0 kpc (). Therefore, the substructure traced by BP stars is observed throughout the full region observed with DECam, , and it is confined in the section of our DECamGaia catalog.
3.1.2 Proper motions
Once we have analyzed the spatial distribution of BP stars along the line of sight towards the central region of CMa, we proceed to derive mean proper motions for the bulk of CMa stars by using the same blue stars as reference. Proper motions have been transformed to the Galactic system using the equations found in Poleski (2013). As shown in the right panel in Figure 2, BP stars are concentrated in the () plane around mas yr-1 and mas yr-1, where the quoted error means for the standard deviation of the distributions. The mean values obtained for the BP stars are slightly shifted with respect to the ones derived for the complete sample, and with a smaller standard deviation, thus proving that BP stars in the CMa field are concentrated on both parallax and proper motions variables and represent a well-defined stellar population in the Gaia astrometric space.
In order to better draw the contours of this population in the 3D space defined by proper motions and parallax, we have obtained the Spectrum of Kinematic Grouping (SKG) for the BP stars. This method was developed by Alfaro & González (2016) to analyse spatial groupings of stellar radial velocity in star-forming regions, and has been applied to the search for kinematic substructures in selected regions, including NGC 2264 (González & Alfaro, 2017), Cyg OB1 (Costado et al., 2017), and Monoceros (Costado & Alfaro, 2018). This method is based on that developed by Allison et al. (2009) with the contributions of Maschberger & Clarke (2011) to analyse the mass segregation in stellar clusters and star-forming regions. Basically, it consists in sorting the variable to be analysed, parallax in our case, and splitting the sample into Nint intervals of the same number of Ndat data, which are initially taken as Ndat = . For each parallax interval, the median of the Minimum Spanning Tree (MST) edges is calculated and compared with the same value obtained for a random selection of Ndat points extracted from the sample. If the median of the random selection is significantly greater than that of the analysed interval, we say that this parallax presents a grouping in the Vector- Point Diagram (VPD). The ratio between the median of the MST edges of the random sample and that of the corresponding interval () has to be greater than 1 (at least with a 2 confidence interval) to consider that the representative parallax of that interval is segregated. The specifics of the method and its application can be seen in more detail in Alfaro & González (2016) and Alfaro & Román-Zúñiga (2018).
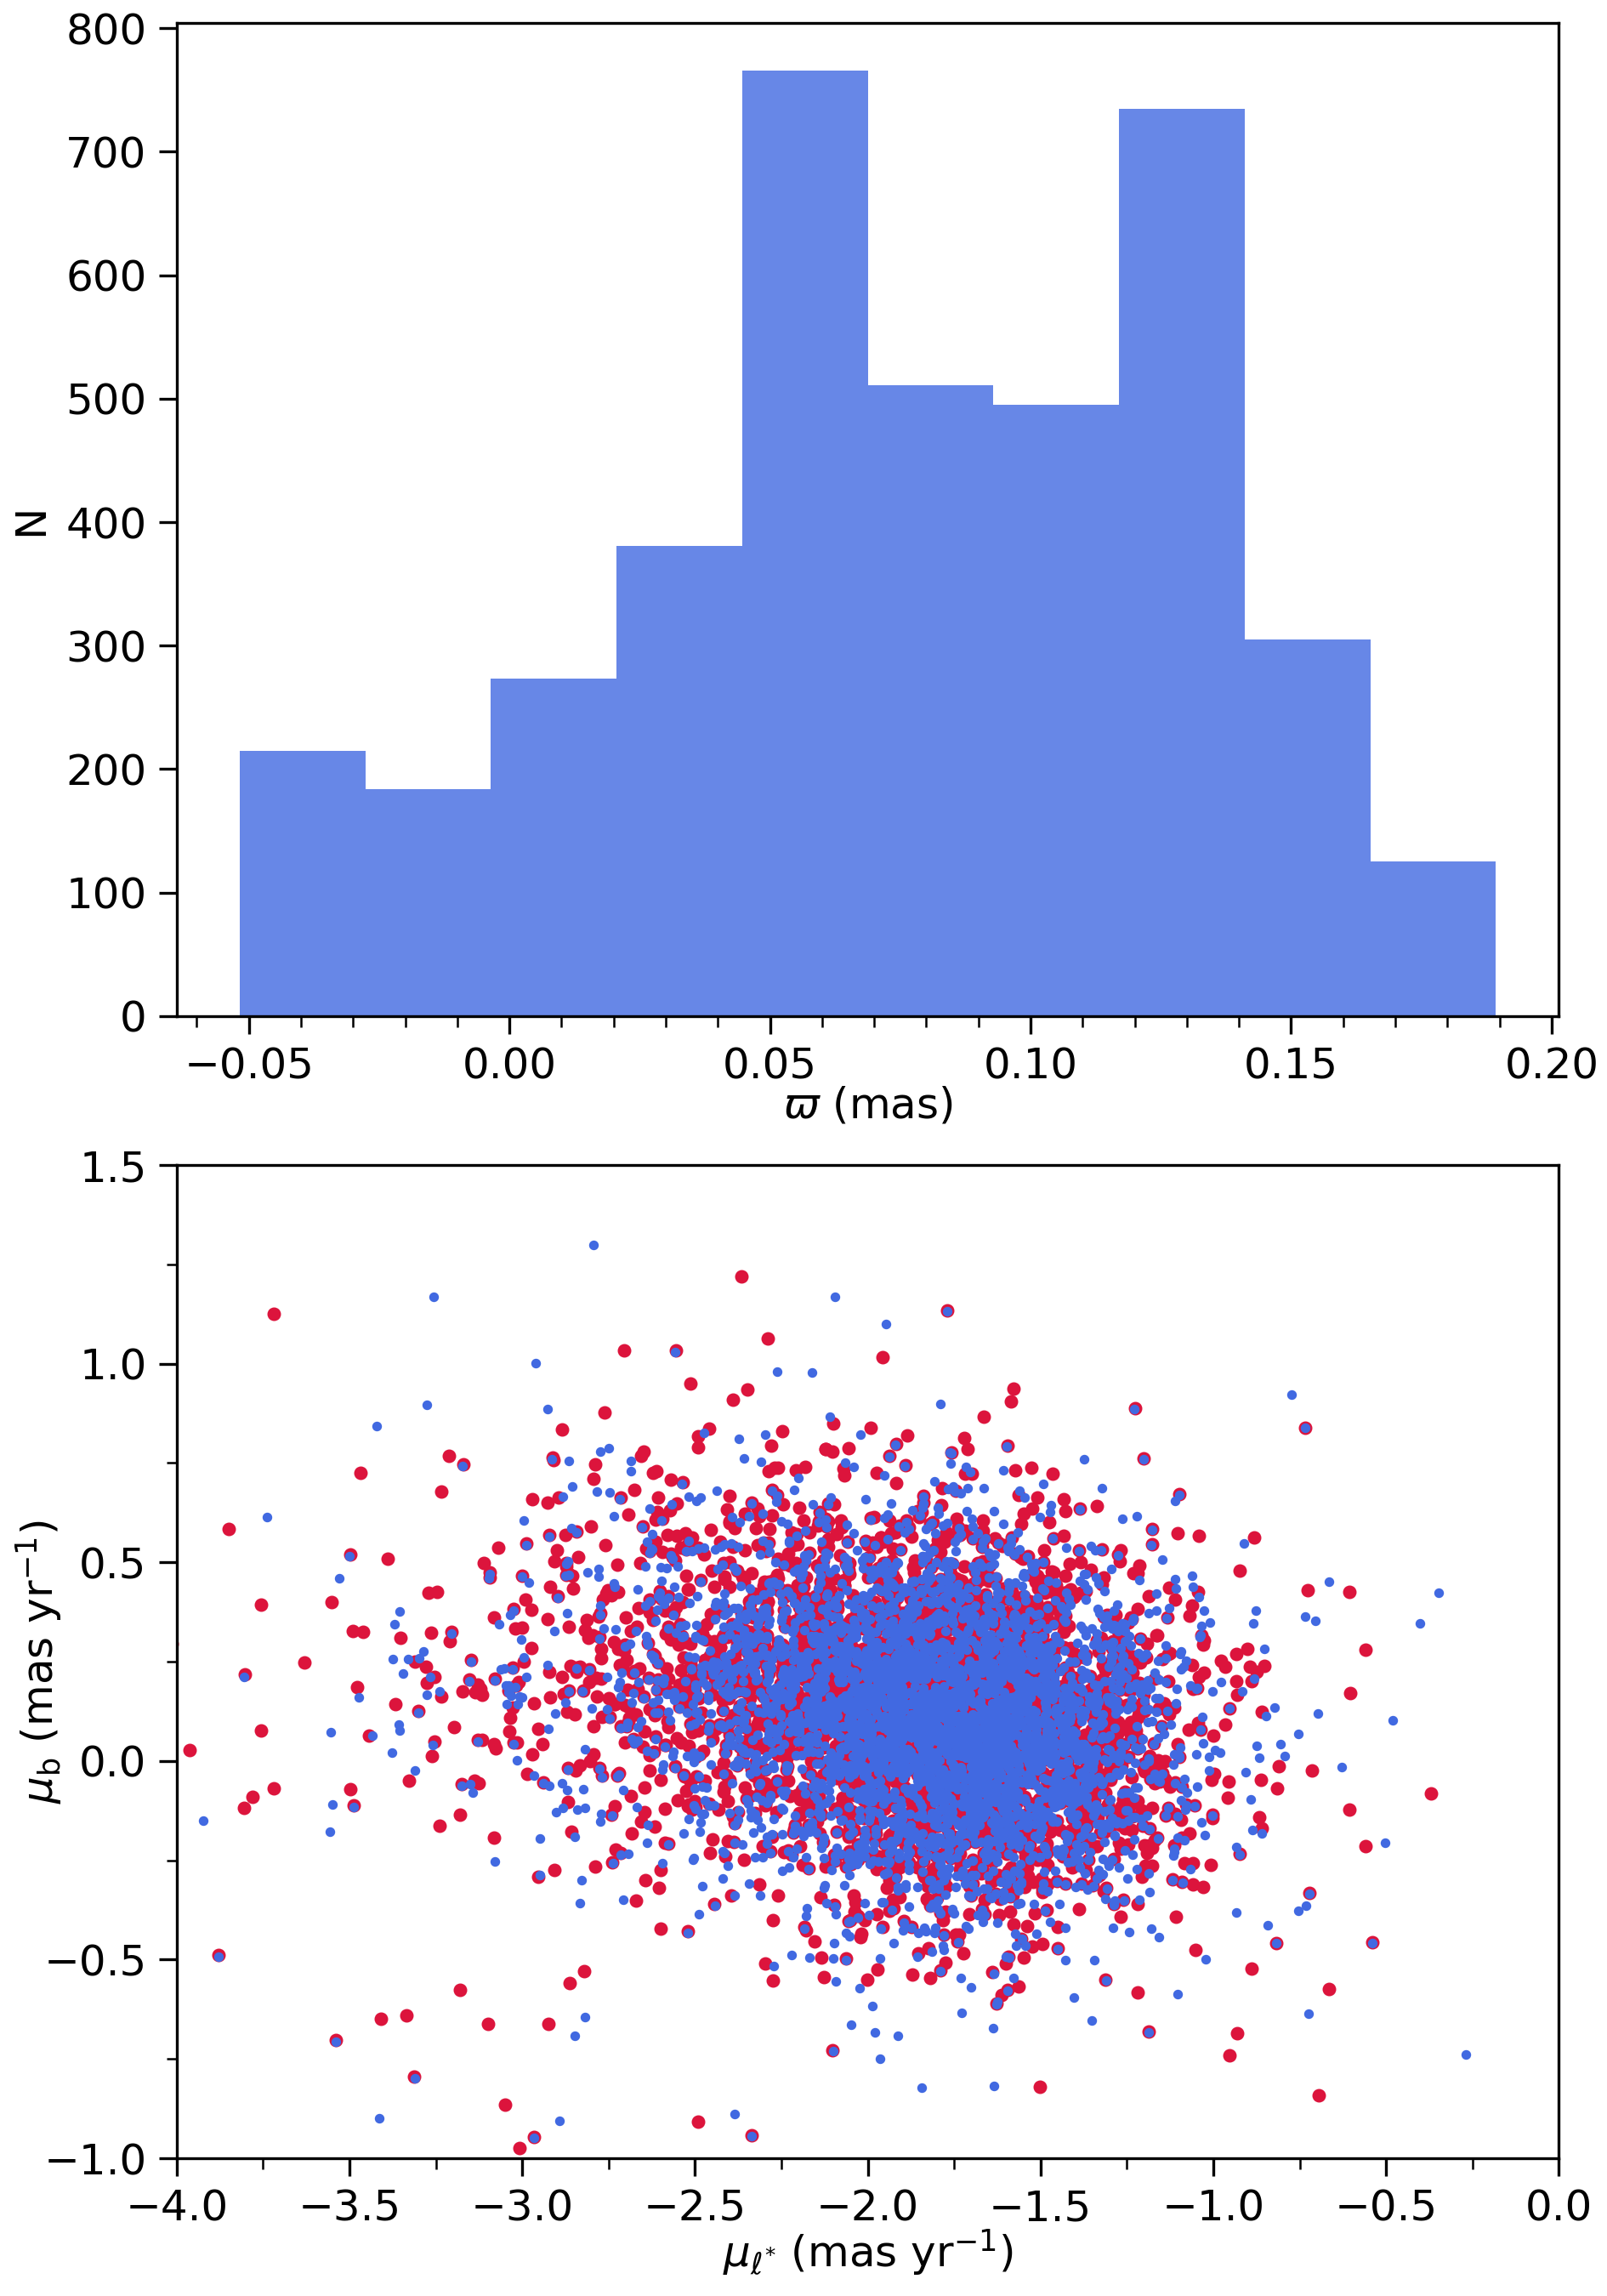
For the SKG analysis of the BP stars in and , we have chosen bins of 120 objects with an overlap of 30 between two consecutive intervals. If we select the bins with > 1 we find that the stars in those bins ( 4000) show a bimodal distribution with two maxima peaking at 0.12 and 0.06 mas (see upper panel in Figure 3). The VPD of the SKG selected stars is shown in the lower panel in Figure 3, where a non-circular structure with a greater elongation in the axis is manifested. It should be noted that SKG analysis points to the existence of concentrations in the 3D space formed by the proper motions and parallaxes, but it does not perform a membership analysis, so this diagram may be contaminated by a few stars located very far from the central values of the 3D distribution.
SKG analysis of the selected BP stars modifies the parallax distribution obtained for the initial sample. The main difference is its bimodal character and that the peaks’ parallaxes are lower than the weighted average value found for the total sample of BPs. There appears to be two concentrations of BP stars with coherent motions that are further apart from the Sun than the previous estimate for the distribution of BPs selected only by their position on the CMD. Taking into account the possible biases that can be introduced into the transformation of parallaxes to distances, we will adopt here 8 and 16 kpc as the most probable value for the distances of the BP concentrations, with a total error of not less than 2 kpc, based on the position of the maximums and their widths. The most distant of these components might be associated with the farthest stars detected by Carraro et al. (2017) during a study of BP stars in the neighbourhood of the sky area covered by our DECamGaia data. It is difficult to realistically assess the global uncertainty (precision and bias) of these estimates, but our analysis shows a clear fact, not to be missed on how to perform the transformation between parallaxes and distances: there are two localized concentrations at different parallaxes (distances), both farther from the Sun than the 7.1 kpc determined as the most representative value for the whole sample of BPs.
3.1.3 Spatial distribution
If CMa is composed of the remnants of an accreted dwarf galaxy, the young and bright BP stars would be clustered towards its densest and central regions (see e.g. Phoenix dwarf and Antlia dwarf irregular galaxies; Aparicio et al., 1997; Martínez-Delgado et al., 1999). The density map shown in Figure 4 was built by counting BP stars with and matching the selection criteria in proper motions derived above, for which we assumed a distance of = 8 kpc. The CMa overdensity, more specifically its hypothetical core, spans in Galactic longitude as an asymmetrical elongated substructure with its densest section in and confined to the section of the Galaxy. Although it would be also desirable to study the complete shape of the stellar overdensity by considering MS stars, the larger errors in the proper motions provided by Gaia DR2 for sources fainter than (see e.g. Evans et al., 2018) make it difficult to properly distinguish between CMa and Galactic members in the faint end of our photometry. Even so, the spatial distribution traced by the BP stars identified in our DECamGaia survey, is compatible with the presence of a stellar system with a small dispersion along this line of sight.
3.1.4 What are the BP stars?
With the purpose of exploring the nature of the BP stars, we have chosen the brightest objects from our sample with < 16.5 mag. With this criterion, we try to ensure that these objects have photometric measurements in different public catalogues. To determine their physical properties, we resorted to the Virtual Observatory (VO) tool called Virtual Observatory SED Analyzer (VOSA: Bayo et al., 2008) that allows the obtaining of the photometric data associated with the VOSA databases and its comparison with different stellar libraries. For this particular case, we have selected the BT-COND, Kurucz, TLUSTY and Koester sets of stellar models (Kurucz, 1993; Hubeny & Lanz, 1995; Allard et al., 2012; Koester, 2010). The first two encompasses a broad set of physical parameters, where BT-COND includes the coldest objects. TLUSTY models expand to highest temperatures and Koester models stand for white dwarfs. We leave the reddening parameter free, with between 0 and 2 mag.
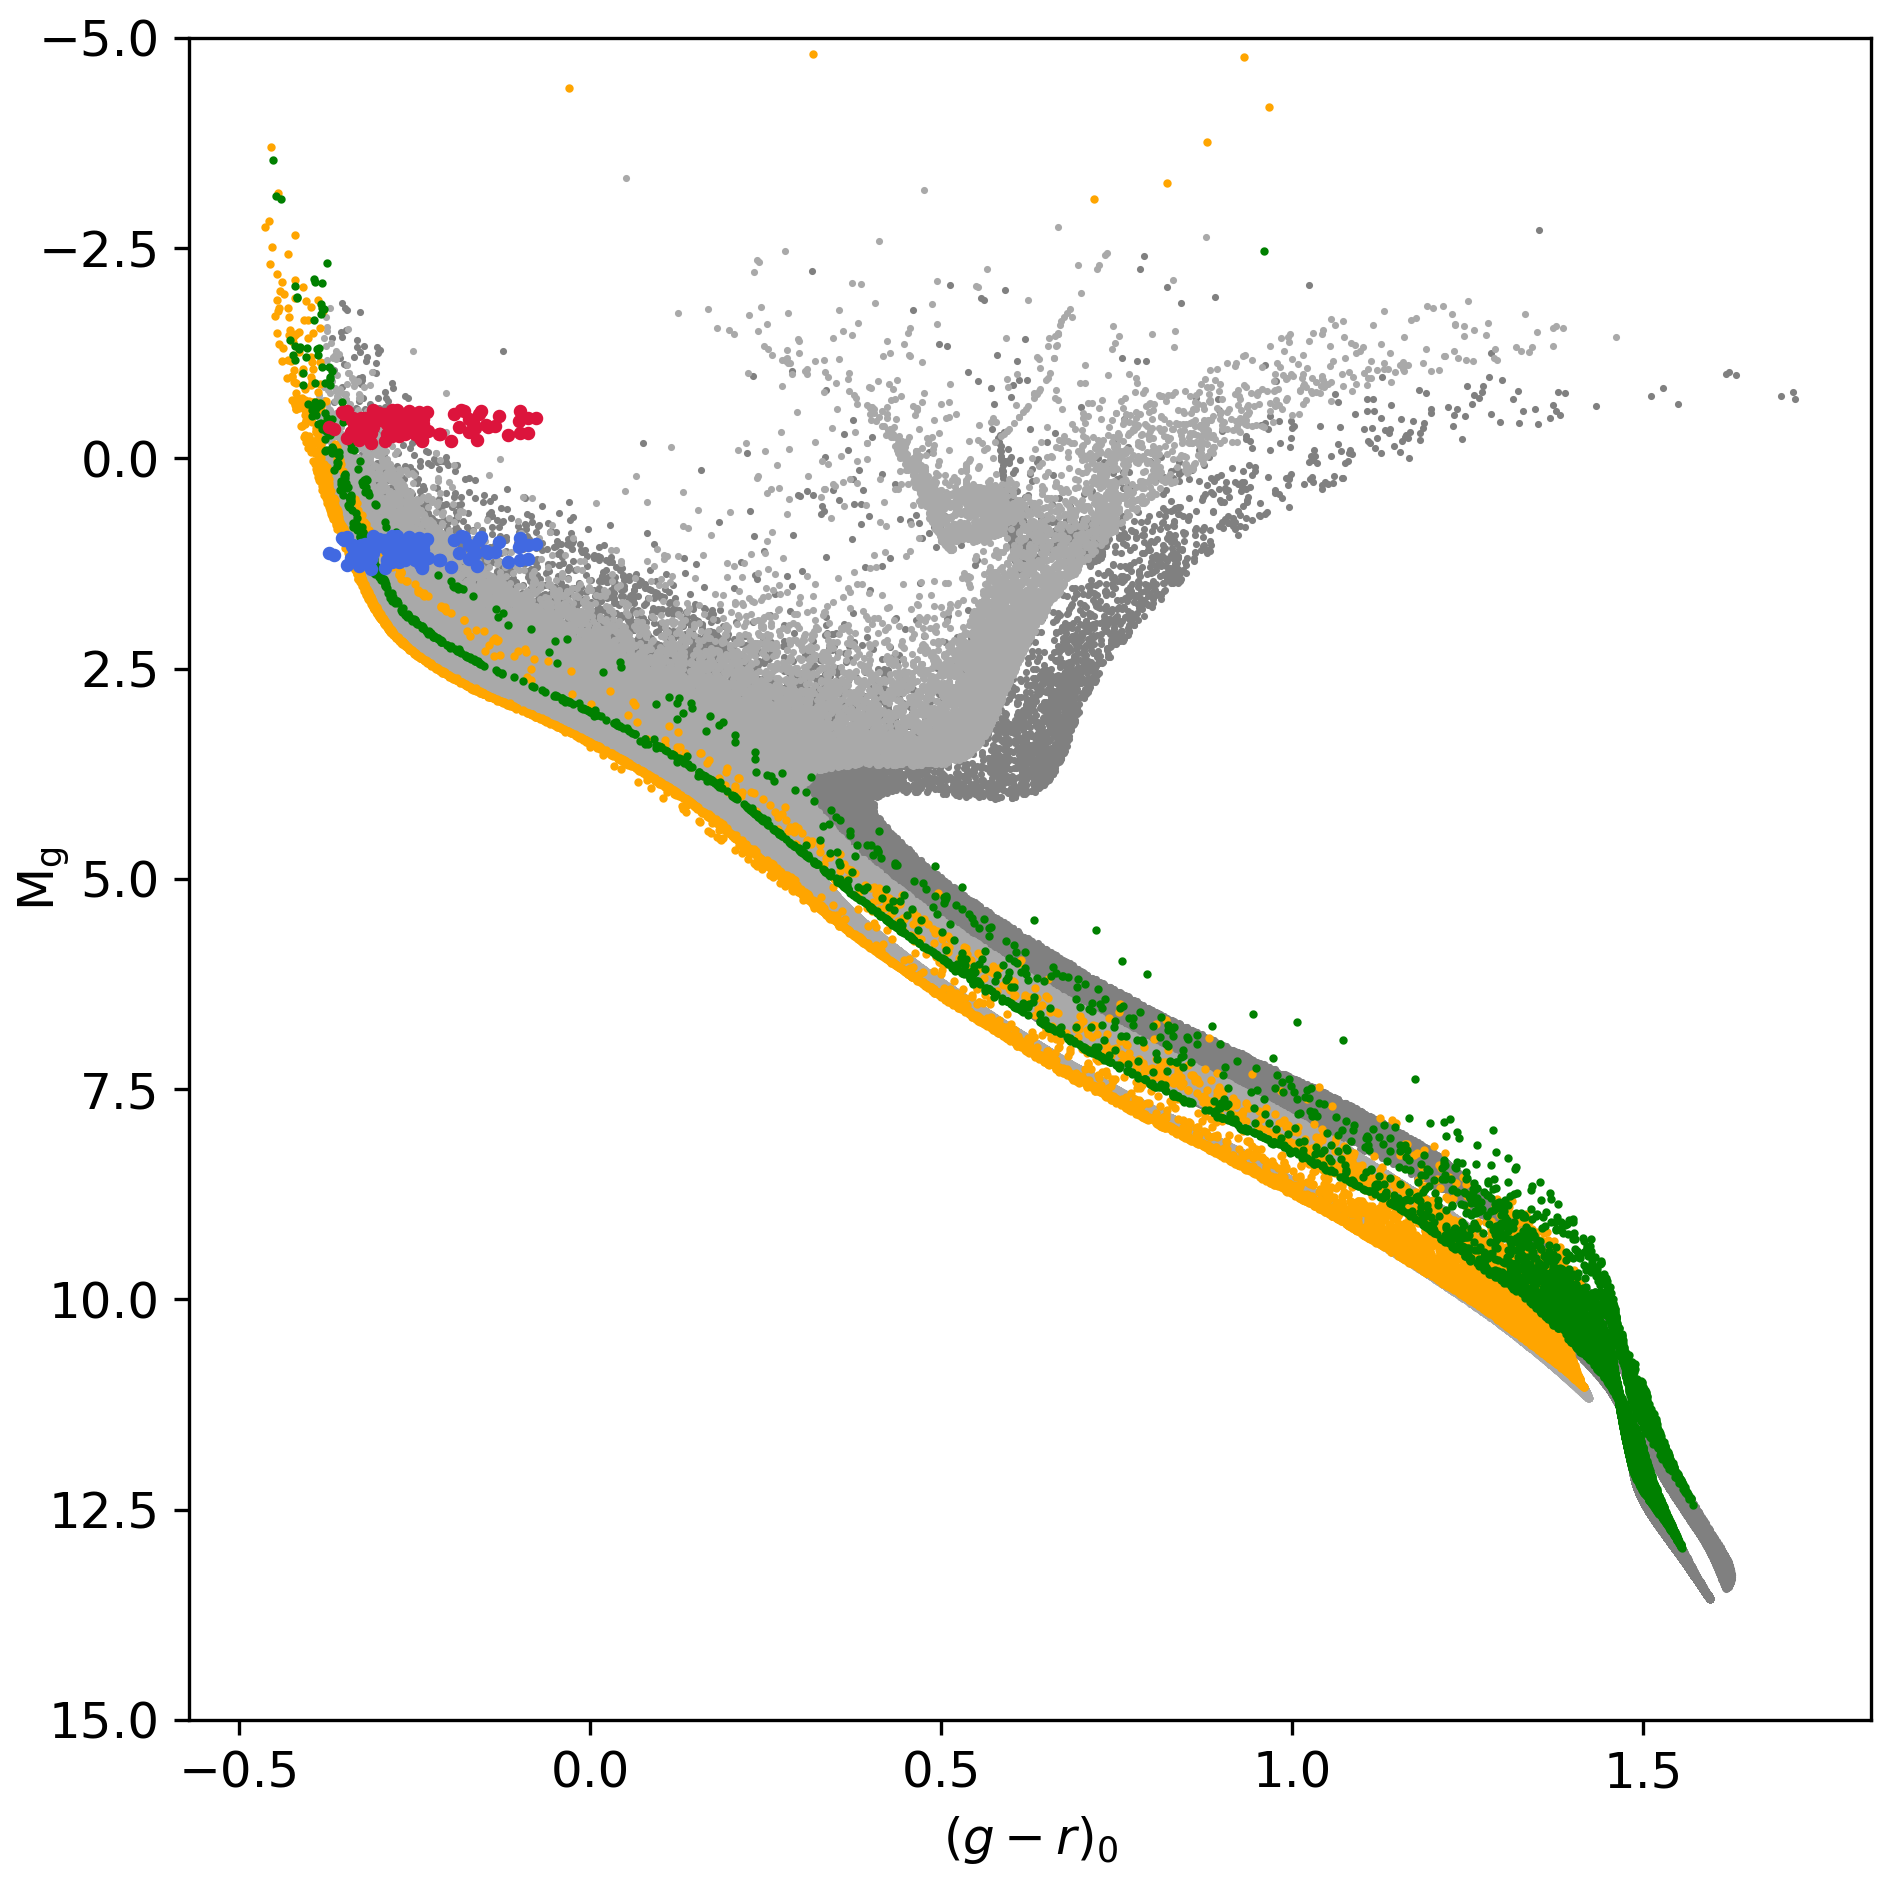
Of the 176 selected stars, VOSA finds a solution for 175 objects. From them, we have chosen those with values less than 3 and a number of fitted photometric bands greater than or equal to 12. For the 92 objects that meet these conditions, the following mean values are obtained: K, and . The ranges of values obtained expand from 7400 to 15000 K for , between 2.5 and 4.5 for and -4 and 0.5 for metallicity. The metallicity value is the one with the highest degree of uncertainty, especially if we move towards high temperatures and we have no information on the ultraviolet bands. In other words, if we leave the metallicity aside, the BP stars are subgiant and dwarf objects in a temperature range perfectly compatible with their position in the CMD at the distances estimated for the two stellar concentrations detected in this work (see Figure 5).
3.1.5 Orbit
We use the galpy package (Bovy, 2014) to compute here a tentative orbit for a sample of 100 likely CMa BP stars using the mean proper motions and heliocentric distance ranges derived in this section. The distance of the Sun to the Galactic center and its circular velocity are set to kpc and km s-1, respectively (Reid et al., 2014). The errors in our input parameters are high due the distribution observed in the proper motion space along the sky area contained in the DECamGaia survey and the intrinsic errors in our distances to the BP stars. Therefore, although the computed orbit might be enough to explore the likely in-plane rotation of this halo substructure, it is not simple to derive a well-constrained orbit of CMa with this dataset.
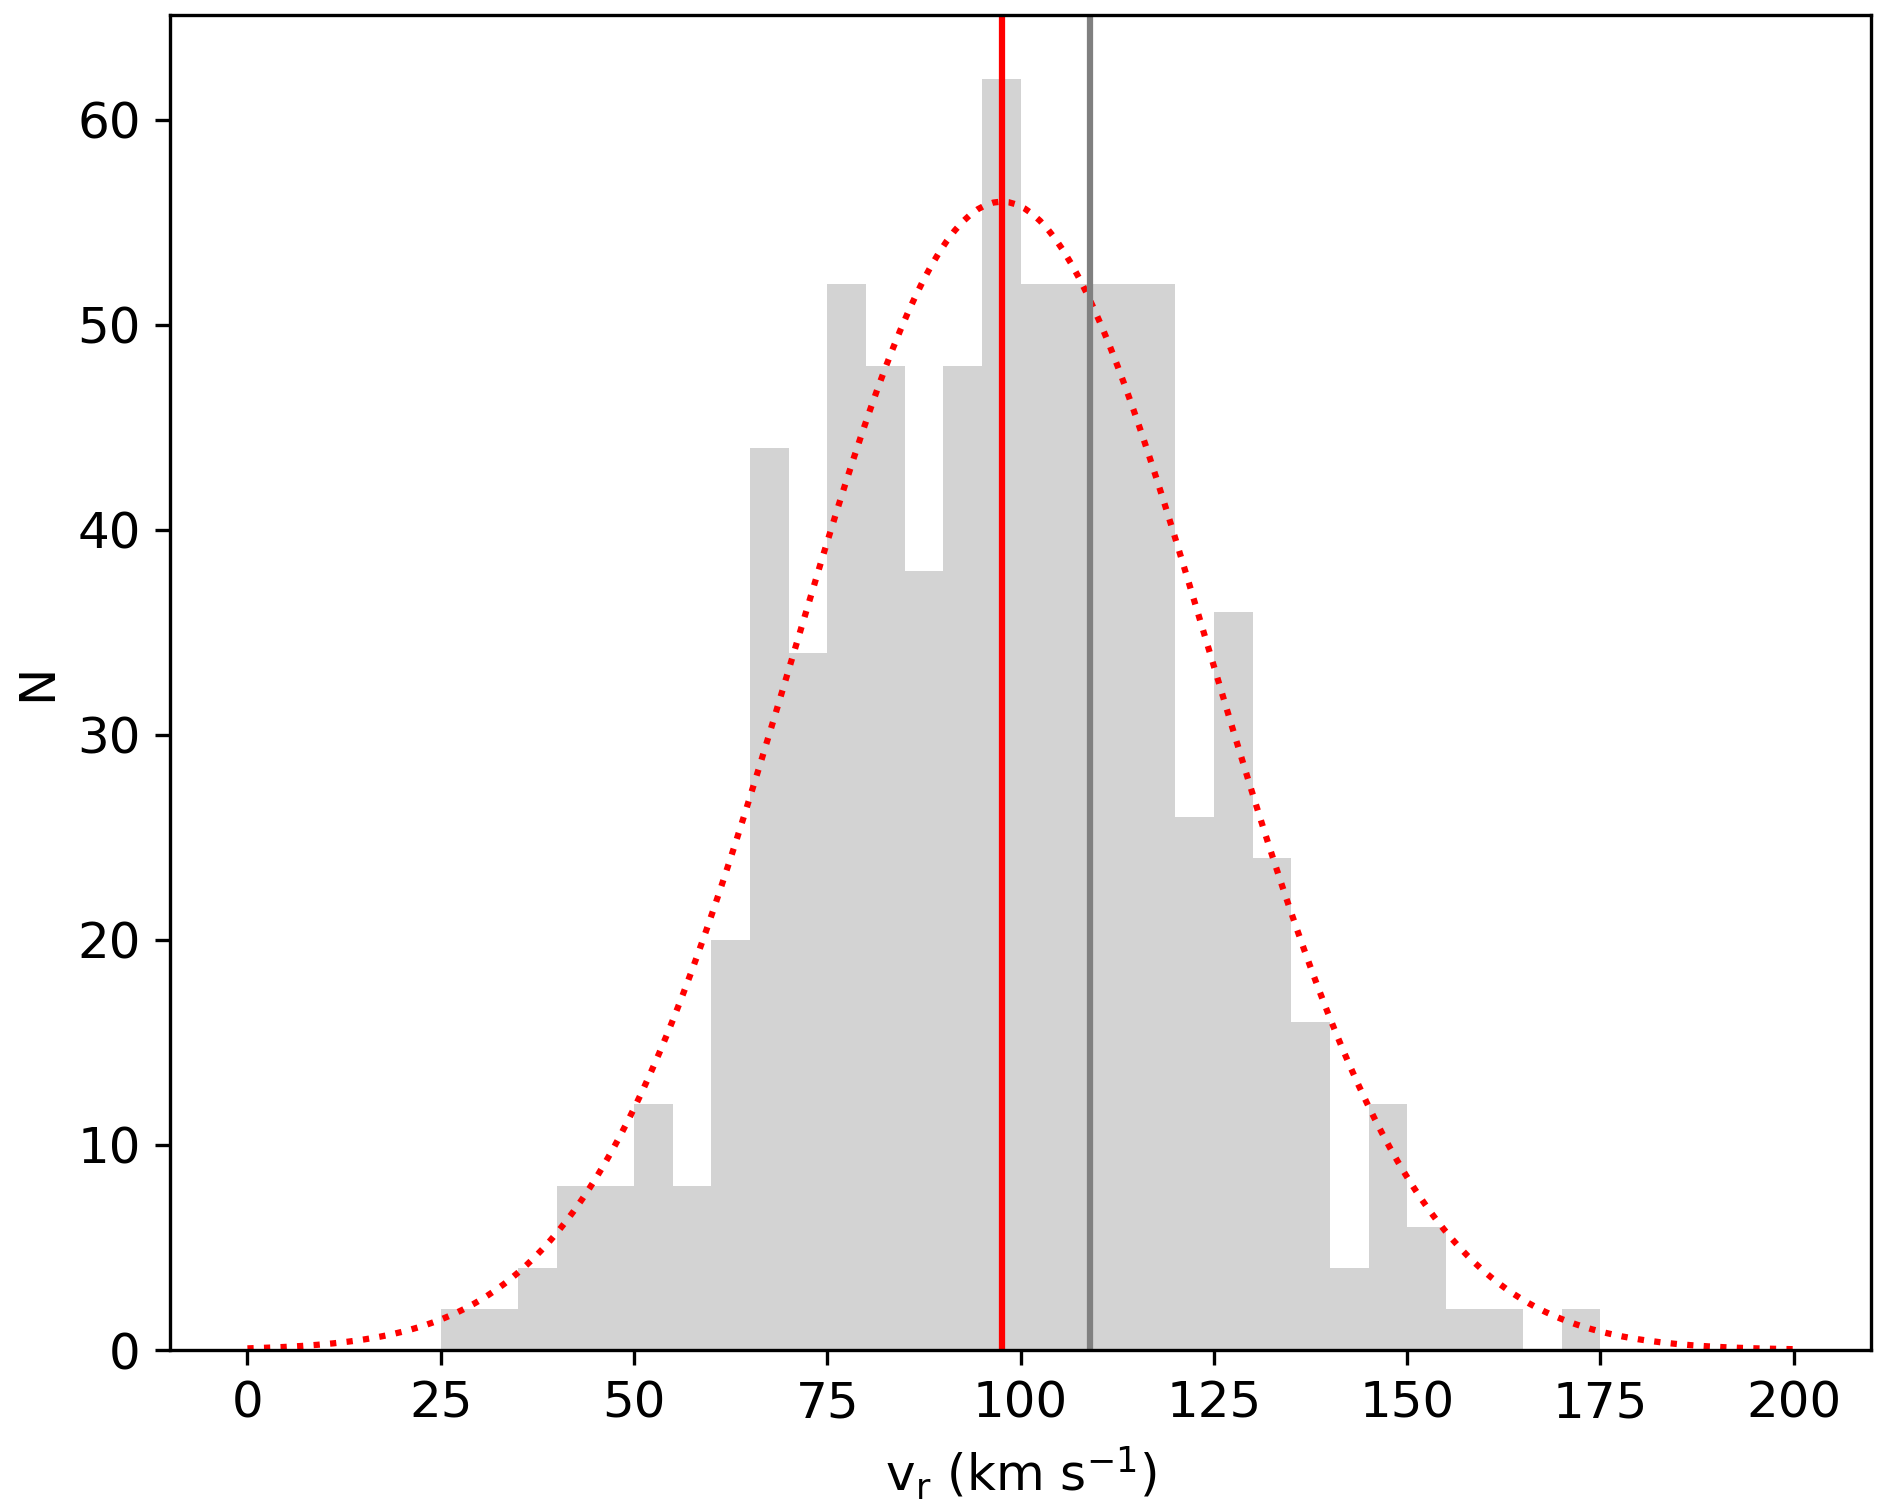
There is not radial velocities available for BP stars along this line of sight in Gaia DR2 yet, where only brighter and redder objects have measurements. For this reason, we retrieve all the objects with radial velocities available and satisfying the criteria derived above both in parallax and proper motions. The distribution of radial velocities for stars within a circle with radius centered in is shown in Figure 6. A mean radial velocity of km s-1 is obtained from the Gaussian fit of the distribution, which is similar to the value derived by Martin et al. (2004) for a sample of M-giant stars likely associated with CMa and set at km s-1, and with the mean velocity derived for a few tentative BP stars towards the open cluster Tombaugh 1 (Carraro et al., 2017). The resulting orbit for CMa moving with in a Milky Way-like potential (MWPotential2014 in galpy) has kpc, while when we compute it by assuming we obtain kpc. Therefore, the orbit of CMa as an hypothetical accreted dwarf galaxy is confined to the kpc section of the Galaxy, in contrast to the kpc derived by Dinescu et al. (2005). As for the motion of CMa perpendicular to the Galactic disk, we derive 27 km s-1 using both radial velocities, which is a value fully compatible with the on-plane rotation of the rest of Milky Way disk stars.
In summary, our analysis of the DECamGaia data confirms that CMa is a vast and coherent stellar substructure located in the inner halo in the range with a denser region containing blue and (possibly) young stars around . However, its orbit, based on its mean proper motions, is still compatible with that of the rest of Milky Way disk stars. This means that, with our photometric survey and the kinematical data available in the literature and Gaia DR2, CMa is confined to the plane and it seems unlikely a different origin for this overdensity from that of the rest of the stars along this line of sight in the Galaxy.
3.2 All-sky distribution of BP stars: the spiral structure of the Milky Way
Is CMa part of a larger Galactic component? The structure of the outer edge of spiral disks is still a matter of debate (Bland-Hawthorn & Gerhard, 2016, and references therein). In particular, for the Milky Way, some authors invoke the truncation of the disk at a Galactocentric radius of between 10 and 16 kpc (e.g. Minniti et al., 2011), while others provide evidence that both the stellar and the gas components, continuously distribute up to 20 or 30 kpc from the Galactic center (López-Corredoira et al., 2018). In the direction of our DECam photometric survey, the situation is more complicated because this area has shown some peculiarities, including i) lower levels of interstellar extinction; ii) it coincides with the direction of the maximum southern warping of the gas and the stellar component (e.g. Chen et al., 2019); iii) there is strong evidence of a flare (an increase in the height scale with the Galactocentric distance) in the distribution of stars and gas (Li et al., 2019); iv) the distribution of atomic and molecular gas shows gaps at different velocity ranges (see pioneer work by Lindblad, 1967); and v) the presence of the Monoceros halo substructure, whose nature is still unclear, has been widely confirmed (e.g. Morganson et al., 2016).
To shed more light on the origin of CMa, we proceed now to inspect for the first time its full extension in the sky making use of the () photometry provided by Gaia. We have retrieved all the information for the sources from the Gaia DR2 with phot_bp_rp_excess_factor and visibility_periods_used 5 for the section of the Milky Way with and, to avoid the crowded regions of the Galaxy, .
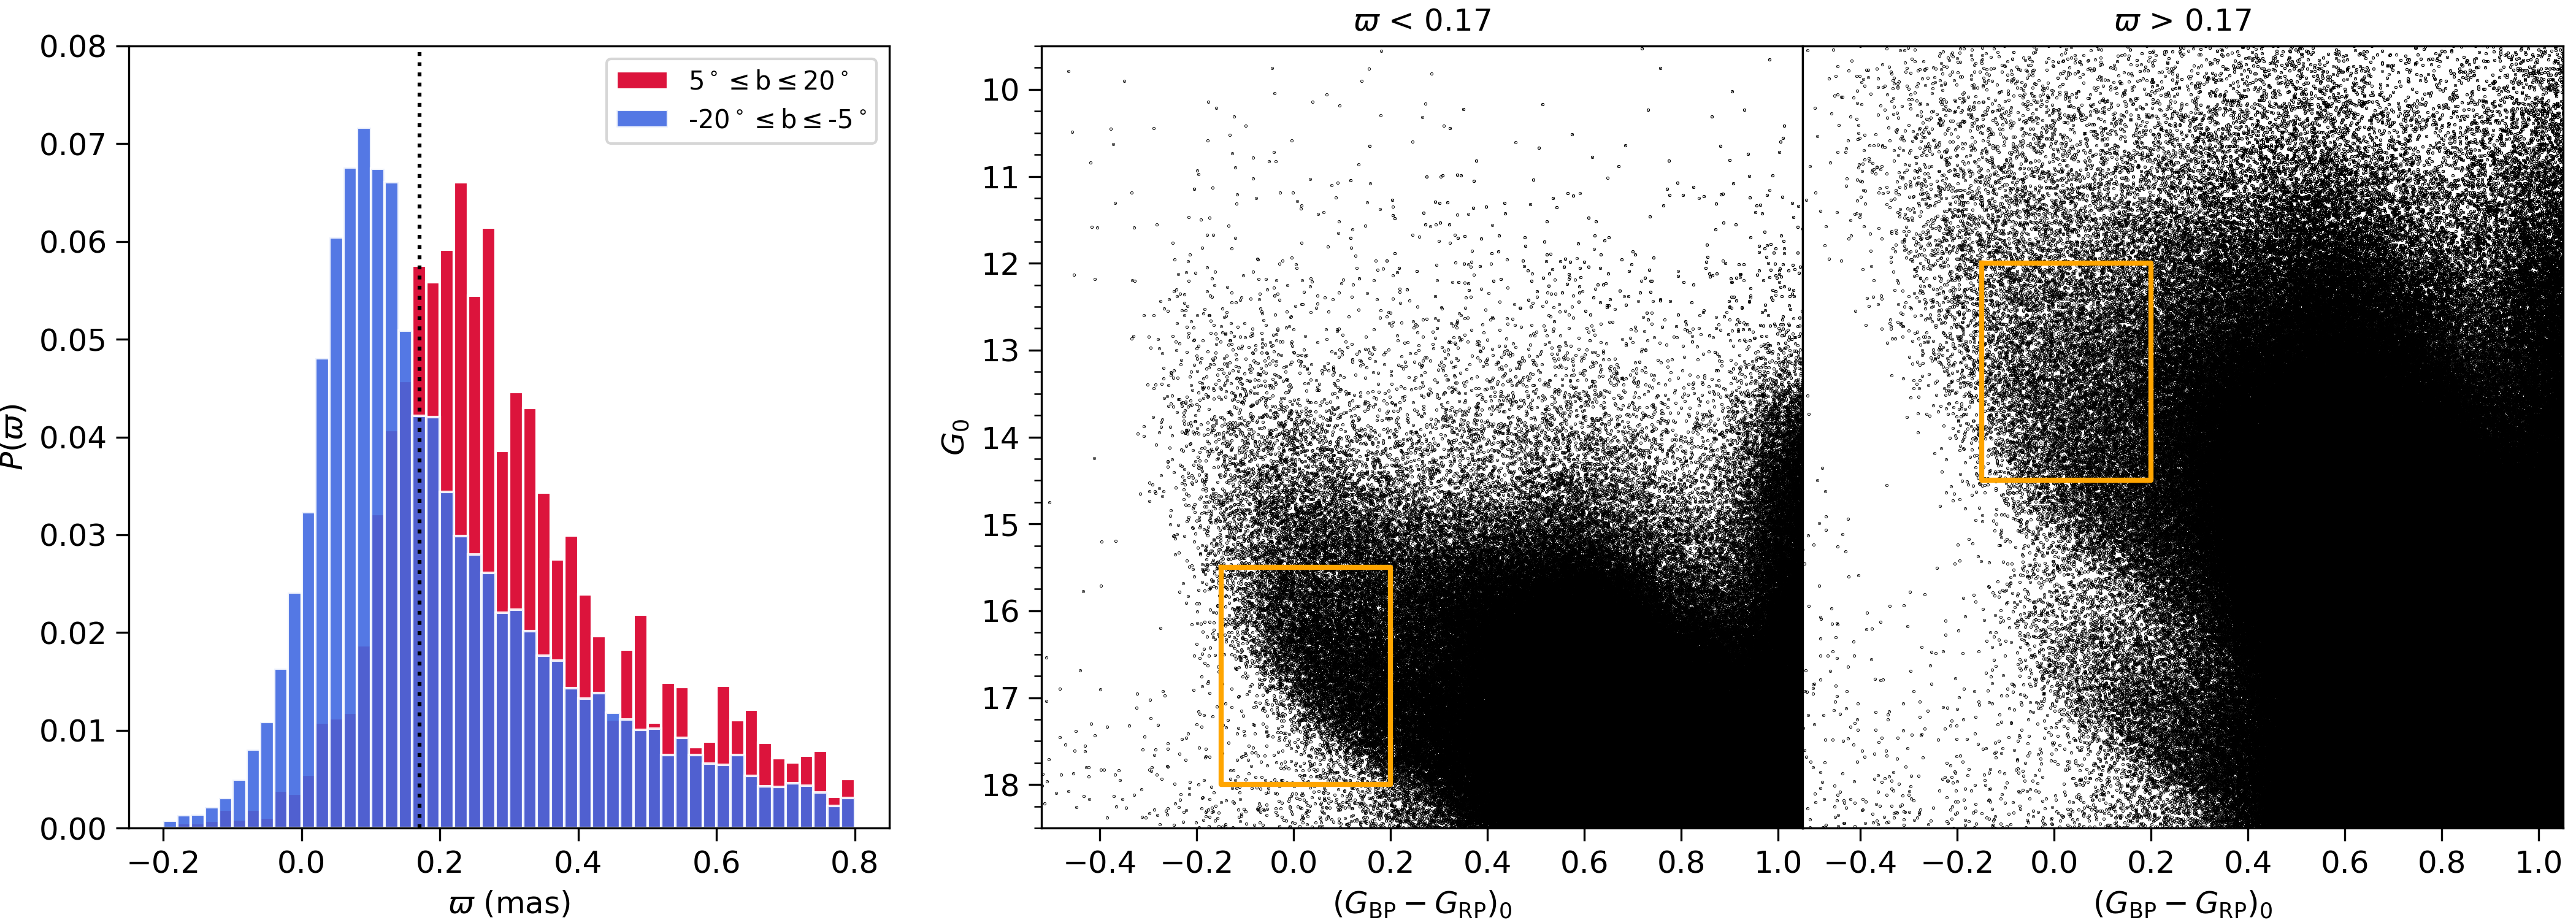
A first step is to investigate whether BP stars are only found in the CMa region or if they are also present in the northern Galactic hemisphere. We focus on the blue and bright objects found in the , section of the Galaxy with , , and . The range of magnitudes considered allows the inclusion of brighter (and likely closer) BP stars. The left panel in Figure 7 shows the parallax probability distributions for these tentative BP stars in both Galactic hemispheres, separately. Once again, the BP stars associated with CMa (without SKG analysis) peak at kpc, while the objects at positive Galactic latitudes seem to peak at kpc. When we arbitrarily split the CMD corresponding to this region into two components with parallaxes greater than or lesser than 0.17 mas, we obtained the diagrams contained in the middle and right panels in Figure 7. We recover the characteristic BP classically associated with CMa but also a brighter/closer feature, composed of stars with . This result confirms that the so-called BP stars also represent a prominent population in the northern hemisphere, but it might have been missed by previous photometric studies of the area because of their proximity to us, thus yielding in brighter magnitudes and a lower density of objects in pencil-beam surveys. We continue with our study of BP stars in the Galaxy by designing two selecting boxes corresponding to the bright and faint samples, with and respectively, and with . We have always restricted our samples to those objects with , so we avoid the presence of non-BP stars as much as possible and, given that large-scale substructures are expected to show a gradient in the proper motion space, proper motion criteria are not considered here.
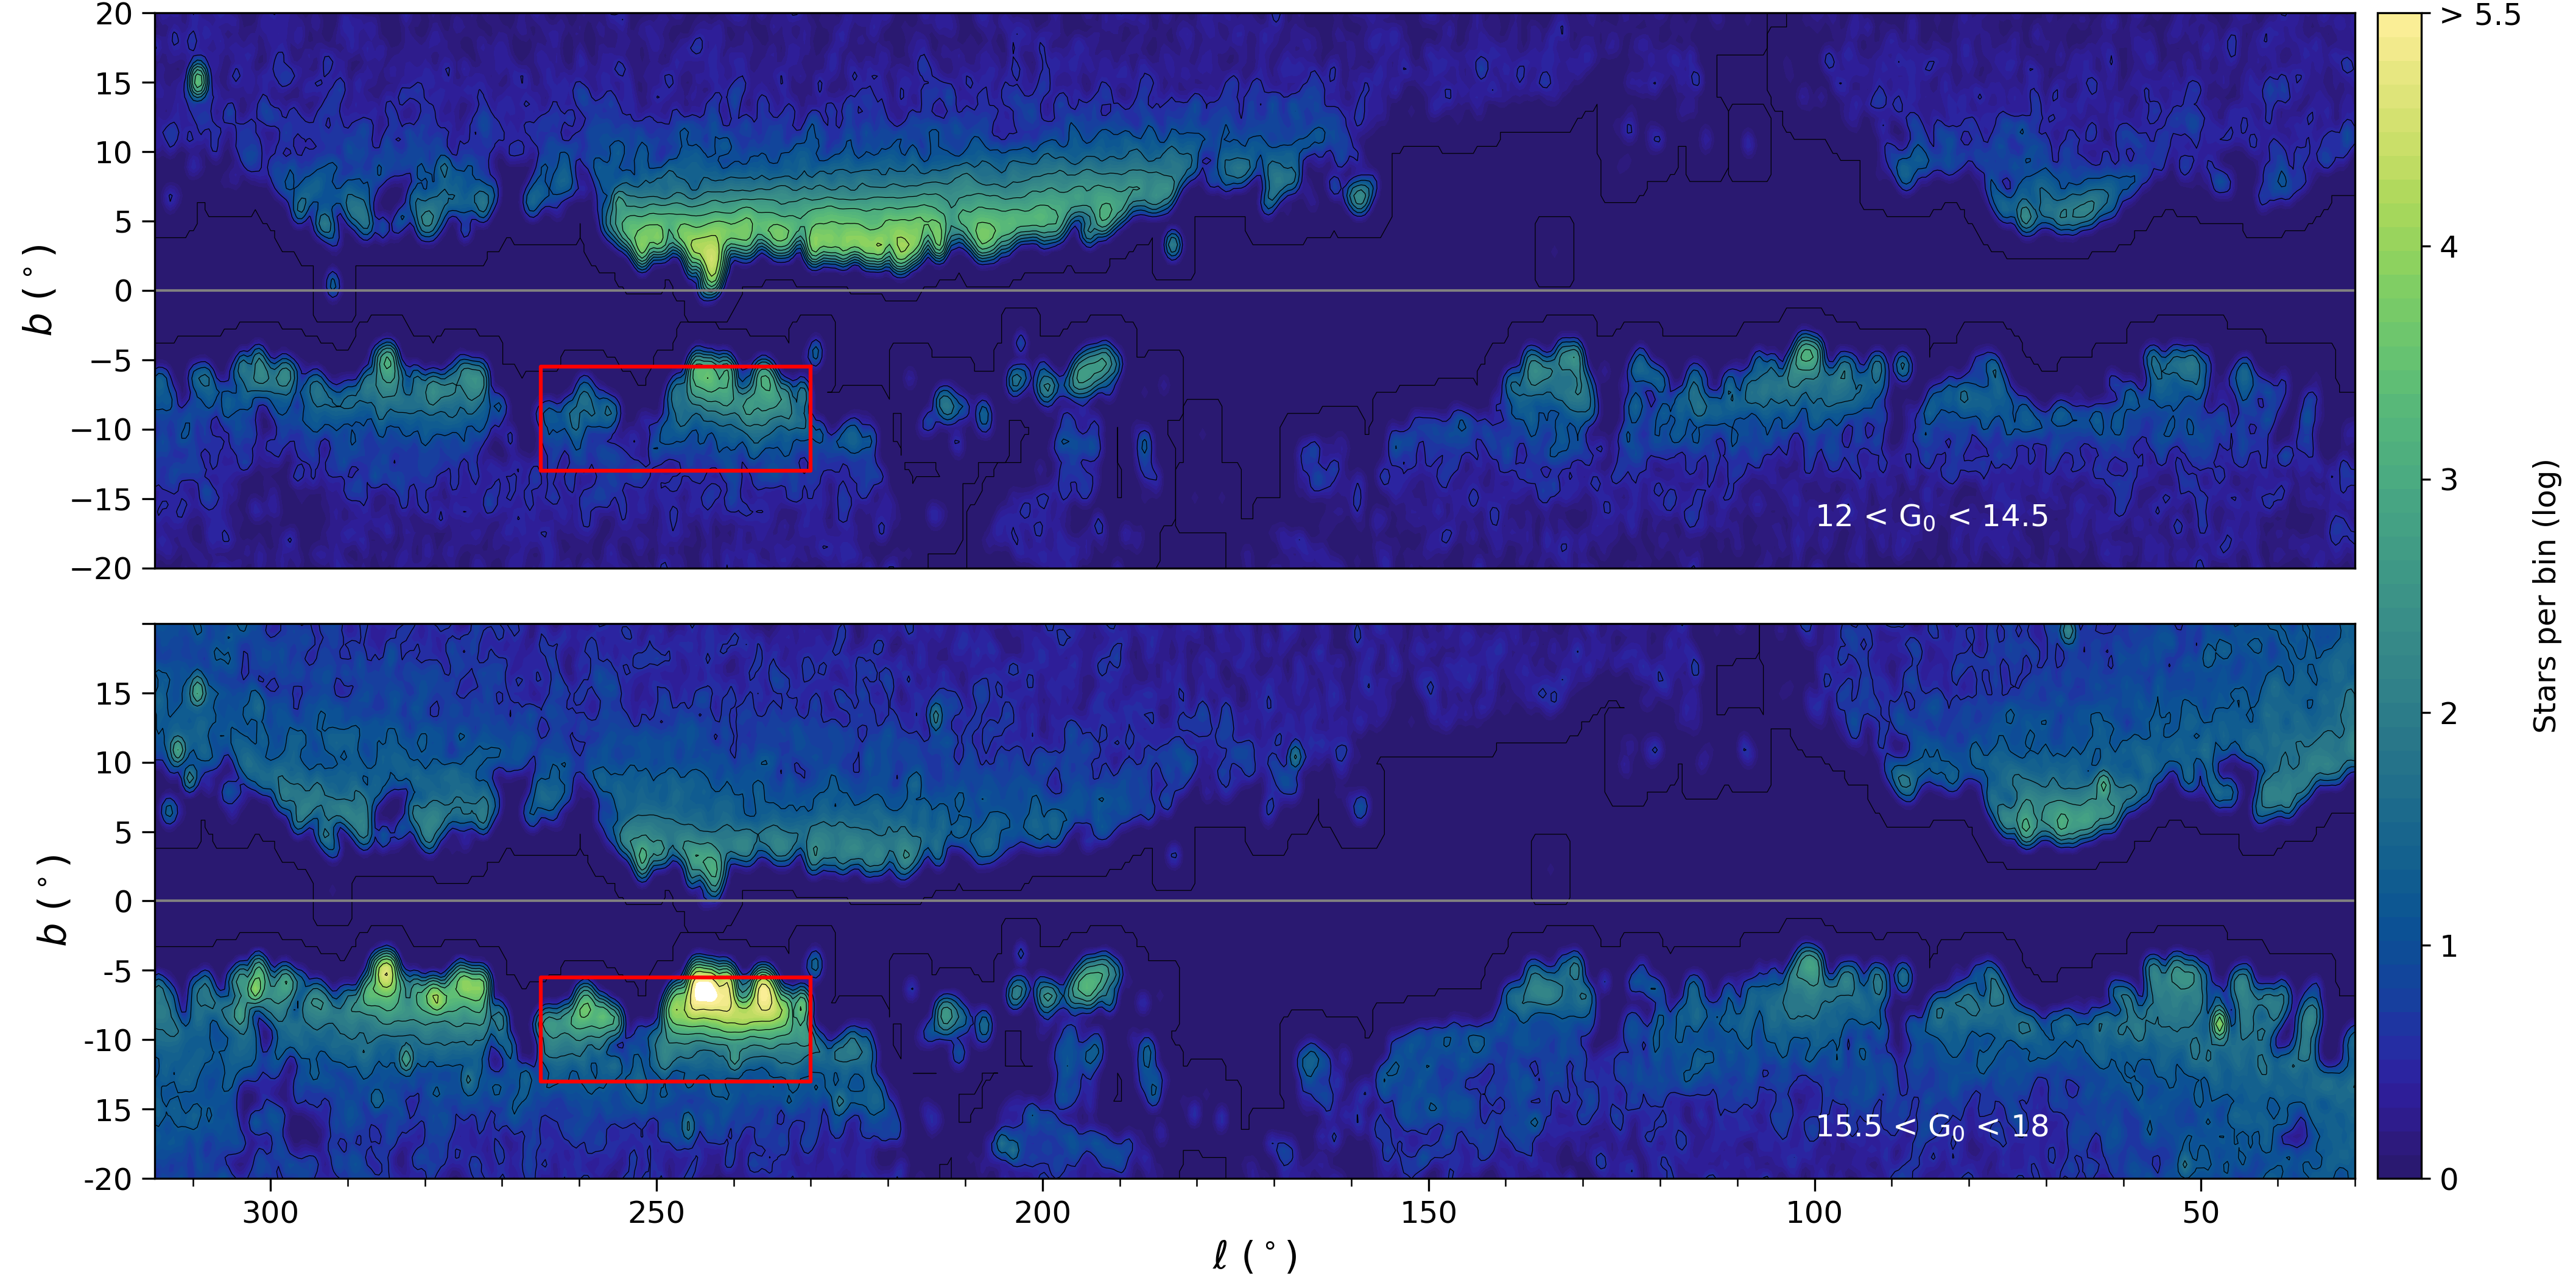
Figure 8 shows the density maps of BP stars in the bright and faint samples in Galactic coordinates, generated using a bin size of 1∘ and counting stars with RUWE 1.4. The high-extinction regions are observed around the plane and dominate the sky at low Galactic latitudes in the range . The faint sample map confirms once again that there exists a remarkable overdensity of blue stars towards the hypothetical accreted dwarf galaxy. However, it also becomes evident that CMa is only a part of a more extended substructure of stars in the section, with colors and magnitudes compatible with that of the BP stars observed towards the core of CMa. This larger and elongated overdensity is similar to the one traced by RC stars in Bellazzini et al. (2006) and is mainly found below the Galactic plane in those regions with lower levels of extinction.
The all-sky distribution of faint BP stars might indicate that the CMa substructure is product of the difficulties to detect those stars in high-extinction sections in the sky. Indeed, the core of CMa is identified in a wide area with , while the extinction is higher around other tentative overdensities of BP stars found in the third Galactic quadrant. Our density map is in good agreement with the distribution of 2MASS M-giant stars derived by Rocha-Pinto et al. (2006), in which a stellar substructure dubbed “Argo" is revealed. The latter overdensity seemed to be centered at and encompassing CMa, which those authors explained in terms of the existence of a dust extinction window towards the hypothetical accreted dwarf galaxy. Detailed molecular gas surveys covering this region also show a clear gap in its distribution along this line of sight (e.g. Reid et al., 2019, and references therein). Therefore, one would assume that lower levels of extinction in this region may lead us to observe a completely different morphology for CMa. A significant group of Gaia objects classified as faint BP stars according to our criteria is found towards , whose extension is unknown due to the high levels of extinction in its surrounding sky area. An overdensity at this same position was also reported by Martin et al. (2004) in their CMa discovery paper. However, other substructures mentioned in that paper (e.g. the Northern Arc) are not detected in our study.
Interestingly, Carraro et al. (2017) obtained radial velocities for the stellar populations along the line of sight to the open cluster Tombaugh 1 and included a group of stars with colors and magnitudes compatible with that of our BP stars, with kpc, and likely members of such a vast structure. When we cross-match their star sample C with Gaia DR2 data and computed their orbits using the same setup described in Section 3.1.5, they also seem to be confined to the plane. These authors argued that these stars are members of the Outer spiral arm of the Milky Way (e.g. see Du et al., 2016; Benedettini et al., 2020), which is displaced from the Galactic plane due to the warped disk observed in the outer Galaxy. In a similar way, CMa seems to be a section of the Outer (also Norma-Outer) spiral arm, which is observed thanks to the unlikely combination of low interstellar extinction and maximum amplitude of the Galactic warp along that line of sight.
The distribution of bright BP stars is shown in the upper panel of Figure 8 and also suggests that these blue and bright stars are dispersed throughout the Galaxy instead of being exclusively found in the CMa area, which is a solid argument against the extra-Galactic origin of that structure. Stars in the bright BP sample are mainly found in the northern hemisphere of the third Galactic quadrant in the area. The projected position of this overdensity and its heliocentric distance ( kpc) is in good agreement with the trajectory of the Perseus spiral arm (see Hou & Han, 2014). Besides the Perseus and Outer spiral arms, our results in Section 3.1.2 show the presence of a third structure along the same line of sight at kpc, which might be associated with the elusive continuation of the Scutum-Centaurus and Outer Scutum-Centaurus spiral arms (Dame & Thaddeus, 2011; Armentrout et al., 2017). Further exploration of this area with future Gaia data releases will help us to better understand the overall morphology of the outer Milky Way.
The origin of the Monoceros ring, the halo substructure of which CMa has been proposed as the progenitor dwarf galaxy, is still under debate. Recent numerical simulations have shown that if such a massive Galactic substructure is the result of an accretion event, its progenitor is on a retrograde orbit and currently located behind the bulge (Guglielmo et al., 2018). On the other hand, Monoceros might be composed of stars originated in the Galactic disk and subsequently pushed away from the Galactic plane because of the interaction with one or several satellite galaxies (e.g. Xu et al., 2015; Laporte et al., 2018; Sheffield et al., 2018). In either of these two possible scenarios, and based on the spatial and orbital properties derived above, CMa is unlikely associated with Monoceros, independently of its formation processes.
3.3 CMa as a signature of the warped Milky Way disk
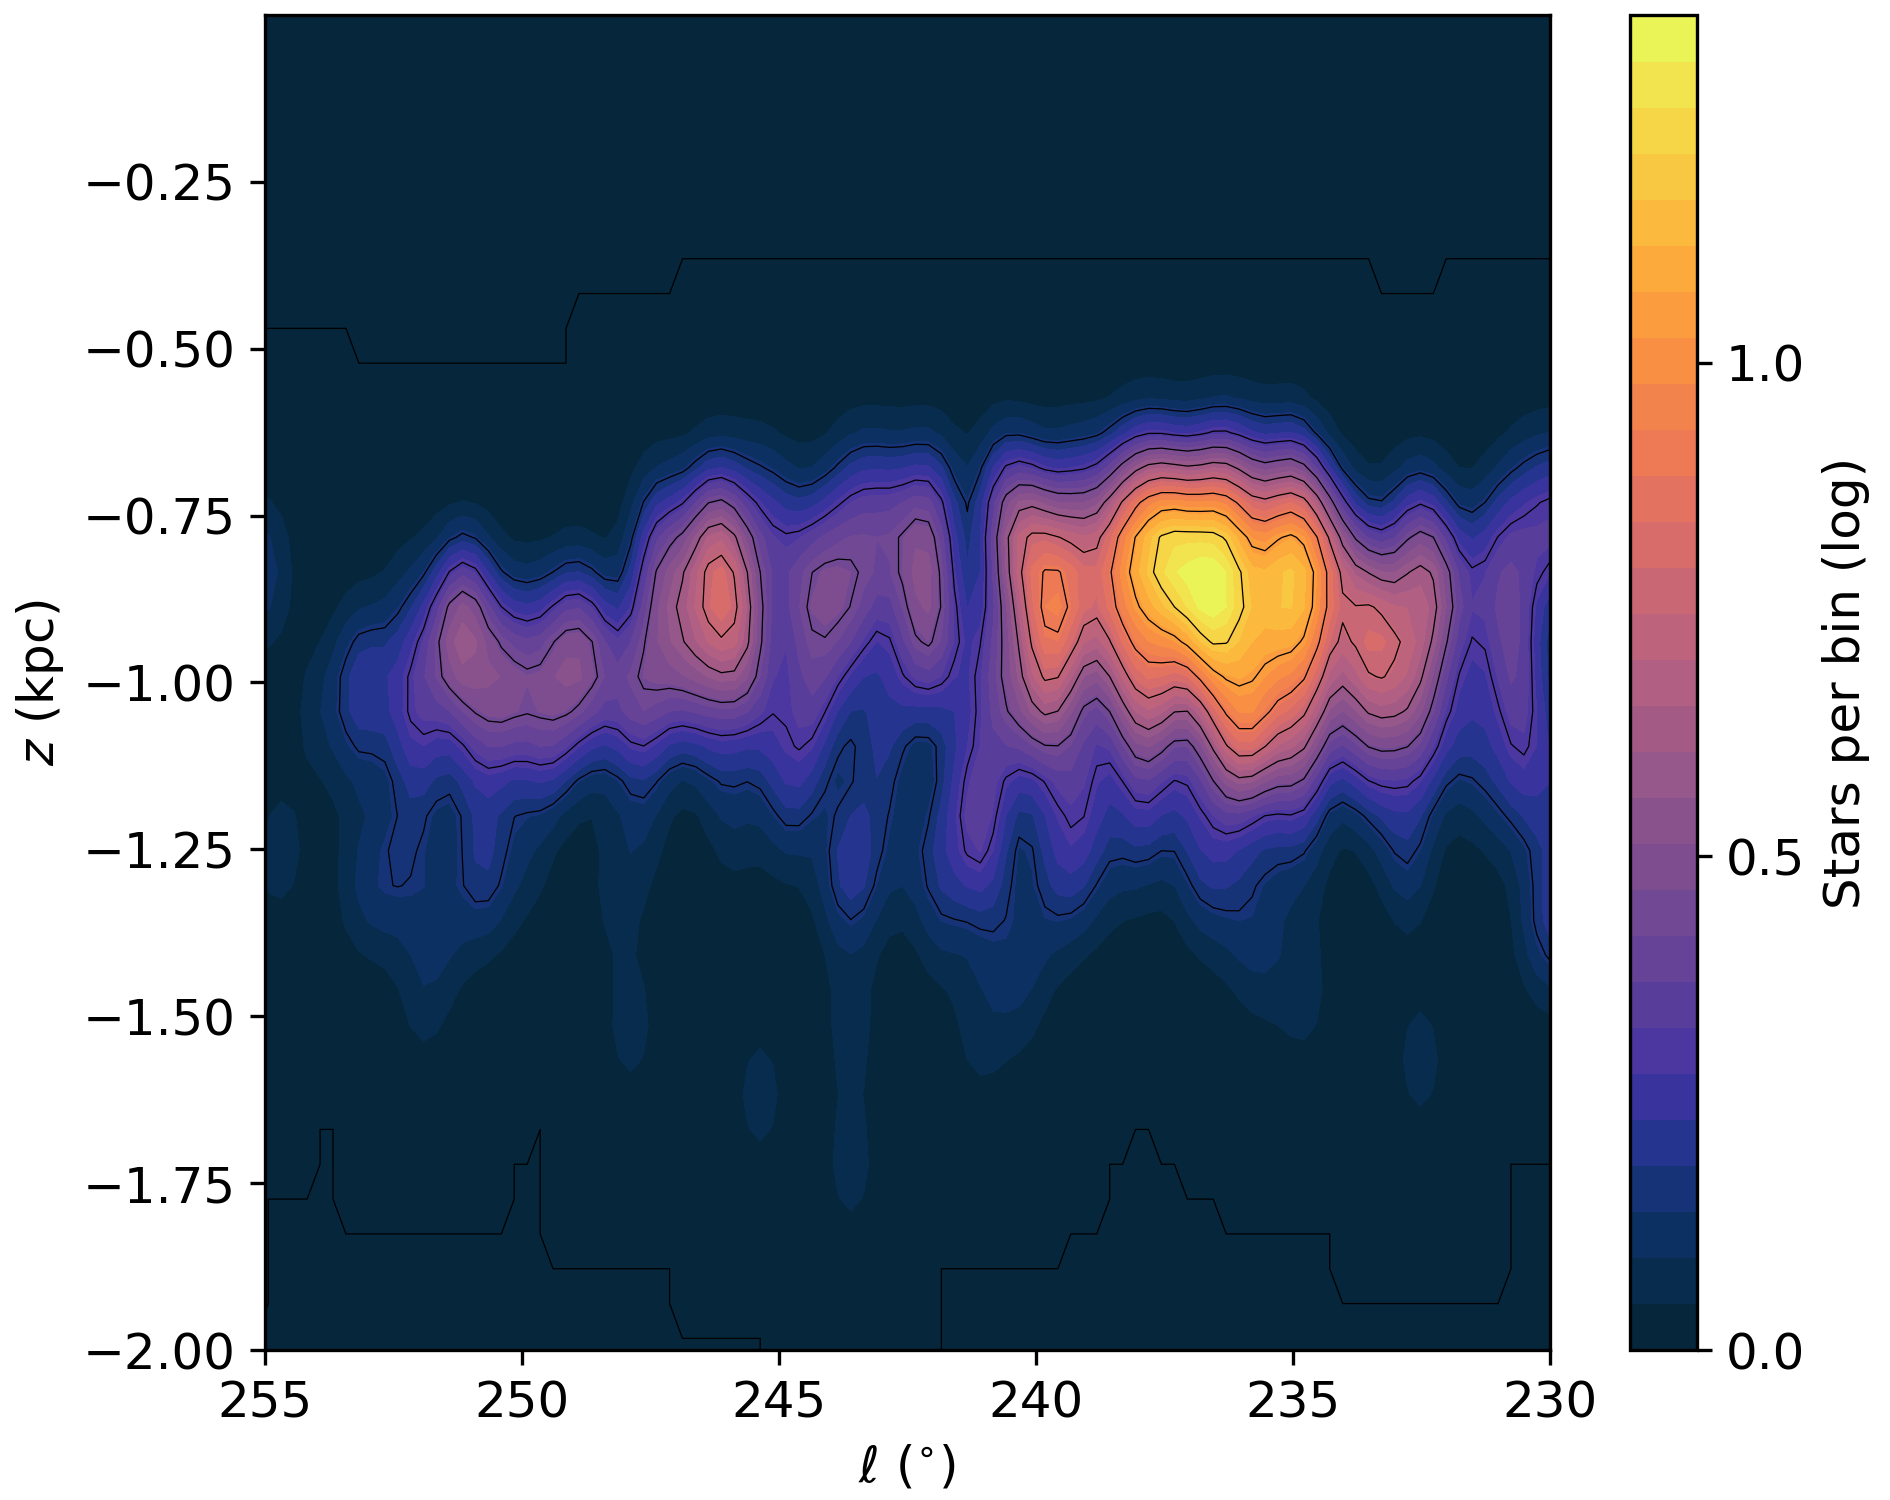
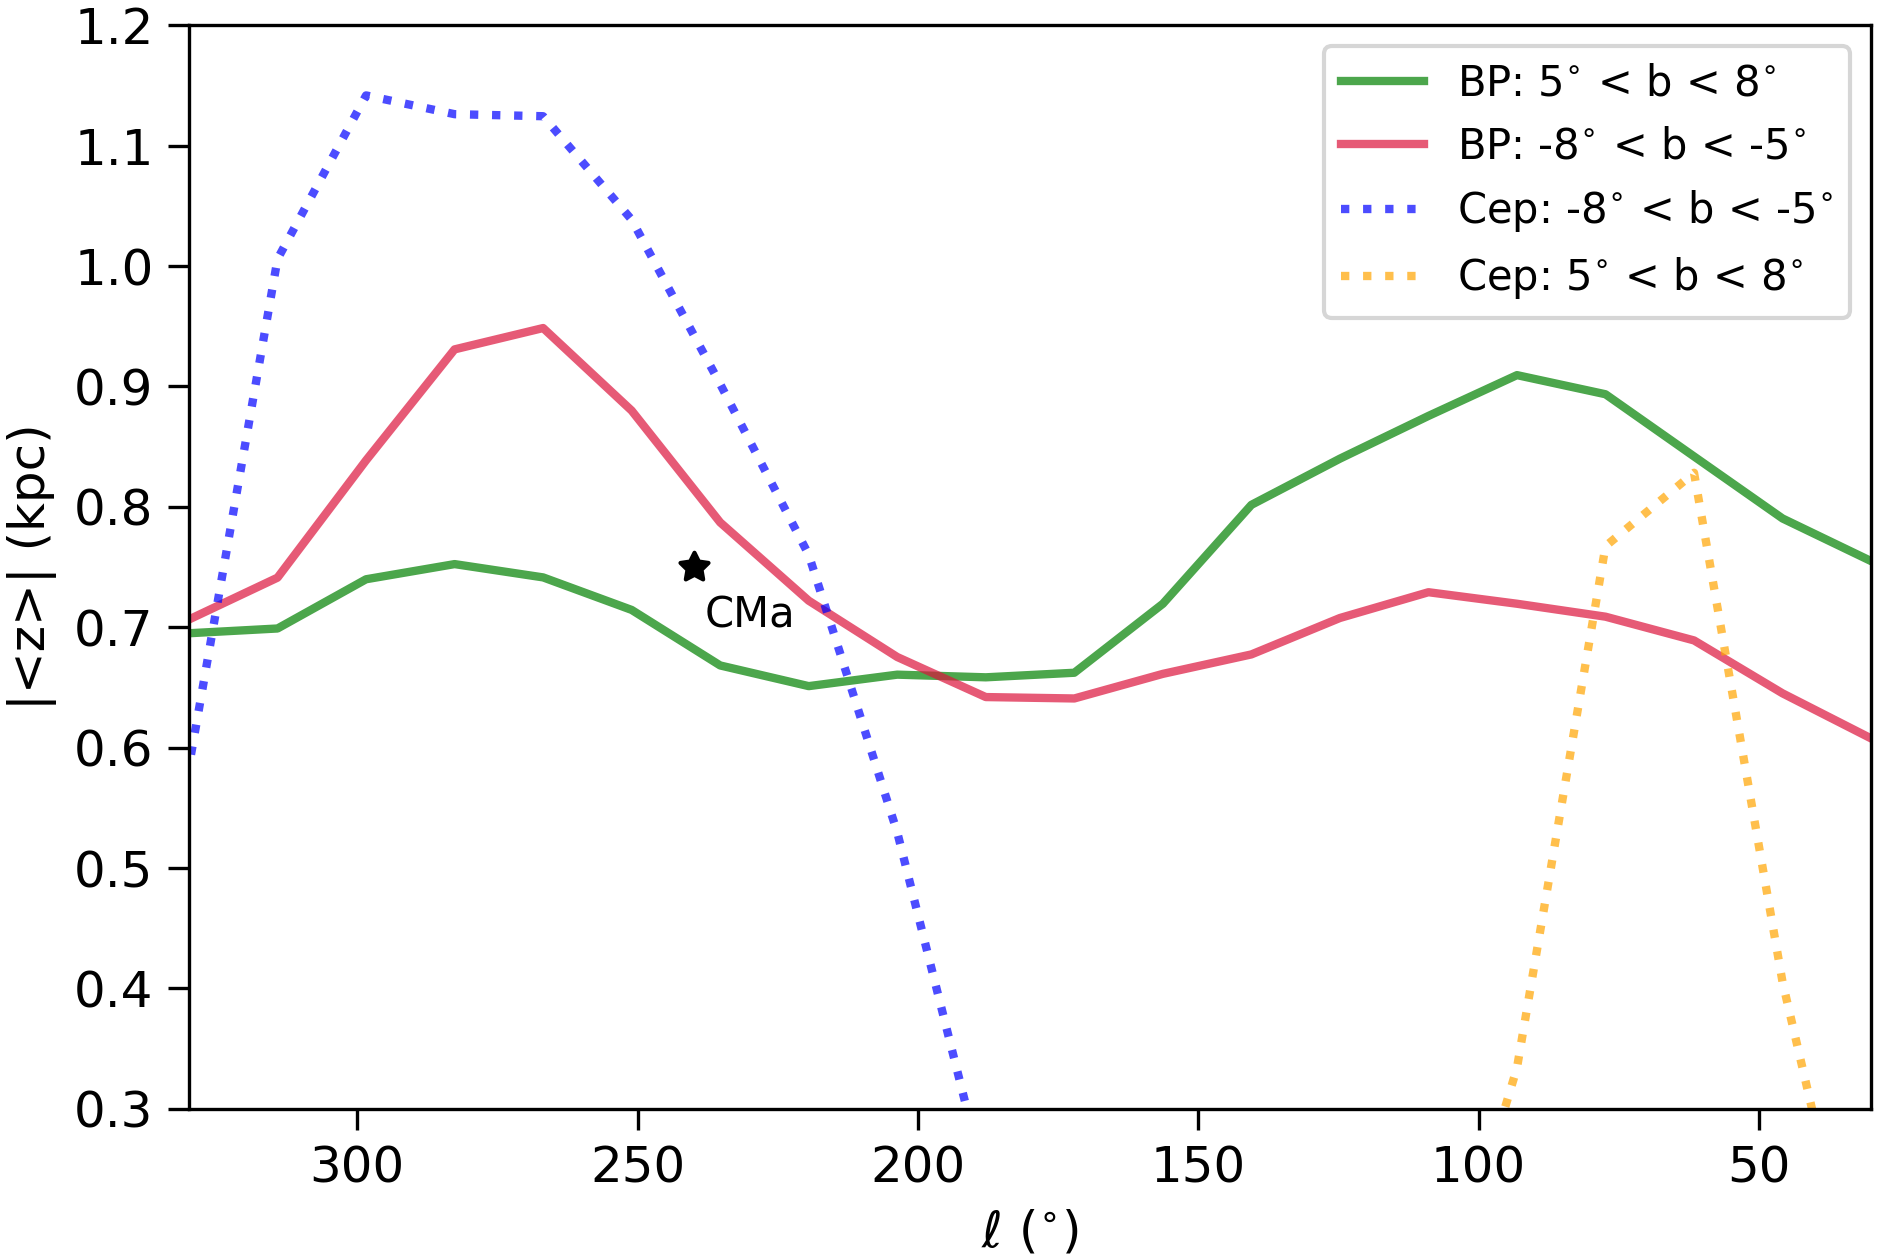
As we have mentioned above, the fact that CMa is found below the Galactic plane in the third quadrant suggests that it is likely associated with the observational signature produced by the projected warped disk, as previously suggested by several authors (e.g. Momany et al., 2006; López-Corredoira et al., 2007; Carraro et al., 2017). Although the study and the parametrization of the Galatic warp is beyond the scope of this work (see recent results on this topic in Poggio et al., 2018; Chen et al., 2019; Romero-Gómez et al., 2019; Chrobakova et al., 2020; Poggio et al., 2020), we explore here the vertical distribution of BP stars in the faint sample, with colors and magnitudes compatible with those of the BP stars towards CMa, as a function of their Galactic longitude. We estimate the mean values for all stars in the sky stripes defined by and , using the main parallax of the stars in each of the 20 bins in which we have divided the area. The resulting vertical distribution for these objects is found in Figure 9.
Both components of BP stars seem to be confined to the || kpc section of the Milky Way and reach their maximum separation from the Galactic plane at and , while the line of nodes is near parallel to the solar Galactocentric radius. However, as we consider the samples separately, it is evident that the |< >| values are higher along the third and fourth Galactic quadrants for stars below the plane, while BP stars with positive Galactic latitudes reach |< >| kpc along the first and second quadrants. This behavior for BP stars is easily observed in the map shown in the lower panel of Figure 8 and seem to put in evidence the warped structure of the Galactic disk, with a distortion towards positive latitudes in the region and towards negative latitudes in the section of the Milky Way.
In this context, CMa is located in a region of the Galaxy where the warp of the disk, as traced by BP star candidates, is closed to reach its maximum distance to the level. In Figure 9 we have also overplotted the sample of Cepheid stars identified by Chen et al. (2019) in the same sky stripes used here, whose projected positions in the plane are in good agreement with the warped structure revealed by our sample of BP stars. The Galactic longitude ranges in which the warped disk is observed are similar to those unveiled by Poggio et al. (2018), although their stars with higher vertical velocities are found at . These results reinforce the scenario in which the bright BP population away from the disk is mainly associated with the Galactic warp, and offers an excellent opportunity to study the formation and stellar population of this structure with unprecedented detail thanks to future Gaia data releases.
4 Conclusions
We have revisited the stellar population, extension and kinematic of the putative CMa overdensity with DECam and Gaia DR2 trying to shed light on its real three-dimensional structure and its origin as possible debris of an accreted dwarf galaxy. The proper motion values for a sample of BP stars, hypothetically associated with the core of CMa, are concentrated in the proper motion space but still with values compatible with those of the rest of stars in the same line of sight. The orbit derived for this overdensity from those Gaia proper motion estimates suggests that it is orbiting the Milky Way with an on-plane rotation.
We are able to trace the CMa overdensity using BP stars selected in our photometric survey. The CMa overdensity is a real structure at low Galactic latitudes but, when we extend our study to the rest of the sky using Gaia photometry, we find that BP stars are observed not only within the central areas of the CMa overdensity but also across the third Galactic quadrant and the rest of the Galaxy.
We conclude that the CMa properties are more consistent with a structure, likely the Outer spiral arm, embedded in the warped disk, instead of being a halo substructure generated by the assimilation of a minor satellite galaxy. Future Gaia data releases will provide us accurate astrometry, photometry and radial velocities not only for the BP population across the Galaxy but also for the faint end of the CMD, where the MS of the stellar system associated with those blue and bright stars is present. Such a remarkable dataset will allow us to understand some of the most tangled Galactic features, including the flare and warp of the Milky Way disk.
Data Availability
This project used data obtained with the Dark Energy Camera (DECam; proposal ID 2013A-0615) and from the European Space Agency (ESA) mission Gaia (https://www.cosmos.esa.int/gaia), processed by the Gaia Data Processing and Analysis Consortium (DPAC, https://www.cosmos.esa.int/web/gaia/dpac/consortium).
Acknowledgements
Thanks to the anonymous referee for her/his helpful comments and suggestions. We thank to Santi Cassisi for his help to compute the synthetic color-magnitude diagram used in this study and to X. Chen for kindly providing the positions of their sample of Cepheids. JAC-B acknowledges financial support to CAS-CONICYT 17003. DMD acknowledges support from the Spanish Ministry for Science, Innovation and Universities and FEDER funds through grant AYA2016-81065-C2-2. EJA and DMD acknowledge financial support from the State Agency for Research of the Spanish MCIU through the "Centre of Excellence Severo Ochoa" award for the Instituto de Astrofísica de Andalucía (SEV-2017-0709) and from grant PGC2018-095049-B-C21. DECam was constructed by the Dark Energy Survey (DES) collaboration. Funding for the DES Projects has been provided by the U.S. Department of Energy, the U.S. National Science Foundation, the Ministry of Science and Education of Spain, the Science and Technology Facilities Council of the United Kingdom, the Higher Education Funding Council for England, the National Center for Supercomputing Applications at the University of Illinois at Urbana-Champaign, the Kavli Institute of Cosmological Physics at the University of Chicago, the Center for Cosmology and Astro-Particle Physics at the Ohio State University, the Mitchell Institute for Fundamental Physics and Astronomy at Texas A&M University, Financiadora de Estudos e Projetos, Fundação Carlos Chagas Filho de Amparo à Pesquisa do Estado do Rio de Janeiro, Conselho Nacional de Desenvolvimento Científico e Tecnológico and the Ministério da Ciência, Tecnologia e Inovacão, the Deutsche Forschungsgemeinschaft, and the Collaborating Institutions in the Dark Energy Survey. Funding for the Gaia DPC has been provided by national institutions, in particular the institutions participating in the Gaia Multilateral Agreement.
References
- Abbott et al. (2018) Abbott et al. 2018, ApJS, 239, 18
- Alfaro & Efremov (1996) Alfaro E. J., Efremov Y. N., 1996, in Falco E., Fernandez J. A., Ferrero R. F., eds, Revista Mexicana de Astronomia y Astrofisica Conference Series Vol. 4 of Revista Mexicana de Astronomia y Astrofisica Conference Series, On the Nature of the Vertical Structure of the Galactic Disk (Invited Paper). p. 1
- Alfaro & González (2016) Alfaro E. J., González M., 2016, MNRAS, 456, 2900
- Alfaro & Román-Zúñiga (2018) Alfaro E. J., Román-Zúñiga C. G., 2018, MNRAS, 478, L110
- Allard et al. (2012) Allard F., Homeier D., Freytag B., 2012, Philosophical Transactions of the Royal Society of London Series A, 370, 2765
- Allison et al. (2009) Allison R. J., Goodwin S. P., Parker R. J., Portegies Zwart S. F., de Grijs R., Kouwenhoven M. B. N., 2009, MNRAS, 395, 1449
- Aparicio et al. (1997) Aparicio A., Dalcanton J. J., Gallart C., Martinez-Delgado D., 1997, AJ, 114, 1447
- Arenou et al. (2018) Arenou et al. 2018, A&A, 616, A17
- Armentrout et al. (2017) Armentrout W. P., Anderson L. D., Balser D. S., Bania T. M., Dame T. M., Wenger T. V., 2017, ApJ, 841, 121
- Bailer-Jones et al. (2018) Bailer-Jones C. A. L., Rybizki J., Fouesneau M., Mantelet G., Andrae R., 2018, AJ, 156, 58
- Battaner et al. (1990) Battaner E., Florido E., Sanchez-Saavedra M. L., 1990, A&A, 236, 1
- Bayo et al. (2008) Bayo A., Rodrigo C., Barrado Y Navascués D., Solano E., Gutiérrez R., Morales-Calderón M., Allard F., 2008, A&A, 492, 277
- Bekki (2009) Bekki K., 2009, MNRAS, 398, L36
- Bellazzini et al. (2004) Bellazzini M., Ibata R., Ferraro F. R., 2004, in F. Prada, D. Martinez Delgado, & T. J. Mahoney ed., Satellites and Tidal Streams Vol. 327 of Astronomical Society of the Pacific Conference Series, Globular Clusters in the Sgr Stream and Other Structures. pp 220–+
- Bellazzini et al. (2006) Bellazzini M., Ibata R., Martin N., Lewis G. F., Conn B., Irwin M. J., 2006, MNRAS, 366, 865
- Belokurov et al. (2006) Belokurov et al. 2006, ApJL, 642, L137
- Benedettini et al. (2020) Benedettini M., Molinari S., Baldeschi A., Beltrán M. T., Brand J., Cesaroni R., Elia D., Fontani F., Merello M., Olmi L., Pezzuto S., Rygl K. L. J., Schisano E., Testi L., Traficante A., 2020, A&A, 633, A147
- Bernard et al. (2016) Bernard et al. 2016, MNRAS, 463, 1759
- Bland-Hawthorn & Gerhard (2016) Bland-Hawthorn J., Gerhard O., 2016, ARA&A, 54, 529
- Bovy (2014) Bovy J., , 2014, galpy: Galactic dynamics package, Astrophysics Source Code Library
- Butler et al. (2007) Butler D. J., Martínez-Delgado D., Rix H.-W., Peñarrubia J., de Jong J. T. A., 2007, AJ, 133, 2274
- Carballo-Bello et al. (2018) Carballo-Bello J. A., Martínez-Delgado D., Navarrete C., Catelan M., Muñoz R. R., Antoja T., Sollima A., 2018, MNRAS, 474, 683
- Carraro (2005) Carraro G., 2005, ApJL, 621, L61
- Carraro et al. (2008) Carraro G., Moitinho A., Vázquez R. A., 2008, MNRAS, 385, 1597
- Carraro et al. (2017) Carraro G., Sales Silva J. V., Moni Bidin C., Vazquez R. A., 2017, AJ, 153, 99
- Chan & Bovy (2020) Chan V. C., Bovy J., 2020, MNRAS, 493, 4367
- Chen et al. (2018) Chen S., Richer H., Caiazzo I., Heyl J., 2018, ApJ, 867, 132
- Chen et al. (2019) Chen X., Wang S., Deng L., de Grijs R., Liu C., Tian H., 2019, Nature Astronomy, p. 202
- Chrobakova et al. (2020) Chrobakova Z., Nagy R., Lopez-Corredoira M., 2020, arXiv e-prints, p. arXiv:2004.03247
- Costado & Alfaro (2018) Costado M. T., Alfaro E. J., 2018, MNRAS, 476, 3160
- Costado et al. (2017) Costado M. T., Alfaro E. J., González M., Sampedro L., 2017, MNRAS, 465, 3879
- Dame & Thaddeus (2011) Dame T. M., Thaddeus P., 2011, ApJL, 734, L24
- de Jong et al. (2007) de Jong J. T. A., Butler D. J., Rix H. W., Dolphin A. E., Martínez-Delgado D., 2007, ApJ, 662, 259
- Dinescu et al. (2005) Dinescu D. I., Martínez-Delgado D., Girard T. M., Peñarrubia J., Rix H.-W., Butler D., van Altena W. F., 2005, ApJL, 631, L49
- Drlica-Wagner et al. (2015) Drlica-Wagner et al. 2015, ApJ, 813, 109
- Du et al. (2016) Du X., Xu Y., Yang J., Sun Y., Li F., Zhang S., Zhou X., 2016, ApJS, 224, 7
- Dubinski & Chakrabarty (2009) Dubinski J., Chakrabarty D., 2009, ApJ, 703, 2068
- Evans et al. (2018) Evans et al. 2018, A&A, 616, A4
- Flaugher et al. (2015) Flaugher et al. 2015, AJ, 150, 150
- Font et al. (2011) Font A. S., Benson A. J., Bower R. G., Frenk C. S., Cooper A., De Lucia G., Helly J. C., Helmi A., Li Y.-S., McCarthy I. G., Navarro J. F., Springel V., Starkenburg E., Wang J., White S. D. M., 2011, MNRAS, 417, 1260
- Forbes (2020) Forbes D. A., 2020, MNRAS, p. 233
- Forbes & Bridges (2010) Forbes D. A., Bridges T., 2010, MNRAS, 404, 1203
- Forbes et al. (2004) Forbes D. A., Strader J., Brodie J. P., 2004, AJ, 127, 3394
- Franco et al. (2002) Franco J., Kim J., Alfaro E. J., Hong S. S., 2002, ApJ, 570, 647
- Gaia Collaboration (2016) Gaia Collaboration 2016, A&A, 595, A1
- Gaia Collaboration (2018) Gaia Collaboration 2018, A&A, 616, A1
- Geier et al. (2019) Geier S., Raddi R., Gentile Fusillo N. P., Marsh T. R., 2019, A&A, 621, A38
- González & Alfaro (2017) González M., Alfaro E. J., 2017, MNRAS, 465, 1889
- Guglielmo et al. (2018) Guglielmo M., Lane R. R., Conn B. C., Ho A. Y. Q., Ibata R. A., Lewis G. F., 2018, MNRAS, 474, 4584
- Helmi et al. (2018) Helmi A., Babusiaux C., Koppelman H. H., Massari D., Veljanoski J., Brown A. G. A., 2018, Nat., 563, 85
- Hidalgo et al. (2018) Hidalgo et al. 2018, ApJ, 856, 125
- Hou & Han (2014) Hou L. G., Han J. L., 2014, A&A, 569, A125
- Hu & Sijacki (2018) Hu S., Sijacki D., 2018, MNRAS, 478, 1576
- Hubeny & Lanz (1995) Hubeny I., Lanz T., 1995, ApJ, 439, 875
- Ibata et al. (1994) Ibata R. A., Gilmore G., Irwin M. J., 1994, Nat., 370, 194
- Kerr (1957) Kerr F. J., 1957, AJ, 62, 93
- Khan et al. (2019) Khan S., Miglio A., Mosser B., Arenou F., Belkacem K., Brown A. G. A., Katz D., Casagrand e L., Chaplin W. J., Davies G. R., Rendle B. M., Rodrigues T. S., Bossini D., Cantat-Gaudin T., Elsworth Y. P., Girardi L., North T. S. H., Vallenari A., 2019, A&A, 628, A35
- Koester (2010) Koester D., 2010, Mem. Soc. Astron. Italiana, 81, 921
- Koposov et al. (2017) Koposov S. E., Belokurov V., Torrealba G., 2017, MNRAS, 470, 2702
- Koposov et al. (2015) Koposov S. E., Belokurov V., Torrealba G., Evans N. W., 2015, ApJ, 805, 130
- Koposov et al. (2012) Koposov et al. 2012, ApJ, 750, 80
- Kruijssen et al. (2019) Kruijssen J. M. D., Pfeffer J. L., Reina-Campos M., Crain R. A., Bastian N., 2019, MNRAS, 486, 3180
- Kurucz (1993) Kurucz R. L., 1993, VizieR Online Data Catalog, p. VI/39
- Laporte et al. (2018) Laporte C. F. P., Gómez F. A., Besla G., Johnston K. V., Garavito-Camargo N., 2018, MNRAS, 473, 1218
- Levine et al. (2006) Levine E. S., Blitz L., Heiles C., 2006, ApJ, 643, 881
- Li et al. (2019) Li C., Zhao G., Jia Y., Liao S., Yang C., Wang Q., 2019, ApJ, 871, 208
- Lindblad (1967) Lindblad P. O., 1967, Bull. Astron. Inst. Netherlands, 19, 34
- Lindegren (2018) Lindegren L., 2018, GAIA-C3-TN-LU-LL-124-01
- Lindegren et al. (2018) Lindegren et al. 2018, A&A, 616, A2
- López-Corredoira (2006) López-Corredoira M., 2006, MNRAS, 369, 1911
- López-Corredoira et al. (2018) López-Corredoira M., Allende Prieto C., Garzón F., Wang H., Liu C., Deng L., 2018, A&A, 612, L8
- López-Corredoira et al. (2002) López-Corredoira M., Cabrera-Lavers A., Garzón F., Hammersley P. L., 2002, A&A, 394, 883
- López-Corredoira et al. (2020) López-Corredoira M., Garzón F., Wang H. F., Sylos Labini F., Nagy R., Chrobáková Ž., Chang J., Villarroel B., 2020, A&A, 634, A66
- López-Corredoira et al. (2007) López-Corredoira M., Momany Y., Zaggia S., Cabrera-Lavers A., 2007, A&A, 472, L47
- Luri et al. (2018) Luri et al. 2018, A&A, 616, A9
- Maíz Apellániz (2019) Maíz Apellániz J., 2019, A&A, 630, A119
- Majewski et al. (2003) Majewski S. R., Skrutskie M. F., Weinberg M. D., Ostheimer J. C., 2003, ApJ, 599, 1082
- Martin et al. (2004) Martin N. F., Ibata R. A., Bellazzini M., Irwin M. J., Lewis G. F., Dehnen W., 2004, MNRAS, 348, 12
- Martin et al. (2004) Martin N. F., Ibata R. A., Conn B. C., Lewis G. F., Bellazzini M., Irwin M. J., McConnachie A. W., 2004, MNRAS, 355, L33
- Martínez-Delgado et al. (2001) Martínez-Delgado D., Aparicio A., Gómez-Flechoso M. Á., Carrera R., 2001, ApJL, 549, L199
- Martínez-Delgado et al. (2005) Martínez-Delgado D., Butler D. J., Rix H.-W., Franco V. I., Peñarrubia J., Alfaro E. J., Dinescu D. I., 2005, ApJ, 633, 205
- Martínez-Delgado et al. (1999) Martínez-Delgado D., Gallart C., Aparicio A., 1999, AJ, 118, 862
- Maschberger & Clarke (2011) Maschberger T., Clarke C. J., 2011, MNRAS, 416, 541
- Mateu et al. (2009) Mateu C., Vivas A. K., Zinn R., Miller L. R., Abad C., 2009, AJ, 137, 4412
- Minniti et al. (2011) Minniti et al. 2011, A&A, 527, A81
- Moitinho et al. (2006) Moitinho A., Vázquez R. A., Carraro G., Baume G., Giorgi E. E., Lyra W., 2006, MNRAS, 368, L77
- Momany et al. (2006) Momany Y., Zaggia S., Gilmore G., Piotto G., Carraro G., Bedin L. R., de Angeli F., 2006, A&A, 451, 515
- Momany et al. (2004) Momany Y., Zaggia S. R., Bonifacio P., Piotto G., De Angeli F., Bedin L. R., Carraro G., 2004, A&A, 421, L29
- Morganson et al. (2016) Morganson et al. 2016, ApJ, 825, 140
- Myeong et al. (2018) Myeong G. C., Evans N. W., Belokurov V., Sand ers J. L., Koposov S. E., 2018, ApJ, 863, L28
- Myeong et al. (2019) Myeong G. C., Vasiliev E., Iorio G., Evans N. W., Belokurov V., 2019, MNRAS, 488, 1235
- Newberg et al. (2002) Newberg et al. 2002, ApJ, 569, 245
- Peñarrubia et al. (2005) Peñarrubia J., Martínez-Delgado D., Rix H. W., Gómez-Flechoso M. A., Munn J., Newberg H., Bell E. F., Yanny B., Zucker D., Grebel E. K., 2005, ApJ, 626, 128
- Poggio et al. (2020) Poggio E., Drimmel R., Andrae R., Bailer-Jones C. A. L., Fouesneau M., Lattanzi M. G., Smart R. L., Spagna A., 2020, Nature Astronomy
- Poggio et al. (2018) Poggio E., Drimmel R., Lattanzi M. G., Smart R. L., Spagna A., Andrae R., Bailer-Jones C. A. L., Fouesneau M., Antoja T., Babusiaux C., Evans D. W., Figueras F., Katz D., Reylé C., Robin A. C., Romero-Gómez M., Seabroke G. M., 2018, MNRAS, 481, L21
- Poleski (2013) Poleski R., 2013, ArXiv e-prints
- Powell et al. (2008) Powell Jr W. L., Wilhelm R., Carrell K., Westfall A., 2008, arXiv e-prints, p. 0803.1509
- Reid et al. (2019) Reid M. J., Menten K. M., Brunthaler A., Zheng X. W., Dame T. M., Xu Y., Li J., Sakai N., Wu Y., Immer K., Zhang B., Sanna A., Moscadelli L., Rygl K. L. J., Bartkiewicz A., Hu B., Quiroga-Nuñez L. H., van Langevelde H. J., 2019, ApJ, 885, 131
- Reid et al. (2014) Reid et al. 2014, ApJ, 783, 130
- Rocha-Pinto et al. (2006) Rocha-Pinto H. J., Majewski S. R., Skrutskie M. F., Patterson R. J., Nakanishi H., Muñoz R. R., Sofue Y., 2006, ApJL, 640, L147
- Rodriguez-Gomez et al. (2016) Rodriguez-Gomez et al. 2016, MNRAS, 458, 2371
- Romero-Gómez et al. (2019) Romero-Gómez M., Mateu C., Aguilar L., Figueras F., Castro-Ginard A., 2019, A&A, 627, A150
- Sanchez-Saavedra et al. (1990) Sanchez-Saavedra M. L., Battaner E., Florido E., 1990, MNRAS, 246, 458
- Santillán et al. (1999) Santillán A., Franco J., Martos M., Kim J., 1999, ApJ, 515, 657
- Sbordone et al. (2005) Sbordone L., Bonifacio P., Marconi G., Buonanno R., Zaggia S., 2005, A&A, 437, 905
- Schlafly & Finkbeiner (2011) Schlafly E. F., Finkbeiner D. P., 2011, ApJ, 737, 103
- Sheffield et al. (2018) Sheffield A. A., Price-Whelan A. M., Tzanidakis A., Johnston K. V., Laporte C. F. P., Sesar B., 2018, ApJ, 854, 47
- Shipp et al. (2018) Shipp et al. 2018, ApJ, 862, 114
- Stetson (1987) Stetson P. B., 1987, PASP, 99, 191
- Torrealba et al. (2018) Torrealba et al. 2018, MNRAS, 475, 5085
- Torrealba et al. (2019) Torrealba et al. 2019, MNRAS, 488, 2743
- Valdes et al. (2014) Valdes F., Gruendl R., DES Project 2014, in Manset N., Forshay P., eds, Astronomical Data Analysis Software and Systems XXIII Vol. 485 of Astronomical Society of the Pacific Conference Series, The DECam Community Pipeline. p. 379
- Witham et al. (2008) Witham A. R., Knigge C., Drew J. E., Greimel R., Steeghs D., Gänsicke B. T., Groot P. J., Mampaso A., 2008, MNRAS, 384, 1277
- Wouterloot et al. (1990) Wouterloot J. G. A., Brand J., Burton W. B., Kwee K. K., 1990, A&A, 230, 21
- Xu et al. (2015) Xu Y., Newberg H. J., Carlin J. L., Liu C., Deng L., Li J., Schönrich R., Yanny B., 2015, ApJ, 801, 105