Tess observations of Be stars: general characteristics and the impulsive magnetic rotator model
Abstract
In this work, we study the general characteristics of Be star light curves from TESS sectors 1–26 in the light of a model we call the “impulsive magnetic rotator”. It is found that 73 percent of 441 classical Be stars are short-period variables. The light curves are characterised by non-coherent periods dominated by the fundamental and first harmonic with variable relative amplitudes. By comparing the equatorial rotational velocities obtained from the photometric fundamental periods with the projected rotational velocities, it is shown that the fundamental period is indistinguishable from the rotation period. The distributions of the projected rotational velocities and the equatorial rotational velocities for Be and non-Be stars are discussed. Using the equatorial rotational velocities of Be stars directly determined from the photometric period, it is found that, on average, Be stars rotate at about 0.66 of critical velocity. This result is independent of assumptions concerning gravity darkening. It is shown that the rotational amplitudes of Be stars increase with effective temperature and are considerably higher than those of non-Be stars. The amplitude distributions of Be and non-Be stars are also significantly different. Of particular interest is a large rise in rotational amplitudes from A0 to B5 for non-Be stars. We suspect that this may be a result of the increasing importance of a line-driven wind. Perhaps the Be stars are just those with greatest surface activity with increased mass loss aided by rapid rotation.
keywords:
stars: emission-line, Be – stars: rotation – stars: early-type – stars: starspots1 Introduction
One of the most important unsolved problems in astrophysics is the mechanism which leads to episodic mass loss in Be stars. Struve (1931) was the first to suggest that Be stars rotate at critical velocity, forming lens-shaped bodies which eject matter at the equator. However, a statistical analysis of the distribution of projected rotational velocities, , showed that the equatorial rotational velocities of Be stars are significantly below critical (Slettebak, 1949). Stoeckley (1968) suggested that measurements were perhaps too low because the effects of gravitational darkening and spherical distortion might have been under-estimated. He showed that the distribution of 40 Be stars could be consistent with critical rotational velocity. An analysis of a larger sample of Be stars by Slettebak (1979) offered no support for critical rotational velocity, though it could not be entirely excluded.
It has long been known that Be stars vary photometrically and spectroscopically over long time scales which can be attributed to the circumstellar disk. The first report of short-term periodic variability in a Be star was by Walker (1953) who found a 0.73–0.80 d light variation in EW Lac. Baade (1979, 1982) found spectroscopic line profile variations with a 1.36-d period in the Be star 28 CMa. This was interpreted as nonradial pulsation (NRP). From that time onwards, the idea of NRP as a trigger for mass ejection began to gain increasing acceptance.
NRP in B stars is attributed to the opacity mechanism acting in the partial ionization zone of iron-like elements and is responsible for coherent pulsations in Cep and SPB stars. The amount of momentum transfer that can be applied by NRP is limited by the sound speed in the stellar atmosphere. For that reason, a star needs to be rotating in excess of 90 percent of the critical rotation velocity for material to be ejected (Townsend et al., 2004). In order to justify near-critical rotation, Stoeckley’s idea concerning the extreme effect of gravitational darkening at near-critical velocity was resurrected (Townsend et al., 2004).
In this hypothesis, all Be stars are rotating near critical velocity and must, at times, pulsate with sufficient amplitude to drive the mass loss. It was originally suggested that beating of two or more pulsation modes would generate the required amplitude. However, the evidence for the predicted periodic outbursts does not exist except perhaps in the case of Cen (Rivinius et al., 1998; Baade et al., 2016). Beating of coherent modes would in any case be expected to lead to a rather slow increase in amplitude, while Be outbursts, as its name implies, are impulsive events.
Recent analyses of the distribution have consistently found no evidence that Be stars are rotating close to critical velocity, . Yudin (2001) finds that early-type Be stars rotate at typically 0.5–0.7, while late-type Be stars at about 0.7–0.8. Cranmer (2005) found that early-type Be stars rotate at about 0.4–0.6, though a few may be rotating near critical velocity. Late-type Be stars exhibit progressively narrower ranges of rotation speed with decreasing effective temperature with the coolest Be stars rotating close to critical. Zorec et al. (2016) has arrived at the same conclusion, showing that Be stars generally rotate at about , but with a range 0.3–0.95 . From spectro-interferometric observations of 26 Be stars, Cochetti et al. (2019) find that they rotate at about .
Walker (1953) suggested that the short-period variation in EW Lac may be due to “temporary disturbances which form on or near the surface of the star and are carried across its disk by the stellar rotation. The passage of a dark, cooler region across the visible hemisphere of the star could account for the light-variation and possible color variations, as well as for the change in the amplitudes of the minima, as the disturbance grew and diminished in size and intensity”. Essentially, this can be thought of as a co-rotating cloud of gas which eventually disperses into the circumstellar disk. The circumstellar disk material certainly has a large effect on the light and line profile variations, so this conclusion seems reasonable. After all, any material ejected by the star (including by NRP) cannot avoid occulting the photosphere. If the material lingers near the photosphere for a few days in a Kepler-like orbit or trapped by a magnetic field this will inevitably lead to periodic light variations.
The reason why Walker’s idea was rejected and replaced by NRP is that stars with radiative envelopes have been assumed to have immaculate, inactive, photospheres. It is generally believed that magnetic fields, which are responsible for activity in the Sun and other cool stars cannot be generated in radiative envelopes. This long-held view can now be questioned owing to recent photometric Kepler and TESS observations of A and B stars. Reports of flares in A and late-B stars (Balona, 2012, 2015) as well as rotational modulation in a large fraction of A and B stars (Balona, 2013, 2016, 2017, 2019) suggest that activity is indeed present. Furthermore, new ideas regarding how surface magnetism and starspots may be formed in early type stars have been recently proposed (Cantiello et al., 2009; Cantiello & Braithwaite, 2011, 2019). This opens the way for a new interpretation of the short-period variations and mass loss in Be stars.
Balona (1990, 1995) found that the relationship between and the photometric period in Be stars is consistent with rotational modulation. Balona (2003) proposed a magnetic rotator model for mass loss which involves the expulsion of material from an active region in the photosphere. The expelled material is directed to two diametrically opposite regions where the geometric and magnetic axes intersect and forced into co-rotation with the star. This eventually leads to a build-up of material at the two locations, leading to a single- or double-wave light curve depending on the relative amounts of trapped gas at the two regions. Eventually, the gas disperses into the circumstellar disk. We will call this the “impulsive magnetic rotator” model.
In large part, the model was driven by observations which clearly show that at times Be stars can change from a single wave to a double wave light curve (Balona & Engelbrecht, 1986; Balona et al., 1991; Balona & Ozuyar, 2020). This has been quite a well-known characteristic of Be stars for many decades. It is often expressed as frequency groupings in the periodogram, with one group at double the frequency of the other. The relative amplitudes of the two groups vary from season to season. The model was also driven by the fact that early-type Be stars are more active than late-type Be stars. In the model this is partly due to the increasing importance of line-driven stellar winds with increasing effective temperature.
In our first paper (Balona & Ozuyar, 2020), we discussed TESS observations of individual Be stars of particular interest. In this paper we examine all TESS classical Be stars in quarters 1–26. The aim is to investigate the properties of the light curves and to test the model proposed by Balona (2003). As part of a project to classify all TESS stars hotter than 6000 K according to variability type, the fraction of Be stars showing short-period variations is determined. Stellar radii are estimated from Gaia DR2 parallaxes and effective temperatures. Together with the photometric period, the presumed equatorial rotational velocity, , can be found. Values of are compared with in a test for rotational modulation. The distribution is compared with the distribution as a further test. The distribution of and the distribution of for Be stars is obtained without de-convolution for the first time. Finally, the rotational light amplitudes of Be stars are compared with those of non-Be stars at the same effective temperature to determine if there is a difference in how the variations are produced in Be and non-Be stars.
2 The data and catalogue
TESS obtains continuous wide-band photometry with two-minute cadence over 13 observing segments per hemisphere. Each segment is observed continuously for 27 days. Because sectors overlap, stars near the ecliptic equator are only observed for one sector. Stars in the circular regions where segments overlap at the ecliptic poles are observed for about 100 days. The light curves are corrected for time-correlated instrumental signatures using pre-search data conditioning (PDC, Jenkins et al. 2016). The data used here are from sectors 1–26.
This project forms part of a larger project to create a catalogue of the variability type for every star hotter than 6000 K observed by TESS and Kepler. The variability classification follows that of the General Catalogue of Variable Stars (GCVS, Samus et al. 2017). The only recognized class of rotational variable among the A and B stars are the chemically peculiar CVn and SX Ari classes. A new ROT class has been added to describe any star in which the variability is suspected to be due to rotation and not known to be Ap or Bp. The classification was accomplished by visual inspection of the light curve and Lomb-Scargle periodogram (Scargle, 1982) and a rough estimate as to whether the star is hotter or cooler than type A0. This is necessary in order to distinguish Cep and Maia stars from Sct variables and SPB from Dor stars. Aided by suitable software, classification of over 100 stars an hour is possible.
For each star, the literature was searched for the best estimate of the effective temperature, , projected rotational velocity, , and spectral type. Values of in the Kepler Input Catalogue (KIC, Brown et al. 2011) and the TESS Input Catalogue (TIC, Stassun et al. 2018) are unreliable for B stars because the photometric observations from which they are derived lack the U band. Whenever possible, estimates from spectroscopic modelling are used. Values of for Be stars are based on the spectral type because even spectroscopic modelling is unreliable due to emission. For this purpose, the Pecaut & Mamajek (2013) calibration is used. The resulting uncertainty in is probably 1000–2000 K.
The stellar luminosity was estimated from Gaia DR2 parallaxes (Gaia Collaboration et al., 2016, 2018) in conjunction with reddening obtained from a three-dimensional map by Gontcharov (2017) using the bolometric correction calibration by Pecaut & Mamajek (2013). From the error in the Gaia DR2 parallax, the typical standard deviation in is estimated to be about 0.05 dex, allowing for standard deviations of 0.01 mag in the apparent magnitude, 0.10 mag in visual extinction and 0.02 mag in the bolometric correction in addition to the parallax error. Over 61000 TESS stars and 22000 Kepler stars have been classified.
3 Short-period variability in Be stars
The Be stars in this paper are identified using the BeSS database (Neiner et al., 2011). This is a catalog of 2330 classical Be stars. Of the 441 classical Be stars in sectors 1–26 observed by TESS, 319 stars (i.e. 73 percent) were classified as ROT variables. Clearly, quasi-periodic low frequencies are a general characteristic of most Be stars.
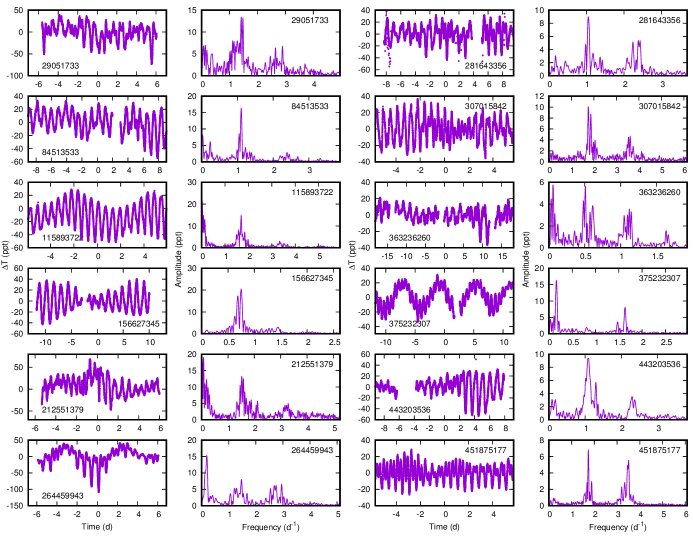
It is relatively easy to identify Be stars from the light curve and periodogram. The general appearance of the light curve tends to be a mixture of fundamental and first harmonic with variable amplitudes. An additional distinction is that many Be stars show a long-term drift in brightness which is sometimes sudden and erratic and, in a few cases, quasi-periodic (e.g., TIC 375232307 in Fig. 1). This is not seen in non-Be stars. About half of the 441 Be stars can be identified from the light curve alone.
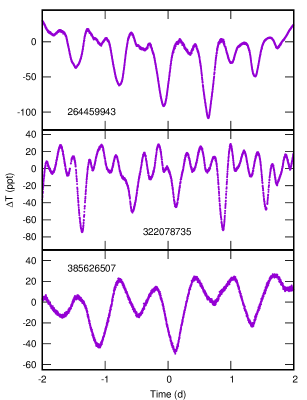
Fig. 1 shows examples of Be light curves and corresponding periodograms. Note that the fundamental and first harmonic are nearly always present. The frequency peaks are broad, indicating non-coherent variations. Another identifying feature in the light curves of many Be stars is that the quasi-periodic variations sometimes resemble eclipses. In other words, the light curve is not sinusoidal, but consists of regular light dips from a more slowly varying light maximum. Examples are shown in Fig. 2.
Although the light curves and periodograms of most Be stars fit the above description, 92 stars in the BeSS catalogue do not. Some are eclipsing binaries, while others are Cep, SPB, Maia or Sct pulsating variables. In others, where no short-period variations are seen, the irregular light variations can probably be attributed to the circumstellar disk.
Groupings of fundamental and first harmonic seem to be present in some B stars not known to be Be stars (Balona et al., 2011). Indeed, 11 TESS stars not known to be Be, have light curves and periodograms closely resembling those of Be stars. Of these, 3 are Bn stars.
4 Rotational modulation
As mentioned in the Introduction, a large fraction of normal A and B stars appear to show low-amplitude periodic light variations which are difficult to understand unless this is a result of starspots (Balona, 2019). However, the light variations in Be stars seem to be far more erratic and of larger amplitude than those seen in A and late B stars. The frequency peaks in Be stars are sometimes very broad (Fig 1), whereas those in A and late B stars are generally narrow. The rapid changes in amplitude of the relative strengths of fundamental and first harmonic in Be stars, as discussed above, are never seen in non-Be stars.
These differences indicate that the cause of rotational modulation in non-Be stars is different from that in Be stars. The observations suggest that whereas the features are rather stable and long-lived in non-Be stars, this is not the case in Be stars. In the impulsive magnetic rotator model, the non-coherence of the light variations can be understood because the trapped gas clouds are continuously changing shape and size. In this model it is the fundamental period which represents the rotation period.
One can test if the fundamental period is the same as the rotation period by comparing the projected rotational velocity, , with the equatorial rotational velocity, , estimated from the stellar radius. The stellar radius can be obtained if we know and the luminosity.
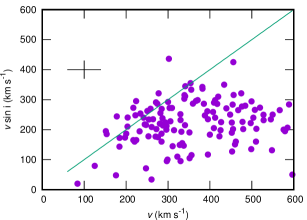
In the first test, shown in Fig. 3, 132 Be stars with known and with Gaia luminosities are shown. The equatorial radius in a rapidly-rotating star is larger than the mean radius. Therefore the estimated equatorial rotational velocity, , is probably too low. On the other hand, the value of derived from the spectral type reflects mostly the cool equatorial region, which means that the resulting is perhaps somewhat lower than the true , resulting in a somewhat larger value of . These two effects balance each other. Considering the large uncertainty in the stellar radius, it is probably best to leave unchanged.
If the photometric period in Be stars is the rotation period, the measured should be lower or equal to the equatorial rotational velocity, , though some stars may be expected to lie above the curve due to uncertainties in the stellar parameters. Also, most stars should be near the line because more stars are likely to be seen equator-on rather than pole-on. Fig. 3 does indeed show the expected behaviour. We conclude that the photometric periods are indistinguishable from the rotation periods.
Another test can be made by comparing the distribution of with the distribution of . For this test, it is reasonable to use all available measurements of for Be stars in the literature. In this way measurements of 461 classical Be stars with K and 160 classical Be stars with K can be used (Fig. 4).
In principle, one could deconvolve the distribution to obtain the distribution of equatorial rotational velocities, , assuming random orientations of the axes of rotation. However, the orientation of the rotation axes of stars used to obtain the distribution cannot be random. The amplitude of rotational modulation will decrease with decreasing inclination and will vanish when the star is pole-on, even though can still be measured. For this reason, the deconvolved from and the photometric distributions cannot be the same.
In Fig. 4, values of from 164 stars were used for the range K and 61 stars for the range K. Considering the large error in the estimated and the relatively small numbers of stars, not much weight can be placed on the details. The distribution is clearly displaced to higher velocities, as expected. Chandrasekhar & Münch (1950) derived relations between the moments of the and distributions assuming random orientation of the rotation axes. For the mean, they find . For 93 stars where both measurements are available, we obtain km s-1 and km s-1 for K. Thus . The mean determined from photometry will be larger than the mean derived from deconvolution of because there will be a deficit of stars with low rotation rates among the photometric values. Thus the larger value of the proportionality factor is to be expected.
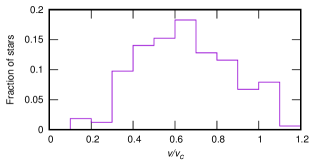
From the photometric distribution it is possible to obtain an idea of the ratio of equatorial velocity to critical velocity, . Using , (estimated from the luminosity), and the metallicity (assumed solar), the stellar mass may be derived using the relation in Torres et al. (2010). From the mass and radius, is obtained. The distribution of for early-Be stars is shown in Fig. 5. The mean value from 225 stars is . This value is the same as that derived by Zorec et al. (2016) from deconvolution of . Note that there is no gravity darkening dependence and the result is independent of . This means that it can no longer be argued that the values are too low owing to extreme gravity darkening in Be stars (Townsend et al., 2004).
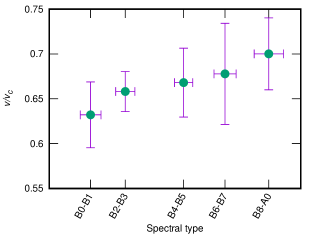
Fig. 6 shows that tends to increase slightly towards late Be stars. This result has been known for a long time (Slettebak, 1982; Yudin, 2001; Cranmer, 2005). Cranmer (2005) found increases from 0.6 to 0.7 between early- and late-Be stars, similar to what is found here.
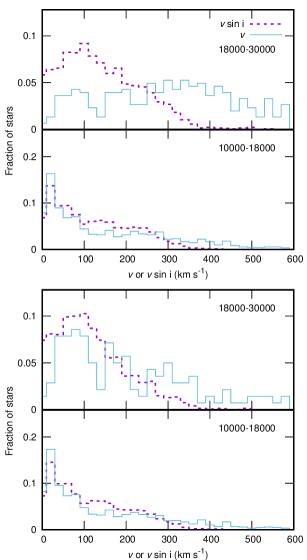
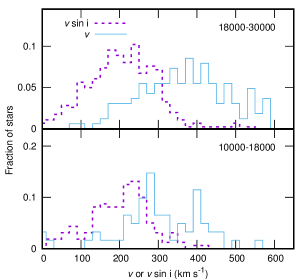
It is instructive to compare the photometric and spectroscopic rotational velocity distributions when non-Be stars are included. Because Be stars are rapid rotators, an excess of Be stars with known relative to the general population will distort the distribution. The top panels of Fig. 7 shows the and distributions for all B stars, including Be stars. For the 18000–30000 K range, the distribution is derived from 304 Be stars and 140 non-Be stars. In other words, 68 percent are Be stars. The distribution for the early B stars is derived from 1939 Be stars and 1482 non-Be stars. This means that 57 percent of stars defining the distribution are Be stars. This difference may account for the poor agreement.
To test this idea, one may compare the and distributions excluding Be stars in both cases. As shown in the bottom panels of Fig. 7, the agreement between the two distributions is improved. For the early-B stars, the distribution is obtained from 140 stars and the distribution from 1482 stars. This seems to support the idea that it is the inclusion of Be stars that distorts the distribution for early-B stars. The distributions for the late-B stars seem unaffected by the inclusion or exclusion of Be stars.
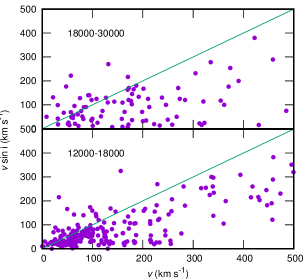
To strengthen the idea that rotational modulation is present among a large fraction on Be and non-Be stars, we show in Fig. 8 the relationship between and for main sequence non-Be stars in two temperature ranges. It is clear from Fig. 8, that the photometric periods are the same as the rotation periods, suggesting the presence of starspots or similar obscuration in non-Be main-sequence stars.
A more accurate measure of the relative proportion of Be stars among B stars may be obtained by counting all main sequence B stars brighter than 10-th magnitude. This limit was chosen on the assumption that the sample of Be stars is probably close to completion. Within this brightness range, there are 1183 stars with K of which 282 are Be stars. Thus Be stars comprise about 24 percent of all early-B stars. As mentioned above, the ratio of Be stars which were classified as ROT is 68 percent. This large fraction of ROT stars in the early-B range clearly suggests that it is much easier to detect rotational modulation among Be stars than in non-Be stars.
Of the 1534 stars with K brighter than 10-th mag, 92 are Be stars (6 percent). This explains why the velocity distributions for late-B stars are relatively unaffected by the inclusion or exclusion of Be stars.
The comparison of the and distributions for early-B stars seems to suggest that the light variations in Be stars are of a different nature from those in non-Be stars. Rotational modulation in Be stars is much easier to detect than in non-Be stars, presumably because they have larger amplitudes (see below). This lends support to the idea that rotational modulation in non-Be stars is a result of starspots, whereas in Be stars it is a result of co-rotating clouds. Additional support may be found in the very important CoRoT time series of TIC 234230792 (HD 49330) first reported by Huat et al. (2009) and described by Balona & Ozuyar (2020). This star happens to be a Cep pulsating variable as well as a classical Be star. There is evidence that the reduction and subsequent increase in amplitude of the pulsations is a consequence of obscuration by co-rotating clouds resulting from an outburst.
5 Amplitudes
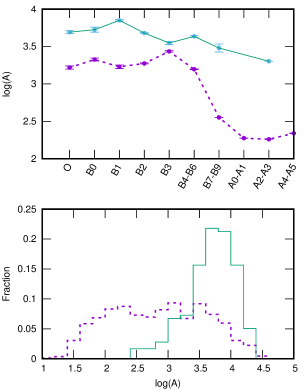
While the quasi-periodic light and line profile variation in early-Be stars is detectable from ground-based observations, the periodic variations associated with starspots in non-Be stars are only detectable from space. Apparently, the obscuration which causes the short-period variations in Be stars is much larger than the obscuration in non-Be stars. To quantify the comparison, the amplitudes of the fundamental and first harmonic in TESS Be stars were added in quadrature and taken as representative of the amplitudes of the quasi-periodic variation. The same was done for non-Be stars and the two compared as a function of spectral type (top panel of Fig. 9).
The amplitudes of the Be stars decrease towards later types, which has been known for a long time. Line-profile variations among late-Be stars are very difficult to detect (Baade, 1989). It is only with the advent of space photometry that short-period light variations were finally detected in late Be stars. Even though the photometric amplitudes of late-Be stars are small, they are still about an order of magnitude larger than non-Be stars. What is particularly noteworthy is the rapid increase in rotational amplitude between A0 and B5 for non-Be stars (top panel of Fig. 9). This clearly requires some thought.
In the bottom panel of Fig. 9, the amplitude distribution for Be stars is compared with non-Be stars. To facilitate the comparison, this is plotted as a log-normal distribution. What is clearly evident is that the amplitude distribution for Be stars is strongly peaked and quite different from that of non-Be stars.
It is possible that the large rotational amplitudes for non-Be stars earlier than B5 may partly be a result of undetected Be stars in the sample. One idea is that there is a continuum between non-Be and Be stars. Perhaps there is a range of surface activity and it is only the most active and rapidly-rotating stars in this range that appear as Be stars. It is well-known that a Be star can lose its emission for many years and then regain it again. This is very difficult to understand unless there is a mechanism which allows for variation in the mass loss. Variations in surface activity may be such a mechanism.
6 Discussion and Conclusions
In Balona & Ozuyar (2020) TESS light curves of 57 classical Be stars were discussed on a star-by-star basis. It was found that most Be stars have non-coherent short-period variations in which the fundamental and first harmonic are dominant. The fundamental period was shown to be most likely the same as the rotation period. The impulsive magnetic rotator model proposed by Balona (2003) was used as a framework for understanding the general characteristics of Be stars.
In this paper, we examine a much larger sample of 463 classical Be stars from TESS sectors 1–26 with the aim of extracting the most important characteristics of the class as a whole.
It is found that about 73 percent of Be stars in this sample have short-period light variations. Many Be stars can be identified from their characteristic light curves and periodograms. In the periodograms of most Be stars, the fundamental and first harmonic peak are often visible. The peaks are always broadened to greater or lesser extent, indicating a non-coherent quasi-periodic behaviour. This is in contrast to the sharp peaks expected from self-driven pulsations. The relative amplitudes of the fundamental and first harmonic may vary on quite short timescales, appearing as a double-wave light curve with components of variable amplitude. In some cases the fundamental or first harmonic disappears altogether, only to reappear at a later time (Balona et al., 1991; Balona & Engelbrecht, 1986; Balona & Ozuyar, 2020).
From the quasi-period and a radius estimate using Gaia DR2 parallaxes, the equatorial rotational velocity, , can be found. The correlation between the equatorial and the projected rotational velocity, , for 132 Be stars confirms that the fundamental quasi-period is indistinguishable from the rotation period. The distribution of equatorial rotational velocities of early-type Be stars is directly derived. It is found that Be stars typically rotate at about 0.6–0.7 of the critical velocity, but with a wide range of velocities. The same result has repeatedly been obtained by several previous analyses (Yudin, 2001; Cranmer, 2005; Zorec et al., 2016; Cochetti et al., 2019).
An analysis of the ratio of equatorial rotation velocity to critical rotational velocity, , shows that with a wide spread in . This result is independent of any assumption regarding gravity darkening and shows that all Be stars cannot possibly be rotating close to critical.
From space photometry of A and B stars, it has been shown that about 20–40 percent of hot main sequence stars show rotational modulation, presumably indicating the presence of starspots (Balona, 2013, 2019, 2020). However, the rotational light amplitudes of Be stars seem to be considerably larger. The amplitude distributions of Be and non-Be stars also differ. It is proposed that in Be stars the periodic light and line-profile modulation is due to magnetically trapped gas clouds rather than starspots. This would also explain the greater non-coherence of the short-period variations in Be stars.
The early-type Be stars have larger rotational amplitudes than late Be stars. Furthermore, even among non-Be stars, there is a sharp rise in rotational amplitudes for A0-B5 stars. This may perhaps be attributed to the larger role played by line-driven winds in the early-B stars.
It is speculated that the difference between non-Be and Be stars lies in the amount of surface activity and the rotation rate. Only the most active and rapidly-rotating stars attain a mass loss rate which is sufficient to cause measurable H emission. A loss in activity would lead to a reduced mass loss rate and the loss of emission, thus explaining why emission may disappear and reappear in a Be star.
The observations may be understood in terms of the impulsive magnetic rotator model (Balona, 2003). This model is similar to the centrifugal magnetosphere model (Babel & Montmerle, 1997; ud-Doula & Owocki, 2002). However, most of the mass loss is not due to a line-driven wind, but to an expulsion of material from active regions associated with starspots. This accounts for the impulsive nature of Be outbursts. Furthermore, the tilted magnetic field is very weak (perhaps only a few Gauss). The expelled material is channeled to two diametrically opposed locations where the geometric and magnetic equators intersect. Material located in these two co-rotating regions leads to non-coherent rotational modulation (quasi-periodicity) owing to short-time changes in size and density of the trapped clouds.
The presence of two diametrically located regions of obscuration explains why the first harmonic is such a characteristic feature of Be stars. Changes in the relative amount of material trapped in the two regions will account for the large changes in relative amplitude of fundamental and first harmonic in Be stars.
An early-B star will have a large ionization radius. Even if the star is rotating well below critical velocity, the long lever arm provided by a weak magnetic field will ensure that the ejected matter attains circular velocity while still ionized and under control of the magnetic field. A late Be star will have a much shorter ionization radius, which means that material remains ionized and under control of the magnetic field much closer to the photosphere. The lever arm is therefore shorter and requires a star already rotating closer to critical for the gas to reach circular velocity. This might explain why late Be stars are rotating in a narrow band close to the critical rotation speed (Yudin, 2001; Cranmer, 2005; Zorec et al., 2016).
The condition to attain co-rotation velocity is much easier to attain in early-B stars than in late B stars because of the larger ionization radius and the importance of line-driven winds. This might explain why most Be stars are of early type. In this way, one can also understand why early-Be stars are more numerous and more active than late-Be stars.
While rotational modulation was proposed long ago (Walker, 1953; Balona, 1990, 1995), it was not generally accepted because it was assumed that stars with radiative envelopes have immaculate, tranquil outer layers which cannot provide the dynamo action required to generate a surface magnetic field. As a result, non-radial pulsation became the most widely accepted model for triggering mass loss (Baade, 1979, 1982). While it does explain the short-period variations (though the implicit assumption of frequency coherence is not supported by observations), the prediction of periodic episodic events of mass loss due to beating of modes has failed the test (Rivinius et al., 1998; Baade et al., 2016). The assumption of near-critical rotational velocity for all Be stars has also failed the test (Yudin, 2001; Cranmer, 2005; Zorec et al., 2016; Cochetti et al., 2019).
It is true that in some Be stars coherent light variations are to be found. The above model by no means rules out that some of the photometric and line profile variations in Be stars are indeed a result of NRP. There are several instances of Be stars which are Cep variables and there are, no doubt, Be stars which are SPB variables as well. After all, they do occupy the Cep and SPB instability strips and there is no reason why pulsation should not occur in an impulsive magnetic rotator. However, NRP requires coherent pulsations and cannot explain the incoherent variations characteristic of Be stars.
It is suspected that Be stars may be just one extreme of a continuum depending on the strength of the field. While Be stars are suspected to have very weak fields, the magnetic Bp stars, which have very strong tilted dipole magnetic fields, resulting in surface element segregation, are the other extreme. In the hottest of these stars, mass loss is dominated by line-driven winds. This model has been successfully used by Townsend & Owocki (2005) for prediction of the light curve of the He-rich chemically peculiar star Ori E.
It is often claimed that a magnetic field has not been detected in any Be star, ruling out the impulsive magnetic rotator model. This is a disingenuous argument because a field of the order of one Gauss is all that is required in the model. At present, the most accurate measurements on Be stars have errors measured in tens of Gauss (Wade et al., 2016b).. In spite of this, HD 208057 (16 Peg) a classical Be star with a rotation period of 1.37 d, has a field strength G (Wade et al., 2016a). Neiner et al. (2012) investigated the Be star Cen and obtained an upper limit of about 80 G (the median error of the measurements is 30 G). Neiner et al. (2012) also found evidence for co-rotating clouds. It is imperative that measurement errors be lowered significantly before any claims of the lack of magnetic fields in Be stars can be made.
Unless a different model is proposed for the presence of rotational modulation in A and B stars, starspots imply the presence of magnetic fields in stars with radiative envelopes. Flares are also seen in A and late-B stars (Balona, 2013, 2015, 2020). These cannot be due to late-type companions since the flare energies are well beyond the largest ever seen in cool flare stars. Rotational modulation and flares provide indirect evidence of the presence of magnetic fields in a sizeable fraction of A and B stars, including Be stars.
Since it is now clear that NRP cannot provide the required mass loss mechanism, further progress must rest on development of the impulsive magnetic rotator model or some other exploration of alternative mass-loss mechanisms.
Acknowledgments
LAB wishes to thank the National Research Foundation of South Africa for financial support. Funding for the TESS mission is provided by the NASA Explorer Program. Funding for the TESS Asteroseismic Science Operations Centre is provided by the Danish National Research Foundation (Grant agreement no.: DNRF106), ESA PRODEX (PEA 4000119301) and Stellar Astrophysics Centre (SAC) at Aarhus University.
This work has made use of the BeSS database, operated at LESIA, Observatoire de Meudon, France: http://basebe.obspm.fr.
This work has made use of data from the European Space Agency (ESA) mission Gaia, processed by the Gaia Data Processing and Analysis Consortium (DPAC). Funding for the DPAC has been provided by national institutions, in particular the institutions participating in the Gaia Multilateral Agreement.
This research has made use of the SIMBAD database, operated at CDS, Strasbourg, France. Data were obtained from the Mikulski Archive for Space Telescopes (MAST). STScI is operated by the Association of Universities for Research in Astronomy, Inc., under NASA contract NAS5-2655.
References
- Baade (1979) Baade D., 1979, The Messenger, 19, 4
- Baade (1982) Baade D., 1982, A&A, 105, 65
- Baade (1989) Baade D., 1989, A&AS, 79, 423
- Baade et al. (2016) Baade D., et al., 2016, A&A, 588, A56
- Babel & Montmerle (1997) Babel J., Montmerle T., 1997, A&A, 323, 121
- Balona (1990) Balona L. A., 1990, MNRAS, 245, 92
- Balona (1995) Balona L. A., 1995, MNRAS, 277, 1547
- Balona (2003) Balona L. A., 2003, in L. A. Balona, H. F. Henrichs, & R. Medupe ed., ASP Conference Series Vol. 305, International Conference on magnetic fields in O, B and A stars. pp 263–268
- Balona (2012) Balona L. A., 2012, MNRAS, 423, 3420
- Balona (2013) Balona L. A., 2013, MNRAS, 431, 2240
- Balona (2015) Balona L. A., 2015, MNRAS, 447, 2714
- Balona (2016) Balona L. A., 2016, MNRAS, 457, 3724
- Balona (2017) Balona L. A., 2017, MNRAS, 467, 1830
- Balona (2019) Balona L. A., 2019, MNRAS, 490, 2112
- Balona (2020) Balona L. A., 2020, Frontiers in Astronomy and Space Sciences, submitted
- Balona & Engelbrecht (1986) Balona L. A., Engelbrecht C. A., 1986, MNRAS, 219, 131
- Balona & Ozuyar (2020) Balona L. A., Ozuyar D., 2020, MNRAS, 493, 2528
- Balona et al. (1991) Balona L. A., Sterken C., Manfroid J., 1991, MNRAS, 252, 93
- Balona et al. (2011) Balona L. A., et al., 2011, MNRAS, 413, 2403
- Brown et al. (2011) Brown T. M., Latham D. W., Everett M. E., Esquerdo G. A., 2011, AJ, 142, 112
- Cantiello & Braithwaite (2011) Cantiello M., Braithwaite J., 2011, A&A, 534, A140
- Cantiello & Braithwaite (2019) Cantiello M., Braithwaite J., 2019, ApJ, 883, 106
- Cantiello et al. (2009) Cantiello M., et al., 2009, A&A, 499, 279
- Chandrasekhar & Münch (1950) Chandrasekhar S., Münch G., 1950, ApJ, 111, 142
- Cochetti et al. (2019) Cochetti Y. R., Arcos C., Kanaan S., Meilland A., Cidale L. S., Curé M., 2019, A&A, 621, A123
- Cranmer (2005) Cranmer S. R., 2005, ApJ, 634, 585
- Gaia Collaboration et al. (2016) Gaia Collaboration et al., 2016, A&A, 595, A1
- Gaia Collaboration et al. (2018) Gaia Collaboration et al., 2018, A&A, 616, A1
- Gontcharov (2017) Gontcharov G. A., 2017, Astronomy Letters, 43, 472
- Huat et al. (2009) Huat A., et al., 2009, A&A, 506, 95
- Jenkins et al. (2016) Jenkins J. M., et al., 2016, in Software and Cyberinfrastructure for Astronomy IV. p. 99133E, doi:10.1117/12.2233418
- Neiner et al. (2011) Neiner C., de Batz B., Cochard F., Floquet M., Mekkas A., Desnoux V., 2011, AJ, 142, 149
- Neiner et al. (2012) Neiner C., et al., 2012, MNRAS, 426, 2738
- Pecaut & Mamajek (2013) Pecaut M. J., Mamajek E. E., 2013, ApJS, 208, 9
- Rivinius et al. (1998) Rivinius T., Baade D., Stefl S., Stahl O., Wolf B., Kaufer A., 1998, A&A, 333, 125
- Samus et al. (2017) Samus N. N., Kazarovets E. V., Durlevich O. V., Kireeva N. N., Pastukhova E. N., 2017, Astronomy Reports, 61, 80
- Scargle (1982) Scargle J. D., 1982, ApJ, 263, 835
- Slettebak (1949) Slettebak A., 1949, ApJ, 110, 498
- Slettebak (1979) Slettebak A., 1979, Space Science Reviews, 23, 541
- Slettebak (1982) Slettebak A., 1982, ApJS, 50, 55
- Stassun et al. (2018) Stassun K. G., et al., 2018, AJ, 156, 102
- Stoeckley (1968) Stoeckley T. R., 1968, MNRAS, 140, 141
- Struve (1931) Struve O., 1931, ApJ, 73, 94
- Torres et al. (2010) Torres G., Andersen J., Giménez A., 2010, A&ARv, 18, 67
- Townsend & Owocki (2005) Townsend R. H. D., Owocki S. P., 2005, MNRAS, 357, 251
- Townsend et al. (2004) Townsend R. H. D., Owocki S. P., Howarth I. D., 2004, MNRAS, 350, 189
- Wade et al. (2016a) Wade G. A., et al., 2016a, MNRAS, 456, 2
- Wade et al. (2016b) Wade G. A., Petit V., Grunhut J. H., Neiner C., MiMeS Collaboration 2016b, in Sigut T. A. A., Jones C. E., eds, Astronomical Society of the Pacific Conference Series Vol. 506, Bright Emissaries: Be Stars as Messengers of Star-Disk Physics. p. 207
- Walker (1953) Walker M. F., 1953, ApJ, 118, 481
- Yudin (2001) Yudin R. V., 2001, A&A, 368, 912
- Zorec et al. (2016) Zorec J., et al., 2016, A&A, 595, A132
- ud-Doula & Owocki (2002) ud-Doula A., Owocki S. P., 2002, ApJ, 576, 413