Automatic Feynman diagram generation for nonlinear optical spectroscopies
Abstract
Perturbative nonlinear optical spectroscopies are powerful methods to understand the dynamics of excitonic and other condensed phase systems. Feynman diagrams have long provided the essential tool to understand and interpret experimental spectra and to organize the calculation of spectra for model systems. When optical pulses are strictly time ordered, only a small number of diagrams contribute, but in many experiments pulse-overlap effects are important for interpreting results. When pulses overlap, the number of contributing diagrams can increase rapidly, especially with higher order spectroscopies, and human error is especially likely when attempting to write down all of the diagrams. We present an automated Diagram Generator (DG) that generates all of the Feynman diagrams needed to calculate any -order spectroscopic signal. We characterize all perturbative nonlinear spectroscopies by their associated phase-discrimination condition as well as the time intervals where pulse amplitudes are nonzero. Although the DG can be used to automate impulsive calculations, its greatest strength lies in automating finite pulse calculations where pulse overlaps are important. We consider third-order transient absorption spectroscopy and fifth-order exciton-exciton interaction 2D (EEI2D) spectroscopy, which are respectively described by 6 or 7 diagrams in the impulsive limit but 16 or 240 diagrams, respectively, when pulses overlap. The DG allows users to automatically include all relevant diagrams at relatively low computational cost, since the extra diagrams are only generated for the inter-pulse delays where they are relevant. For EEI2D spectroscopy, we show the important effects of including the overlap diagrams.
I Introduction
Nonlinear optical spectroscopies (NLOS) are powerful tools for elucidating excited state dynamics of a wide variety of condensed phase systems and have been particularly important for determining the evolution of excitonic systems (Zhang et al., 1998; Brixner et al., 2005; Cho et al., 2005; Abramavicius et al., 2009; Panitchayangkoon et al., 2011; Christensson et al., 2012; Fetherolf and Berkelbach, 2017; Jang and Mennucci, 2018; Cruz et al., 2019; Kiessling and Cina, 2020; Malý et al., 2020; Süß and Engel, 2020). Interpretation of data-rich NLOS signals is centered on Feynman diagrams, which conveniently graphically summarize time-dependent perturbation theory contributions to the signals (Mukamel, 1999). These diagrams give a visual understanding of what types of excited- and ground-state dynamics and/or coherences are probed and can be straightforwardly turned into calculations of contributions to signals. In many cases, diagrams can be determined to give zero contribution without a complicated calculation, making theoretical interpretation easier and calculation less expensive.
When pulse durations are shorter than system dynamics – the impulsive limit – the number of contributing diagrams is often small, especially for third-order spectroscopies. It has been easiest to build intuition about the experimental signatures of particular excitonic processes by considering the impulsive limit (Brixner et al., 2005; Cho et al., 2005; Yang et al., 2007; Huo and Coker, 2011; Panitchayangkoon et al., 2011; Perdomo-Ortiz et al., 2012; Christensson et al., 2012; Dostál et al., 2012; Karki et al., 2014; Fetherolf and Berkelbach, 2017; Provazza et al., 2018; Dostál et al., 2018; Malý and Mančal, 2018). When pulse durations are similar to the timescale of system evolution, however, the effects of pulse overlaps – where the tail of a nominally earlier pulse arrives after the beginning of a nominally later pulse – become important to accurately model and understand experimental results (Gallagher Faeder and Jonas, 1999; Belabas and Jonas, 2004; Yetzbacher et al., 2007; Tekavec et al., 2010; Yuen-Zhou, Krich, and Aspuru-Guzik, 2012; Tiwari, Peters, and Jonas, 2013; Li et al., 2013; Leng et al., 2016; Perlík, Hauer, and Šanda, 2017; Smallwood, Autry, and Cundiff, 2017; Do, Gelin, and Tan, 2017; Paleček et al., 2019; Anda and Cole, 2020). Considering such processes requires many more contributing diagrams. Higher-order spectroscopies, both in the impulsive and pulse-overlap limits, also involve rapidly increasing numbers of contributing diagrams. Human error and fatigue in determining these diagrams accurately become increasingly likely as their numbers proliferate.
We present here an automated Feynman Diagram Generator (DG), which allows convenient, fast, and accurate determination of the diagrams contributing to a particular spectroscopy. We describe all perturbative nonlinear spectroscopies by their associated phase-discrimination conditions. These conditions allow description of both non-colinear phase-matching and colinear phase-cycling experiments (Mukamel, 1999; Tekavec, Lott, and Marcus, 2007; Cho, 2009; Peter Hamm, 2011; Perdomo-Ortiz et al., 2012; Nardin et al., 2013; Bakulin, Silva, and Vella, 2016; Tiwari and Jonas, 2018; Malý and Mančal, 2018). Users input those conditions and the time intervals in which their pulses are nonzero, and the DG produces a list of contributing diagrams. That list can be passed directly to calculation engines to predict the associated spectroscopic signals or can be drawn in the standard diagrammatic format for review. The DG is part of a set of NLOS tools called the Ultrafast Spectroscopy Suite (UFSS), which also contains methods to generate Hamiltonians or Liouvillians for vibronic systems and to calculate the contributions from each diagram (Rose and Krich, 2019, 2020), but its output diagrams can be used with other computational tools or analytic methods to calculate spectroscopic signals (Engel, 1991; Beck et al., 2000; Belabas and Jonas, 2004; Renziehausen, Marquetand, and Engel, 2009; Tanimura, 2012; Johansson, Nation, and Nori, 2012; Yuen-Zhou et al., 2014; Albert et al., 2015; Perlík, Hauer, and Šanda, 2017; Yan, 2017; Smallwood, Autry, and Cundiff, 2017; Fetherolf and Berkelbach, 2017; Provazza et al., 2018; Ke and Zhao, 2018; Mančal, 2020). The DG is free and open-source software written in Python, available for download from github.
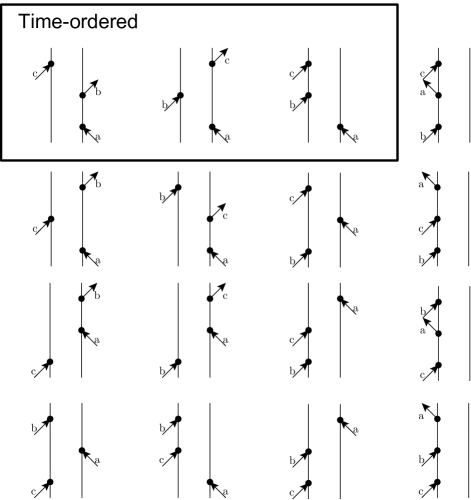
The DG (and the larger UFSS) is designed to make simple the inclusion of the effects of finite-duration pulses in NLOS. While modeling often considers the impulsive limit, pulse-overlap effects can dominate third-order signals such as two-dimensional photon echo (2DPE) spectroscopy, even outside of what is commonly thought of as the pulse-overlap window (Paleček et al., 2019). 2DPE is usually calculated using 6 time-ordered diagrams (3 for the rephasing and 3 for the non-rephasing pathway). When pulses overlap, up to 16 diagrams (shown in Fig. 1) contribute to the signal (Jonas, 2003). These 16 diagrams have been written down by hand and used for calculations in the past.
In higher-order methods, such as fifth-order exciton-exciton interaction 2D spectroscopy (EEI2D), there are 7 Feynman diagrams in the impulsive limit (Dostál et al., 2018). We show that outside of the impulsive limit, EEI2D requires up to 240 Feynman diagrams. This number of diagrams is too large for generation by hand, and as a result we do not believe a calculation with all of these diagrams has previously been attempted in the perturbative limit. References Do et al., 2018; Süß and Engel, 2020 consider finite pulse effects from time-ordered diagrams for several -order spectroscopies. We use EEI2D as our key example of the application of automated diagram generation, showing both 1) that these extra overlap diagrams can be generated and their contributions calculated with surprisingly small extra computational cost and 2) that finite pulse effects arising from non-time-ordered diagrams can provide significant modifications to a sample EEI2D spectra, which can be important for interpretation of experimental results.
The DG automatically creates all of the diagrams that satisfy a given phase-discrimination condition. Since the DG is computationally inexpensive compared to evaluating the contribution of each diagram, in UFSS the DG is run for each set of desired pulse delays. It determines whether pulses overlap, and thus whether overlap diagrams contribute, allowing computation of only causal diagrams for each set of pulse delays. This determination provides a significant computational time savings, since the large number of overlap diagrams only need to be calculated at the (usually small) proportion of pulse delays where they contribute. We further show that heavy-tailed pulse envelopes, such as Lorentzians, require calculation of overlap diagrams out to longer delay times than Gaussian pulse envelopes.
We begin with an overview of perturbative spectroscopy calculations in Sec. II in order to establish the construction of Feynman diagrams, with a unified perspective on both phase matching and phase cycling spectroscopies. We describe the algorithm of the DG in Sec. III including optional methods to reduce the number of diagrams, depending on the system and spectroscopy considered. We demonstrate the utility of the DG by exploring EEI2D spectroscopy in Sec. IV. We consider the same model system as in Ref. Süß et al., 2019, and show that when optical pulses have slightly longer durations than considered in that work, neither the impulsive limit nor the time-ordered diagrams with pulse-shape effects included accurately predict spectra. The calculation with all 240 diagrams requires less than twice the time as using only the 7 time-ordered diagrams despite considering 34 times as many diagrams. These results underscore the importance of including all of the additional 233 overlap diagrams, as well as the utility of the DG in not only generating these diagrams, but also automatically determining in which conditions they contribute.
II Nonlinear spectroscopy and Feynman diagrams
We begin by establishing the standard perturbative framework of nonlinear optical spectroscopy, from which Feynman diagrams are defined (Mukamel, 1999). Consider a system with density matrix , which evolves in the absence of perturbation according to
where is a time evolution operator. We restrict the following discussion to the case of Hamiltonian systems or Markovian open systems, in which , which must be known or approximated in order to complete calculations, but the resulting diagrams are broadly applicable to non-Markovian situations, as well. For the purposes of diagram generation, however, we simply need to assume exists. We also define the differential time evolution operator so
The perturbative optical fields are described as classical electric fields , which interact with the system in the electric-dipole approximation through the perturbation Hamiltonian
| (1) |
where is the electric dipole operator. Then the time evolution of the system is
| (2) |
This form is the basis for diagramatic perturbation theory in .
We describe as a sum over pulses, where each pulse is denoted by a lowercase letter starting from . A typical -order signal is calculated using up to 4 pulses. We write the electric field as
| (3) |
where is the possibly complex polarization vector, and the amplitude of each pulse is defined with envelope , central frequency , wavevector , and phase as
where is the arrival time of each pulse. We make the physical assumption that each pulse is nonzero in the finite interval . The DG uses this range to determine when pulses overlap; the form of is unimportant for diagram generation. The light-matter interaction is a sum over the rotating () and counter-rotating () terms. In the rotating wave approximation (RWA), the rotating terms excite the ket-side and de-excite the bra-side of the density matrix, respectively, and the counter-rotating terms excite the bra-side and de-excite the ket side, respectively (Mukamel, 1999).
We treat the effect of the optical fields using standard time-dependent perturbation theory and assume that at time the system is in a stationary state of , which is . Then
| (4) |
where (Mukamel, 1999)
| (5) |
Using Eq. 3, we define as a sum over four types of terms,
| (6) |
where and are superoperators representing ket- and bra-side actions, respectively, of the rotating terms of pulse on , while and give the equivalent counter-rotating terms. By inspection of Eq. 5, all four types of terms in Eq. 6 can be compactly defined as
| (7) |
where , and , and we define dipole superoperators and . The operators are the building blocks for all perturbative spectroscopies. The full is constructed from the unperturbed state as
| (8) |
which involves terms when the exponent and sum are fully expanded. Each of these terms is a sequence of applications of and can be represented as a Feynman diagram. Most of these diagrams are unimportant for any given spectroscopy, and the subset of diagrams that contributes to a particular experiment is determined by the set of optical pulses and a phase-discrimination condition.
Regardless of the computational details used to calculate the , all perturbative calculations can be represented and organized using the same Feynman diagrams, and thus the DG is useful for any perturbative spectroscopy algorithm. For example, UFSS contains two methods for calculating the action of the operators, which are derived for closed systems in Ref. Rose and Krich, 2019 and for open systems in Ref. Rose and Krich, 2020. The integral form of the in Eq. 7 is convenient for and is the open-systems analogue of similar expressions derived for wavefunctions (Engel, 1991; Yuen-Zhou et al., 2014).
The two widely used phase-discrimination conditions are phase matching and phase cycling. Phase-matching conditions are achieved by using pulses that travel along different directions denoted by wavevectors , converging to interact with a sample that is assumed to be uniform over a volume large compared to the wavelength of the pulses (Mukamel, 1999). The pulses induce a polarization field in the sample , which produces radiation in all directions. A detector placed in a direction that satisfies the phase-matching condition , where are integers, is sensitive to a polarization field that is described by only a subset of diagrams. Often one is interested in the lowest-order signal in perturbation theory that contributes to the given phase-discrimination condition. Heterodyne detection with a local oscillator (LO) allows full determination of amplitude and phase of the emitted radiation.
For example 2D photon echo (2DPE) signals involve three pulses, , that interact with the sample and a fourth LO pulse . The 2DPE rephasing and non-rephasing signals are measured with detectors placed in the (see Fig. 1) and directions, respectively. These signals are calculated using
where are the signals and is the portion of that produces radiation in the direction; the primary purpose of diagrammatic perturbation theory is to organize the efficient calculation of without needing to calculate all contributions to .
An alternative phase discrimination method uses phase cycling over the relative phases of collinear pulses. This method generally detects a signal proportional to an excited state population, such as fluorescence or photocurrent (Tekavec, Lott, and Marcus, 2007; Perdomo-Ortiz et al., 2012; Nardin et al., 2013; Bakulin, Silva, and Vella, 2016). A fourth-order signal in such a setup is calculated as
where is a projection operator onto the relevant excited electronic states and includes only those contributions to that contribute to the chosen phase-cycling condition.
For example, the 2DPE rephasing signal is composed of the 16 diagrams in Fig. 1, which were automatically generated and drawn using the DG. If, however, and (that is, the pulses are time ordered), then only three diagrams contribute, shown in the black box.
The operators as an abstract concept have previously been introduced in various forms (Engel, 1991; Yuen-Zhou et al., 2014). To our knowledge, they have not been used for the purposes of automated calculations before. In Sec. III, we describe how users inputs the pulse intervals and phase discrimination conditions and present the algorithm that produces the relevant diagrams. In Sec. IV we demonstrate the DG by using up to 240 diagrams and show the importance of including the full set of diagrams when performing simulations with finite pulse durations.
III Diagram Generator
The user of the DG inputs the desired phase discrimination condition and pulse intervals, and the DG automatically generates all Feynman diagrams. The DG is much less computationally expensive than the evaluation of the contribution from each diagram, so it is intended to be rerun for each set of desired pulse delays. The DG then returns pulse-overlap diagrams only when the pulse overlaps allow them to contribute. This package generates diagrams as a list of the operators defined in Eq. 7. The and RKE tools outlined in Ref. Rose and Krich, 2020 and included in UFSS are designed to interpret this list and produce spectra. Alternatively, the generated diagrams could be exported to another calculation engine. The DG can also draw them for inspection.
Feynman diagrams are determined by the number of pulses and the phase-discrimination condition. Phase-discrimination determines the number of interactions with the rotating or counter-rotating part of each pulse that contribute to the measured signal. The user inputs the number of each type of interaction as a list of tuples . This list corresponds to detection with in the case of phase matching and to detection of signals in phase with , where are the modulated phases, in the case of phase cycling (Tekavec, Lott, and Marcus, 2007). The order of spectroscopy is given by . In order to determine which diagrams are causally allowed, the user must also input the time intervals when each pulse is nonzero as a list. The user updates this list for each set of pulse delay times desired. The number of diagrams that must be considered when dealing with finite pulses expands dramatically as one considers higher-order signals, such as exciton-exciton interaction 2D spectra (the 3-pulse -order signal measured in the direction, see Sec IV), where the number of time-ordered diagrams is 7 (Süß et al., 2019). However, when all pulses overlap, there are 240 diagrams.
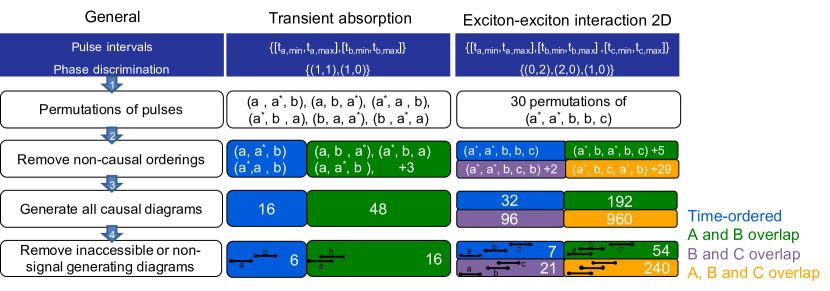
We outline the steps for determining all diagrams that contribute to the signal for a given pulse configuration in Fig. 2, which includes the general scheme and two examples.
(1) Starting from , we begin with a canonical list of interactions, where we list the pulses in order of pulse number starting from , with rotating terms coming before counter-rotating terms (see Fig. 2 for examples). The length of the resulting list is . For each pulse there are repetitions of “” with the rotating term and repetitions of “” with the counter-rotating term, as shown in Fig. 2. We then generate all unique permutations of this canonical list of interactions. The number of unique permutations is
(2) Using the list of pulse intervals , non-causal orderings are removed. For each permutation of the time-ordered list, we check whether of each pulse occurs before of each following pulse in the list and remove the permutation if not.
(3) For each permutation from step 2, we generate all of the allowed diagrams that satisfy the phase-discrimination conditions. Each interaction can occur either on the ket-side () or the bra-side (), giving diagrams associated with each permutation from step 2. For example, the interaction can act as or as , while the interaction can act as either or .
At this point we have the maximum number of diagrams that could contribute to the calculation, given the phase-discrimination condition and pulse intervals. However, many of these diagrams do not contribute under common assumptions. Using some minimal information about the material system that is being modeled, many of these diagrams can be removed in the optional step 4.
(4) (Optional)
-
(a)
Keep only diagrams that remain in accessible states. For instance, consider optical spectroscopy of a system that has three optically separated manifolds, each separated by an energy gap . If the temperature is much less than , we can approximate that the initial thermal state is entirely in the ground-state manifold. Any diagram that includes excitation above the highest manifold or de-excitation from the lowest manifold is removed. We track the number of optical excitations by assigning manifold indices for both the ket and bra sides of a density matrix. We say that the initial density matrix is entirely composed of ground-state populations, and therefore it has manifold indices We then assign the following rules describing the action of the operators:
We apply these rules in succession for a diagram and track the indices after each interaction. If either or drop below 0 or rise above the maximum allowed manifold, the diagram is removed. When the manifolds are coupled by relaxation processes, we no longer remove diagrams that rise above the allowed maximum manifold, since population can decay to a lower manifold and then be excited up again by a subsequent interaction. We do still remove diagrams where or drop below zero.
-
(b)
The integer logic of part 4(a) is also helpful in determining which diagrams contribute to the final signal. For spectroscopies that measure the emitted polarization field, we are interested in the object . Typically in optical spectroscopy, connects only adjacent manifolds (either because this is an accurate model for the dipole operator or because the measurement bandwidth only supports 1-manifold transitions). The components of that contribute are then coherences between adjacent optical manifolds. Therefore, we filter out all diagrams except those that end in a state (Note that the diagrams that end in are physically valid; however, we do not calculate them, as they are the Hermitian conjugate pairs of the calculated diagrams (Mukamel, 1999)). Note that we again cannot apply this filter when includes inter-manifold relaxation.
-
(c)
If the final observable is instead linked to excited-state populations, as in the case of fluorescence or photo-current detection, we look only for diagrams that end in a population where . Again, we cannot apply this filter when includes inter-manifold relaxation.
Each of the diagram reductions from step 4 can be turned off with a flag or modified to suit an accurate model for the system in question. For example, in vibrational spectroscopy, rule 4a) does not apply, but rules 4b) or 4c) (or modifications of them) may still apply. We include a variety of examples of step (4) in the Jupyter notebook DiagramGeneratorExample.ipynb, including an example of infrared vibrational transient absorption that cannot remove any of the causal diagrams and must use all 16 (48 for overlapping pulses) diagrams that come from step (3).
Thus far we have described how the DG creates the double-sided Feynman diagrams associated with density-matrix-based calculations. The DG can also create the one-sided Feynman diagrams used for wavefunction-based calculations (Mukamel, 1999; Yuen-Zhou et al., 2014). This procedure begins by creating all relevant double-sided diagrams. Each double-sided diagram is converted to a pair of one-sided diagrams associated with the bra and ket wavefunctions. Since wavefunction-based calculations do not impose time-ordering between the bra and ket sides (Mukamel, 1999), several of the double-sided diagrams map onto the same pair of single-sided diagrams. After creating all of the pairs of single-sided diagrams, we eliminate duplicates to avoid over-counting some pathways.
The DG both produces a full set of contributing diagrams to be calculated and updates that list as the pulse timings change. In the example -pulse -order spectroscopy considered in Sec. IV, the pulse delays vary to produce frequency-domain signals. Only a small number of pulse configurations have all three pulses overlapping. In those cases, 240 diagrams must be calculated, but as the pulse delays change, calculations can be reduced to 54, 21, or 7 diagrams, which all occurs automatically. Including overlap diagrams increases the number of required diagrams by a factor of over 30, but since diagrams are only included when pulse delays require, calculations of frequency-domain spectra are only 1.5-5 times longer than those including only the 7 time-ordered diagrams, depending upon which pulse delays are calculated.
IV Importance of overlap diagrams
Spectra are often calculated assuming impulsive pulses. Even when finite pulse shapes are considered, the overlap diagrams are often neglected, as in the only two studies of finite pulses in -order spectroscopies of which we are aware (Do et al., 2018; Süß and Engel, 2020). In some cases these approximations are warranted, but sometimes the overlap diagrams are important to understand signals both quantitatively and qualitatively. Here, we demonstrate an example where neglecting overlap diagrams leads to significant artifacts in predicted spectra.
We consider a model system used in Ref. Süß et al., 2019 to study exciton-exciton annihilation, using three-pulse exciton-exciton interaction 2D (EEI2D) spectroscopy. The model consists of a dimer of two coupled three-level systems (3LS). The Hamiltonian takes the form
where , all of the constants are defined in Table 1, are the ground, singly excited, and doubly excited states, respectively, of each 3LS, and . Following Ref. Süß et al., 2019, we consider relaxation processes at zero temperature for each isolated monomer unit from to at rate and neglect relaxation from to , since it is not important for exciton-exciton interactions. Reference Süß et al., 2019 included relaxation using the stochastic Schrodinger equation, while we include relaxation using the Lindblad formalism with
where and are eigenstates of and the Lindblad superoperator is defined by
We follow Ref. Süß et al., 2019 by projecting the monomer relaxation rates into the eigenstates with energy . New relaxation rates coupling the eigenstates of are defined as
The resulting rates range from 0.0075 fs-1 to 0.0016 fs-1 where the smallest rate corresponds to decay from the lowest-energy double-exciton state to the lowest-energy single-exciton state.
EEI2D is designed to probe the dynamics of the doubly excited states. Diagonalizing shows that the two optically bright doubly excited states are separated by , corresponding to an oscillation period of , which is the fastest important oscillation in this system. One generally assumes that pulses significantly shorter than this period will be well-approximated by impulsive pulses but that pulses that interact with the system on a comparable timescale require more careful treatment. In this section we study the effects of using Gaussian pulses with a full-width half-maximum (FWHM) of , with a comparison to Lorentzian pulses at the end.
The perturbative calculations of optical signals were performed using the Ultrafast Ultrafast () Spectroscopy method detailed in Ref. Rose and Krich, 2020. calculates the fifth-order polarization signal as a function of the delay time between pulses and and the delay time between pulses and as
where is the time measured after the arrival of pulse . The 2D frequency-frequency correlation spectrum is calculated as
which is approximated using the discrete Fourier transform. We use as a proxy for the signal field, which would in practice be detected using heterodyne detection with a local oscillator.
| Energy (eV) | 0.0 | 1.0 | 2.2 |
| Coupling (eV) | 0.2 | 0.1 | 0.05 |
| Rate () | 0.015 |
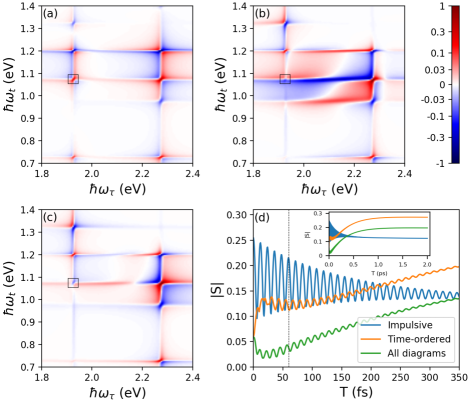
We compare calculations of EEI2D spectra using three approximations: impulsive pulses, finite pulses with only time-ordered diagrams, and finite pulses including all diagrams. Figure 3(a) shows the impulsive limit with a delay time of . In keeping with Ref. Süß et al., 2019, we perform all calculations with and each ranging from to , and multiply the and axes with a Gaussian window function of to avoid ringing effects from the discrete Fourier transform. We calculate spectra for 275 values of and , which are more than sufficient to produce well-resolved frequency-frequency spectra. Reference Süß et al., 2019 performs calculations in the impulsive limit and states that calculations using time-ordered diagrams with 5 fs FWHM pulses are visually nearly identical to the impulsive limit, which we also find. Finite pulse effects are, unsurprisingly, unimportant when the pulse durations are shorter than , the fastest timescale in the system. We use this model system to illustrate the differences that occur with only modestly longer pulses.
We consider Gaussian pulses with FWHM of 15 fs, similar to . Figure 3(b) shows calculations using finite pulses but only the 7 time-ordered diagrams, showing clear differences from the impulsive limit in 3(a). Figure 3(c) shows results using the same finite pulses but including all of the 233 additional pulse overlap diagrams at delay times when they are required. The visual difference between Fig. 3(b) and (c) demonstrates the importance of including pulse-overlap diagrams in addition to finite pulse effects in time-ordered diagrams. Simply adding finite pulse effects to the time-ordered diagrams is not sufficient for making good spectroscopic predictions.
Figure 3(d) shows the magnitude of the cross peak contained in the solid box in panels (a)-(c), and the oscillation period is clearly visible. The oscillations at that peak correspond to absorption into one and emission from another doubly excited eigenstate of . This peak is clearly visible in the impulsive limit in Fig. 3(a), but is dominated by significant horizontal streaks in Fig. 3(b), which bleed over from the stronger peak at eV. This significant extension of the peaks in the direction is an artifact of neglecting the overlap diagrams, demonstrated by its removal in Fig. 3(c). Figure 3(d) shows that both the visibility of the oscillation and the overall evolution of the envelope are qualitatively different in the three studied approximations. We vary from 0 to 2 ps, for a total of 2667 different values of . At long (shown in the inset), the doubly excited states decay and there is a static excited state absorption signal from the singly excited population, with the timescale of saturation and oscillation decay matching the slowest . Neither impulsive nor time-ordered calculations with finite pulses accurately predict this EEI2D spectrum despite using an ultrafast optical pulse.
Note that the differences between the full calculation and the one using only the time-ordered diagrams persist even with delay times much greater than the pulse durations. In constructing , contributions with , smaller than the pulse duration are always included, making pulse-overlap effects apparent even at long and requiring calculation of the overlap diagrams. Since the DG only produces the extra diagrams for time delays that merit their evaluation, the full calculation is not much more expensive than the case with 7 time-ordered diagrams. For example, the calculation of the green and orange curves in Fig. 3(d), out to 350 fs, took 33 and 17 minutes on a 2017 MacBook Pro, respectively, and included over 120,000 combinations of and . The equivalent curves out to 2 ps, as in the inset, required 155 and 93 minutes with the same density of points; those involved over 700,000 pulse delay combinations. Even though the full calculation includes contributions from 34 times more diagrams, it required less than twice the time to run than the time-ordered calculation.
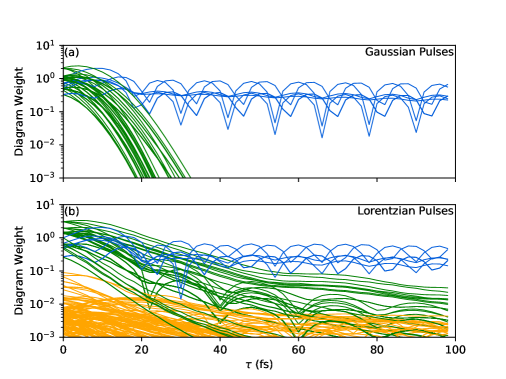
The DG determines which diagrams contribute based solely upon the user-chosen intervals where the pulses are nonzero. For well-behaved pulses such as Gaussians with standard deviation , convergence of spectra within 1% is obtained for the results in Fig. 3 when the pulses are declared to be zero after . However, for pulses with heavy tails, extra care must be taken to determine the correct pulse interval. We compare Gaussian pulses, as used in Fig. 3, to Lorentzian pulses, which have heavy tails. Figure 4 shows the weight for each of the 240 diagrams as a function of at for the system in Fig. 3, where is the signal due to a single diagram and is chosen so that at , the largest weight of a time-ordered diagram is 1. We consider Gaussian and Lorentzian pulse envelopes with the same FWHM of 15 fs.
We observe that for both sets of pulses, at all 47 , overlap diagrams (green) have similar weight and therefore must be calculated, and the same is true of all 233 overlap diagrams at (not shown). With Gaussian pulses, all of the overlap diagrams decay rapidly when exceeds the nominal pulse duration and are negligible when fs. In contrast, with Lorentzian pulses of the same nominal duration, even some diagrams where pulse arrives before pulse or (shown in gold) are surprisingly close in weight to the time-ordered diagrams at , even though the center of pulse arrives 100 fs after the first two. Further, some of the , overlap diagrams (green) continue to have weight equal to time-ordered diagrams (blue) for approaching , four times the pulse FWHM; given the large number of overlap diagrams, their contributions must be calculated even for considerably larger . It is clear that in the case of Lorentzian or other heavy-tailed pulse envelopes, care must be taken in choosing the pulse intervals for use with the DG, and users are encouraged to ensure that their results are converged. Choosing a large pulse interval ensures accuracy but increases computational cost as more overlap diagram contributions must be calculated.
Many ultrashort optical pulses have heavy tails in the time domain, and Ref. Paleček et al., 2019 showed experimental evidence that pulse overlap effects can extend for up to 100 fs when using 17 fs FWHM pulses in 2DPE experiments. They attributed this effect to the significant wings on the pulse envelopes, which is consistent with our analysis of Lorentzian pulses.
V Conclusion
We have presented the diagram generator (DG), a tool for automatically generating the Feynman diagrams that contribute to perturbative nonlinear optical spectroscopies. The DG automatically determines when pulses overlap and only generates extra overlap diagrams when required. This automated process allows users to get the full advantage of including all causally allowed diagrams with a low computational cost.
We have shown that including these overlap diagrams can be important to correctly predicting or interpreting spectra when pulses are not in the impulsive limit. Using EEI2D as an example, we have shown significant errors when using only the time-ordered diagrams with pulses whose duration is similar to the dynamics of the system. We have also shown that overlap diagrams can make significant contributions to the signal for delay times that are large relative to the pulse durations, when those pulses have heavy temporal tails, as in the case of Lorentzian pulses.
The DG is one module of the larger Ultrafast Spectroscopy Suite. The other components in UFSS are described in Refs. (Rose and Krich, 2019, 2020). Taken together, UFSS is a tool for automatically calculating arbitrary-order spectroscopic signals while accounting for effects of finite pulse shapes, which can be of arbitrary form. The diagrams produced by the DG can also be used in other analytical or numerical tools. The DG can be used for determining all of the diagrams that contribute to any order spectra, whether in the impulsive limit or with finite pulses. The DG may open the door to more easily calculating higher-order corrections to commonly used -order spectroscopies and may lend itself to developing intuition for higher-order spectroscopic techniques.
Acknowledgements.
We acknowledge support from the Natural Sciences and Engineering Research Council of Canada (NSERC) and the Ontario Trillium Scholarship.Data Availability Statement
The data that support the findings of this study are available from the corresponding author upon reasonable request. In addition, the code to generate all of the figures in this manuscript is available at github.
References
- Zhang et al. (1998) W. M. Zhang, T. Meier, V. Chernyak, and S. Mukamel, The Journal of Chemical Physics 108, 7763 (1998).
- Brixner et al. (2005) T. Brixner, J. Stenger, H. M. Vaswani, M. Cho, R. E. Blankenship, and G. R. Fleming, Nature 434, 625 (2005).
- Cho et al. (2005) M. Cho, H. M. Vaswani, T. Brixner, J. Stenger, and G. R. Fleming, The Journal of Physical Chemistry B 109, 10542 (2005).
- Abramavicius et al. (2009) D. Abramavicius, B. Palmieri, D. V. Voronine, F. Šanda, and S. Mukamel, Chemical Reviews 109, 2350 (2009).
- Panitchayangkoon et al. (2011) G. Panitchayangkoon, D. V. Voronine, D. Abramavicius, J. R. Caram, N. H. C. Lewis, S. Mukamel, and G. S. Engel, Proceedings of the National Academy of Sciences 108, 20908 (2011).
- Christensson et al. (2012) N. Christensson, H. F. Kauffmann, T. Pullerits, and T. Mančal, J. Phys. Chem. B 116, 7449 (2012).
- Fetherolf and Berkelbach (2017) J. H. Fetherolf and T. C. Berkelbach, The Journal of Chemical Physics 147, 244109 (2017).
- Jang and Mennucci (2018) S. J. Jang and B. Mennucci, Rev. Mod. Phys. 90, 035003 (2018).
- Cruz et al. (2019) C. D. Cruz, J. Yuan, C. Climent, N. T. Tierce, P. R. Christensen, E. L. Chronister, D. Casanova, M. O. Wolf, and C. J. Bardeen, Chem. Sci. 10, 7561 (2019).
- Kiessling and Cina (2020) A. J. Kiessling and J. A. Cina, The Journal of Chemical Physics 152, 244311 (2020).
- Malý et al. (2020) P. Malý, S. Mueller, J. Lüttig, C. Lambert, and T. Brixner, The Journal of Chemical Physics 153, 144204 (2020).
- Süß and Engel (2020) J. Süß and V. Engel, The Journal of Chemical Physics 153, 164310 (2020).
- Mukamel (1999) S. Mukamel, Principles of Nonlinear Optical Spectroscopy (Oxford University Press, 1999).
- Yang et al. (2007) L. Yang, I. V. Schweigert, S. T. Cundiff, and S. Mukamel, Phys. Rev. B 75, 125302 (2007).
- Huo and Coker (2011) P. Huo and D. F. Coker, J. Phys. Chem. Lett. 2, 825 (2011).
- Perdomo-Ortiz et al. (2012) A. Perdomo-Ortiz, J. R. Widom, G. A. Lott, A. Aspuru-Guzik, and A. H. Marcus, J. Phys. Chem. B 116, 10757 (2012).
- Dostál et al. (2012) J. Dostál, T. Mančal, R.-n. Augulis, F. Vácha, J. Pšenčík, and D. Zigmantas, J. Am. Chem. Soc. 134, 11611 (2012).
- Karki et al. (2014) K. J. Karki, J. R. Widom, J. Seibt, I. Moody, M. C. Lonergan, T. Pullerits, and A. H. Marcus, Nature Communications 5, 5869 (2014).
- Provazza et al. (2018) J. Provazza, F. Segatta, M. Garavelli, and D. F. Coker, Journal of Chemical Theory and Computation 14, 856 (2018).
- Dostál et al. (2018) J. Dostál, F. Fennel, F. Koch, S. Herbst, F. Würthner, and T. Brixner, Nature Communications 9, 2466 (2018).
- Malý and Mančal (2018) P. Malý and T. Mančal, J. Phys. Chem. Lett. 9, 5654 (2018).
- Gallagher Faeder and Jonas (1999) S. M. Gallagher Faeder and D. M. Jonas, The Journal of Physical Chemistry A 103, 10489 (1999).
- Belabas and Jonas (2004) N. Belabas and D. M. Jonas, Opt. Lett. 29, 1811 (2004).
- Yetzbacher et al. (2007) M. K. Yetzbacher, N. Belabas, K. A. Kitney, and D. M. Jonas, The Journal of Chemical Physics 126, 044511 (2007).
- Tekavec et al. (2010) P. F. Tekavec, J. A. Myers, K. L. M. Lewis, F. D. Fuller, and J. P. Ogilvie, Opt. Express 18, 11015 (2010).
- Yuen-Zhou, Krich, and Aspuru-Guzik (2012) J. Yuen-Zhou, J. J. Krich, and A. Aspuru-Guzik, The Journal of Chemical Physics 136, 234501 (2012).
- Tiwari, Peters, and Jonas (2013) V. Tiwari, W. K. Peters, and D. M. Jonas, Proceedings of the National Academy of Sciences 110, 1203 (2013).
- Li et al. (2013) H. Li, A. P. Spencer, A. Kortyna, G. Moody, D. M. Jonas, and S. T. Cundiff, J. Phys. Chem. A 117, 6279 (2013).
- Leng et al. (2016) X. Leng, S. Yue, Y.-X. Weng, K. Song, and Q. Shi, Chemical Physics Letters, 667 (2016).
- Perlík, Hauer, and Šanda (2017) V. Perlík, J. Hauer, and F. Šanda, J. Opt. Soc. Am. B 34, 430 (2017).
- Smallwood, Autry, and Cundiff (2017) C. L. Smallwood, T. M. Autry, and S. T. Cundiff, J. Opt. Soc. Am. B 34, 419 (2017).
- Do, Gelin, and Tan (2017) T. N. Do, M. F. Gelin, and H.-S. Tan, The Journal of Chemical Physics 147, 144103 (2017).
- Paleček et al. (2019) D. Paleček, P. Edlund, E. Gustavsson, S. Westenhoff, and D. Zigmantas, The Journal of Chemical Physics 151, 024201 (2019).
- Anda and Cole (2020) A. Anda and J. H. Cole, “Two-dimensional spectroscopy beyond the perturbative limit: the influence of finite pulses and detection modes,” (2020), arXiv:2011.04343 .
- Tekavec, Lott, and Marcus (2007) P. F. Tekavec, G. A. Lott, and A. H. Marcus, J. Chem. Phys. 127, 214307 (2007).
- Cho (2009) M. Cho, Two-Dimensional Optical Spectroscopy (CRC Press, 2009).
- Peter Hamm (2011) M. Z. Peter Hamm, Concepts and Methods of 2D Infrared Spectroscopy (Cambridge University Press, 2011).
- Nardin et al. (2013) G. Nardin, T. M. Autry, K. L. Silverman, and S. T. Cundiff, Opt. Express 21, 28617 (2013).
- Bakulin, Silva, and Vella (2016) A. A. Bakulin, C. Silva, and E. Vella, The Journal of Physical Chemistry Letters 7, 250 (2016).
- Tiwari and Jonas (2018) V. Tiwari and D. M. Jonas, The Journal of Chemical Physics 148, 084308 (2018).
- Rose and Krich (2019) P. A. Rose and J. J. Krich, The Journal of Chemical Physics 150, 214105 (2019).
- Rose and Krich (2020) P. A. Rose and J. J. Krich, “Efficient numerical method for predicting nonlinear optical spectroscopies of open systems,” (2020), arXiv:2008.05082 .
- Engel (1991) V. Engel, Computer Physics Communications 63, 228 (1991).
- Beck et al. (2000) M. Beck, A. Jackle, G. Worth, and H.-D. Meyer, Physics Reports 324, 1 (2000).
- Renziehausen, Marquetand, and Engel (2009) K. Renziehausen, P. Marquetand, and V. Engel, Journal of Physics B: Atomic, Molecular and Optical Physics 42, 195402 (2009).
- Tanimura (2012) Y. Tanimura, The Journal of Chemical Physics 137, 22A550 (2012).
- Johansson, Nation, and Nori (2012) J. Johansson, P. Nation, and F. Nori, Computer Physics Communications 183, 1760 (2012).
- Yuen-Zhou et al. (2014) J. Yuen-Zhou, J. J. Krich, I. Kassal, A. S. Johnson, and A. Aspuru-Guzik, Ultrafast Spectroscopy (IOP Publishing, 2014).
- Albert et al. (2015) J. Albert, M. Falge, M. Keß, J. G. Wehner, P.-P. Zhang, A. Eisfeld, and V. Engel, The Journal of Chemical Physics 142, 212440 (2015).
- Yan (2017) Y.-a. Yan, Chinese Journal of Chemical Physics 30, 277 (2017).
- Ke and Zhao (2018) Y. Ke and Y. Zhao, The Journal of Chemical Physics 149, 014104 (2018).
- Mančal (2020) T. Mančal, “Quantarhei: Molecular open quantum systems package,” http://github.com/tmancal74/quantarhei (2020).
- Jonas (2003) D. M. Jonas, Annual Review of Physical Chemistry 54, 425 (2003).
- Do et al. (2018) T. N. Do, L. Chen, A. K. Belyaev, H.-S. Tan, and M. F. Gelin, Chemical Physics 515, 119 (2018).
- Süß et al. (2019) J. Süß, J. Wehner, J. Dostál, T. Brixner, and V. Engel, The Journal of Chemical Physics 150, 104304 (2019).