- •
Multigap superconductivity in the Mo5PB2 boron-
phosphorus compound
Abstract
The tetragonal Mo5PB2 compound was recently reported to show superconductivity with a critical temperature up to 9.2 K. In search of evidence for multiple superconducting gaps in Mo5PB2, comprehensive measurements, including magnetic susceptibility, electrical resistivity, heat capacity, and muon-spin rotation and relaxation (SR) measurements were carried out. Data from both low-temperature superfluid density and electronic specific heat suggest a nodeless superconducting ground state in Mo5PB2. Two superconducting energy gaps = 1.02 meV (25%) and 1.49 meV (75%) are required to describe the low- electronic specific-heat data. The multigap features are clearly evidenced by the field dependence of the electronic specific-heat coefficient and the Gaussian relaxation rate in the superconducting state (i.e., superfluid density), as well as by the temperature dependence of the upper critical field. By combining our extensive experimental results with numerical band-structure calculations, we provide compelling evidence of multigap superconductivity in Mo5PB2.
Keywords: Multigap, superconductivity, SR
1 Introduction
The family, where is a transition or rare-earth metal and a (post)-transition metal or a metalloid element, features three distinct structural symmetries: orthorhombic Yb5Sb3-type (, No. 62), tetragonal Cr5B3-type (, No. 140), and hexagonal Mn5Si3-type (, No. 193). The tetragonal Cr5B3-type structure is adopted by a broad range of binary and ternary compounds. Among these, the layered ternary compounds of transition metals with boron and silicon (or boron and phosphorus), with a B2 stoichiometry ( = P or Si), exhibit many interesting properties. For example, Co5SiB2 exhibits a paramagnetic ground state, found to persist down to liquid He temperature [1]. On the other hand, when is occupied by other metals, such as Mn or Fe, both SiB2 and PB2 are ferromagnets with high Curie temperatures. Therefore, currently they are being studied for room-temperature magnetocaloric applications or as rare-earth-free permanent magnets [2, 3, 4, 5]. Unlike these high-temperature ferromagnets, the 4 and 5 compounds Nb5SiB2, Mo5SiB2, and W5SiB2 are superconductors, with transition temperatures in the 5 to 8 K range [6, 7, 8, 9]. Later on, the Cr5B3-type Ta5GeB2 boro-germanide could also be synthesized and shown to become a superconductor below K [10].
Very recently, a new member of the Cr5B3-type series, namely Mo5PB2, was synthesized and shown to exhibit superconductivity (SC) with a critical temperature K [11], the highest recorded in this family of compounds. According to electrical resistivity measurements under various applied magnetic fields, its upper critical field, T, seems to be much higher than that of Mo5SiB2 (0.6 T) or W5SiB2 (0.5 T) [7, 8]. In addition, over a wide temperature range, the temperature-dependent of Mo5PB2 seems inconsistent with the Ginzburg-Landau- or Werthamer-Helfand-Hohenberg models, implying multiple superconducting gaps in Mo5PB2 [11]. To date, a detailed analysis of the data is still missing. Yet, possible multigap features were already suggested by zero-field heat-capacity measurements and electronic band-structure calculations [11]. Indeed, its zero-field specific-heat seems more consistent with a two-gap- rather than with a single-gap model, as confirmed also by the present work. First-principle calculations indicate Mo5PB2 to be a multiband metal, whose density of states (DOS) at the Fermi level is dominated by the Mo 4-orbitals.
Although electronic band-structure calculations are available for Mo5PB2 and its superconductivity has been studied via macroscopic techniques (e.g., specific heat), the microscopic nature of its SC remains largely unexplored. In particular, the multigap feature of Mo5PB2 demands stronger evidence. To this aim, we performed an extensive study of the superconducting properties of Mo5PB2 by means of electrical resistivity, magnetization, thermodynamic- and, in particular, by muon-spin rotation and relaxation (SR) methods. We find that Mo5PB2 exhibits a fully-gapped superconducting state with preserved time-reversal symmetry. Its multigap features are strongly evidenced by the field-dependent electronic specific-heat coefficient, as well as by the superconducting SR relaxation, the latter being highly consistent with the temperature dependence of the upper critical field.
2 Methods
Polycrystalline samples of Mo5PB2 were prepared by solid-state reaction methods, the procedures used to synthesize the material being reported in detail elsewhere [11]. Room-temperature x-ray powder diffraction (XRD) measurements were used to check the quality of the Mo5PB2 samples, by employing a Bruker D8 diffractometer with Cu K radiation. The magnetic susceptibility, electrical resistivity, and heat-capacity measurements were performed on a 7-T Quantum Design magnetic property measurement system (MPMS-7) and a 14-T physical property measurement system (PPMS-14) equipped with a 3He cryostat.
The bulk SR measurements were carried out at the general-purpose (GPS) and the multipurpose (Dolly) surface-muon spectrometers at the Swiss muon source of Paul Scherrer Institut, Villigen, Switzerland [12]. For the low-temperature measurements on Dolly (down to 0.3 K), the samples were mounted on a thin copper foil (ca. 30 m thick) using diluted GE varnish. Transverse-field (TF) SR measurements were carried out to investigate the superconducting properties (mostly the gap symmetry) of Mo5PB2. To track the additional field-distribution broadening due to the flux-line-lattice (FLL) in the mixed superconducting state, we followed a field-cooling (FC) protocol, where the magnetic field is applied in the normal state, before cooling the sample down to base temperature. Afterwards, the TF-SR spectra were collected at various temperatures upon warming. The SR data were analyzed by means of the musrfit software package [13].
The electronic band structure of Mo5PB2 was calculated via the density functional theory, within the generalized gradient approximation (GGA) of Perdew-Burke-Ernzerhof (PBE) realization [14], as implemented in the Vienna ab-initio Simulation Package (VASP) [15, 16]. The projector augmented wave (PAW) pseudopotentials were adopted for the calculation [17, 18]. Electrons belonging to the outer atomic configuration were treated as valence electrons, here corresponding to 6 electrons in Mo (), 5 electrons in P (), and 3 electrons in B (). The kinetic energy cutoff was fixed to 500 eV. The lattice parameters and the atomic positions experimentally determined from Rietveld refinements were chosen for the calculations. For the self-consistent calculation, the Brillouin zone integration was performed on a -centered mesh of -points.
3 Results and discussion
3.1 Crystal structure and phase purity
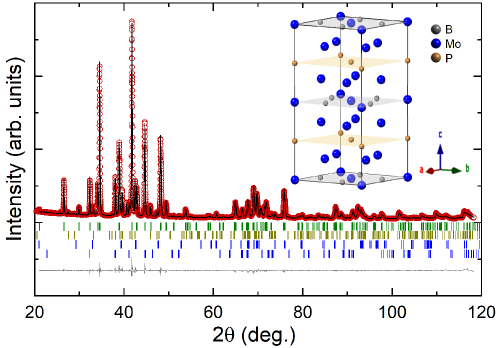
The crystal structure and the purity of Mo5PB2 polycrystalline samples were checked via powder XRD at room temperature. Figure 1 shows a refinement of the XRD pattern, performed by means of the FullProf Rietveld-analysis suite [19]. The refinement confirms that Mo5PB2 crystallizes in the tetragonal Cr5B3-type structure, also known as T2-phase. The refined lattice parameters, Å and Å, are in good agreement with the results reported in the literature [11]. Similar to previous work, also our data (see figure 1) indicate that, besides the main Mo5PB2 phase (80%), there are also extra reflections belonging to minor foreign phases: Mo3P (16%) and MoB/Mo2B (4%). Once formed, due to their very high melting temperature (above 2000∘C), such extraneous phases are very stable and almost impossible to remove, even after multiple additional annealings. These minor phases, too, are superconductors, with critical temperatures below 5.5 K [20, 21, 22]. Nevertheless, upon investigating the Mo5PB2 samples, no superconducting signal from the MoB or Mo2B phases could be identified. Therefore, they do not influence the determination of the superconducting parameters of Mo5PB2. As for Mo3P, its contribution was properly subtracted when analyzing the zero-field specific-heat data (see details below and also in Ref. [11]). The refined Mo5PB2 crystal structure, shown in the inset, comprises three different layers (MoB, Mo, and P), stacked alternatively along the -axis and resembling a quasi-two dimensional structure. Clearly, in the unit cell there are two distinct crystallographic sites for the Mo atoms and a single site for the P or B atoms.
3.2 Electrical resistivity
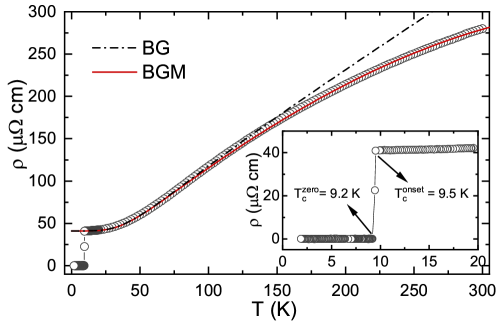
The temperature dependence of the electrical resistivity , collected in zero magnetic field from 300 down to 2 K, reveals the metallic character of Mo5PB2 (see figure 2). The electrical resistivity in the low- region is shown in the inset. Here, the superconducting transition, with K and K, is clearly visible and the data are consistent with previous work [11]. The normal-state electrical resistivity is well modeled by the Bloch-Grüneisen-Mott (BGM) formula [23, 24]. Here, represents the residual resistivity, while the second term describes the electron-phonon scattering, with being the characteristic Debye temperature and a coupling constant. The third term represents a contribution from the - interband scattering, being the Mott coefficient [25, 26]. As shown in figure 2, the Mott correction is clearly required. Indeed, the black dash-dotted line, a fit to the BG formula without the Mott term, deviates significantly from the experimental data above 150 K. The fit to BGM (red solid line) results in cm, cm, K, and 10-6 cmK-3. A similar value was also found in Mo3P (3.4 cm K-3) [22], indicating that, most likely, the - scattering is due to Mo - and to P -electrons.
3.3 Heat capacity
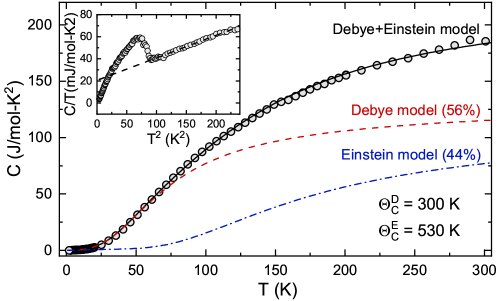
The Debye temperature can also be estimated from the heat capacity measurements. As shown in figure 3, a pure Debye model cannot fit the data properly. However, when combined with an Einstein model, it reproduces the data fairly accurately. In this case, the solid line is a fit to the Debye- and Einstein model , with relative weights and . Here, is the number of atoms per formula-unit in Mo5PB2. The first term represents the electronic specific heat, which can be extracted from the low- data (see inset in figure 3). The second and the third terms represent the acoustic- and optical phonon-mode contributions, described by the Debye- and Einstein model , respectively [27]. Here J/mol-K is the molar gas constant, while and are the Debye and Einstein temperatures. The solid line in figure 3 represents the best fit, corresponding to K, K, and . The obtained Debye temperature is slightly higher than that derived from electrical resistivity data (see figure 2). In fact, unlike electrical transport, heat capacity reflects better the bulk properties and, therefore, is more susceptible to extrinsic phases. In our case, the higher Debye temperature determined from heat-capacity measurements is most likely related to the MoB or Mo2B phases, since the light B atoms usually exhibit rather high phonon frequencies, corresponding to large Debye temperatures (e.g., 400 K for MoB) [28].
3.4 Magnetization
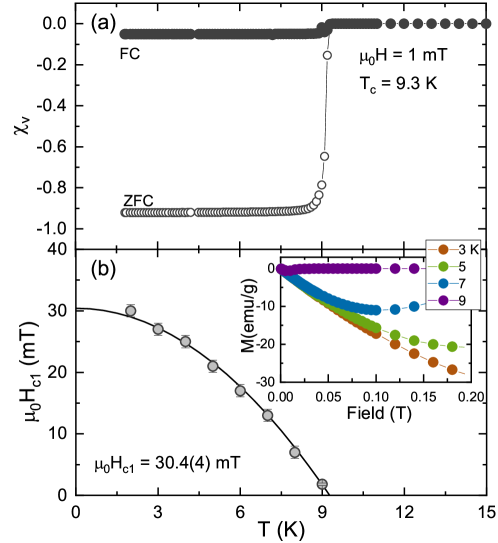
The superconductivity of Mo5PB2 was also evidenced by magnetization measurements. The temperature-dependent magnetic susceptibility measured in a field of 1 mT using both field-cooled and zero-field-cooled (ZFC) protocols, is shown in figure 4(a). A sharp diamagnetic transition at = 9.3 K indicates the onset of superconductivity in Mo5PB2, in agreement with the values determined from electrical resistivity and heat capacity. The well separated ZFC- and FC-susceptibility curves imply a strong flux-pinning effect in Mo5PB2. By assuming a cuboid (or, in general, an ellipsoid) sample shape with 1 and 0.5, the estimated demagnetization factor is 0.5, with the field applied along the -direction [29, 30]. After accounting for the demagnetization factor, the superconducting shielding fraction of Mo5PB2 is about 92%. To determine the lower critical field of Mo5PB2, essential for performing SR measurements on type-II superconductors, the field-dependent magnetization was measured at various temperatures up to . Some representative curves, recorded using a ZFC-protocol, are shown in the inset of figure 4(b). The estimated values vs temperature are summarized in the main panel, where the zero-temperature lower critical field = 30.4(4) mT is also determined. This is highly consistent with 30.8 mT, the value calculated from the magnetic penetration depth (see below).
3.5 TF-SR and superconducting order parameter
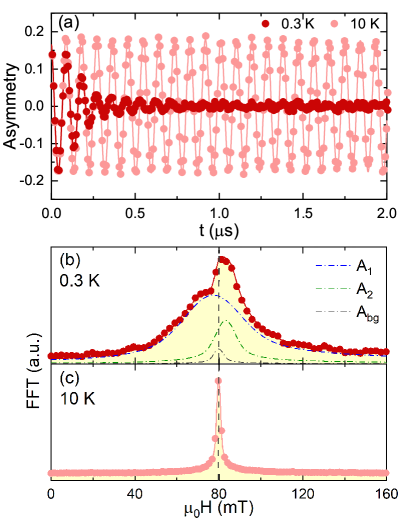
The TF-SR measurements were carried out in a field of 80 mT, twice the value. Two representative TF-SR spectra of Mo5PB2, collected at 0.3 K and 10 K (i.e., in the superconducting and the normal state) are shown in figure 5(a). In the normal state, the spectra have essentially no damping, reflecting the uniform field distribution, as well as the nomagnetic nature of Mo5PB2. Below , instead, the significantly enhanced damping occurring in the mixed state reflects the inhomogeneous field distribution due to the development of FLL [31, 32, 33, 34]. This additional SC-related broadening is clearly visible in figure 5(b), where the fast-Fourier-transform (FFT) spectrum of the corresponding TF-SR data is shown. To describe the asymmetric field distribution taking place below , the SR spectra can be modeled by means of the expression:
| (1) |
Here and represent the initial muon-spin asymmetries for muons implanted in the sample and sample holder, respectively, with the latter giving rise to a background signal not undergoing any depolarization. and are the local fields sensed by the implanted muons in the sample and the sample holder (the latter normally experiencing the unchanged external field), MHz/T is the muon gyromagnetic ratio, is a shared initial phase, and is the Gaussian relaxation rate of the th component.
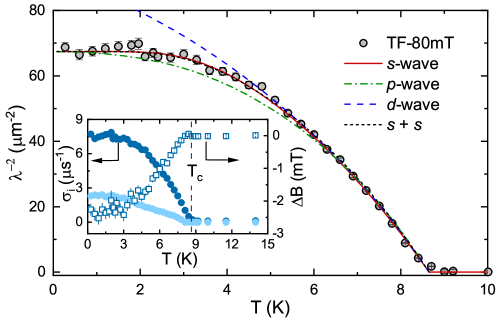
Generally, the field distribution in the SC state is material dependent: the more asymmetric it is, the more components are required to describe it. Here we found that, to properly describe the TF-SR spectra in the superconducting state of Mo5PB2, at least two oscillations are required. This is illustrated in figure 5(b), where two broad peaks, above and below the applied magnetic field (80 mT), can be clearly seen. Both peaks are much broader than the single peak shown in figure 5(c), corresponding to the field distribution in the normal state. The solid lines in figure 5 represent fits to Eq. 1 with , while the dash-dotted lines in figure 5(b) evidence the single components at 0.3 K and the background signal. The derived Gaussian relaxation rates as a function of temperature are summarized in the inset of figure 6. At base temperature (0.3 K), and reflect the and field distributions in figure 5(b), respectively. Above , the relaxation rate is small and temperature-independent, but below it starts to increase due to the onset of FLL and the increased superfluid density. At the same time, also a diamagnetic field shift appears below , given by , with , , and mT (see inset in figure 6). The effective Gaussian relaxation rate can be estimated from [34]. Then, the superconducting Gaussian relaxation rate, encoded in the value, can be extracted by subtracting the nuclear contribution according to . Here, is the nuclear relaxation rate, almost constant in our narrow temperature range, as confirmed by zero-field (ZF) SR data (see figure 12). For small applied magnetic fields (/ 0.04 1), the magnetic penetration depth can be calculated from [35, 36]. Figure 6 shows the temperature dependent inverse square of the magnetic penetration depth [proportional to the superfluid density, i.e.., ] for Mo5PB2. The superfluid density was further analyzed by using different models, generally described by:
| (2) |
Here, is the Fermi function and represents an average over the Fermi surface [37]. is an angle-dependent gap function, where is the maximum gap value and is the angular dependence of the gap, equal to 1, , and for an -, -, and -wave model, respectively, with and being the azimuthal angles. The temperature dependence of the gap is assumed to follow [37, 38], where is the gap value at 0 K.
Four different models, including single-gap -, -, and -wave, and two-gap -wave, were used to describe the dependence. For an - or -wave model, the best fits yield the same zero-temperature magnetic penetration depth nm, but different gap values, 1.42(2) and 1.87(2) meV, respectively. For the -wave model, the estimated and gap value are 104(2) nm and 1.75(2) meV. As can be clearly seen in figure 6, the significant deviation of the - or -wave model from the experimental data below 5 K and the temperature-independent behavior of for K strongly suggest a fully-gapped superconductivity in Mo5PB2. According to previous studies [11], two gaps are required to quantitatively describe the specific-heat data (as confirmed also here, see below). Here, by fixing the weight , as determined from the electronic specific heat (see below), the two-gap -wave model provides almost identical results to the single-gap -wave model. The two derived gap values and meV are very similar to those determined from electronic specific heat.
Since the weight of the second gap is relatively small (0.25–0.3) and the gap sizes are not significantly different (/ 0.71), this makes it difficult to discriminate between a single- and a two-gap superconductor based on the temperature-dependent superfluid density alone [39, 40]. Nevertheless, as we show further, the two-gap feature of Mo5PB2 is clearly reflected also in its field-dependent superconducting relaxation rate . Since normally the different gaps respond differently to an external field, exhibits different features in a two-gap superconductor compared to a single-gap superconductor.
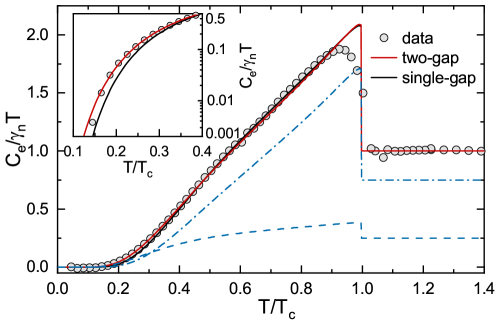
To reveal the multigap superconductivity of Mo5PB2, we also analyzed the zero-field electronic specific-heat data. After subtracting from the raw specific-heat data the phonon contribution (see details in the inset of figure 3) and the spurious Mo3P contribution (see details in Ref. [11]), the resulting electronic specific heat divided by the normal-state electronic specific-heat coefficient, i.e., , is reported in figure 7. Since the previous analysis of already excluded the occurrence of nodes in the SC gap, the temperature-dependent electronic specific heat was analyzed by using a fully-gapped model. The solid black line in figure 7 represents a fit to the -wave model with a single gap meV (i.e., equivalent to the standard BCS value 1.76 k). It reproduces very well the experimental data above . Yet, at lower temperatures, the single-gap model shows a less satisfactory agreement (see inset). At the same time, the two-gap model exhibits a much better agreement across the full temperature range, in particular for (see inset), reflected in a much smaller value. The solid red line in figure 7 is a fit to the two-gap -wave model, [41]. Here and are the single-gap specific-heat contributions, with the first- (small) and the second (large) gap, and the relative weight. The two-gap model gives meV, meV, and , the two superconducting gap values being consistent with previous results [11]. The large-gap value, as well as the gap value determined from TF-SR, are both greater than expected from the BCS theory in the weak-coupling regime, hence indicating strong-coupling superconductivity in Mo5PB2.
3.6 Field-dependent measurements: Evidence of multigap superconductivity
To get further insight into the multigap SC revealed by zero-field electronic specific heat, we also carried out a series of measurements (including TF-SR, heat capacity, magnetization, and electrical resistivity) at different magnetic fields. The later three were also used to determine the upper critical field .
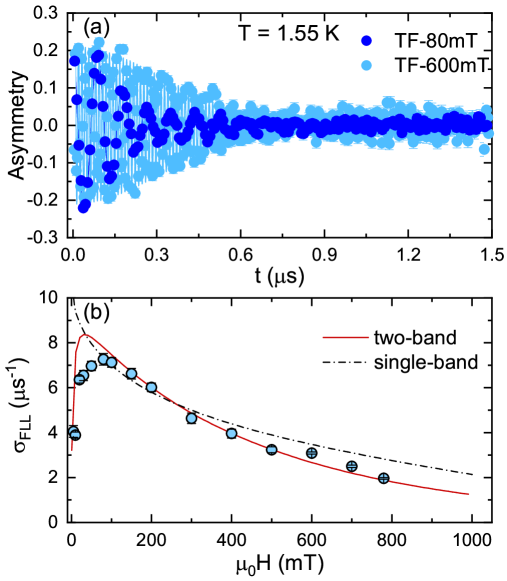
vs . TF-SR measurements at different magnetic fields (up to 780 mT) were performed in the superconducting state of Mo5PB2. As an example, the TF-SR spectra collected at 80 and 600 mT are shown in figure 8(a). Again the spectra were analyzed using the model described by Eq. 1. The resulting superconducting Gaussian relaxation rates versus the applied magnetic field are summarized in figure 8(b). In case of a single-gap superconductor, generally follows [35, 36], where /, with being the applied magnetic field. By fixing = 1.77 T (at 1.55 K) (see figure 10), the single-band model clearly deviates from the experimental data at magnetic fields above 300 mT [see dash-dotted line in figure 8(b)]. In a two-band model, each band is characterized by its own coherence length [i.e., (first) and (second)] and a weight [or ()], accounting for the relative contribution of each band to the total and, hence, to the superfluid density [42, 39]. By fixing , as estimated frome electronic specific-heat data (figure 7), the two-band model [solid red line in figure 8(b)] is in better agreement with the experiment and provides = 99(2) nm, = 18.5(5) nm, and = 13.2(2) nm. The upper critical field of 1.89(5) T, calculated from the coherence length of the second band, , is also comparable to the upper critical field determined from bulk measurements. The virtual upper critical field = 0.96(5) T, calculated from the coherence length of the first band , is in good agreement with the field value where both (figure 10) and (figure 11) show a flex or change the slope, respectively.
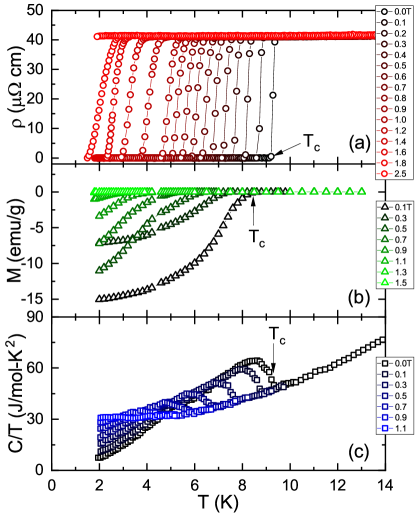
Upper critical field. The upper critical field of Mo5PB2 was determined from measurements of the electrical resistivity , magnetization , and specific heat under various applied magnetic fields up to 2.5 T, as shown in figure 9(a) to (c). Under applied field, the superconducting transition shifts towards lower temperatures and becomes broader. The values, determined using different techniques, are highly consistent and are summarized in figure 10 as a function of the reduced temperature /(0) [here, (0) is the transition temperature in zero field]. The was analyzed by means of Ginzburg-Landau (GL) [43], Werthamer-Helfand-Hohenberg (WHH) [44], and two-band (TB) models [45]. As shown in the inset of figure 10, the GL model reproduces the experimental data up to T, while the WHH model stops already at 0.5 T. At higher magnetic fields, both models show large deviations, leading to underestimated values of 1.7(1) T and 1.3(1) T. Such discrepancy most likely hints at multiple superconducting gaps in Mo5PB2, as evidenced also by the positive curvature of at low fields, a typical feature of multigap superconductors, as e.g., MgB2 [46, 47] or Lu2Fe3Si5 [48]. As shown in figure 10, around (0) 0.5 ( 0.93 T), undergoes a clear change in curvature, which coincides with T of the first superconducting band (see figure 8). The remarkable agreement of the TB model with the experimental data across the full temperature range is clearly seen in figure 10, from which we find 2.0(2) T and = 12.8(6) nm. Note that the and values of the spurious Mo3P phase [22] are both much smaller than those of Mo5PB2. Consequently, the two-gap feature of is intrinsic to Mo5PB2. The lower critical field is related to the magnetic penetration depth and the coherence length via ln, where = / is the GL parameter [36]. By using mT and T, the resulting magnetic penetration depth = 122(2) nm, is almost identical to the experimental value 121(2) nm determined from TF-SR data (see Sec. 3.5). A large GL parameter, , clearly indicates that Mo5PB2 is a type-II superconductor.
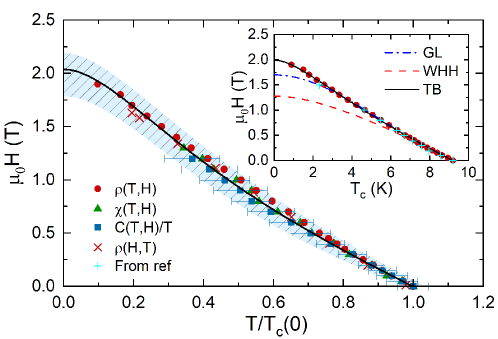
vs . The multigap SC of Mo5PB2 is further confirmed by the field-dependent electronic specific heat coefficient . Since the virtual corresponds to the critical field which suppresses the small superconducting gap, we expect also to change its slope around . The normalized values vs the reduced magnetic field are shown in figure 11 (here is the zero-field normal-state value). Note that, the field dependence of measured at 0.4 K exhibits similar features to that evaluated at zero temperature. For Mo5PB2, clearly deviates from the linear field dependence expected for fully-gapped superconductors with a single gap, as e.g., Re24Nb5 (dashed line) [54, 52], or from the square-root dependence (dash-dotted line), expected for nodal superconductors [55, 56]. Instead, Mo5PB2 exhibits similar features to other well known multigap superconductors, as e.g., FeSe [51], MgB2 [49], or NbSe2 [53]. The curve of Mo5PB2 (scatter plot) exhibits a significant change of slope around 0.45 (i.e., 0.9 T), which is highly consistent with .
3.7 Zero-field SR
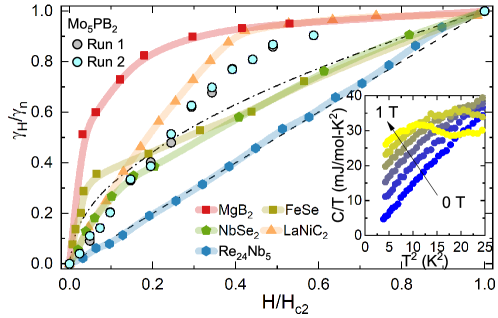
We also performed ZF-SR measurements in both the normal- and the superconducting states of Mo5PB2. As shown in figure 12, neither coherent oscillations nor fast decays could be identified in the spectra collected above (12 K) and below (2 K), hence implying the lack of any magnetic order or fluctuations. The weak muon-spin relaxation in absence of an external magnetic field is mainly due to the randomly oriented nuclear moments, which can be modeled by a Gaussian Kubo-Toyabe relaxation function, [57, 31]. Here, is the zero-field Gaussian relaxation rate. The solid lines in figure 12 represent fits to the data by considering also an additional zero-field Lorentzian relaxation , i.e., . The relaxations in the normal- and the superconducting states are almost identical, as confirmed by the practically overlapping ZF-SR spectra above and below . This lack of evidence for an additional SR relaxation below excludes a possible time-reversal symmetry breaking in the superconducting state of Mo5PB2.
3.8 Electronic band-structure calculations and discussion
Apart from the zero-field electronic specific heat (see figure 7 and Ref. [11]), at a microscopic level, the multigap superconductivity of Mo5PB2 was also probed by field-dependent SR relaxation in the superconducting state (figure 8). Macroscopically, further evidence was brought by the temperature-dependent upper critical field (figure 10) and the field-dependent electronic specific heat coefficient (figure 11). Our data clearly indicate that Mo5PB2 is a multiband superconductor with two distinct superconducting gaps, both opening below . Although extraneous phases, such as Mo3P, might potentially influence the reported results, we found that their influence is negligible (both qualitatively and quantitatively). Below we present that the multigap SC is also supported by electronic band-structure calculations.
As can be seen in figure 13, six different bands are identified to cross the Fermi level. Among these, bands 1 (red-), 2 (green-) and 3 (blue line), all stemming primarily from the Mo 4 orbitals, contribute significantly to the density of states at the Fermi level (see table 1). We expect the multiband features of Mo5PB2 to be closely related to the different site symmetries of Mo atoms in the unit cell, namely, Mo1 (4) and Mo2 (16). According to band-structure calculations, the contribution of 16-Mo atoms to the DOS is preponderant compared to that of 4-Mo atoms [see figure 13(b)].
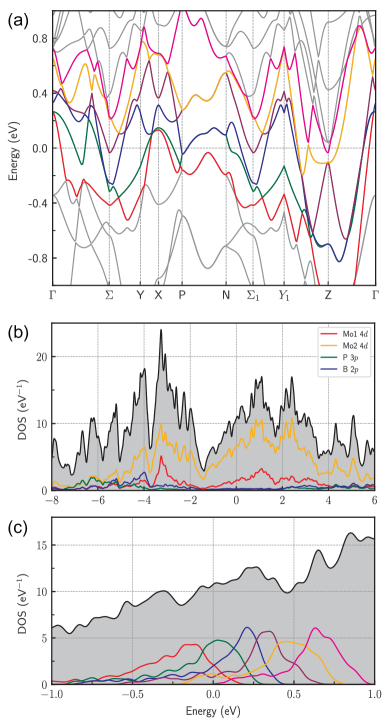
-
Index DOS(%) (-) (-) 1 19.72 5.82 6.39 – – 7.92 2 42.84 2.59 8.03 3.48 2.61 5.32 3 18.58 – – 5.29 4.43 5.32 4 7.35 – – 2.89 2.10 7.05 5 10.86 – – – – 2.88 6 0.48 – – – – 5.49
The Fermi velocities of these bands, calculated along the - and - directions, are summarized in table 1. Considering also the relative weights, the average is comparable to the experimental value (see table 2).
The deviation of (figure 8) from a single-band model and the appearance of an upward curvature in the upper critical-field data (figure 10), both reflect the occurrence of two distinct coherence lengths for two different bands, here leading to distinct upper critical fields. The Ginzburg-Landau coherence length determined from the upper critical field, , is proportional to the BCS coherence length , i.e., [37]. At zero temperature, the BCS coherence length is also related to the superconducting energy gap and the Fermi velocity , i.e., . Therefore, for a multigap superconductor such as Mo5PB2, . According to the zero-field electronic specific-heat results, , while the analysis of with a two-band model yields (1.5 K) = 18.5(5) nm and (1.5 K) = 13.2(2) nm. Assuming , we find = 0.95, which is highly consistent with the theoretical estimates reported in table 1. For instance, along the - direction, the dominant bands (1, 2, and 3) show very similar values.
-
Property Value (uncert.) Property Value (uncert.) a 9.20(2) K 2.0(2) T 41.1(2) cm 0.96(5) T 236(5) K 12.8(6) nm 30.4(4) mT 9.5(5) 30.8(6) mT 121(2) nm 22.3(2) mJ/mol-K2 b 99(2) nm 300(5) K 122(2) nm 530(5) K 54(4) nm (-wave)(SR) 1.87(2) meV 8.4(6) nm (-wave)(SR) 1.76(2) meV 34.2(6) nm (-wave)(SR) 1.42(1) meV 5.7(5) 0.25 5.9(7) 1028 m-3 (SR)c 1.11(2) meV 2.3(2) 105 ms-1 (SR)c 1.57(1) meV 2.1(2) 104 K c 1.02(2) meV c 1.49(2) meV -
a Similar values were determined via electrical resistivity, magnetic susceptibility, and heat-capacity measurements.
-
b Derived from a two-band-model fit to at 1.5 K.
-
c Derived from a two-gap model analysis.
4 Conclusion
In summary, we studied the multigap superconductor Mo5PB2 by means of electrical resistivity, magnetization, heat capacity, and SR, as well as via numerical calculations. The temperature dependence of the zero-field electronic specific heat and superfluid density reveal a nodeless superconductivity, well described by an isotropic -wave model. The multigap features, originally inferred from zero-field specific-heat data are further supported by the field-dependent electronic specific-heat coefficient and the superconducting Gaussian relaxation rate, as well as by the temperature dependence of the upper critical field. The lack of spontaneous magnetic fields below indicates that time-reversal symmetry is preserved in the superconducting state of Mo5PB2. By combining the extensive experimental results presented here with numerical band-structure calculations, we can provide solid evidence for multigap superconductivity in Mo5PB2.
References
References
- [1] Bormio-Nunes C, Nunes C A, Coelho A A, Faria M I S T, Suzuki P A and Coelho G C 2010 J. Alloys Compd. 508 5
- [2] de Almeida D M, Bormio-Nunes C, Nunes C A, Coelho A A and Coelho G C 2009 J. Magn. Magn. Mater. 321 2578
- [3] Xie Z G, Geng D Y and Zhang Z D 2010 Appl. Phys. Lett. 97 202504
- [4] McGuire M A and Parker D S 2015 J. Appl. Phys. 118 163903
- [5] Lamichhane T N, Taufour V, Thimmaiah S, Parker D S, Bud’ko S L and Canfield P C 2016 J. Magn. Magn. Mater. 401 525
- [6] Brauner A, Nunes C A, Bortolozo A D, Rodrigues G and Machado A J S 2009 Solid State Commun. 149 467
- [7] Machado A J S, Costa A M S, Nunes C A, dos Santos C A M, Grant T and Fisk Z 2011 Solid State Commun. 151 1455
- [8] Fukuma M, Kawashima K, Maruyama M and Akimitsu J 2011 J. Phys. Soc. Jpn. 80 024702
- [9] Fukuma M, Kawashima K and Akimitsu J 2012 Phys. Procedia 27 48
- [10] Corrêa L E, da Luz M S, de Lima B S, Cigarroa O V, da Silva A A A P, Coelho G C, Fisk Z and Machado A J S 2016 J. Alloys Compd. 660 44
- [11] McGuire M A and Parker D S 2016 Phys. Rev. B 93(6) 064507
- [12] Amato A, Luetkens H, Sedlak K, Stoykov A, Scheuermann R, Elender M, Raselli A and Graf D 2017 Rev. Sci. Instrum. 88 093301
- [13] Suter A and Wojek B M 2012 Phys. Procedia 30 69
- [14] Perdew J P, Burke K and Ernzerhof M 1996 Phys. Rev. Lett. 77(18) 3865
- [15] Kresse G and Furthmüller J 1996 Phys. Rev. B 54(16) 11169
- [16] Kresse G and Furthmüller J 1996 Comput. Mater. Sci. 6 15
- [17] Kresse G and Joubert D 1999 Phys. Rev. B 59(3) 1758
- [18] Blöchl P E 1994 Phys. Rev. B 50(24) 17953
- [19] Rodríguez-Carvajal J 1993 Physica B: Condens. Matter 192 55
- [20] Ziegler W T and Young R A 1953 Phys. Rev. 90(1) 115
- [21] Matthias B T and Hulm J K 1952 Phys. Rev. 87(5) 799
- [22] Shang T, Philippe J, Verezhak J A T, Guguchia Z, Zhao J Z, Chang L J, Lee M K, Gawryluk D J, Pomjakushina E, Shi M, Medarde M, Ott H R and Shiroka T 2019 Phys. Rev. B 99(18) 184513
- [23] Bloch F 1930 Z. Phys. 59 208
- [24] Blatt F J 1968 Physics of Electronic Conduction in Solids (New York: McGraw-Hill) p. 185–190
- [25] Mott N F and Jones H 1958 The Theory of the Properties of Metals and Alloys (London: Oxford University Press)
- [26] Mott N F 1964 Adv. Phys. 13 325 p. 403
- [27] Tari A 2003 The Specific Heat of Matter at Low Temperatures (London: Imperial College Press)
- [28] Rajpoot P, Rastogi A and Verma U P 2018 Philos. Mag. 98 422
- [29] Aharoni A 1998 J. Appl. Phys. 83 3432
- [30] Osborn J A 1945 Phys. Rev. 67(11-12) 351
- [31] Yaouanc A and de Réotier P D 2011 Muon Spin Rotation, Relaxation, and Resonance: Applications to Condensed Matter (Oxford: Oxford University Press)
- [32] Amato A 1997 Rev. Mod. Phys. 69(4) 1119
- [33] Blundell S J 1999 Contemp. Phys. 40 175
- [34] Maisuradze A, Khasanov R, Shengelaya A and Keller H 2009 J. Phys.: Condens. Matter 21 075701 and references therein
- [35] Barford W and Gunn J M F 1988 Physica C 156 515
- [36] Brandt E H 2003 Phys. Rev. B 68 054506
- [37] Tinkham M 1996 Introduction to Superconductivity 2nd ed (Mineola, NY: Dover Publications) ISBN 978-0-486-43503-9
- [38] Carrington A and Manzano F 2003 Physica C 385 205
- [39] Khasanov R, Amato A, Biswas P K, Luetkens H, Zhigadlo N D and Batlogg B 2014 Phys. Rev. B 90(14) 140507(R)
- [40] Khasanov R, Gupta R, Das D, Leithe-Jasper A and Svanidze E 2020 arXiv preprint arXiv:2004.12202
- [41] Bouquet F, Wang Y, Fisher R A, Hinks D G, Jorgensen J D, Junod A and Phillips N E 2001 Europhys. Lett. 56 856
- [42] Serventi S, Allodi G, De Renzi R, Guidi G, Romanò L, Manfrinetti P, Palenzona A, Niedermayer C, Amato A and Baines C 2004 Phys. Rev. Lett. 93(21) 217003
- [43] Zhu X, Yang H, Fang L, Mu G and Wen H H 2008 Supercond. Sci. Technol. 21 105001
- [44] Werthamer N R, Helfand E and Hohenberg P C 1966 Phys. Rev. 147 295
- [45] Gurevich A 2011 Rep. Prog. Phys 74 124501 and references therein
- [46] Müller K H, Fuchs G, Handstein A, Nenkov K, Narozhnyi V N and Eckert D 2001 J. Alloys Compd. 322 L10
- [47] Gurevich A, Patnaik S, Braccini V, Kim K H, Mielke C, Song X, Cooley L D, Bu S D, Kim D M, Choi J H, Belenky L J, Giencke J, Lee M K, Tian W, Pan X Q, Siri A, Hellstrom E E, Eom C B and Larbalestier D C 2004 Supercond. Sci. Technol. 17 278
- [48] Nakajima Y, Hidaka H, Nakagawa T, Tamegai T, Nishizaki T, Sasaki T and Kobayashi N 2012 Phys. Rev. B 85(17) 174524
- [49] Bouquet F, Fisher R A, Phillips N E, Hinks D G and Jorgensen J D 2001 Phys. Rev. Lett. 87(4) 047001
- [50] Chen J, Jiao L, Zhang J L, Chen Y, Yang L, Nicklas M, Steglich F and Yuan H Q 2013 New J. Phys. 15 053005
- [51] Chen J T, Sun Y, Yamada T, Pyon S and Tamegai T 2017 J. Phys. Conf. Ser. 871 012016
- [52] Shang T, Smidman M, Ghosh S K, Baines C, Chang L J, Gawryluk D J, Barker J A T, Singh R P, Paul D M, Balakrishnan G, Pomjakushina E, Shi M, Medarde M, Hillier A D, Yuan H Q, Quintanilla J, Mesot J and Shiroka T 2018 Phys. Rev. Lett. 121 257002
- [53] Huang C L, Lin J Y, Chang Y T, Sun C P, Shen H Y, Chou C C, Berger H, Lee T K and Yang H D 2007 Phys. Rev. B 76(21) 212504
- [54] Caroli C, De Gennes P G and Matricon J 1964 Phys. Lett. 9 307
- [55] Volovik G E 1993 JETP Lett. 58(6) 469–473
- [56] Wen H H, Liu Z Y, Zhou F, Xiong J, Ti W, Xiang T, Komiya S, Sun X and Ando Y 2004 Phys. Rev. B 70(21) 214505
- [57] Kubo R and Toyabe T 1967 A stochastic model for low field resonance and relaxation Magnetic Resonance and Relaxation ed Blinc R (Amsterdam: North-Holland) p 810