Higher Martian atmospheric temperatures at all altitudes increase the D/H fractionation factor and water loss
Abstract
Much of the water that once flowed on the surface of Mars was lost to space long ago, and the total amount lost remains unknown. Clues to the amount lost can be found by studying hydrogen (H) and its isotope deuterium (D), which are produced when atmospheric water molecules H2O and HDO dissociate. The difference in escape efficiencies of H and D (which leads to an enhanced D/H ratio) is referred to as the fractionation factor . Both the D/H ratio and are necessary to estimate water loss; thus, if we can constrain the range of and understand what controls it, we will be able to estimate water loss more accurately. In this study, we use a 1D photochemical model of the neutral Martian atmosphere to determine how depends on assumed temperature and water vapor profiles. We find that the exobase temperature most strongly controls the value of for thermal escape processes. When we include estimates of non-thermal escape from other studies, we find that the tropopause temperature is also important. Overall, for the standard Martian atmosphere, for thermal escape, and for thermal + non-thermal escape. We estimate that Mars has lost at minimum 66-122 m GEL of water. Importantly, our results demonstrate that the value of depends critically on non-thermal escape of D, and that modeling studies that include D/H fractionation must model both neutral and ion processes throughout the atmosphere.
JGR: Planets
Laboratory for Atmospheric and Space Physics University of Colorado Boulder
3665 Discovery Dr, Boulder, CO 80303 Boulder, CO
Eryn Cangieryn.cangi@colorado.edu
The fractionation factor is most strongly controlled by non-thermal escape of atomic deuterium (D).
Larger correlates minimally with higher atmospheric temperature at the surface, but strongly with exobase and tropopause temperatures.
Using our results for , we calculate total water lost from Mars to be between 66-122 m GEL, which is likely a lower bound.
————————————————————————
Plain Language Summary
Mars used to have lots of water, but has lost it over time. When water molecules break apart in the atmosphere, they release hydrogen (H) and its heavier twin deuterium (D), which escape to space at different rates, removing water from Mars. The escape efficiency of D compared to H is called the fractionation factor . The goal of this study is two-fold: to understand how varies with different atmospheric conditions and the processes that control it, and to use that information to estimate water loss from Mars. To do this, we model the Martian atmosphere to test how different atmospheric temperatures and water vapor content affect . We find that the most important thing affecting is loss of D via processes involving interaction with planetary ions or the solar wind, rather than loss of D that is hot enough to exceed escape velocity. This implies future studies must include ion chemistry to accurately calculate . We also find that generally, temperatures above 100 km strongly affect the value of . Using these results, we calculate that Mars has lost enough water to cover the whole planet in a layer between 66-122 m deep.
1 The D/H Fractionation Factor and Loss of Martian Water to Space
The surface of Mars is marked with ample evidence of its wetter past. Today, water on Mars exists only in the polar caps, subsurface ice, and atmosphere, but geomorphological and geochemical evidence points to significant alteration of the surface by liquid water. The presence of compounds like jarosite and hematite indicate past pooling and evaporation [Squyres \BOthers. (\APACyear2004), Klingelhöfer \BOthers. (\APACyear2004)], while substantial evidence of hydrated silicates supports the theory that ancient river deltas, lake beds, catastrophic flood channels, and dendritic valley networks were formed by water [M\BPBIH. Carr \BBA Head (\APACyear2010), Ehlmann \BBA Edwards (\APACyear2014), and references therein]. Because the contemporary Martian climate cannot support liquid water on the surface, Mars must have once had a thicker and warmer atmosphere. The Mars science community generally agrees that the atmosphere has escaped over time, with a significant amount in the form of thermal escape of H, in which a fraction of H atoms are hot enough that their velocity exceeds the escape velocity. Because H is primarily found in water on Mars, this has effectively desiccated the planet [Jakosky \BOthers. (\APACyear2018)].
A significant indicator of this loss of water to space is the elevated D (deuterium, 2H or D) to H (hydrogen, 1H) ratio, which we will abbreviate as . Because water (either as H2O or HDO) is the primary reservoir of both H and D, when we talk about the D/H ratio, we are thus usually referring to D/H measured in water:
| (1) |
Here, represents a molecule’s abundance; H sourced from HDO is negligible compared to H sourced from H2O. This ratio evolves according to differential escape of D and H; D, being twice as massive as H, is less likely to escape. This difference can be characterized as a relative efficiency, the fractionation factor :
| (2) |
where represents fluxes to space, and the subscript specifies the near-surface atmospheric reservoir, which approximates the total amount in the atmosphere. As it represents efficiency of D escape, takes on values between 0 and 1. When is 0, D is completely retained on the planet, and cumulative water loss must have been lower than for . When , the ratio of escaping to retained atoms is the same for both D and H, and there is no mass effect on the escape rates. In this scenario, no amount of escape is sufficient to change the D/H ratio in any species. In practice, is somewhere in between these extremes.
Over geologic time, this fractionation manifests as an enhancement of the D/H ratio compared to the Earth ratio of [Yung \BOthers. (\APACyear1988)], called SMOW (for the measured source, Standard Mean Ocean Water). A planet’s D/H ratio is often quoted as a multiple of the Earth value. At present, multiple measurements put the global mean on Mars between 4 and 6 SMOW [Owen \BOthers. (\APACyear1988), Bjoraker \BOthers. (\APACyear1989), V. Krasnopolsky \BOthers. (\APACyear1997), Encrenaz \BOthers. (\APACyear2018), Vandaele \BOthers. (\APACyear2019)], with some variations occurring on local spatial and temporal scales [Villanueva \BOthers. (\APACyear2015), Clarke \BOthers. (\APACyear2017), Encrenaz \BOthers. (\APACyear2018), Clarke \BOthers. (\APACyear2019), Villanueva \BOthers. (\APACyear2019)]. This is most commonly interpreted as evidence for significant escape to space of H.
To estimate the integrated amount of water lost, one can use current estimates of the Martian water inventory, , and with the Rayleigh distillation equation for H [Yung \BBA DeMore (\APACyear1998)]:
| (3) |
where can be arbitrarily chosen. Because we use and because water is the primary reservoir of H on Mars, [H] is commonly replaced with total water ( = [H2O] + [HDO]). Then , the total water on Mars at some point in the past , is the sum of the water budget at time and the total water lost: + . Substituting for [H] and rearranging equation 3, we obtain an expression for water lost from Mars:
| (4) |
Most of the inputs to Equation 4 are well-described. The current D/H ratio of exchangeable water (the atmosphere, seasonal polar caps, ground ice, and water adsorbed in the regolith), , is SMOW as mentioned (we use 5.5 in this study). is usually taken to be that at Mars’ formation, when it would have been similar to the Earth’s D/H ratio [Geiss \BBA Reeves (\APACyear1981)]; at other points in time can be obtained from meteorite samples [Usui \BOthers. (\APACyear2012), e.g.] or in-situ analysis [Mahaffy \BOthers. (\APACyear2015), e.g.]. The current water inventory in exchangeable reservoirs, , is estimated to be between 20-30 m GEL (global equivalent layer), the depth of water if the entire exchangeable inventory were rained onto the surface [Zuber \BOthers. (\APACyear1998), Plaut \BOthers. (\APACyear2007), Lasue \BOthers. (\APACyear2013), Villanueva \BOthers. (\APACyear2015), M. Carr \BBA Head (\APACyear2019)].
Prior studies estimated the fractionation factor , but its range of values under all plausible scenarios has been largely unexplored. \citeAYung1988 used a 1D photochemical model to calculate a first value of which has been frequently referenced in the years since. They explored the effects of certain chemical reactions on , but did not test other parameters. \citeAKras1998 obtained by combining Hubble Space Telescope observations with a radiative transfer and 1D photochemical model. Later, \citeAKras2000 followed up with another study that tested the effects of two different models of eddy diffusion, finding values of and . Two years later, \citeAKras2002 found 3 values for , depending on whether the solar cycle was at minimum (), maximum (), or mean (), represented in the model by variation of the exobase temperature and non-thermal escape flux. Our goal is to advance this body of work by performing the first systematic parameter-space study of the fractionation factor with respect to the assumed atmospheric temperature and water vapor profiles.
2 Building Our 1D Photochemical Model
To best capture the mean behavior of the Martian atmosphere over long time scales, we use a 1D photochemical model, extended from the original developed by \citeAChaffin2017 to include D chemistry. The model uses standard photochemical techniques described in other studies [V. Krasnopolsky (\APACyear1993), Nair \BOthers. (\APACyear1994), Chaffin \BOthers. (\APACyear2017)], with the addition of the D-bearing species D, HD, HDO, OD, HDO2, DO2, and DOCO. The chemical reactions for D-bearing species came from several sources, including past papers [Yung \BOthers. (\APACyear1988), Yung \BOthers. (\APACyear1989), Cazaux \BOthers. (\APACyear2010), Deighan (\APACyear2012)], NASA publications [Sander \BOthers. (\APACyear2011)], and online databases [Manion \BOthers. (\APACyear2015), Wakelam \BBA Gratier (\APACyear2019), McElroy \BOthers. (\APACyear2013)]. The full list of chemical reactions and reaction rates, as well as details on implemented photochemical cross sections [Barfield \BOthers. (\APACyear1972), Nee \BBA Lee (\APACyear1984), Cheng \BOthers. (\APACyear1999), Cheng \BOthers. (\APACyear2004)] and diffusion coefficients [Banks \BBA Kockarts (\APACyear1973)], is given in the Supporting Information. Photodissociation is driven by solar UV irradiation data from SORCE/SOLSTICE and TIMED/SEE [Woods \BOthers. (\APACyear2019)], appropriate for solar mean conditions and scaled to Mars’ orbit. For our primary input, we construct temperature and water vapor profiles designed to represent end-member states of the atmosphere, such that we fully constrain the range of plausible fractionation factor values.
A run of the model consists of the following steps: (1) loading the temperature and water vapor profiles, (2) establishing an initial condition of species number densities, (3) establishing boundary conditions (Table S3), and (4) stepping forward over 10 million years of simulation time until the atmosphere reaches chemical equilibrium, which is achieved when the combined escape flux of atomic H and D () is twice that of the escape flux of atomic O (). (This stoichiometric balance is required because H and D are primarily sourced from water.) The model output comprises species number densities by altitude. By multiplying the H- and D-bearing atomic and molecular species densities by their thermal effusion velocities [Hunten (\APACyear1973)], we can calculate and :
| (5) | |||
| (6) |
These fluxes are then used to calculate according to equation 2.
A limitation of our model is that we do not include a full ionosphere. Instead, we approximate it by including a static profile of CO [Matta \BOthers. (\APACyear2013)], enabling the primary H-producing ion reaction in the Martian atmosphere; a similar tactic was used by \citeAYung1988. Without a full ionosphere, we are not able to model non-thermal escape of H or D, as most non-thermal processes depend on ions. In an effort to estimate the relative importance of non-thermal processes to the fractionation factor, we estimate non-thermal effusion velocities for our model conditions, scaled from \citeAKras2002, described further in Section 3.
2.1 Reproductions of Past Studies
Before proceeding with our study, we attempted to reproduce the results by \citeAYung1988 and \citeAKras2002. Their original results and our reproductions are shown in Figure S3. We achieved very good agreement with the results by \citeAYung1988, finding versus their . The small difference is due to the only two differences between the model by \citeAYung1988 and ours. First, \citeAYung1988 manually fix their photodissociation rates, whereas our model calculates them. Second, they adopt the water profile used by \citeALiu1976, fixing it below 80 km and allowing it to vary above, whereas we fix it throughout the atmosphere. Our results for were consistent with \citeAKras2002 for solar maximum, but comparatively low for solar mean and minimum. We expect that this is because their model includes an ionosphere, allowing them to model non-thermal escape. To account for this, we added their results for non-thermal escape of D to our results for thermal escape, resulting in a slight overestimate instead of an underestimate. This change was a first hint at the importance of non-thermal escape to . The remaining discrepancy is due to other significant model differences, irreconcilable without rewriting our model; for example, their model atmosphere has its lower bound at 80 km, while ours is at the surface. This difference in model extent means that our two models also have significant differences in temperature structure and boundary conditions.
2.2 Model input: Temperature and Water Vapor Profiles
Our temperature and water vapor vertical profiles remain fixed for the duration of a simulation. This allows us to examine the mean behavior of the atmosphere over long time scales.
2.2.1 Temperature Profiles
The piecewise temperature profile is modeled with equation 7. The general form is based on measurements by the Viking orbiters [Seiff (\APACyear1982)], and similar models have been used in other studies (e.g. \citeNPMcElroy1977, Nair1994, Kras2010). In the lower atmosphere, the temperature decreases with altitude according to the dry adiabatic lapse rate . At the tropopause (altitude ), temperature reaches a minimum and remains isothermal in the mesosphere. Above the mesopause (120 km), upper atmospheric density is low enough that UV heating is efficient, causing the temperature to increase rapidly with altitude.
| (7) |
We constrain this modeled profile with the temperatures at the surface (), tropopause (), and exobase (). Constraining the temperature at these three points requires either or to vary; if they are both fixed, the profile will be over-constrained and discontinuous. We allow to vary as it does in reality (e.g., \citeNPForget2009); exactly what sets its altitude is less well defined than the dynamics of gas and dust, on which depends. We use K/km, which is slightly lower than the standard dry adiabatic lapse rate due to warming effects from suspended dust [Zahnle \BOthers. (\APACyear2008)].
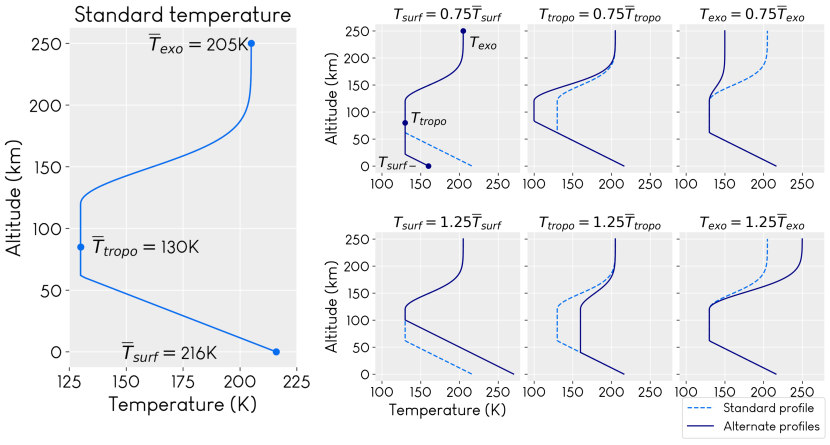
For the first part of the study, we constructed a standard temperature profile representing current conditions on Mars, as well as 6 alternate profiles intended to represent plausible climate extrema driven by changing planetary obliquity throughout the last 10 million years of Mars’ history, the maximum time over which obliquity evolution can be analytically predicted. (On longer time scales, the obliquity evolves chaotically, making precise definition of climate parameters impossible [Laskar \BOthers. (\APACyear2004)].) We used the Mars Climate Database (MCD) [Millour \BBA Forget (\APACyear2018)] to obtain values for (), ( km), and ( km) for different times of sol (local times 03:00, 09:00, 15:00, 21:00), Mars latitude (90N, 45N, 0, 45S, 90S), and Ls (90 and 270), then compared the mean temperatures across each of these parameters with data from multiple missions to ensure consistency. The surface temperature was compared with the Curiosity Rover [Vasavada \BOthers. (\APACyear2016), Audouard \BOthers. (\APACyear2016), Savijärvi \BOthers. (\APACyear2019)], Mars Global Surveyor Thermal Emission Spectrometer (TES) [Smith (\APACyear2004)], and the Spirit/Opportunity Rovers’ Mini-TES [Smith \BOthers. (\APACyear2006)]; the exobase temperature was compared with MAVEN data from multiple instruments [Bougher \BOthers. (\APACyear2017), Stone \BOthers. (\APACyear2018), Thiemann \BOthers. (\APACyear2018)]. The mean temperatures formed the standard profile, shown in Figure 1a. Figure 1b shows the 6 alternate profiles, in which we varied one of , , or by 25% of the standard value. This variation covers most values observed by current missions, as well as temperatures calculated [Wordsworth \BOthers. (\APACyear2015)] for obliquities of 25-45°predicted for the last 10 million years [Laskar \BOthers. (\APACyear2004)]. A table with the control temperatures for each profile is available in the Supporting Information. Together, the standard and alternate temperature profiles represent end-member cases for the Martian atmosphere.
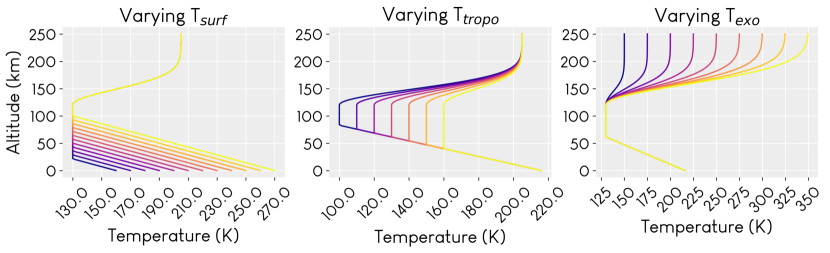
In addition to these select profiles, we also created a larger set of temperature profiles with finer variation in each of , , or to examine the details of how each parameter affects . This set of temperature profiles is shown in Figure 2.
2.2.2 Water Profiles
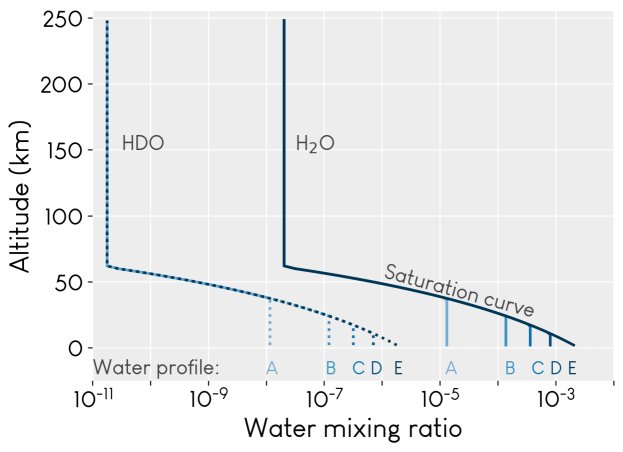
H2O and HDO profiles used in the model are shown in Figure 3. We require that the profiles have total water content (H2O + HDO) equal to 1, 10, 25, 50, or 100 pr m (precipitable micrometers), with H2O making up most of the share. Higher concentrations of water vapor would require a supersaturated atmosphere; while there is observational evidence of supersaturation at upper altitudes in specific cases [Maltagliati (\APACyear2011), Fedorova \BOthers. (\APACyear2020)], our model does not include it. We use the 10 pr m profile to represent the long-term standard atmosphere, a value in agreement with observations [Lammer \BOthers. (\APACyear2003), Smith (\APACyear2004)], although more recent observations [Heavens \BOthers. (\APACyear2018), Vandaele \BOthers. (\APACyear2019)] and modeling [Shaposhnikov \BOthers. (\APACyear2019)] suggest that local water vapor concentrations can reach higher values, up to 150 pr m, on very short timescales, particularly during dust storms. We assume that the lower atmosphere is well-mixed, such that the water vapor mixing ratio is constant. At the hygropause, usually between 25 and 50 km [V. Krasnopolsky (\APACyear2000), Heavens \BOthers. (\APACyear2018)], water begins to condense, and its mixing ratio follows the saturation vapor pressure curve until it becomes negligible in the upper atmosphere [Heavens \BOthers. (\APACyear2018)]. Although HDO preferentially condenses compared to H2O [Montmessin \BOthers. (\APACyear2005)], it never approaches saturation in our model atmosphere, allowing us to use the same empirical saturation vapor pressure equation [Marti \BBA Mauersberger (\APACyear1993)] for both H2O and HDO. This is helpful, as no empirical equation for HDO exists, and the enthalpies of HDO under Mars-like conditions are very sparsely studied.
Although observations [Villanueva \BOthers. (\APACyear2015)] and modeling [Fouchet \BBA Lellouch (\APACyear1999), Bertaux \BBA Montmessin (\APACyear2001)] have shown that atmospheric D/H varies between 1-10 SMOW depending on the species it is measured in, altitude, and latitude/longitude, we tested these variations and determined that they had no effect on our results. We therefore multiply the initial profiles of H-bearing species by the D/H ratio of 5.5 SMOW to create the D-bearing profiles. The number densities of H2O and HDO remain fixed during the simulation to represent the standard water abundance, though they are used to calculate chemical reaction rates.
3 Results: Temperature Variations and Non-thermal Escape Critical to Understanding the Fractionation Factor
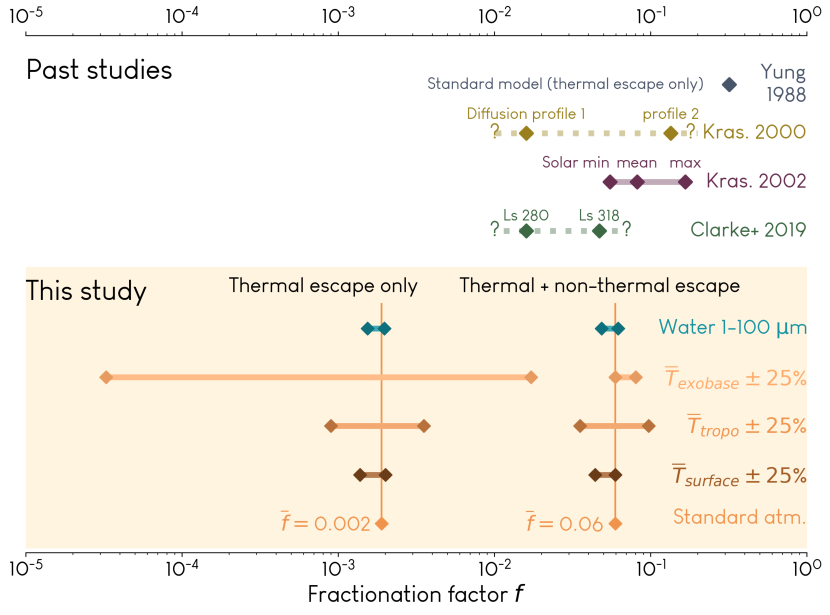
Figure 4 shows the range of the fractionation factor as a function of each temperature and water vapor parameter, using the temperature profiles in Figure 1 and the water vapor profiles in Figure 3. Results for the broad range of temperatures shown in Figure 2 are discussed in Section 3.1.
For thermal escape only, we find that is 1-3 orders of magnitude lower than the original value by \citeAYung1988. The primary reason for this difference is the exobase temperature (they use 364 K, while we use a maximum of 250 K, which is more consistent with modern measurements). Other minor differences are as described in Section 2.1 Details of the dependence of on each parameter are discussed in sections 3.1 and 3.2.
Because our model does not include an ionosphere, we do not model the effects of non-thermal escape processes (e.g. sputtering, photochemical escape), and only model thermal escape. This makes it difficult to compare with other studies which do include non-thermal escape (e.g. \citeNPKras2002). In order to compare with that study, we must estimate , the non-thermal escape velocity, which is not part of our model. To do so, we calculated the ratio of thermal to non-thermal effusion velocities () for H, H2, D, and HD in the model used by \citeAKras2002. We then divided our by the ratio to get an estimate of non-thermal effusion velocities at the temperatures modeled by \citeAKras2002: 200 K, 270 K, and 350 K. We extrapolated this estimate down to 150 K, the lowest temperature in our model, by fitting a 2nd order polynomial to the estimates for , allowing us to estimate the role that non-thermal escape plays in setting for the temperature profiles shown in Figure 1. Though the estimation method is imperfect, it provides a rough estimation while avoiding unphysical velocity values at low temperatures, and gives values of are consistent with \citeAKras2000 and \citeAKras2002, as well as more recent observations using MAVEN/IUVS [Clarke \BOthers. (\APACyear2019)]. Notably, our highest value of is approximately a factor of 3 larger than the lowest, in agreement with \citeAKras2002. In future work beyond the scope of this paper, we plan to directly model non-thermal contributions, enabling a better model comparison.
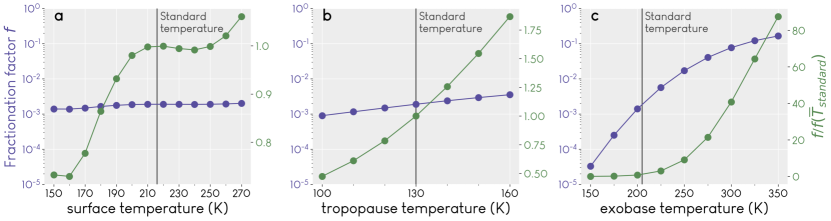
3.1 Fractionation Factor for Thermal Escape Strongly Controlled by Exobase Temperature
Figure 5 shows in detail how varies with each temperature parameter for the modeled thermal escape only. This approach allows us to focus on what we can learn about from our model, and refrain from drawing any strong conclusions about specific effects introduced by non-thermal escape before we can fully model it. The results show that an increase in temperature in any part of the atmosphere leads to an increase of (less fractionation). The effect is small when the temperature increase occurs in the lower atmosphere, and dramatic when the change occurs at the exobase. Understanding this behavior requires examining the temperature-dependent behavior of H, D, H2, and HD abundances and the escape fluxes and . This information is shown in Figure 6, where we plot these values for each simulation, normalized to the simulation with the standard atmosphere.
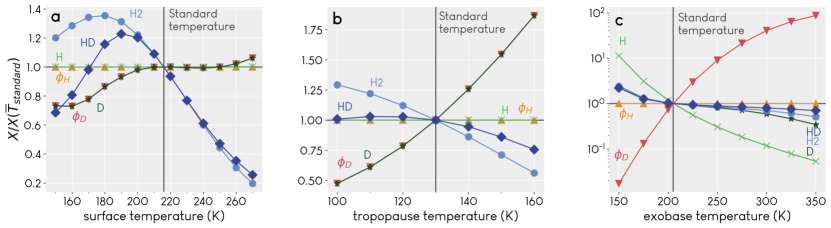
As a function of both surface and tropopause temperature, most closely tracks the abundance of atomic D at the exobase. Per equation 2, depends directly on , inversely on , and inversely on . is constant, and any reduction of is offset by an increase in because stoichiometric balance requires that . This change is many orders of magnitude smaller than and thus not visible in Figure 6, but comparable to , making it easily visible. The increase of with is thus primarily because the higher temperatures in the mesosphere and thermosphere enable greater transport of D upwards. This response is possible because D is not diffusion-limited. Moderate increases in are a by-product of this effect (see Figure S6), as the escaping population is proportional to the upper-atmospheric abundance of D. Transport into the mesosphere may also be slightly enhanced by increased , but the main role of is to drive the chemical reaction rates in the dense lower atmosphere, where they dominate over transport in controlling species abundances.
In contrast, the exobase temperature has a far greater effect on the value of , with values ranging from to . This is unsurprising, as directly depends on . Because thermal populations are assumed to be Maxwellian, we take the velocity in equations 5 and 6 to be the effusion velocity, which depends directly on . As rises, the warmer thermosphere to enable enhanced vertical transport of D. Escape of D is enhanced enough that no longer closely tracks the abundance of atomic D. To compensate for the increased loss of D while maintaining stoichiometric balance, must decrease by a negligible amount (see Figure S7).
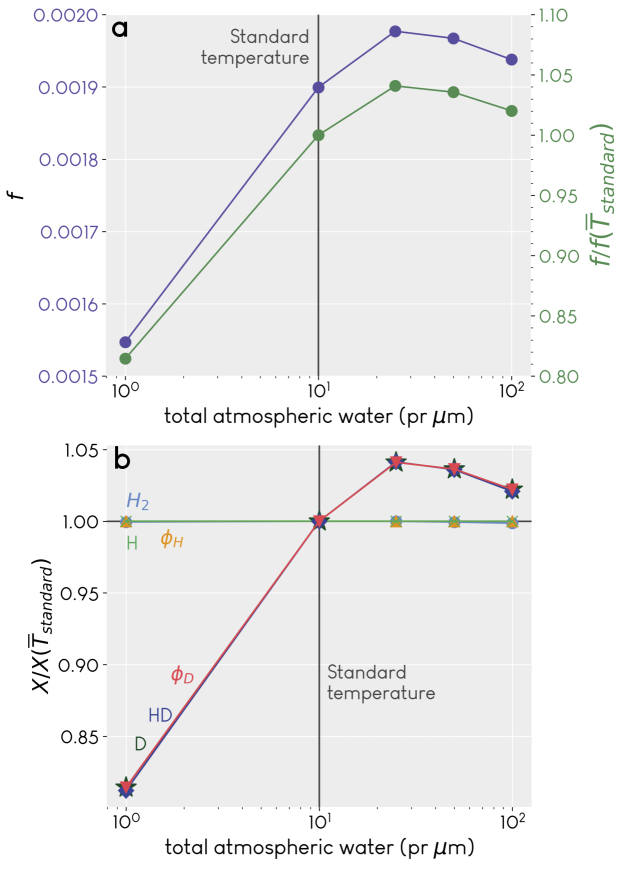
3.2 Fractionation Factor Depends Weakly on Water Vapor Column Abundance
The fractionation factor as a function of total water vapor is shown in Figure 7a, and the comparison of abundances and fluxes of H- and D-bearing species in Figure 7b. As in the previous section, the increase of with additional water vapor is correlated with an increased abundance of D at the exobase, but also HD. The total water vapor has little effect on , likely because the absolute abundance of water changes neither the D/H ratio in water or the processes by which it is fractionated. The small variation with respect to water vapor thus reflects the influence of minor differences in H2O and HDO chemical and photochemical reactions. In order to more fully characterize the effects of water vapor on , the model will have to be modified to allow variable water vapor profiles.
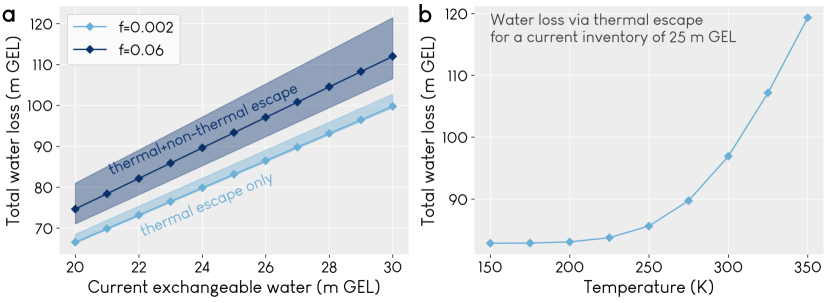
3.3 Mapping Fractionation Factor Results to Integrated Water Loss
We can determine the magnitude of water loss on Mars by using our results for as input to Equation 4. These results are shown in Figure 8. In order to use Equation 4 to plot past water loss, we must set values for the current water inventory , the current D/H ratio , and the ancient Martian D/H ratio, .
For , we use the aforementioned range 20-30 m GEL for the current exchangeable water budget of Mars . Exchangeable water is water that is able to move between surface deposits and the atmosphere; its D/H ratio increases due to escape to space. Non-exchangeable water, being unaffected by escape to space, would have its original D/H value.
For , we follow \citeAKurokawa2014 and \citeAVillanueva2015 and use 1.275 SMOW, in agreement with the measurement of D/H in the 4.5 billion year old melt inclusions in the Martian meteorite Yamato 980459 [Usui \BOthers. (\APACyear2012)]. Finally, we use 5.5 SMOW for .
Using these values, we calculate the cumulative water lost to be between about 66 and 122 m GEL, depending on escape type and value of . We compare these results with other estimates in the literature in the next section.
4 Discussion
Because depends directly on the escape fluxes and , it is reasonable that the exobase temperature would most strongly affect for thermal escape. Disturbances in the lower atmosphere that may otherwise affect will be reduced in amplitude by the time they propagate to the upper atmosphere. A larger at higher exobase temperatures also makes sense in the context of past work; the Mariner missions measured the exobase temperature to be 350 100 K [Anderson \BBA Hord (\APACyear1971)], and \citeAYung1988 used K to obtain for thermal escape only. However, these original Mariner measurements were highly uncertain; more recent data (discussed previously) indicate that during solar mean and minimum is cold enough that for thermal escape is substantially smaller, and that non-thermal escape of D is critical to an accurate calculation of .
The importance of is also worth some discussion. In Figure 4, appears to be the parameter with the greatest control over for thermal + non-thermal escape together. It should be noted, however, that our estimates of non-thermal escape are approximate and extrapolated below 200 K, as described in Section 3. For the simulations that varied or , each estimation of non-thermal escape was made assuming a constant value of (205 K). On the other hand, different values of were necessarily used in the simulations which tested the effects of varying it. This means that and as a function of appear to differ by a constant, whereas as a function of may be artificially large at temperatures below 200 K (see Figure S5). Despite these uncertainties, is still important to the value of , as increased also increases the temperature of the thermosphere, enabling greater upward transport and contributing to overall escape (see Figure S6).
The relationship of from thermal escape to the abundances of atomic D and HD is not immediately obvious. In Figure 6a and b, most closely tracks the abundance of atomic D at the exobase because it is much more abundant than HD. In all of the simulations represented in these panels, the exobase temperature is 205 K, a value too low for escape of HD to contribute significantly to D loss. Only at high exobase temperatures (Figure 6c) or high concentrations of water (Figure 7b) does appear to track the HD abundance, indicating HD is abundant enough to contribute more to D loss. In general, in Figures 6 and 7b, an increase in is correlated with an increase in the abundance of D, except when increases and escape is dramatically enhanced. More abundant deuterium means more deuterium available to escape; in most cases, loss of deuterium (hydrogen) via D (H) dominates, but at high exobase temperatures, loss via the molecular form HD (H2) can reach higher values, up to 5% (20%), as shown in Figure S4.
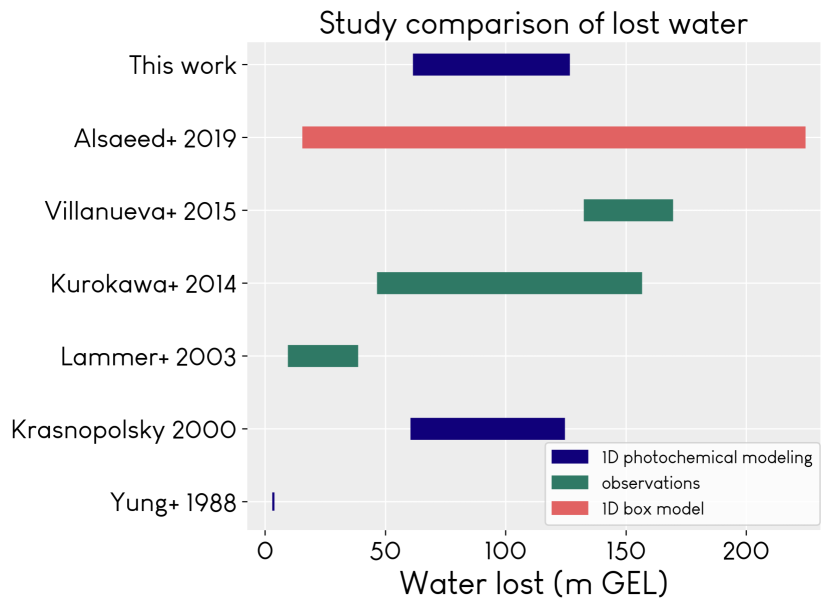
A comparison of our results for water loss to those of other similar studies is shown in Figure 9. Overall, our results agree reasonably well with these other studies. Our results are a little lower than those by \citeAVillanueva2015, who assume a higher atmospheric D/H ratio (7-8 SMOW), and a little higher than \citeALammer2003, who assume a higher D/H ratio for early Mars (1.2-2.6 SMOW) and a lower estimate of the current exchangeable water (3.3-15 m GEL). The original study by \citeAYung1988 is an outlier in this case because they were attempting to determine both the current water inventory and the amount lost, and did not have the benefit of the many Mars missions and observations that we have today. The recent work by \citeAAlsaeed2019 is unique compared to the other studies in this figure in that they allow water to be added to the atmosphere via volcanic outgassing, so that their results represent a large possible solution space and are less directly comparable than the other studies.
Our results for water loss also bring up an important point with regard to escape rates. It is common when estimating water loss on Mars to assume that the escape fluxes and are constant and that the water inventory decreases linearly with time. This is an often necessary but imperfect assumption due to the many unknowns involved, including historical rates of atmospheric escape and their evolution in light of Mars’ chaotically evolving obliquity. Assuming linear loss with time (and neglecting , which is far slower than ) gives , where is the time over which the water has been lost. Using our results for water loss, even the smallest amount lost (about 60 m GEL) requires an escape rate of cm-2 s-1, an order of magnitude higher than what we currently observe for escape rates of H from Mars [Jakosky \BOthers. (\APACyear2018)]. This is an indication that escape rates were likely higher in the past due to a variety of factors, especially in the context of a more UV-active young sun [Jakosky \BOthers. (\APACyear2018)], or that surface interactions play a larger role that has been previously explored–e.g., with regard to oxygen deposition [Zahnle \BOthers. (\APACyear2008)]–but not yet fully quantified.
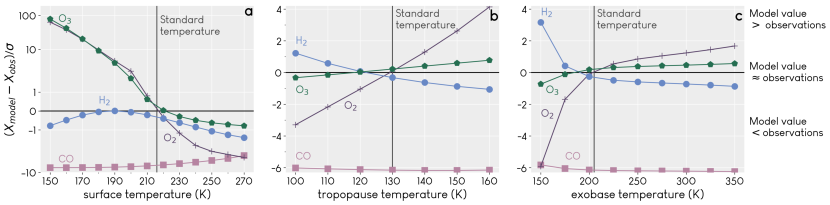
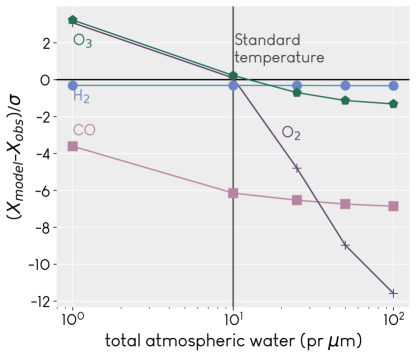
As a way to gain insight about our results, we compared the concentrations of a few molecular species in our model with available measurements (Figures 10 and 11). The measurements we used were the inferred lower atmospheric abundance of H 15 5 ppm [V\BPBIA. Krasnopolsky \BBA Feldman (\APACyear2001)]; a global mean O3 abundance of 1.2 m-atm, extracted from maps by \citeAClancy2016; and mixing ratios for O2 and CO at the surface equal to and [Trainer \BOthers. (\APACyear2019)]. These comparisons indicate the model conditions which may be more similar or dissimilar to the current state of Mars. As one example, model results that used a particularly low temperature as input (for example, models with or ) diverge greatly from measurements of all molecular species. These model results thus represent a significant perturbation to the photochemical system as compared to modern Mars. It is also important to note that O3 and O2 are related, as O3 is created and destroyed via interactions between O2 and O. CO sticks out as an obvious problem; this is not surprising, as many photochemical models also have difficulty in reproducing the observed values [V\BPBIA. Krasnopolsky (\APACyear2010)]. Some models come close (e.g. \citeAZahnle2008), usually only when another parameter changes significantly. Our model also underestimates CO, reaffirming the ongoing need for study in this area. Apart from CO, the difference between our model and measurements is mostly small, indicating that the standard atmosphere we chose was reasonable.
Our results represent a peri-modern global scenario; has likely changed over time in ways that our model does not account for. In this work, we consider only the exchangeable reservoirs of water on Mars without including any type of surface deposition, which comprises multiple processes with potentially different fractionation factors. Fractionation may also vary on seasonal timescales, especially around the poles, as HDO preferentially condenses and may also have a different sublimation rate compared to H2O. It has certainly varied over geological time scales. We run the model for 10 million years to equilibrium, though it would not necessarily have been in equilibrium throughout its 4.5 billion year history. This also means that atmospheric escape rates would not have been constant in time, although we assume them to be because their time evolution is unknown. Mars’ chaotically evolving obliquity on time scales greater than 10 million years is a major reason for this lack of a definitive paleo-climate timeline. Characterization of escape rates through time is therefore a critical, but daunting, subject for future modeling efforts. On early Mars, the more UV-active young sun would have enhanced non-thermal escape rates [Jakosky \BOthers. (\APACyear2018)], allowing to grow larger due to the enhancement of . This is allowed even in long-term chemical equilibrium; when no D is present, , but when D is present, the requirement instead becomes . For all these reasons, we expect that our results for water loss are a lower bound.
5 Conclusions
Our results in Figure 4 and Table S5 show that if only thermal escape is considered, the exobase temperature has the strongest effect on the fractionation factor, whereas when non-thermal escape is included, the temperatures of the tropopause and exobase become comparably important (given the uncertainty in our non-thermal escape estimation). While the exobase and upper atmosphere have been the focus of many recent studies, the Martian mesosphere is less well-studied, but is worthy of future modeling and observational efforts. The tropopause temperature affects mesospheric chemistry, which is especially important considering the seasonal transport of water to these altitudes [Chaffin \BOthers. (\APACyear2017), Heavens \BOthers. (\APACyear2018), Shaposhnikov \BOthers. (\APACyear2019), Fedorova \BOthers. (\APACyear2020)]. Because is the minimum temperature in the atmosphere, a larger value also implies a warmer thermosphere (see Figure 2), which may contribute to enhanced transport, especially above the homopause.
Our results also show how important non-thermal escape is to accurately calculate . For thermal escape processes only, D is almost completely retained on Mars compared to H. This is especially true near solar maximum, when most atmospheric loss occurs as thermal escape of H. During solar mean and minimum, however, thermal escape of both D and H is lowenough that the non-thermal loss of D and HD becomes much more significant [V\BPBIA. Krasnopolsky \BBA Mumma (\APACyear1998), Gacesa \BOthers. (\APACyear2012)]. Figure 4 shows that including non-thermal escape increases by an order of magnitude or more for all atmospheric conditions. Studies of only thermal escape are therefore not likely to provide a reasonable estimate of . We therefore advise that future modeling studies that calculate should include non-thermal escape; this will also enable better comparison with recent observationally-derived values of (e.g. \citeNPClarke2019).
In this study, we have neglected interaction with the planetary surface, which is certainly important due to the unknown D/H of surface ice and polar caps and fractionating effects on sublimation and deposition. Future work to understand the fractionation factor and atmospheric escape will need to link cross-disciplinary knowledge of surface and atmospheric processes. The history of water on Mars cannot be fully understood by only considering one or the other; they are inextricably linked. A more thorough understanding of exchange between different water reservoirs on and under the surface and in the atmosphere, as well as the variables affecting all types of atmospheric escape and water loss, will be instrumental in forming a more complete picture of the fractionation factor, and by extension water loss, on Mars.
Acknowledgements.
This work was supported by MDAP grant #NNX14AM20G. Additionally, this material is based upon work supported by the National Science Foundation Graduate Research Fellowship Program under Grant No. DGE 1650115. Any opinions, findings, and conclusions or recommendations expressed in this material are those of the author(s) and do not necessarily reflect the views of the National Science Foundation. The authors would like to thank B. Jakosky, N. Alsaeed, L. Wernicke, and D. Brain for ongoing collaboration, feedback, and support. The model, input information, and generated output can be found on Zenodo [Cangi \BOthers. (\APACyear2020)].References
- Alsaeed \BBA Jakosky (\APACyear2019) \APACinsertmetastarAlsaeed2019{APACrefauthors}Alsaeed, N\BPBIR.\BCBT \BBA Jakosky, B\BPBIM. \APACrefYearMonthDay2019. \BBOQ\APACrefatitleMars Water and D/H Evolution From 3.3 Ga to Present Mars Water and D/H Evolution From 3.3 Ga to Present.\BBCQ \APACjournalVolNumPagesJournal of Geophysical Research: Planets124. {APACrefDOI} 10.1029/2019JE006066 \PrintBackRefs\CurrentBib
- Anderson \BBA Hord (\APACyear1971) \APACinsertmetastarAnderson1971{APACrefauthors}Anderson, D\BPBIE.\BCBT \BBA Hord, C\BPBIW. \APACrefYearMonthDay1971. \BBOQ\APACrefatitleMariner 6 and 7 Ultraviolet Spectrometer Experiment: Analysis of hydrogen Lyman-alpha data Mariner 6 and 7 Ultraviolet Spectrometer Experiment: Analysis of hydrogen Lyman-alpha data.\BBCQ \APACjournalVolNumPagesJournal of Geophysical Research76. {APACrefDOI} 10.1029/ja076i028p06666 \PrintBackRefs\CurrentBib
- Audouard \BOthers. (\APACyear2016) \APACinsertmetastarAudouard2016{APACrefauthors}Audouard, J., Piqueux, S., Poulet, F., Vincendon, M., Gondet, B.\BCBL \BBA Rogers, D\BPBIA. \APACrefYearMonthDay2016. \BBOQ\APACrefatitleAnalysis of Curiosity Surface Temperature Data Analysis of Curiosity Surface Temperature Data.\BBCQ \BIn \APACrefbtitle47th Lunar and Planetary Sciences Conference. 47th lunar and planetary sciences conference. \PrintBackRefs\CurrentBib
- Banks \BBA Kockarts (\APACyear1973) \APACinsertmetastarBanksNKockarts{APACrefauthors}Banks, P\BPBIM.\BCBT \BBA Kockarts, G. \APACrefYear1973. \APACrefbtitleAeronomy Aeronomy. \APACaddressPublisherAcademic Press, Inc. \PrintBackRefs\CurrentBib
- Barfield \BOthers. (\APACyear1972) \APACinsertmetastarBarfield1972{APACrefauthors}Barfield, W., Koontz, G.\BCBL \BBA Huebner, W. \APACrefYearMonthDay1972. \BBOQ\APACrefatitleFits to new calculations of photoionization cross sections for low-Z elements Fits to new calculations of photoionization cross sections for low-z elements.\BBCQ \APACjournalVolNumPagesJournal of Quantitative Spectroscopy and Radiative Transfer12. {APACrefDOI} 10.1016/0022-4073(72)90043-X \PrintBackRefs\CurrentBib
- Bertaux \BBA Montmessin (\APACyear2001) \APACinsertmetastarBertaux2001{APACrefauthors}Bertaux, J.\BCBT \BBA Montmessin, F. \APACrefYearMonthDay2001. \BBOQ\APACrefatitleIsotopic fractionation through water vapor condensation: The Deuteropause, a cold trap for deuterium in the atmosphere of Mars Isotopic fractionation through water vapor condensation: The Deuteropause, a cold trap for deuterium in the atmosphere of Mars.\BBCQ \APACjournalVolNumPagesJournal of Geophysical Research-Planets106. {APACrefDOI} 10.1029/2000JE001358 \PrintBackRefs\CurrentBib
- Bjoraker \BOthers. (\APACyear1989) \APACinsertmetastarBjoraker1989{APACrefauthors}Bjoraker, G\BPBIL., Mumma, M\BPBIJ.\BCBL \BBA Larson, H\BPBIP. \APACrefYearMonthDay1989. \BBOQ\APACrefatitleIsotopic Abundance Ratios for Hydrogen and Oxygen in the Martian Atmosphere Isotopic Abundance Ratios for Hydrogen and Oxygen in the Martian Atmosphere.\BBCQ \BIn \APACrefbtitleAAS/Division for Planetary Sciences 21st annual meeting. AAS/Division for Planetary Sciences 21st annual meeting. \PrintBackRefs\CurrentBib
- Bougher \BOthers. (\APACyear2017) \APACinsertmetastarBougher2017{APACrefauthors}Bougher, S\BPBIW., Roeten, K\BPBIJ., Olsen, K., Mahaffy, P\BPBIR., Benna, M., Elrod, M.\BDBLJakosky, B\BPBIM. \APACrefYearMonthDay2017. \BBOQ\APACrefatitleThe structure and variability of Mars dayside thermosphere from MAVEN NGIMS and IUVS measurements: Seasonal and solar activity trends in scale heights and temperatures The structure and variability of Mars dayside thermosphere from MAVEN NGIMS and IUVS measurements: Seasonal and solar activity trends in scale heights and temperatures.\BBCQ \APACjournalVolNumPagesJournal of Geophysical Research: Space Physics122. {APACrefDOI} 10.1002/2016JA023454 \PrintBackRefs\CurrentBib
- Cangi \BOthers. (\APACyear2020) \APACinsertmetastarCangi2020{APACrefauthors}Cangi, E., Chaffin, M\BPBIS.\BCBL \BBA Deighan, J. \APACrefYearMonthDay2020October. \APACrefbtitleemcangi/dh_fractionation Mars D Photochemistry. emcangi/dh_fractionation Mars D Photochemistry. {APACrefURL} http://doi.org/10.5281/zenodo.4110723 {APACrefDOI} 10.5281/zenodo.4110723 \PrintBackRefs\CurrentBib
- M. Carr \BBA Head (\APACyear2019) \APACinsertmetastarCarr2019{APACrefauthors}Carr, M.\BCBT \BBA Head, J. \APACrefYearMonthDay2019. \BBOQ\APACrefatitleMars: Formation and fate of a frozen Hesperian ocean Mars: Formation and fate of a frozen Hesperian ocean.\BBCQ \APACjournalVolNumPagesIcarus319. {APACrefDOI} 10.1016/j.icarus.2018.08.021 \PrintBackRefs\CurrentBib
- M\BPBIH. Carr \BBA Head (\APACyear2010) \APACinsertmetastarCarr2010{APACrefauthors}Carr, M\BPBIH.\BCBT \BBA Head, J\BPBIW. \APACrefYearMonthDay2010. \BBOQ\APACrefatitleGeologic history of Mars Geologic history of Mars.\BBCQ \APACjournalVolNumPagesEarth and Planetary Science Letters294. {APACrefDOI} 10.1016/j.epsl.2009.06.042 \PrintBackRefs\CurrentBib
- Cazaux \BOthers. (\APACyear2010) \APACinsertmetastarCazaux2010{APACrefauthors}Cazaux, S., Cobut, V., Marseille, M., Spaans, M.\BCBL \BBA Caselli, P. \APACrefYearMonthDay2010. \BBOQ\APACrefatitleWater formation on bare grains: When the chemistry on dust impacts interstellar gas Water formation on bare grains: When the chemistry on dust impacts interstellar gas.\BBCQ \APACjournalVolNumPagesAstronomy & Astrophysics522. {APACrefDOI} 10.1051/0004-6361/201014026 \PrintBackRefs\CurrentBib
- Chaffin \BOthers. (\APACyear2017) \APACinsertmetastarChaffin2017{APACrefauthors}Chaffin, M\BPBIS., Deighan, J., Schneider, N\BPBIM.\BCBL \BBA Stewart, A\BPBII\BPBIF. \APACrefYearMonthDay2017. \BBOQ\APACrefatitleElevated atmospheric escape of atomic hydrogen from Mars induced by high-altitude water Elevated atmospheric escape of atomic hydrogen from Mars induced by high-altitude water.\BBCQ \APACjournalVolNumPagesNature Geoscience10. {APACrefDOI} 10.1038/ngeo2887 \PrintBackRefs\CurrentBib
- Cheng \BOthers. (\APACyear1999) \APACinsertmetastarCheng1999{APACrefauthors}Cheng, B\BPBIM., Chew, E\BPBIP., Liu, C\BPBIP.\BCBL \BOthersPeriod. \APACrefYearMonthDay1999. \BBOQ\APACrefatitlePhoto-induced fractionation of water isotopomers in the Martian atmosphere Photo-induced fractionation of water isotopomers in the Martian atmosphere.\BBCQ \APACjournalVolNumPagesGeophysical Research Letters26. {APACrefDOI} 10.1029/1999GL008367 \PrintBackRefs\CurrentBib
- Cheng \BOthers. (\APACyear2004) \APACinsertmetastarCheng2004{APACrefauthors}Cheng, B\BPBIM., Chung, C\BPBIY., Bahou, M., Lee, Y\BPBIP., Lee, L\BPBIC., Van Harrevelt, R.\BCBL \BBA Van Hemert, M\BPBIC. \APACrefYearMonthDay2004. \BBOQ\APACrefatitleQuantitative spectroscopic and theoretical study of the optical absorption spectra of H 2O, HOD, and D 2O in the 125-145 nm region Quantitative spectroscopic and theoretical study of the optical absorption spectra of H 2O, HOD, and D 2O in the 125-145 nm region.\BBCQ \APACjournalVolNumPagesJournal of Chemical Physics120. {APACrefDOI} 10.1063/1.1630304 \PrintBackRefs\CurrentBib
- Clancy \BOthers. (\APACyear2016) \APACinsertmetastarClancy2016{APACrefauthors}Clancy, R\BPBIT., Wolff, M\BPBIJ., Lefèvre, F., Cantor, B\BPBIA., Malin, M\BPBIC.\BCBL \BBA Smith, M\BPBID. \APACrefYearMonthDay2016. \BBOQ\APACrefatitleDaily global mapping of Mars ozone column abundances with MARCI UV band imaging Daily global mapping of Mars ozone column abundances with MARCI UV band imaging.\BBCQ \APACjournalVolNumPagesIcarus266. {APACrefDOI} 10.1016/j.icarus.2015.11.016 \PrintBackRefs\CurrentBib
- Clarke \BOthers. (\APACyear2017) \APACinsertmetastarClarke2017{APACrefauthors}Clarke, J\BPBIT., Mayyasi, M., Bhattacharyya, D.\BCBL \BOthersPeriod. \APACrefYearMonthDay2017. \BBOQ\APACrefatitleVariability of D and H in the Martian upper atmosphere observed with the MAVEN IUVS echelle channel Variability of D and H in the Martian upper atmosphere observed with the MAVEN IUVS echelle channel.\BBCQ \APACjournalVolNumPagesJournal of Geophysical Research: Space Physics122. {APACrefDOI} 10.1002/2016JA023479 \PrintBackRefs\CurrentBib
- Clarke \BOthers. (\APACyear2019) \APACinsertmetastarClarke2019{APACrefauthors}Clarke, J\BPBIT., Mayyasi, M., Bhattacharyya, D., Schneider, N., Chaufray, J\BHBIY., Bertaux, J\BHBIL.\BDBLYelle, R. \APACrefYearMonthDay2019Sept. \BBOQ\APACrefatitleThe D/H Ratio in the Martian Upper Atmosphere The D/H Ratio in the Martian Upper Atmosphere.\BBCQ \BIn \APACrefbtitleEuropean Planetary Science Congress and AAS/Division for Planetary Sciences 2019 joint meeting. European Planetary Science Congress and AAS/Division for Planetary Sciences 2019 joint meeting. \APACrefnoteEPSC-DPS2019-868-1 \PrintBackRefs\CurrentBib
- Deighan (\APACyear2012) \APACinsertmetastarDeighan2012{APACrefauthors}Deighan, J. \APACrefYear2012. \APACrefbtitleThe Effect of an Ozone Layer on Ancient Mars The effect of an ozone layer on ancient mars \APACtypeAddressSchool\BPhDUniversity of Virginia. {APACrefURL} http://libra.virginia.edu/catalog/libra-oa:2577 \PrintBackRefs\CurrentBib
- Ehlmann \BBA Edwards (\APACyear2014) \APACinsertmetastarEhlmann2014{APACrefauthors}Ehlmann, B\BPBIL.\BCBT \BBA Edwards, C\BPBIS. \APACrefYearMonthDay2014. \BBOQ\APACrefatitleMineralogy of the Martian Surface Mineralogy of the Martian Surface.\BBCQ \APACjournalVolNumPagesAnnual Review of Earth and Planetary Sciences42. {APACrefDOI} 10.1146/annurev-earth-060313-055024 \PrintBackRefs\CurrentBib
- Encrenaz \BOthers. (\APACyear2018) \APACinsertmetastarEncrenaz2018{APACrefauthors}Encrenaz, T., DeWitt, C., Richter, M\BPBIJ., Greathouse, T\BPBIK., Fouchet, T., Montmessin, F.\BDBLSagawa, H. \APACrefYearMonthDay2018. \BBOQ\APACrefatitleNew measurements of D/H on Mars using EXES aboard SOFIA New measurements of D/H on Mars using EXES aboard SOFIA.\BBCQ \APACjournalVolNumPagesAstronomy & Astrophysics612. {APACrefDOI} 10.1051/0004-6361/201732367 \PrintBackRefs\CurrentBib
- Fedorova \BOthers. (\APACyear2020) \APACinsertmetastarFedorova2020{APACrefauthors}Fedorova, A\BPBIA., Montmessin, F., Korablev, O., Luginin, M., Trokhimovsky, A., Belyaev, D\BPBIA.\BDBLWilson, C\BPBIF. \APACrefYearMonthDay2020. \BBOQ\APACrefatitleStormy water on Mars: the behavior and saturation of atmospheric water during the dusty season Stormy water on Mars: the behavior and saturation of atmospheric water during the dusty season.\BBCQ \APACjournalVolNumPagesSubmitted to Science9522. {APACrefDOI} 10.1126/science.aay9522 \PrintBackRefs\CurrentBib
- Forget \BOthers. (\APACyear2009) \APACinsertmetastarForget2009{APACrefauthors}Forget, F., Montmessin, F., Bertaux, J\BHBIL., González-Galindo, F., Lebonnois, S., Quémerais, E.\BDBLLópez-Valverde, M\BPBIA. \APACrefYearMonthDay2009. \BBOQ\APACrefatitleDensity and temperatures of the upper Martian atmosphere measured by stellar occultations with Mars Express SPICAM Density and temperatures of the upper Martian atmosphere measured by stellar occultations with Mars Express SPICAM.\BBCQ \APACjournalVolNumPagesJournal of Geophysical Research (Planets)114. {APACrefDOI} 10.1029/2008JE003086 \PrintBackRefs\CurrentBib
- Fouchet \BBA Lellouch (\APACyear1999) \APACinsertmetastarFouchet1999{APACrefauthors}Fouchet, T.\BCBT \BBA Lellouch, E. \APACrefYearMonthDay1999. \BBOQ\APACrefatitleVapor Pressure Isotope Fractionation Effects in Planetary Atmospheres: Application to Deuterium Vapor Pressure Isotope Fractionation Effects in Planetary Atmospheres: Application to Deuterium.\BBCQ \APACjournalVolNumPagesIcarus144. {APACrefDOI} 10.1006/icar.1999.6264 \PrintBackRefs\CurrentBib
- Gacesa \BOthers. (\APACyear2012) \APACinsertmetastarGacesa2012{APACrefauthors}Gacesa, M., Zhang, P.\BCBL \BBA Kharchenko, V. \APACrefYearMonthDay2012. \BBOQ\APACrefatitleNon-thermal escape of molecular hydrogen from Mars Non-thermal escape of molecular hydrogen from Mars.\BBCQ \APACjournalVolNumPagesGeophysical Research Letters39. {APACrefDOI} 10.1029/2012GL050904 \PrintBackRefs\CurrentBib
- Geiss \BBA Reeves (\APACyear1981) \APACinsertmetastarGeiss1981{APACrefauthors}Geiss, J.\BCBT \BBA Reeves, H. \APACrefYearMonthDay1981. \BBOQ\APACrefatitleDeuterium in the solar system Deuterium in the solar system.\BBCQ \APACjournalVolNumPagesAstronomy & Astrophysics93. \PrintBackRefs\CurrentBib
- Heavens \BOthers. (\APACyear2018) \APACinsertmetastarHeavens2018{APACrefauthors}Heavens, N\BPBIG., Kleinböhl, A., Chaffin, M\BPBIS.\BCBL \BOthersPeriod. \APACrefYearMonthDay2018. \BBOQ\APACrefatitleHydrogen escape from Mars enhanced by deep convection in dust storms Hydrogen escape from Mars enhanced by deep convection in dust storms.\BBCQ \APACjournalVolNumPagesNature Astronomy2. {APACrefDOI} 10.1038/s41550-017-0353-4 \PrintBackRefs\CurrentBib
- Hunten (\APACyear1973) \APACinsertmetastarHunten1973{APACrefauthors}Hunten, D\BPBIM. \APACrefYearMonthDay1973. \BBOQ\APACrefatitleThe Escape of Light Gases from Planetary Atmospheres The Escape of Light Gases from Planetary Atmospheres.\BBCQ \APACjournalVolNumPagesJournal of the Atmospheric Sciences30. {APACrefDOI} 10.1016/0032-0633(82)90110-6 \PrintBackRefs\CurrentBib
- Jakosky \BOthers. (\APACyear2018) \APACinsertmetastarJakosky2018{APACrefauthors}Jakosky, B\BPBIM., Brain, D\BPBIA., Chaffin, M\BPBIS.\BCBL \BOthersPeriod. \APACrefYearMonthDay2018. \BBOQ\APACrefatitleLoss of the Martian atmosphere to space: Present-day loss rates determined from MAVEN observations and integrated loss through time Loss of the Martian atmosphere to space: Present-day loss rates determined from MAVEN observations and integrated loss through time.\BBCQ \APACjournalVolNumPagesIcarus. {APACrefDOI} 10.1016/j.icarus.2018.05.030 \PrintBackRefs\CurrentBib
- Klingelhöfer \BOthers. (\APACyear2004) \APACinsertmetastarKlingelhofer2004{APACrefauthors}Klingelhöfer, G., Morris, R\BPBIV., Bernhardt, B., Schröder, C., Rodionov, D\BPBIS., de Souza, P\BPBIA.\BDBLArvidson, R\BPBIE. \APACrefYearMonthDay2004. \BBOQ\APACrefatitleJarosite and Hematite at Meridiani Planum from Opportunity’s Mössbauer Spectrometer Jarosite and Hematite at Meridiani Planum from Opportunity’s Mössbauer Spectrometer.\BBCQ \APACjournalVolNumPagesScience306. {APACrefDOI} 10.1126/science.1104653 \PrintBackRefs\CurrentBib
- V. Krasnopolsky (\APACyear1993) \APACinsertmetastarKras1993{APACrefauthors}Krasnopolsky, V. \APACrefYearMonthDay1993. \BBOQ\APACrefatitlePhotochemistry of the Martian Atmosphere (Mean Conditions) Photochemistry of the Martian Atmosphere (Mean Conditions).\BBCQ \APACjournalVolNumPagesIcarus101. {APACrefDOI} 10.1006/icar.1993.1027 \PrintBackRefs\CurrentBib
- V. Krasnopolsky (\APACyear2000) \APACinsertmetastarKras2000{APACrefauthors}Krasnopolsky, V. \APACrefYearMonthDay2000. \BBOQ\APACrefatitleOn the Deuterium Abundance on Mars and Some Related Problems On the Deuterium Abundance on Mars and Some Related Problems.\BBCQ \APACjournalVolNumPagesIcarus148. {APACrefDOI} 10.1006/icar.2000.6534 \PrintBackRefs\CurrentBib
- V. Krasnopolsky \BOthers. (\APACyear1997) \APACinsertmetastarKras1997{APACrefauthors}Krasnopolsky, V., Bjoraker, G., Mumma, M.\BCBL \BBA Jennings, D. \APACrefYearMonthDay1997. \BBOQ\APACrefatitleHigh-resolution spectroscopy of Mars at 3.7 and 8 m:A sensitive search for H2O2, H2CO, HCI, and CH4, and detection of HDO High-resolution spectroscopy of Mars at 3.7 and 8 m:A sensitive search for H2O2, H2CO, HCI, and CH4, and detection of HDO.\BBCQ \APACjournalVolNumPagesJournal of Geophysical Research102. {APACrefDOI} 10.1029/96JE03766 \PrintBackRefs\CurrentBib
- V\BPBIA. Krasnopolsky (\APACyear2002) \APACinsertmetastarKras2002{APACrefauthors}Krasnopolsky, V\BPBIA. \APACrefYearMonthDay2002. \BBOQ\APACrefatitleMars’ upper atmosphere and ionosphere at low, medium, and high solar activities: Implications for evolution of water Mars’ upper atmosphere and ionosphere at low, medium, and high solar activities: Implications for evolution of water.\BBCQ \APACjournalVolNumPagesJournal of Geophysical Research: Planets107. {APACrefDOI} 10.1029/2001JE001809 \PrintBackRefs\CurrentBib
- V\BPBIA. Krasnopolsky (\APACyear2010) \APACinsertmetastarKras2010{APACrefauthors}Krasnopolsky, V\BPBIA. \APACrefYearMonthDay2010. \BBOQ\APACrefatitleSolar activity variations of thermospheric temperatures on Mars and a problem of CO in the lower atmosphere Solar activity variations of thermospheric temperatures on Mars and a problem of CO in the lower atmosphere.\BBCQ \APACjournalVolNumPagesIcarus207. {APACrefDOI} 10.1016/j.icarus.2009.12.036 \PrintBackRefs\CurrentBib
- V\BPBIA. Krasnopolsky \BBA Feldman (\APACyear2001) \APACinsertmetastarKras2001{APACrefauthors}Krasnopolsky, V\BPBIA.\BCBT \BBA Feldman, P\BPBID. \APACrefYearMonthDay2001. \BBOQ\APACrefatitleDetection of molecular hydrogen in the atmosphere of Mars Detection of molecular hydrogen in the atmosphere of Mars.\BBCQ \APACjournalVolNumPagesScience294. {APACrefDOI} 10.1126/science.1065569 \PrintBackRefs\CurrentBib
- V\BPBIA. Krasnopolsky \BBA Mumma (\APACyear1998) \APACinsertmetastarKras1998{APACrefauthors}Krasnopolsky, V\BPBIA.\BCBT \BBA Mumma, M\BPBIJ. \APACrefYearMonthDay1998. \BBOQ\APACrefatitleDetection of Atomic Deuterium in the Upper Atmosphere of Mars Detection of Atomic Deuterium in the Upper Atmosphere of Mars.\BBCQ \APACjournalVolNumPagesScience280. {APACrefDOI} 10.1126/science.280.5369.1576 \PrintBackRefs\CurrentBib
- Kurokawa \BOthers. (\APACyear2014) \APACinsertmetastarKurokawa2014{APACrefauthors}Kurokawa, H., Sato, M., Ushioda, M., Matsuyama, T., Moriwaki, R., Dohm, J\BPBIM.\BCBL \BBA Usui, T. \APACrefYearMonthDay2014. \BBOQ\APACrefatitleEvolution of water reservoirs on Mars: Constraints from hydrogen isotopes in martian meteorites Evolution of water reservoirs on Mars: Constraints from hydrogen isotopes in martian meteorites.\BBCQ \APACjournalVolNumPagesEarth and Planetary Science Letters394. {APACrefDOI} 10.1016/j.epsl.2014.03.027 \PrintBackRefs\CurrentBib
- Lammer \BOthers. (\APACyear2003) \APACinsertmetastarLammer2003{APACrefauthors}Lammer, H., Kolb, C., Penz, T., Amerstorfer, U\BPBIV., Biernat, H\BPBIK.\BCBL \BBA Bodiselitsch, B. \APACrefYearMonthDay2003. \BBOQ\APACrefatitleEstimation of the past and present Martian water-ice reservoirs by isotopic constraints on exchange between the atmosphere and the surface Estimation of the past and present Martian water-ice reservoirs by isotopic constraints on exchange between the atmosphere and the surface.\BBCQ \APACjournalVolNumPagesInternational Journal of Astrobiology2. {APACrefDOI} 10.1017/S1473550403001605 \PrintBackRefs\CurrentBib
- Laskar \BOthers. (\APACyear2004) \APACinsertmetastarLaskar2004{APACrefauthors}Laskar, J., Correia, A., Gastineau, M., Joutel, F., Levrard, B.\BCBL \BBA Robutel, P. \APACrefYearMonthDay2004. \BBOQ\APACrefatitleLong term evolution and chaotic diffusion of the insolation quantities of Mars Long term evolution and chaotic diffusion of the insolation quantities of Mars.\BBCQ \APACjournalVolNumPagesIcarus170. {APACrefDOI} 10.1016/J.ICARUS.2004.04.005 \PrintBackRefs\CurrentBib
- Lasue \BOthers. (\APACyear2013) \APACinsertmetastarLasue2013{APACrefauthors}Lasue, J., Mangold, N., Hauber, E.\BCBL \BOthersPeriod. \APACrefYearMonthDay2013. \BBOQ\APACrefatitleQuantitative Assessments of the Martian Hydrosphere Quantitative Assessments of the Martian Hydrosphere.\BBCQ \APACjournalVolNumPagesSpace Science Reviews174. {APACrefDOI} 10.1007/s11214-012-9946-5 \PrintBackRefs\CurrentBib
- Liu \BBA Donahue (\APACyear1976) \APACinsertmetastarLiu1976{APACrefauthors}Liu, S.\BCBT \BBA Donahue, T. \APACrefYearMonthDay1976. \BBOQ\APACrefatitleThe regulation of hydrogen and oxygen escape from Mars The regulation of hydrogen and oxygen escape from Mars.\BBCQ \APACjournalVolNumPagesIcarus28. {APACrefDOI} 10.1016/0019-1035(76)90035-X \PrintBackRefs\CurrentBib
- Mahaffy \BOthers. (\APACyear2015) \APACinsertmetastarMahaffy2015{APACrefauthors}Mahaffy, P\BPBIR., Webster, C\BPBIR., Stern, J\BPBIC., Brunner, A\BPBIE., Atreya, S\BPBIK., Conrad, P\BPBIG.\BDBLWray, J\BPBIJ. \APACrefYearMonthDay2015. \BBOQ\APACrefatitleThe imprint of atmospheric evolution in the D/H of hesperian clay minerals on Mars The imprint of atmospheric evolution in the D/H of hesperian clay minerals on Mars.\BBCQ \APACjournalVolNumPagesScience347. {APACrefDOI} 10.1126/science.1260291 \PrintBackRefs\CurrentBib
- Maltagliati (\APACyear2011) \APACinsertmetastarMaltagliati2011{APACrefauthors}Maltagliati, L. \APACrefYearMonthDay2011. \BBOQ\APACrefatitleEvidence of Water Vapor in Excess of Saturation in the Atmosphere of Mars Evidence of Water Vapor in Excess of Saturation in the Atmosphere of Mars.\BBCQ \APACjournalVolNumPagesScience333. {APACrefDOI} 10.1126/science.1207957 \PrintBackRefs\CurrentBib
- Manion \BOthers. (\APACyear2015) \APACinsertmetastarNIST{APACrefauthors}Manion, J\BPBIA., Huie, R\BPBIE., Levin, R\BPBID., Burgess Jr., D\BPBIR., Orkin, V\BPBIL., Tsang, W.\BDBLFrizzell, D\BPBIH. \APACrefYearMonthDay2015. \APACrefbtitleNIST Chemical Kinetics Database. NIST Chemical Kinetics Database. {APACrefURL} [2015-09]http://kinetics.nist.gov/ \PrintBackRefs\CurrentBib
- Marti \BBA Mauersberger (\APACyear1993) \APACinsertmetastarMarti1993{APACrefauthors}Marti, J.\BCBT \BBA Mauersberger, K. \APACrefYearMonthDay1993. \BBOQ\APACrefatitleA Survey and New Measurements of Ice Vapor Pressure at Temperatures Between 170 and 250K A Survey and New Measurements of Ice Vapor Pressure at Temperatures Between 170 and 250K.\BBCQ \APACjournalVolNumPagesGeophysical Research Letters20. {APACrefDOI} 10.1029/93GL00105 \PrintBackRefs\CurrentBib
- Matta \BOthers. (\APACyear2013) \APACinsertmetastarMatta2013{APACrefauthors}Matta, M., Withers, P.\BCBL \BBA Mendillo, M. \APACrefYearMonthDay2013. \BBOQ\APACrefatitleThe composition of Mars’ topside ionosphere: Effects of hydrogen The composition of Mars’ topside ionosphere: Effects of hydrogen.\BBCQ \APACjournalVolNumPagesJournal of Geophysical Research: Space Physics118. {APACrefDOI} 10.1002/jgra.50104 \PrintBackRefs\CurrentBib
- McElroy \BOthers. (\APACyear2013) \APACinsertmetastarUMIST{APACrefauthors}McElroy, D., Walsh, C., Markwick, A\BPBIJ., Cordiner, M\BPBIA., Smith, K.\BCBL \BBA Millar, T\BPBIJ. \APACrefYearMonthDay2013. \APACrefbtitleThe UMIST database for Astrochemistry 2012. The UMIST database for Astrochemistry 2012. \PrintBackRefs\CurrentBib
- McElroy \BOthers. (\APACyear1977) \APACinsertmetastarMcElroy1977{APACrefauthors}McElroy, M\BPBIB., Kong, T\BPBIY.\BCBL \BBA Yung, Y\BPBIL. \APACrefYearMonthDay1977. \BBOQ\APACrefatitlePhotochemistry and Evolution of Mars’ Atmosphere: A Viking Perspective Photochemistry and Evolution of Mars’ Atmosphere: A Viking Perspective.\BBCQ \APACjournalVolNumPagesJournal of Geophysical Research82. {APACrefDOI} 10.1029/JS082i028p04379 \PrintBackRefs\CurrentBib
- Millour \BBA Forget (\APACyear2018) \APACinsertmetastarMCD{APACrefauthors}Millour, E.\BCBT \BBA Forget, F. \APACrefYearMonthDay2018. \APACrefbtitleMars Climate Database. Mars Climate Database. {APACrefURL} http://www-mars.lmd.jussieu.fr/ \PrintBackRefs\CurrentBib
- Montmessin \BOthers. (\APACyear2005) \APACinsertmetastarMontmessin2005{APACrefauthors}Montmessin, F., Fouchet, T.\BCBL \BBA Forget, F. \APACrefYearMonthDay2005. \BBOQ\APACrefatitleModeling the annual cycle of HDO in the Martian atmosphere Modeling the annual cycle of HDO in the Martian atmosphere.\BBCQ \APACjournalVolNumPagesJournal of Geophysical Research E: Planets110. {APACrefDOI} 10.1029/2004JE002357 \PrintBackRefs\CurrentBib
- Nair \BOthers. (\APACyear1994) \APACinsertmetastarNair1994{APACrefauthors}Nair, H., Allen, M., Anbar, A\BPBID.\BCBL \BBA Yung, Y\BPBIL. \APACrefYearMonthDay1994. \BBOQ\APACrefatitleA Photochemical Model of the Martian Atmosphere A Photochemical Model of the Martian Atmosphere.\BBCQ \APACjournalVolNumPagesIcarus111. {APACrefDOI} 10.1006/icar.1994.1137 \PrintBackRefs\CurrentBib
- Nee \BBA Lee (\APACyear1984) \APACinsertmetastarNee1984{APACrefauthors}Nee, J\BPBIB.\BCBT \BBA Lee, L\BPBIC. \APACrefYearMonthDay1984. \BBOQ\APACrefatitlePhotoabsorption cross section of OD at 115-180 nm Photoabsorption cross section of OD at 115-180 nm.\BBCQ \APACjournalVolNumPagesThe Journal of Chemical Physics81. {APACrefDOI} 10.1063/1.448183 \PrintBackRefs\CurrentBib
- Owen \BOthers. (\APACyear1988) \APACinsertmetastarOwen1988{APACrefauthors}Owen, T., Maillard, J\BPBIP., de Bergh, C.\BCBL \BBA Lutz, B\BPBIL. \APACrefYearMonthDay1988. \BBOQ\APACrefatitleDeuterium on Mars: The Abundance of HDO and the Value of D/H. Deuterium on Mars: The Abundance of HDO and the Value of D/H.\BBCQ \APACjournalVolNumPagesScience (New York, N.Y.)240. {APACrefDOI} 10.1126/science.240.4860.1767 \PrintBackRefs\CurrentBib
- Plaut \BOthers. (\APACyear2007) \APACinsertmetastarPlaut2007{APACrefauthors}Plaut, J\BPBIJ., Picardi, G., Safaeinili, A., Ivanov, A\BPBIB., Milkovich, S\BPBIM., Cicchetti, A.\BDBLEdenhofer, P. \APACrefYearMonthDay2007. \BBOQ\APACrefatitleSubsurface Radar Sounding of the South Polar Layered Deposits of Mars Subsurface Radar Sounding of the South Polar Layered Deposits of Mars.\BBCQ \APACjournalVolNumPagesScience316. {APACrefDOI} 10.1126/science.1139672 \PrintBackRefs\CurrentBib
- Sander \BOthers. (\APACyear2011) \APACinsertmetastarSander2011{APACrefauthors}Sander, S\BPBIP., Friedl, R\BPBIR., Golden, D\BPBIM., Kurylo, M\BPBIJ., Moortgat, G\BPBIK., Wine, P\BPBIH.\BDBLOrkin, V\BPBIL. \APACrefYearMonthDay2011. \BBOQ\APACrefatitleChemical Kinetics and Photochemical Data for Use in Atmospheric Studies Evaluation Number 15 Chemical Kinetics and Photochemical Data for Use in Atmospheric Studies Evaluation Number 15.\BBCQ \APACjournalVolNumPagesCross Sections. {APACrefDOI} 10.1002/kin.550171010 \PrintBackRefs\CurrentBib
- Savijärvi \BOthers. (\APACyear2019) \APACinsertmetastarSavijarvi2019{APACrefauthors}Savijärvi, H., McConnochie, T\BPBIH., Harri, A\BPBIM.\BCBL \BBA Paton, M. \APACrefYearMonthDay2019. \BBOQ\APACrefatitleWater vapor mixing ratios and air temperatures for three martian years from Curiosity Water vapor mixing ratios and air temperatures for three martian years from Curiosity.\BBCQ \APACjournalVolNumPagesIcarus326. {APACrefDOI} 10.1016/j.icarus.2019.03.020 \PrintBackRefs\CurrentBib
- Seiff (\APACyear1982) \APACinsertmetastarSeiff1982{APACrefauthors}Seiff, A. \APACrefYearMonthDay1982. \BBOQ\APACrefatitlePost-Viking models for the structure of the summer atmosphere of Mars Post-Viking models for the structure of the summer atmosphere of Mars.\BBCQ \APACjournalVolNumPagesAdvances in Space Research2. {APACrefDOI} 10.1016/0273-1177(82)90102-8 \PrintBackRefs\CurrentBib
- Shaposhnikov \BOthers. (\APACyear2019) \APACinsertmetastarShaposhnikov2019{APACrefauthors}Shaposhnikov, D\BPBIS., Medvedev, A\BPBIS., Rodin, A\BPBIV.\BCBL \BBA Hartogh, P. \APACrefYearMonthDay2019. \BBOQ\APACrefatitleSeasonal Water ”Pump” in the Atmosphere of Mars: Vertical Transport to the Thermosphere Seasonal Water ”Pump” in the Atmosphere of Mars: Vertical Transport to the Thermosphere.\BBCQ \APACjournalVolNumPagesGeophysical Research Letters46. {APACrefDOI} 10.1029/2019GL082839 \PrintBackRefs\CurrentBib
- Smith (\APACyear2004) \APACinsertmetastarSmith2004{APACrefauthors}Smith, M\BPBID. \APACrefYearMonthDay2004. \BBOQ\APACrefatitleInterannual variability in TES atmospheric observations of Mars during 1999-2003 Interannual variability in TES atmospheric observations of Mars during 1999-2003.\BBCQ \APACjournalVolNumPagesIcarus167. {APACrefDOI} 10.1016/j.icarus.2003.09.010 \PrintBackRefs\CurrentBib
- Smith \BOthers. (\APACyear2006) \APACinsertmetastarSmith2006{APACrefauthors}Smith, M\BPBID., Wolff, M\BPBIJ., Spanovich, N., Ghosh, A., Banfield, D., Christensen, P\BPBIR.\BDBLSquyres, S\BPBIW. \APACrefYearMonthDay2006. \BBOQ\APACrefatitleOne Martian year of atmospheric observations using MER Mini-TES One Martian year of atmospheric observations using MER Mini-TES.\BBCQ \APACjournalVolNumPagesJournal of Geophysical Research E: Planets111. {APACrefDOI} 10.1029/2006JE002770 \PrintBackRefs\CurrentBib
- Squyres \BOthers. (\APACyear2004) \APACinsertmetastarSquyres2004{APACrefauthors}Squyres, S\BPBIW., Grotzinger, J\BPBIP., Arvidson, R\BPBIE., Bell, J\BPBIF., Calvin, W., Christensen, P\BPBIR.\BDBLSoderblom, L\BPBIA. \APACrefYearMonthDay2004. \BBOQ\APACrefatitleIn Situ Evidence for an Ancient Aqueous Environment at Meridiani Planum, Mars In Situ Evidence for an Ancient Aqueous Environment at Meridiani Planum, Mars.\BBCQ \APACjournalVolNumPagesScience306. {APACrefDOI} 10.1126/science.1104559 \PrintBackRefs\CurrentBib
- Stone \BOthers. (\APACyear2018) \APACinsertmetastarStone2018{APACrefauthors}Stone, S\BPBIW., Yelle, R\BPBIV., Benna, M., Elrod, M\BPBIK.\BCBL \BBA Mahaffy, P\BPBIR. \APACrefYearMonthDay2018. \BBOQ\APACrefatitleThermal Structure of the Martian Upper Atmosphere From MAVEN NGIMS Thermal Structure of the Martian Upper Atmosphere From MAVEN NGIMS.\BBCQ \APACjournalVolNumPagesJournal of Geophysical Research: Planets. {APACrefDOI} 10.1029/2018JE005559 \PrintBackRefs\CurrentBib
- Thiemann \BOthers. (\APACyear2018) \APACinsertmetastarThiemann2018{APACrefauthors}Thiemann, E\BPBIM\BPBIB., Eparvier, F\BPBIG., Bougher, S\BPBIW., Dominique, M., Andersson, L., Girazian, Z.\BDBLJakosky, B\BPBIM. \APACrefYearMonthDay2018. \BBOQ\APACrefatitleMars Thermospheric Variability Revealed by MAVEN EUVM Solar Occultations: Structure at Aphelion and Perihelion and Response to EUV Forcing Mars Thermospheric Variability Revealed by MAVEN EUVM Solar Occultations: Structure at Aphelion and Perihelion and Response to EUV Forcing.\BBCQ \APACjournalVolNumPagesJournal of Geophysical Research (Planets)123. {APACrefDOI} 10.1029/2018JE005550 \PrintBackRefs\CurrentBib
- Trainer \BOthers. (\APACyear2019) \APACinsertmetastarTrainer2019{APACrefauthors}Trainer, M\BPBIG., Wong, M\BPBIH., McConnochie, T\BPBIH., Franz, H\BPBIB., Atreya, S\BPBIK., Conrad, P\BPBIG.\BDBLZorzano, M\BPBIP. \APACrefYearMonthDay2019. \BBOQ\APACrefatitleSeasonal Variations in Atmospheric Composition as Measured in Gale Crater, Mars Seasonal Variations in Atmospheric Composition as Measured in Gale Crater, Mars.\BBCQ \APACjournalVolNumPagesJournal of Geophysical Research: Planets124. {APACrefDOI} 10.1029/2019JE006175 \PrintBackRefs\CurrentBib
- Usui \BOthers. (\APACyear2012) \APACinsertmetastarUsui2012{APACrefauthors}Usui, T., Alexander, C\BPBIM\BPBIO., Wang, J., Simon, J\BPBII.\BCBL \BBA Jones, J\BPBIH. \APACrefYearMonthDay2012. \BBOQ\APACrefatitleEvidence from Olivine-Hosted Melt Inclusions that the Martian Mantle has a Chondritic D/H Ratio and that Some Young Basalts have Assimilated Old Crust Evidence from Olivine-Hosted Melt Inclusions that the Martian Mantle has a Chondritic D/H Ratio and that Some Young Basalts have Assimilated Old Crust.\BBCQ \BIn \APACrefbtitleLunar and Planetary Science Conference. Lunar and planetary science conference. \PrintBackRefs\CurrentBib
- Vandaele \BOthers. (\APACyear2019) \APACinsertmetastarVandaele2019{APACrefauthors}Vandaele, A\BPBIC., Korablev, O., Daerden, F., Aoki, S., Thomas, I\BPBIR., Altieri, F.\BDBLothers \APACrefYearMonthDay2019. \BBOQ\APACrefatitleMartian dust storm impact on atmospheric H 2 O and D/H observed by ExoMars Trace Gas Orbiter Martian dust storm impact on atmospheric H 2 O and D/H observed by ExoMars Trace Gas Orbiter.\BBCQ \APACjournalVolNumPagesNature568. {APACrefDOI} 10.1038/s41586-019-1097-3 \PrintBackRefs\CurrentBib
- Vasavada \BOthers. (\APACyear2016) \APACinsertmetastarVasavada2016{APACrefauthors}Vasavada, A\BPBIR., Piqueux, S., Lewis, K\BPBIW., Lemmon, M\BPBIT.\BCBL \BBA Smith, M\BPBID. \APACrefYearMonthDay2016. \BBOQ\APACrefatitleThermophysical properties along Curiosity’s traverse in Gale crater, Mars, derived from the REMS ground temperature sensor Thermophysical properties along Curiosity’s traverse in Gale crater, Mars, derived from the REMS ground temperature sensor.\BBCQ \APACjournalVolNumPagesIcarus284. {APACrefDOI} 10.1016/j.icarus.2016.11.035 \PrintBackRefs\CurrentBib
- Villanueva \BOthers. (\APACyear2019) \APACinsertmetastarVillanueva2019{APACrefauthors}Villanueva, G\BPBIL., Liuzzi, G., Crismani, M\BPBIM.\BCBL \BOthersPeriod. \APACrefYearMonthDay2019. \BBOQ\APACrefatitleStrong seasonal and diurnal variabilityof water D/H on Marsas revealed with ExoMars/NOMAD Strong seasonal and diurnal variabilityof water D/H on Marsas revealed with ExoMars/NOMAD.\BBCQ \BIn \APACrefbtitleEPSC Abstracts. Epsc abstracts. \APACrefnoteEPSC-DPS2019-1471 \PrintBackRefs\CurrentBib
- Villanueva \BOthers. (\APACyear2015) \APACinsertmetastarVillanueva2015{APACrefauthors}Villanueva, G\BPBIL., Mumma, M\BPBIJ., Novak, R\BPBIE.\BCBL \BOthersPeriod. \APACrefYearMonthDay2015. \BBOQ\APACrefatitleStrong water isotopic anomalies in the martian atmosphere: Probing current and ancient reservoirs Strong water isotopic anomalies in the martian atmosphere: Probing current and ancient reservoirs.\BBCQ \APACjournalVolNumPagesScience348. {APACrefDOI} 10.1126/science.aaa3630 \PrintBackRefs\CurrentBib
- Wakelam \BBA Gratier (\APACyear2019) \APACinsertmetastarKIDA{APACrefauthors}Wakelam, V.\BCBT \BBA Gratier, P. \APACrefYearMonthDay2019. \APACrefbtitleKinetic Database for Astrochemistry. Kinetic Database for Astrochemistry. {APACrefURL} http://kida.obs.u-bordeaux1.fr/contact.html \PrintBackRefs\CurrentBib
- Woods \BOthers. (\APACyear2019) \APACinsertmetastarLISIRD{APACrefauthors}Woods, T\BPBIN., Chamberlin, P\BPBIC., Harder, J\BPBIW., Hock, R\BPBIA., Snow, M., Eparvier, F\BPBIG.\BDBLRichard, E\BPBIC. \APACrefYearMonthDay2019. \APACrefbtitleLISIRD (LASP Interactive Solar Irradiance Datacenter). LISIRD (LASP Interactive Solar Irradiance Datacenter). {APACrefURL} http://lasp.colorado.edu/lisird/ \PrintBackRefs\CurrentBib
- Wordsworth \BOthers. (\APACyear2015) \APACinsertmetastarWordsworth2015{APACrefauthors}Wordsworth, R\BPBID., Kerber, L., Pierrehumbert, R\BPBIT., Forget, F.\BCBL \BBA Head, J\BPBIW. \APACrefYearMonthDay2015. \BBOQ\APACrefatitleComparison of ”warm and wet” and ”cold and icy” scenarios for early Mars in a 3D climate model Comparison of ”warm and wet” and ”cold and icy” scenarios for early Mars in a 3D climate model.\BBCQ \APACjournalVolNumPagesJournal of Geophysical Research: Planets. {APACrefDOI} 10.1002/2015JE004787 \PrintBackRefs\CurrentBib
- Yung \BBA DeMore (\APACyear1998) \APACinsertmetastarYung1998{APACrefauthors}Yung, Y\BPBIL.\BCBT \BBA DeMore, W\BPBIB. \APACrefYear1998. \APACrefbtitlePhotochemistry of Planetary Atmospheres Photochemistry of Planetary Atmospheres. \APACaddressPublisherOxford University Press. \PrintBackRefs\CurrentBib
- Yung \BOthers. (\APACyear1989) \APACinsertmetastarYung1989{APACrefauthors}Yung, Y\BPBIL., Wen, J\BHBIS., Moses, J\BPBII., Landry, B\BPBIM., Allen, M.\BCBL \BBA Hsu, K\BHBIJ. \APACrefYearMonthDay1989. \BBOQ\APACrefatitleHydrogen and deuterium loss from the terrestrial atmosphere: A quantitative assessment of nonthermal escape fluxes Hydrogen and deuterium loss from the terrestrial atmosphere: A quantitative assessment of nonthermal escape fluxes.\BBCQ \APACjournalVolNumPagesJournal of Geophysical Research94. \PrintBackRefs\CurrentBib
- Yung \BOthers. (\APACyear1988) \APACinsertmetastarYung1988{APACrefauthors}Yung, Y\BPBIL., Wen, J\BPBIS., Pinto, J\BPBIP., Allen, M., Pierce, K\BPBIK.\BCBL \BBA Paulson, S. \APACrefYearMonthDay1988. \BBOQ\APACrefatitleHDO in the Martian atmosphere: Implications for the abundance of crustal water HDO in the Martian atmosphere: Implications for the abundance of crustal water.\BBCQ \APACjournalVolNumPagesIcarus76. {APACrefDOI} 10.1016/0019-1035(88)90147-9 \PrintBackRefs\CurrentBib
- Zahnle \BOthers. (\APACyear2008) \APACinsertmetastarZahnle2008{APACrefauthors}Zahnle, K., Haberle, R\BPBIM., Catling, D\BPBIC.\BCBL \BBA Kasting, J\BPBIF. \APACrefYearMonthDay2008. \BBOQ\APACrefatitlePhotochemical instability of the ancient Martian atmosphere Photochemical instability of the ancient Martian atmosphere.\BBCQ \APACjournalVolNumPagesJournal of Geophysical Research E: Planets113. {APACrefDOI} 10.1029/2008JE003160 \PrintBackRefs\CurrentBib
- Zuber \BOthers. (\APACyear1998) \APACinsertmetastarZuber1998{APACrefauthors}Zuber, M\BPBIT., Smith, D\BPBIE., Solomon, S\BPBIC., Abshire, J\BPBIB., Afzal, R\BPBIS., Aharonson, O.\BDBLDuxbury, T\BPBIC. \APACrefYearMonthDay1998. \BBOQ\APACrefatitleObservations of the North Polar Region of Mars from the Mars Orbiter Laser Altimeter Observations of the North Polar Region of Mars from the Mars Orbiter Laser Altimeter.\BBCQ \APACjournalVolNumPagesScience282. {APACrefDOI} 10.1126/science.282.5396.2053 \PrintBackRefs\CurrentBib