Magnetoelastic interaction in the two-dimensional magnetic material MnPS3 studied by first principles calculations and Raman experiments
Abstract
We report experimental and theoretical studies on the magnetoelastic interactions in MnPS3. Raman scattering response measured as a function of temperature shows a blue shift of the Raman active modes at 120.2 and 155.1 cm-1, when the temperature is raised across the antiferromagnetic-paramagnetic transition. Density functional theory (DFT) calculations have been performed to estimate the effective exchange interactions and calculate the Raman active phonon modes. The calculations lead to the conclusion that the peculiar behavior with temperature of the two low energy phonon modes can be explained by the symmetry of their corresponding normal coordinates which involve the virtual modification of the super-exchange angles associated with the leading antiferromagnetic (AFM) interactions.
I Introduction
The research dedicated to the so called two-dimensional (2D) materials Geim and Grigorieva (2013) has been lately expanded to studies of a large class of layered magnetic materials and their ultrathin crystals Gibertini et al. (2019). This, to great extent, is stimulated by the search for novel effects in the magnetic ordering in the 2D limit and possible design of new devices which take advantage of the spin degree of freedom. Relevant research efforts are, in particular, being focused on antiferromagnetic transition-metal thiophosphates Mayorga-Martinez et al. (2017), with their representative example, the MnPS3 compound. Changes in the magnetic ordering are often traced with Raman scattering, a technique which appears to be especially well suited to study small size and ultrathin samples. The elementary excitations which are most often probed with Raman scattering are phonon excitations. Answering the question how and which phonon modes appear to be sensitive to the magnetic order is central for drawing conclusions on the applicability of Raman scattering methods to study magnetic phase transitions.
In this paper we present a first-principle study of magnetoelastic interaction in MnPS3 antiferromagnets and compare our theoretical expectations with the results of temperature dependent Raman scattering measurements performed on these crystals. The aim of our work is to identify the phonon modes which are sensitive to magnetic order and to enlighten the mechanism of the phonon-spin coupling that is at the origin of this sensitivity.
Experimentally, we confirm Kim et al. (2019) a robust sensitivity of the Raman active phonon mode at 155.1 cm-1 (at low temperatures) to the antiferromagnetic to paramagnetic transition in MnPS3 and clarify a similar property for the other, but weaker, phonon mode observed at 120.2 cm-1. These experimental observations are well accounted for by our theoretical calculations.
This paper is organized as follows. In Sections II we present the crystallographic structure of MnPS3 and the details of the Raman experiments. In Section III we discuss the methods that we used for the calculation of the effective exchange interactions and the phonons modes. In Sections IV we present and discuss our Raman experiments versus temperature and in Section V the results of our calculations. Section VI is devoted to the discussion and conclusion.
II Experimental details
II.1 MnPS3 structure
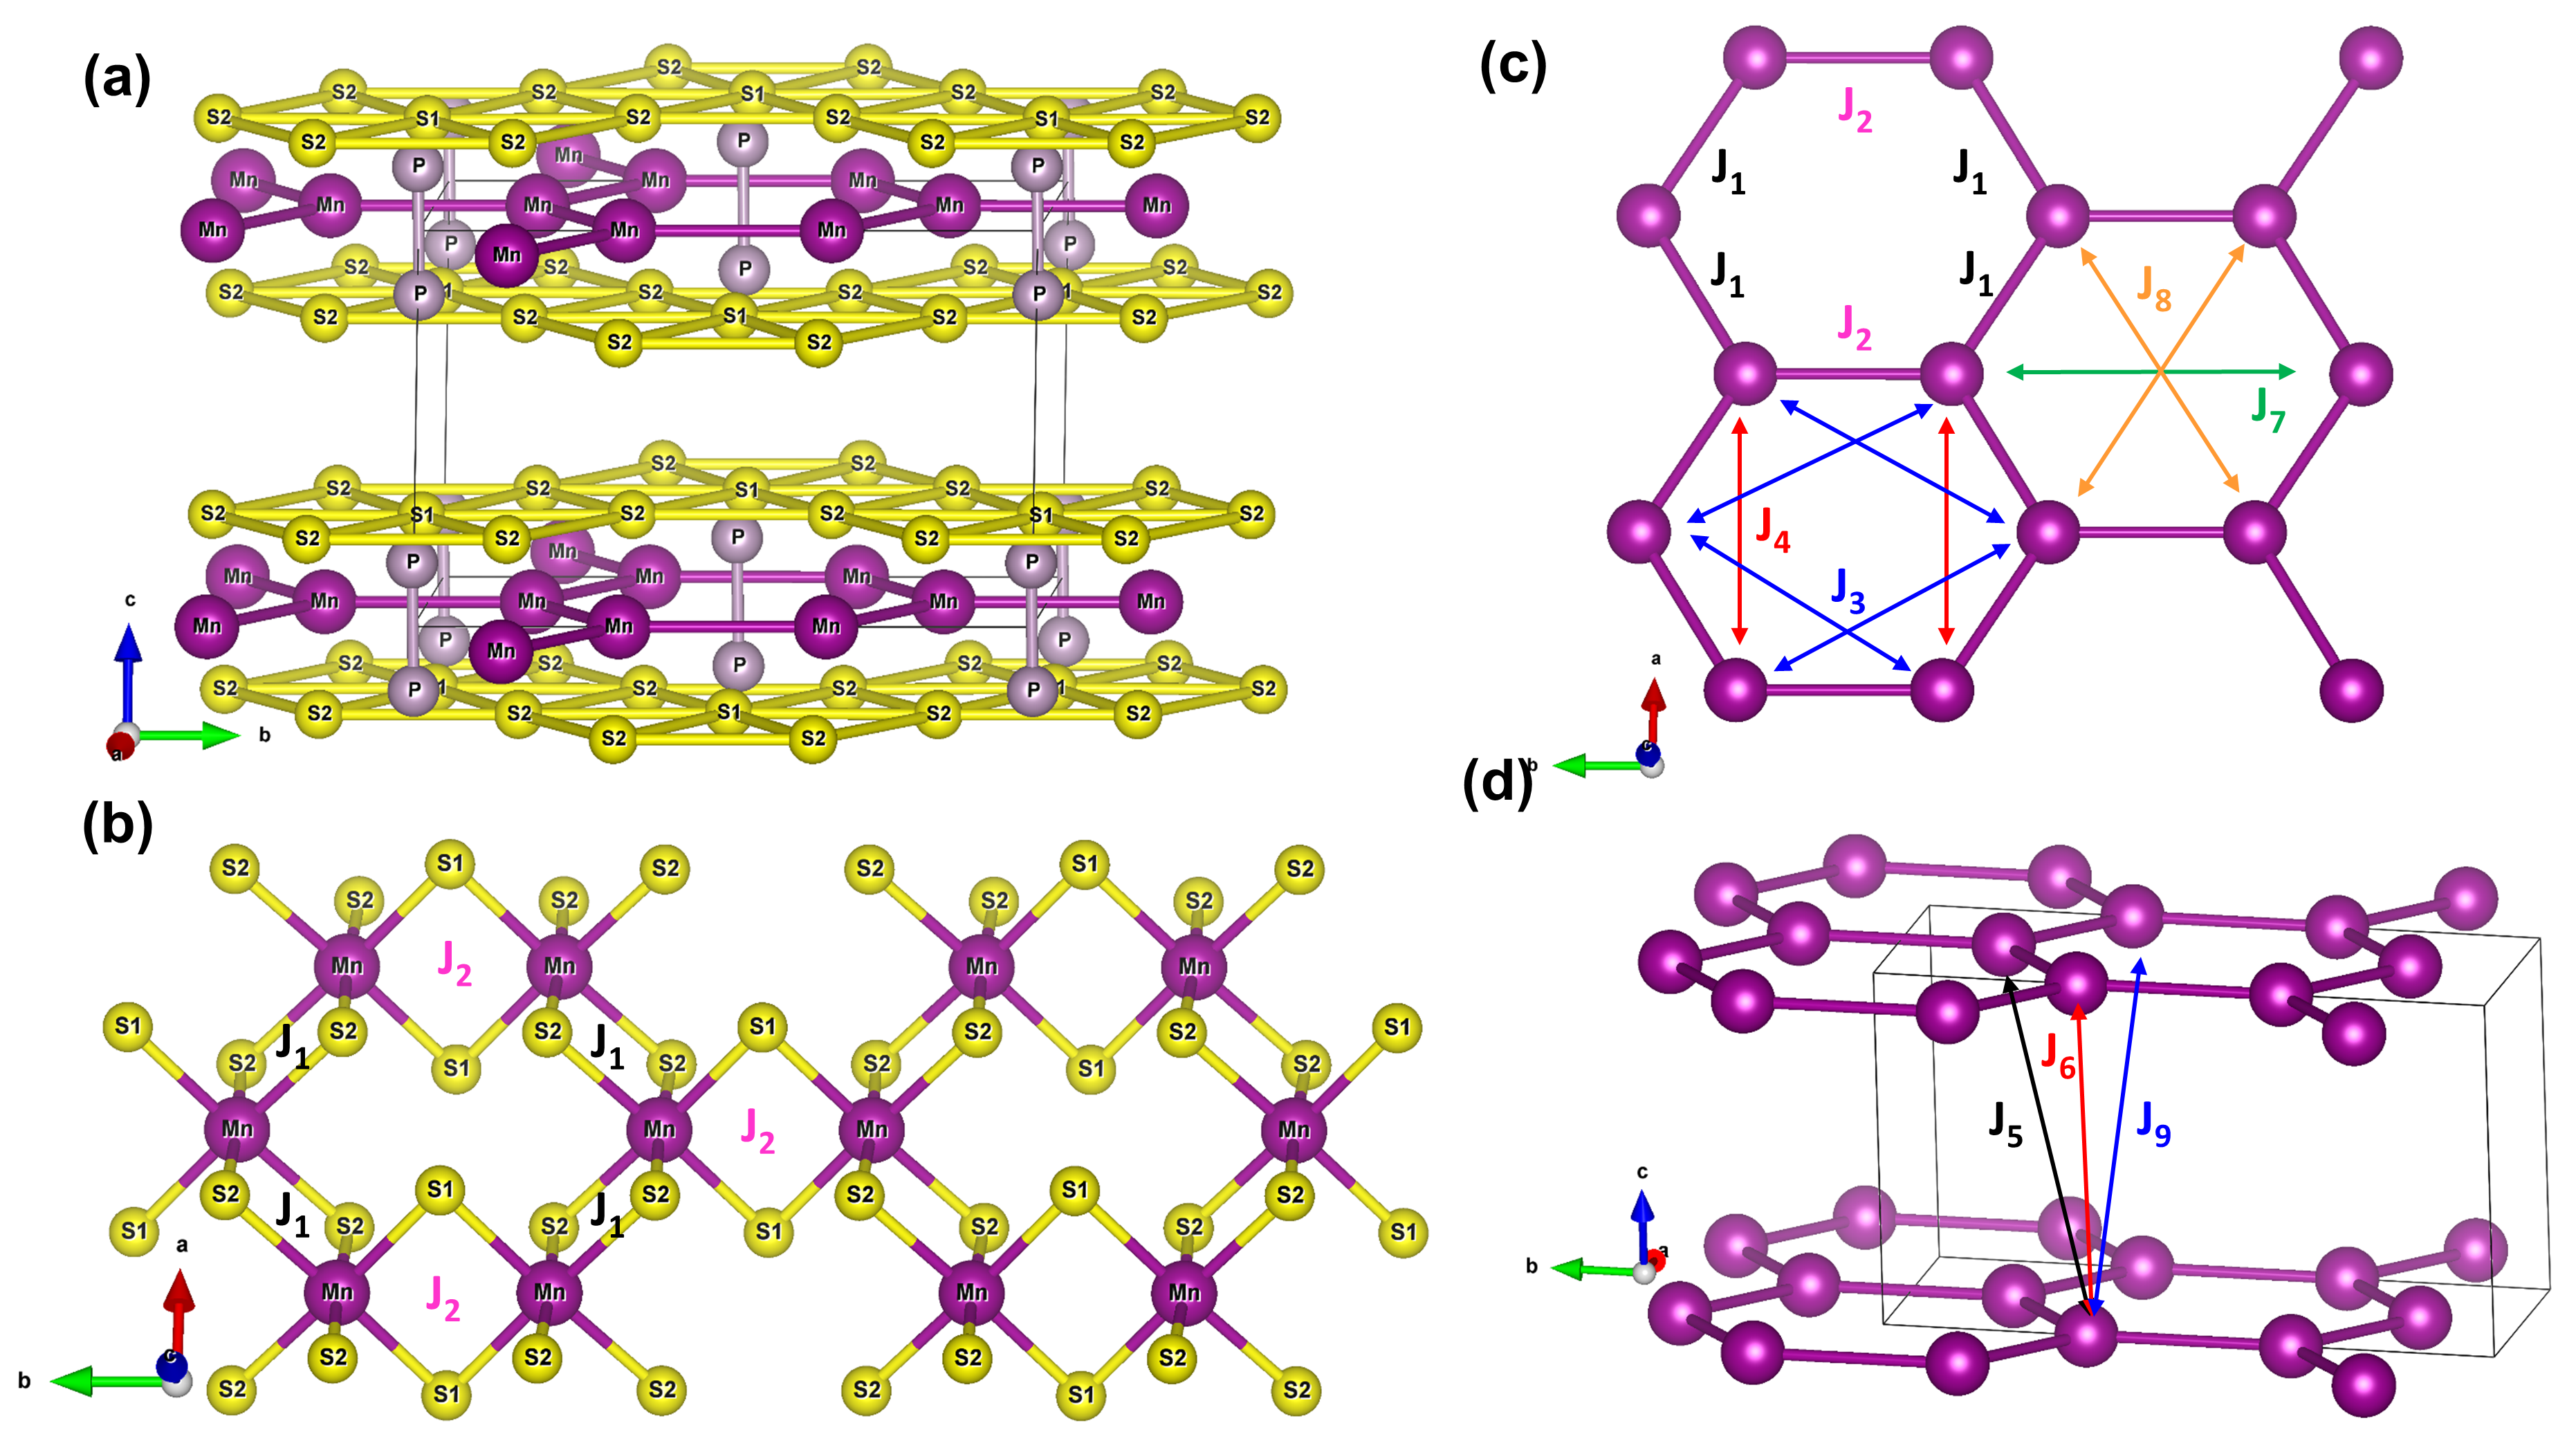
MnPS3 has a monoclinic structure, space group C2/m with lattice parameters = 6.077 Å, = 10.524 Å, = 6.796 Å, and Ouvrard et al. (1985). The atomic structure is shown in Figures 1(a) and (b). There are 4 MnPS3 units in the monoclinic C2/m unit cell, giving a total of 20 atoms. The C-centring means that the unit cell is not primitive because there are two equivalent positions, one at (0, 0 ,0) and the other at (1/2, 1/2, 0). A primitive triclinic unit cell containing 10 atoms and having the minimal volume can be constructed with, for example, Bravais lattice vectors , , and .
In the paramagnetic phase all the Mn and P atoms are equivalent by symmetry, while there are two kinds of S atoms. The corresponding Wyckoff positions of the C2/m cell are 4g, 4i, 4i, and 8j for the Mn, P, S1, and S2 atoms, respectively.
As can be seen in Fig. 1(a), MnPS3 is formed by the stacking along the axis of PS-Mn-PS sandwiches. The Mn atoms form a distorted honeycomb lattice and the S atoms two distorted triangular lattices. The P atoms can be described as forming P2 dimers penetrating the Mn hexagons (see Fig. 1(a)). Each Mn atom is octahedrally coordinated to six S atoms which can be associated to super-exchange paths between the Mn atoms (see Fig. 1(b) and the text below).
II.2 Raman scattering experiments
Raman scattering measurements were carried out on single crystals of manganese phosphorus trisulphide (MnPS3) using, as the excitation source, either a 515 nm line of a continuous wave laser diode or a 514.5 nm line of a continuous wave Ar+ laser. The crystals used for experiments were either home-made (see Ref. Wildes et al. (1998) for more details) or commercially available, both types of specimens displaying essentially identical spectra. In accordance to earlier studies Kim et al. (2019), the Raman scattering in our samples has been found to be particularly efficient when using the laser excitation wavelengths around 515 nm. The collected signal was dispersed through a 0.5 m monochromator and detected by a CCD camera.
The temperature dependent Raman scattering response was measured at zero magnetic field with the aid of a continuous flow cryostat mounted on x-y motorized positioners. The sample was placed on a cold finger of the cryostat. The excitation light was focused by means of a 50x long-working distance objective with a 0.5 numerical aperture producing a spot of about 1 m and the scattering signal was collected via the same objective.
Magneto-Raman scattering was measured in Faraday and Voigt configurations using an optical-fiber-based experimental setup. The sample was mounted on top of an x-y-z piezo-stage kept in gaseous helium at T= 4.2 K and inserted into a magnet. The excitation light was coupled to an optical fiber with a core of 5 m diameter and focused on the sample by an aspheric lens (spot diameter around 1 m). The signal was collected by the same lens, injected into a second optical fiber of 50 m diameter. In all experiments, the excitation power was kept below 100 W, to avoid the sample heating by the laser beam. Multiple test measurements of the power dependence of Raman scattering response have not shown any changes in the shape of spectra in the range of excitation powers up to 500 W.
III Calculation details
For the calculations we have used the Quantum Espresso Giannozzi et al. (2009) code based on density functional theory, Optimized Norm-Conserving Vanderbilt (ONCV) pseudopotentials and the PBE functional Perdew et al. (1996) with a plane-wave and charge-density cutoff of 90 Ry and 200 Ry, respectively. An electronic structure calculation with the experimental atomic parameters Ouvrard et al. (1985) and a PBE functional gives no gap for the ferromagnetic (FM) order and a gap of 1.30 eV for the experimentally observed AFM order to be compared with the experimentally reported gap of 2.96 eV Gnatchenko et al. (2011).
Including an on-site Hubbard on the Mn atoms using the simplified method developed by Cococcioni and de Gironcoli Cococcioni and de Gironcoli (2005) increases the AFM gap up to a saturation value of 2.60 eV when reaches 7 eV. The same dependence of the electronic gap with the value of has has been reported by other authors, who use either eV Chittari et al. (2016) or 5 eV Sivadas et al. (2015); Li et al. (2013). A value of eV (gap of 2.40 eV) has been used for the calculations of the effective exchange interactions and vibrational modes reported below.
The experimental lattice parameters and internal coordinates Gnatchenko et al. (2011) has been used to calculate the effective exchange interactions. As mentioned above, the non primitive 111 base centered monoclinic cell contains 20 atoms. Double monoclinic super-cells (112, 121, and 211) containing 40 atoms and 8 Mn have been used to be able to separate the different exchange interactions (see below). We have used a 842 Monkhorst-Pack Monkhorst and Pack (1976) grid for the first Brillouin zone sampling of the 40 atoms monoclinic 112 unit cell and adapted equivalent samplings of 824 and 444 for the 121 and 211 unit cells.
The phonon modes have been calculated in the primitive 10 atoms triclinic cell with the experimental lattice parameters but fully relaxed internal coordinates under the constraint of keeping the unit cell symmetry invariant. After relaxation, the calculation has been performed using the frozen phonon procedure with a 888 Monkhorst-Pack Monkhorst and Pack (1976) grid for the first Brillouin zone sampling.
IV Experimental results
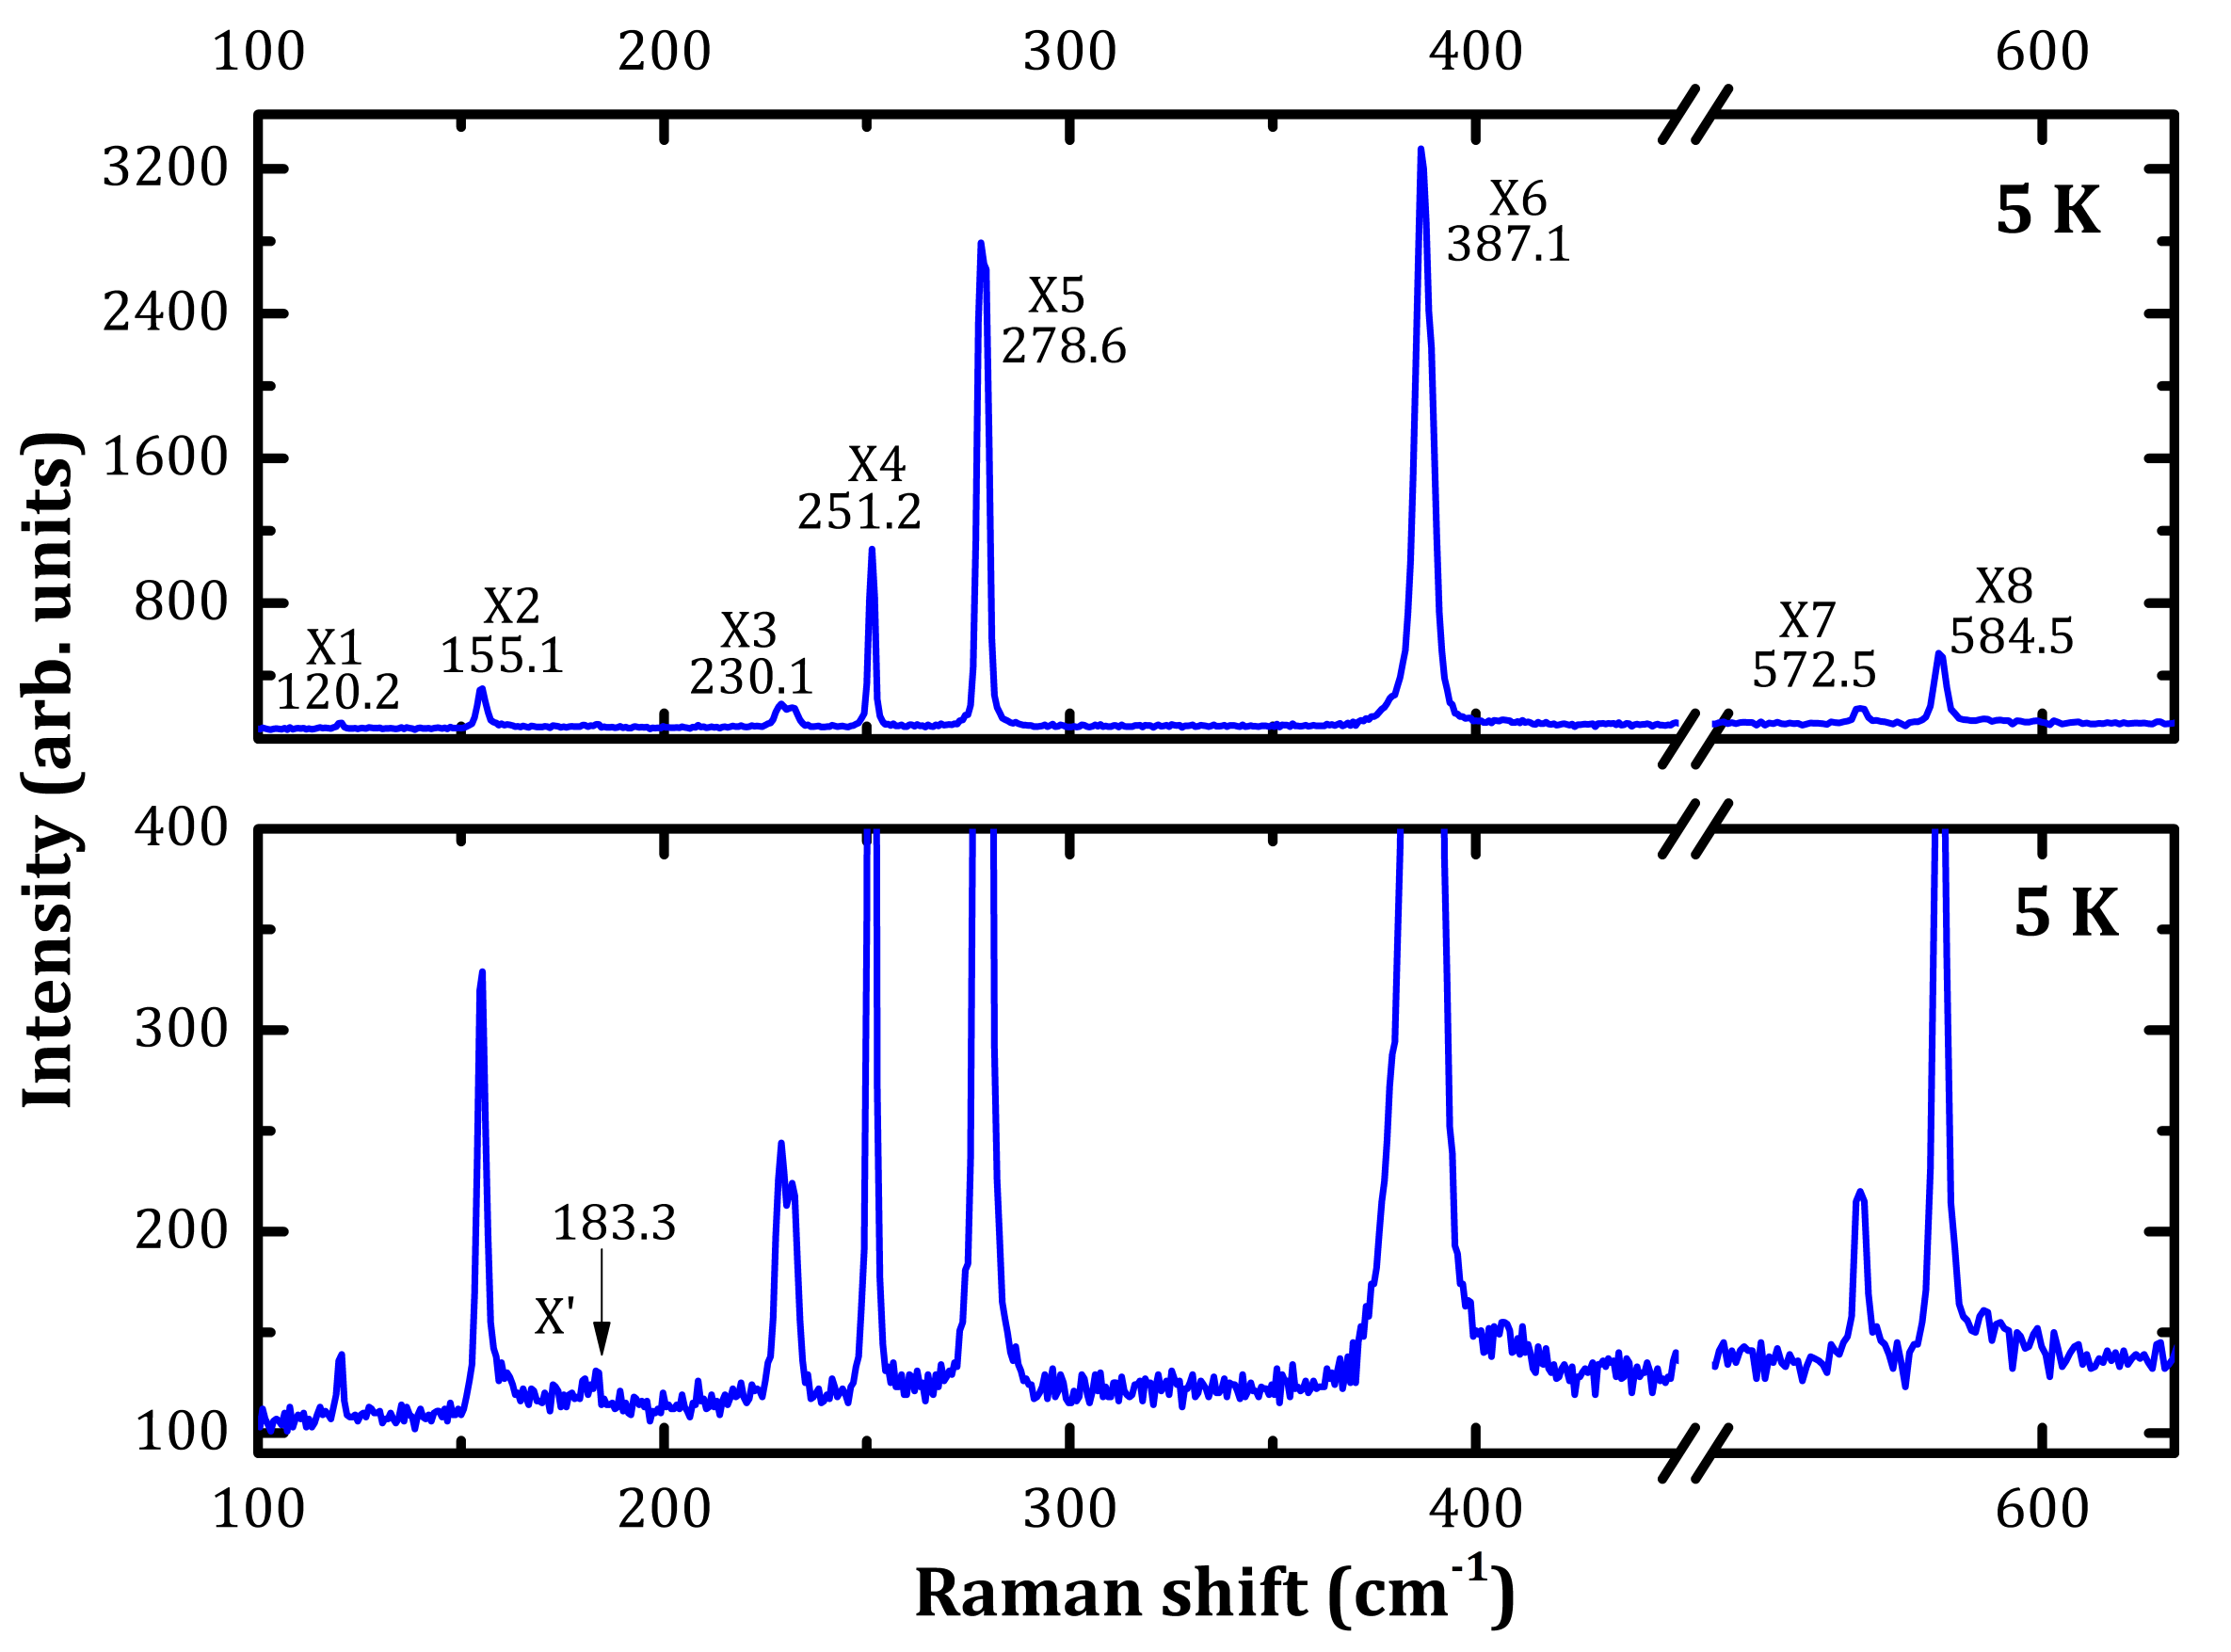
The representative Raman scattering spectra of our MnPS3 crystals, measured at low (5 K) temperature in the range of 100 to 650 cm-1 from the laser line, are presented in Fig. 2. A number of relatively sharp Raman scattering peaks, labeled X1 X8 are observed, in fair agreement with previously reported observations of the specific phonon modes in MnPS3 crystals Mathey et al. (1980); Bernasconi et al. (1988); Diaz Mesa et al. (2016); Kim et al. (2019); Sun et al. (2019).
The temperature evolution of all but the X1 and X2 peaks is rather smooth. Indeed, a conventional red shift and broadening of X3 X8 phonon modes is observed upon increase of temperature (see Supplementary Material Figures S1 and S2). In contrast, the X1 and X2 Raman scattering peaks appear to be sensitive to the magnetic ordering in our crystals. These peaks display a singular behavior around the expected, critical Néel temperature, = 78 K, for the antiferromagnetic to paramagnetic transition in MnPS3 compound Wildes et al. (2006). This is illustrated in Fig. 3.
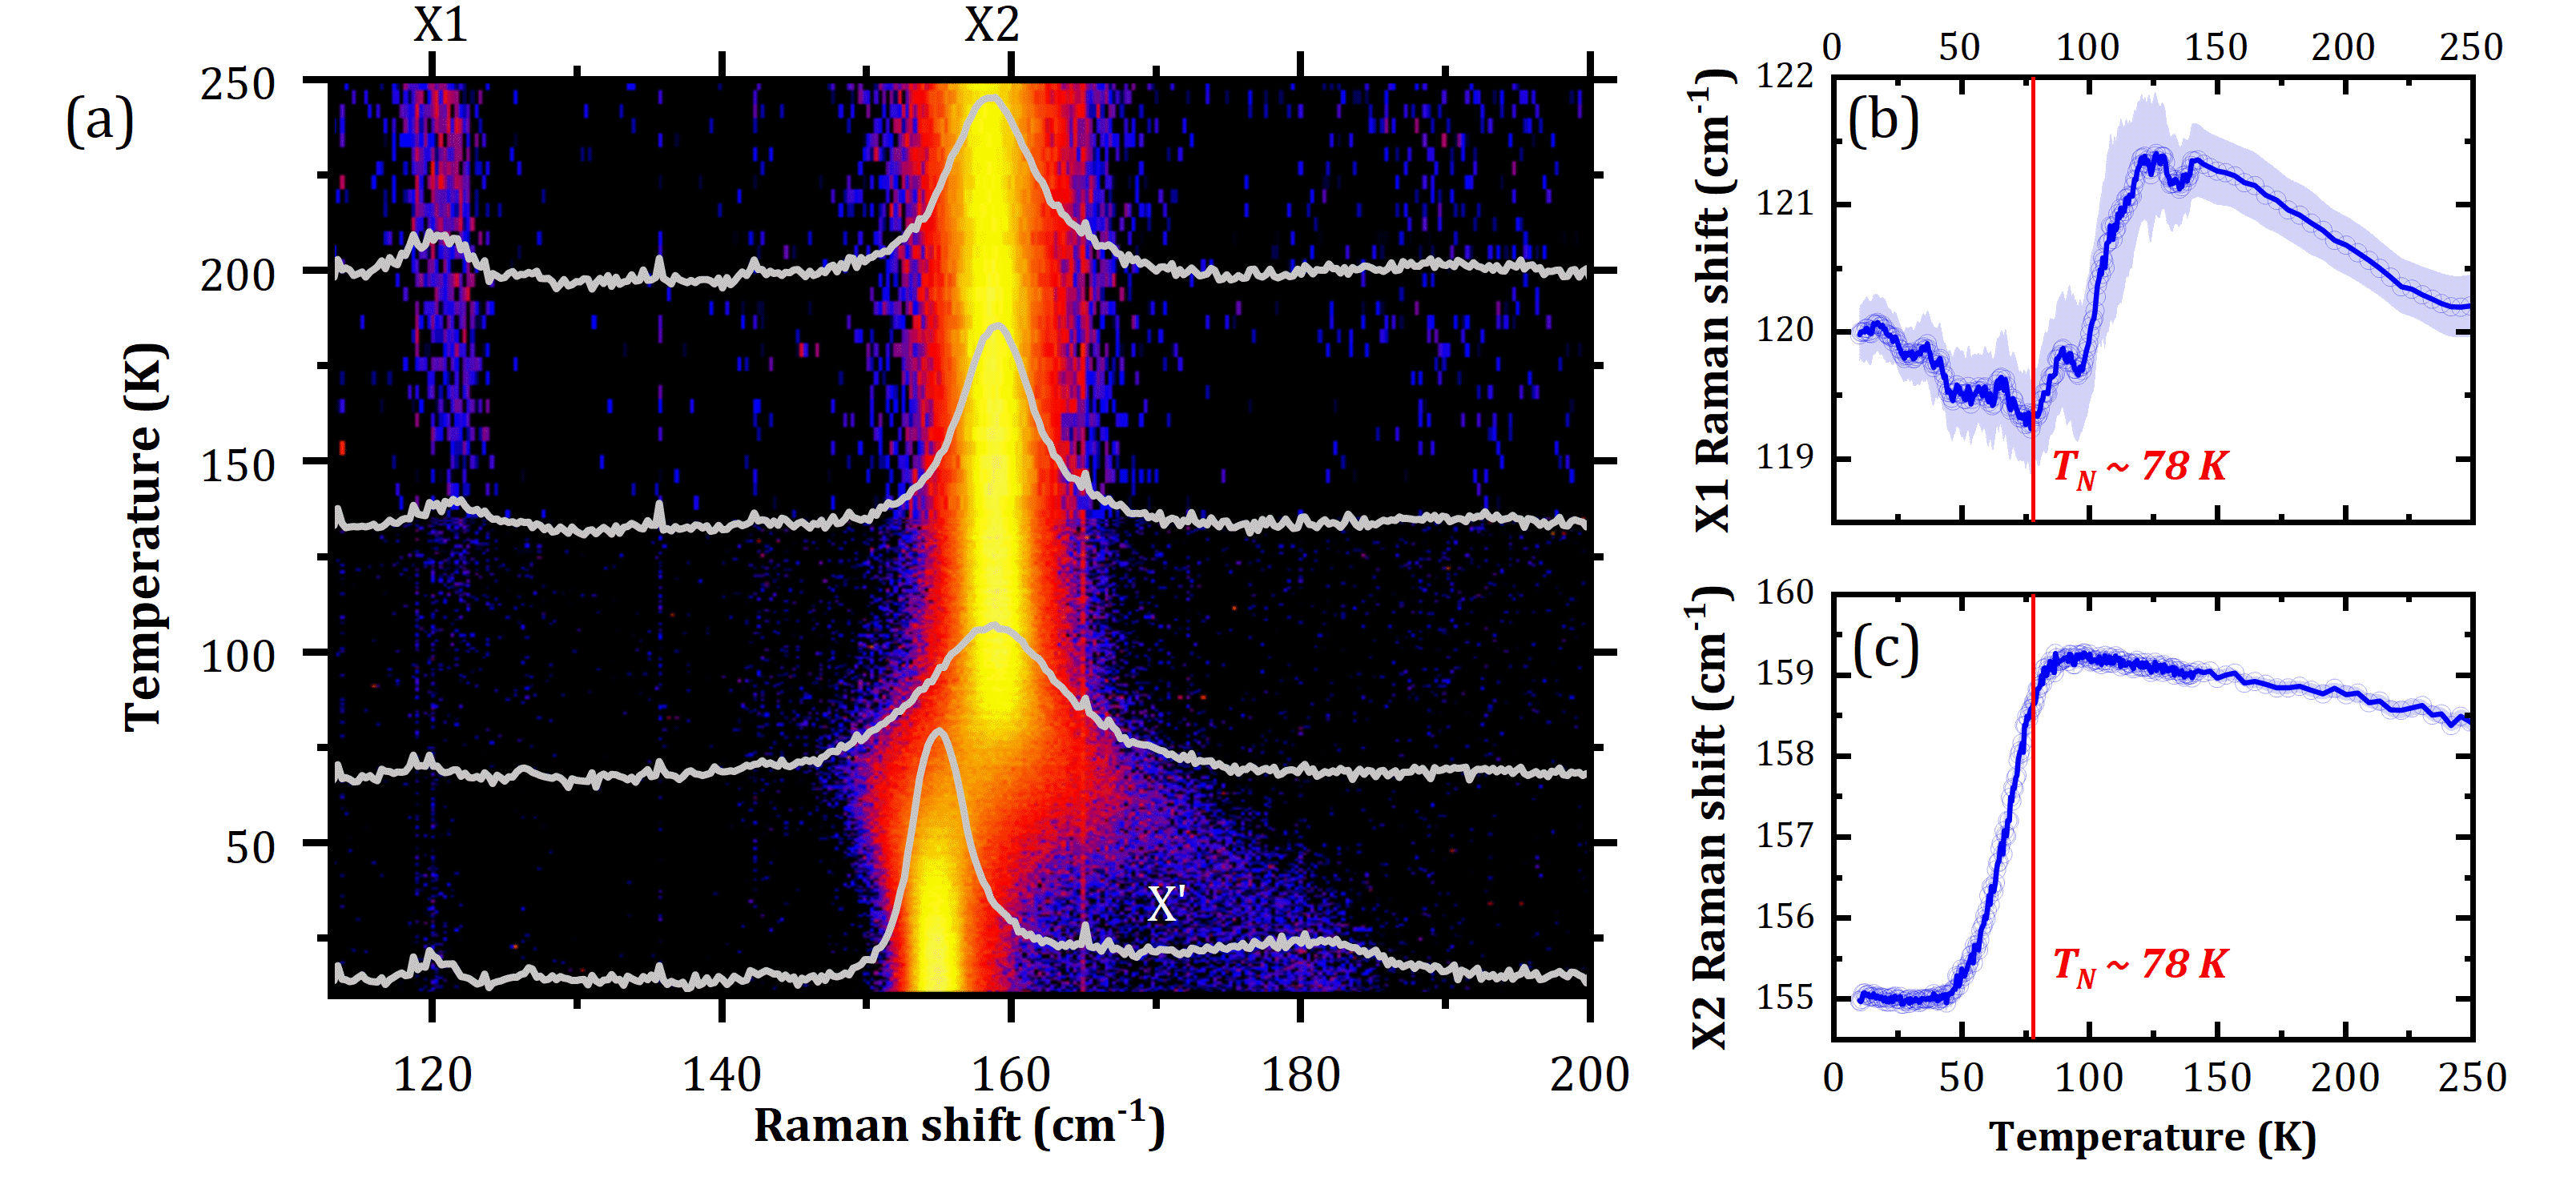
As can be seen, the center positions of the X1 and X2 Raman scattering peaks display an abrupt blue shift in close vicinity of . In agreement with previous reports Kim et al. (2019); Sun et al. (2019), the observed blue shift amounts 5 cm-1 in the case of the X2 mode and we report here a similar behavior but with a smaller blue shift of about 2 cm-1 for the X1 Raman scattering peak (see Fig. 3(b) and (c)). More details on temperature evolution of X1 and X2 peaks as well as of all other X3 X8 peaks are shown in the Supplementary Material’s Figures S1 to S3. Here we note that the X2 peak is relatively intense and well pronounced in the spectra measured in the whole temperature range, though it appears to be significantly broadened (by a factor of 4) around (the maximum in the X2 line-width is observed at temperature of 65 K, slightly below ). The X1 peak is relatively weak. It does not display any obvious broadening around but displays a relatively abrupt broadening (by a factor of 2) at T 110 K. The intensity of X1 peak initially weakens but significantly increases when temperature is raised above 100 K.
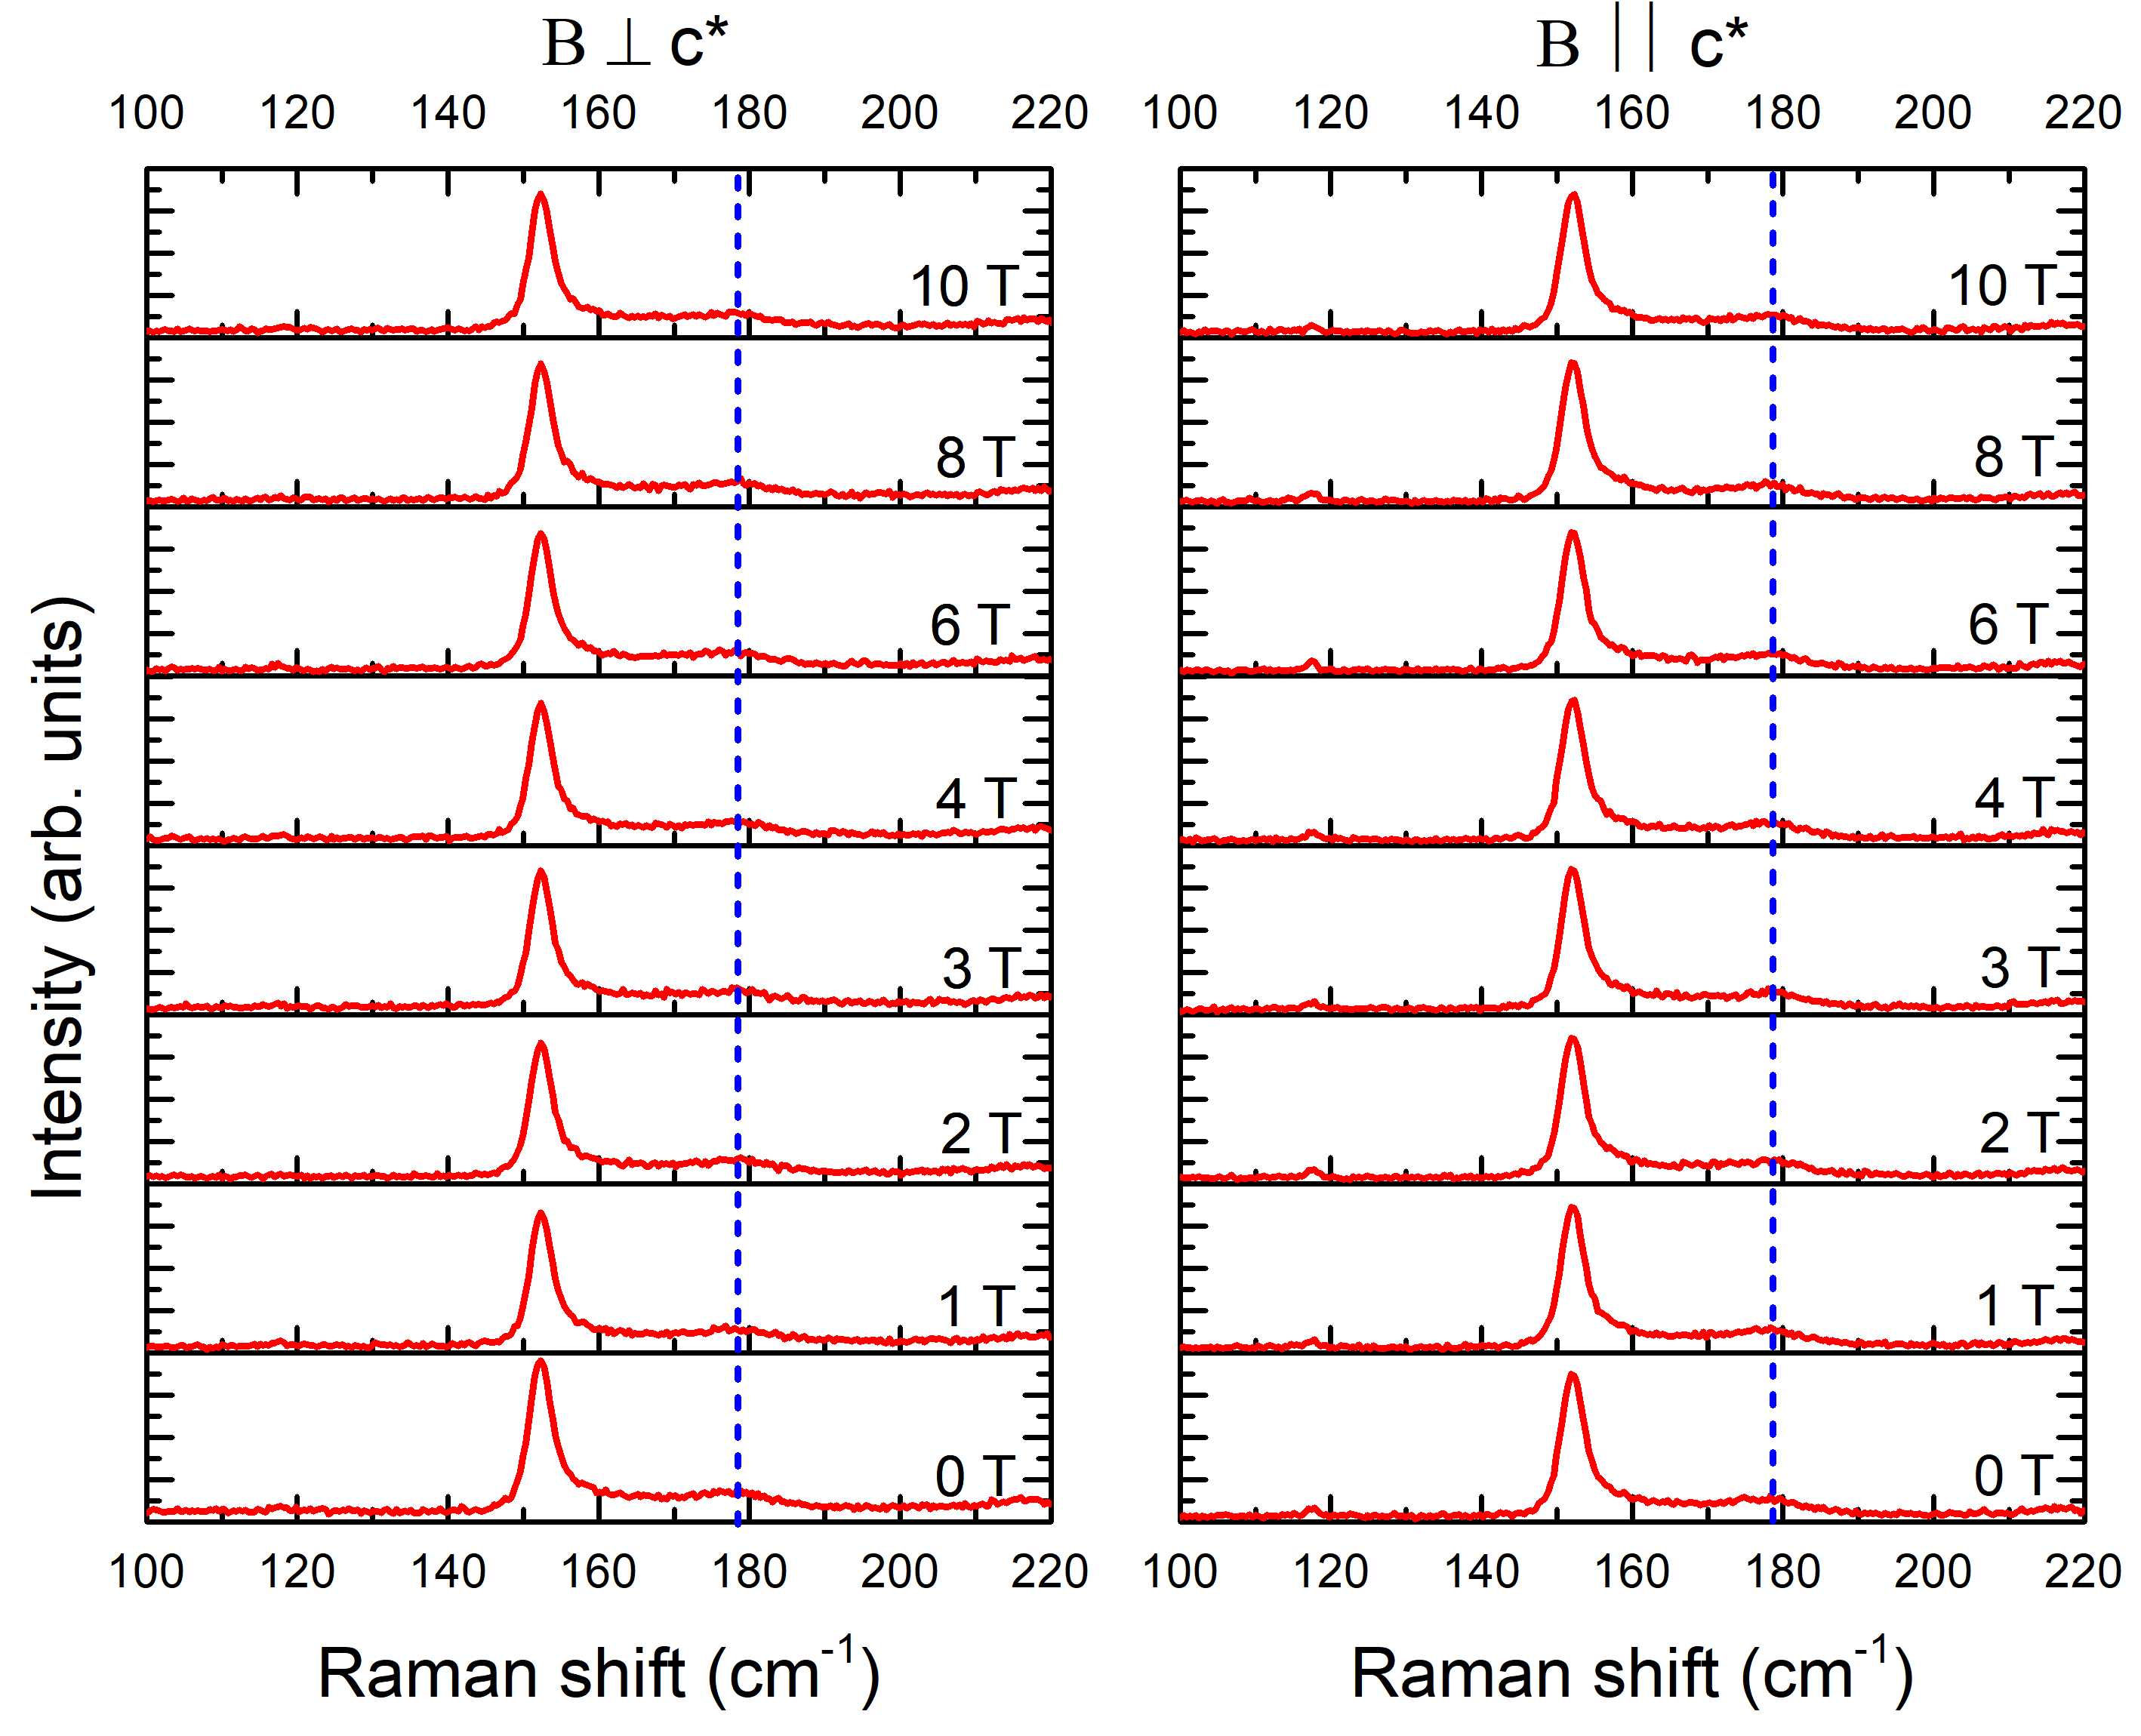
It is interesting to note that, as illustrated in Fig. 4, both X1 and X2 peaks are not sensitive to the applied magnetic field.
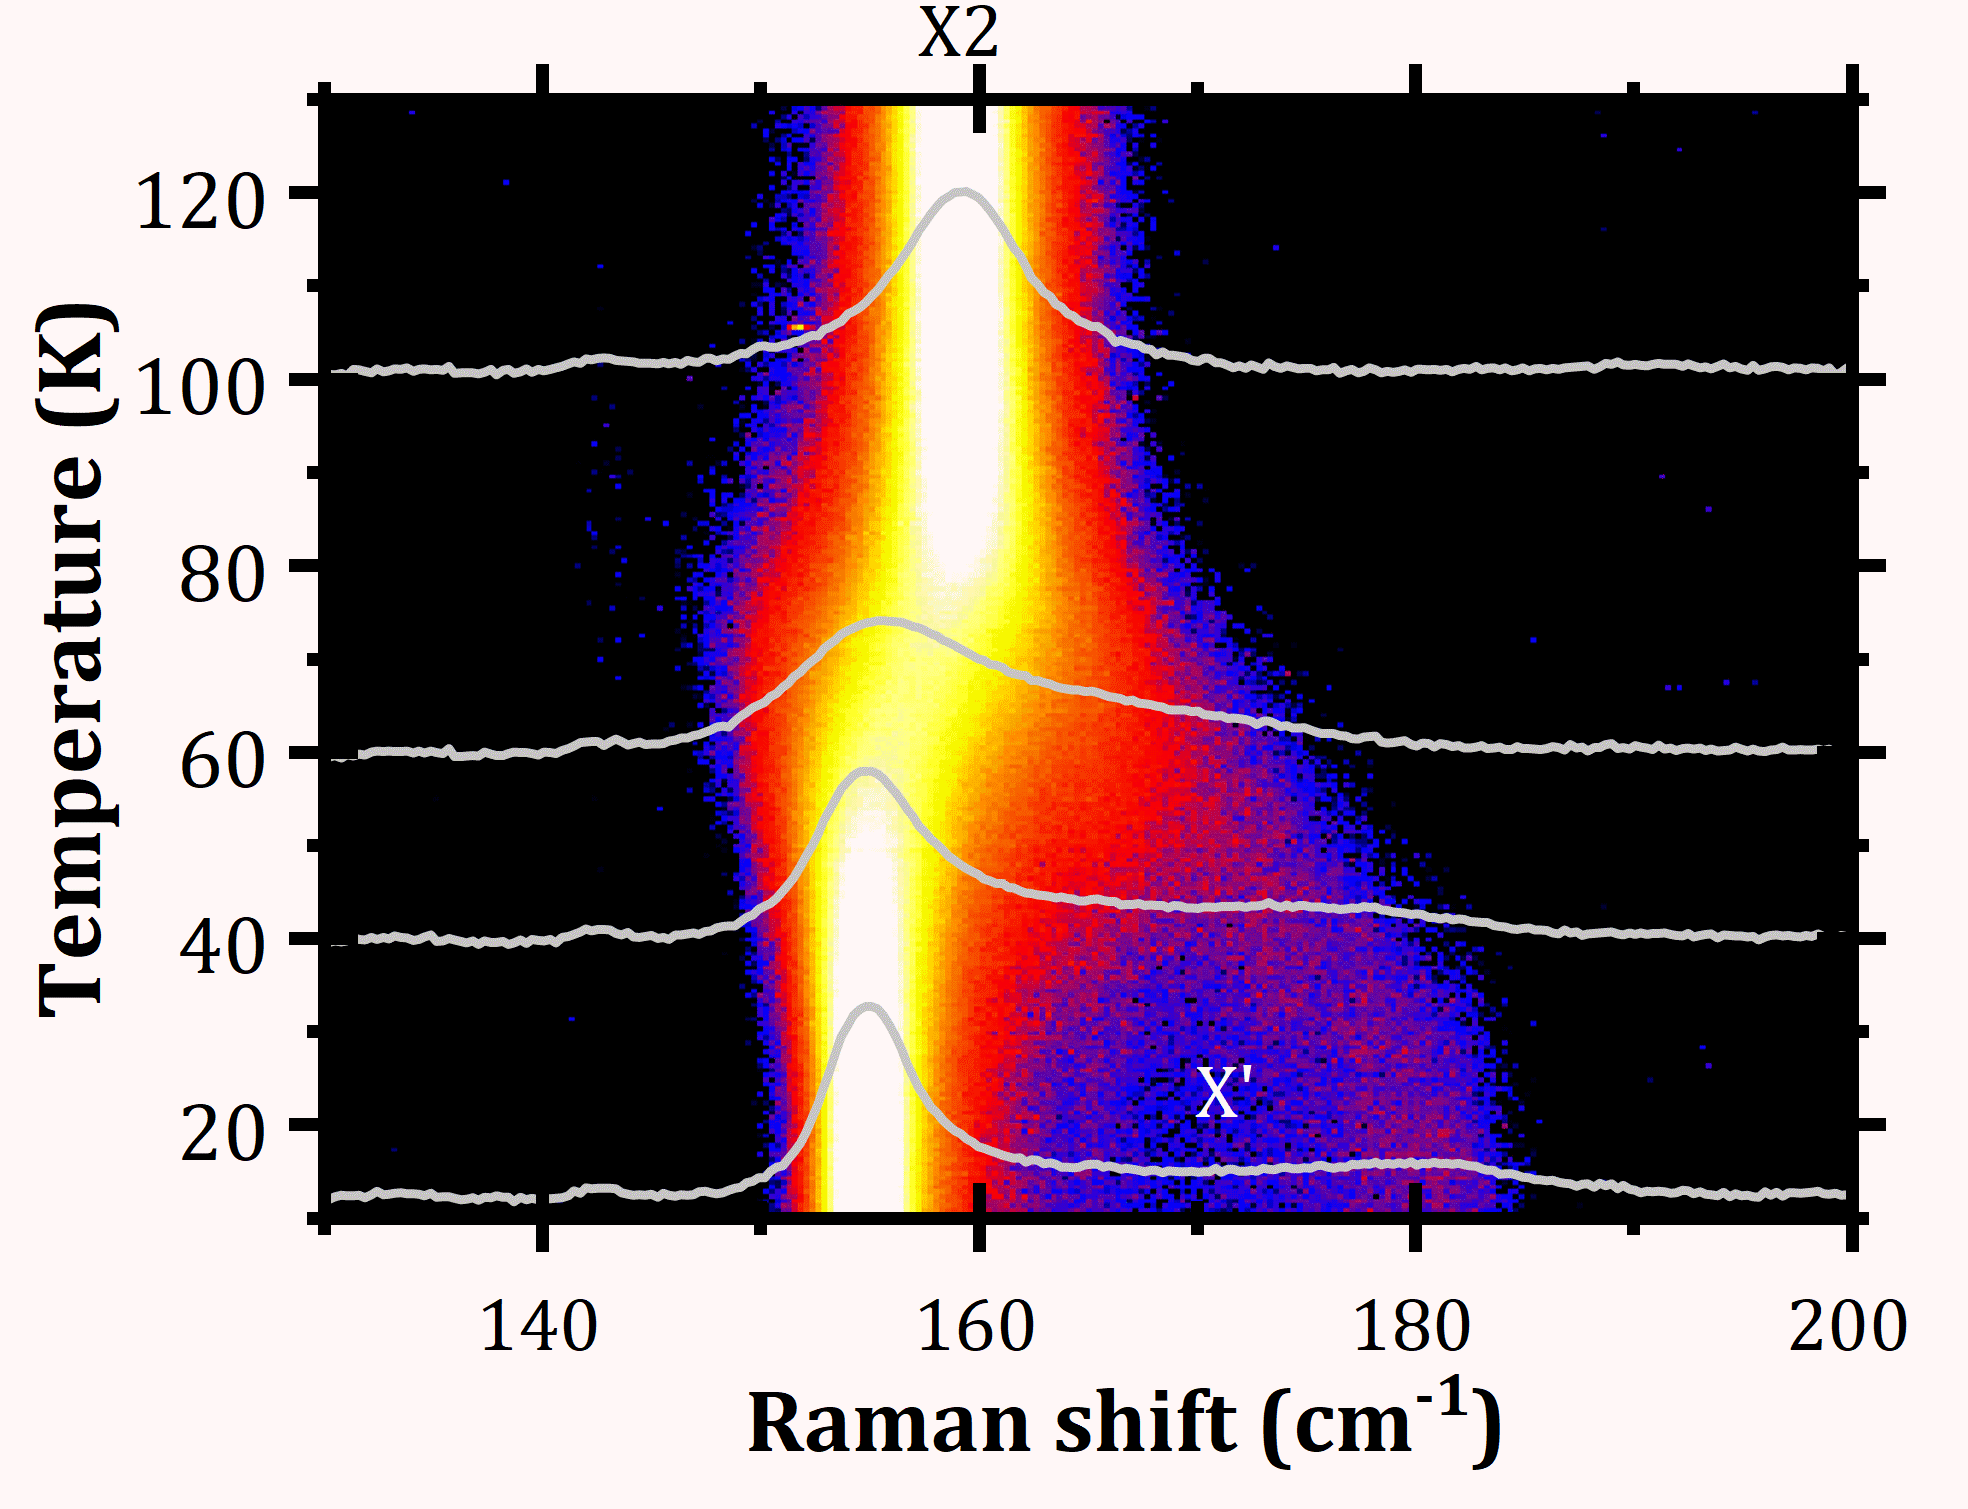
As already perceived in a recent work Kim et al. (2019) the low temperature Raman scattering spectra of MnPS3 crystals show an additional weak but intriguing feature at energies slightly above the X2 phonon peak. This additional feature marked as X’ in Fig. 2(b), might be seen as a continuous-like spectrum with a peak-like, high-energy onset around 183.3 cm-1 at low temperatures. A weak, Raman scattering feature centered at 185 cm-1 has been previously observed in MnPS3 compounds studied at room temperature Mathey et al. (1980), though it is not observed in our experiments. Instead, as shown in Fig. 5, our Raman scattering studies performed with longer accumulation time and fine temperature intervals, show that the X’ feature exhibits a characteristic narrowing effect (red shift of the high energy onset) upon the increase of temperature. It merges with the X2 phonon peak at temperatures around and it is not observed in the spectra measured above .
The X’ feature is likely of a magnetic origin, and the first guess would be that it is a due to a coupled phonon (X2)-spin-wave (magnon) excitation. Such coupling would be favored for spin-wave modes whose energy as measured by the spin gap in the magnon dispersion relation Wildes et al. (1998); Hicks et al. (2019) is only a few cm-1 ( 0.5 meV 4.03 cm-1). This is in contradiction to the rather large extension ( 20 cm-1) of the X’ feature as measured at low temperatures (see Fig. 5). The above hypothesis can also be ruled out by our experiments performed as a function of the magnetic field (see Fig. 4) in which we do not observe any magnetic-field-induced change in the form of the X’ feature. Very likely, and in accordance with the recent report Kim et al. (2019), the X’ feature is due to two-magnon excitations. Indeed, as deduced from neutron scattering studies Wildes et al. (1998) the (single) magnon excitations at the Brillouin zone boundary saturate at energies 11.5 meV 92 cm-1, thus the two-magnon density of states is expected to peak at around 184 cm-1, in accordance to the energy position of the onset of the X’ feature measured at low temperatures. Notably, the magnon dispersion in the long-wavevector limit, i.e., close to the zone-boundary, may persist in the paramagnetic phase (above ) but the Raman scattering response due to two-magnon excitations can be modified at the antiferromagnetic or paraferromagnetic phase transistion Fleury et al. (1967); Fleury (1969). Nevertheless, it remains surprising that our experiments do not show any trace of these two-magnon excitations at temperatures above Fleury et al. (1967); Fleury (1969).
V Calculation results
V.1 The magnetic Hamiltonian
To understand the possible link between the vibrational modes and the magnetic order in MnPS3 one needs to determine the model magnetic Hamiltonian of the interacting Mn2+ ions.
If one considers that these ions are in a 3 electronic configuration corresponding to a high spin (S = 5/2, L = 0) ground state Wildes et al. (2006), the effect of the spin-orbit coupling would be negligible Joy and Vasudevan (1992). The observation of a highly isotropic magnetic susceptibility above sustains this idea Okuda et al. (1986); Joy and Vasudevan (1992); Wildes et al. (1994, 1998); Goossens et al. (2000) and suggests that the effective exchange interactions between the magnetic centers are isotropic in nature.
Nevertheless, the AFM order below is anisotropic. It was first reported with the Mn spin moments pointing along the reciprocal lattice vector , i.e., perpendicular to the honeycomb lattice in the plane Kurosawa et al. (1983); Okuda et al. (1986); Wildes et al. (1994, 1998, 2006) but later on, a more careful analysis of the neutron diffraction data has shown a small tilt () of the Mn2+ magnetic moments with respect to Ressouche et al. (2010). Two posible energetic contributions can be proposed to explain the anisotropic order, the dipolar interactions between the magnetic moments or a single ion anisotropy arising from a non negligible spin-orbit coupling. Theoretical analysis Pich and Schwabl (1994, 1995a, 1995b); Goossens (2010) and recent magnon band measurements Hicks et al. (2019) suggest that the dipolar interaction would be the leading source of anisotropy responsible of the observed long-range order. While other experimental results (electron spin resonance Okuda et al. (1986); Cleary et al. (1986), critical behavior Wildes et al. (2006, 2007), and the observation of a non negligible orbital contribution to the total magnetic moment Kurosawa et al. (1983); Wildes et al. (1994)), support the idea that the single ion anisotropy is also playing an important role.
In conclusion the full magnetic Hamiltonian should contain a spin-independent contribution , a rotational invariant Heisenberg part , a dipolar term , and a single ion anisotropy contribution :
| (1) |
| (2) |
| (3) |
| (4) |
where are the magnetic couplings, and are the spin operators localized on the Mn atoms at site and , respectively, and the corresponding spin only magnetic moments, and the direction of the single ion easy axis. Notice that our Heisenberg interaction is defined as , similar to Le Flem et al le Flem (1982), Sivadas et al Sivadas et al. (2015), and Chittari et al Chittari et al. (2016), while other authors use Okuda et al. (1986); Joy and Vasudevan (1992); Wildes et al. (1994, 1998); Goossens et al. (2000).
V.2 Effective exchange interactions
The full analysis of the magnetic Hamiltonian will be discussed in a forthcoming paper. To understand the link between the vibrational and magnetic properties we will only focus here on the rotational invariant Heisenberg contribution .
We have classified the effective exchange interactions according to the Mn-Mn distances and we have calculated 9 different interactions up to interaction distances of 7.647 Å (see Table 1 and Figures 1(c) and (d)).
| d [Å] | Type | [K] | [K] | |
|---|---|---|---|---|
| 3.500 | intralayer | 12.9 | 19.2 le Flem (1982) 18.0 Okuda et al. (1986) 18.2 Joy and Vasudevan (1992) | |
| 3.523 | intralayer | 12.5 | 16.2 Joy and Vasudevan (1992) 17.9 Wildes et al. (1998) 18.3 Sivadas et al. (2015) | |
| 6.076 | intralayer | 0.6 | 1.6 Wildes et al. (1998) 0.9 Sivadas et al. (2015) | |
| 6.077 | intralayer | 0.1 | ||
| 6.791 | interlayer | 0.2 | -0.04 Wildes et al. (1998) | |
| 6.796 | interlayer | 0.5 | ||
| 7.000 | intralayer | 5.5 | 4.2 Wildes et al. (1998) 5.3 Sivadas et al. (2015) | |
| 7.025 | intralayer | 5.0 | ||
| 7.648 | interlayer | 0.1 |
It is important to note that the distinction made here between the six (three pairs) of intralayer interactions is a consequence of the small distortion of the 2D honeycomb lattice. Indeed, and can be associated to a single intralayer first neighbors interaction in an undistorted honeycomb lattice , and to a single second neighbors interaction , and and to a third neighbors interaction . Concerning the interlayer interactions, is the one strictly parallel to the axis that can be associated to the single interlayer interaction considered by other authors.
The calculations of the exchange interactions were performed using a broken-symmetry formalism, i.e., by mapping total energies corresponding to various collinear spin arrangements within a supercell onto a Heisenberg Hamiltonian Radtke et al. (2010); Saúl and Radtke (2011); Saúl et al. (2013); Saúl and Radtke (2014); Radtke et al. (2015); Saúl et al. (2018). Different supercells were needed to distinguish the exchange interactions between two different Mn atoms which are connected by translation symmetry. For example, the 40 atoms 211 unit cell, whose total energy can be written as :
neither allow the calculation of nor the separation of and ; and ; and and . Similar limitations arise with the 40 atoms 121 and 112 unit cells, whose total energies are :
and
The coefficients , , and depend on the spin arrangements of the Mn atoms. As every double supercell contains 8 Mn atoms there are a total of 256 distinct spin configurations. However, on taking crystal and spin reversal symmetries into account this number can be reduced to 22, 28, and 25 for the 211, 121, and 112 supercells respectively.
The application of a least-squares minimization procedure to the three supercells allows us to calculate the nine exchange interactions. A summary of the calculated values is shown in Table 1. There are four leading interactions (, , and ), which are all positive (AFM). They do not lead to frustration and they are compatible with the experimentally observed AFM order at low T Okuda et al. (1986). As mentioned above, for an undistorted lattice they would correspond to the intralayer interactions K, K, and K which are in good agreement with reported values in the literature.
The distinction between the exchange interactions due to the small distortion will be important in the analysis of the magnetoelastic interactions because the distortion splits the energy of some two-fold degenerate Raman modes.
V.3 Phonon modes
To understand the reasons of the peculiar dependence with temperature of some Raman modes presented in Section IV, the 30 phonon modes of MnPS3 have been calculated using the frozen phonon method in the 10 atoms primitive cell. The irreducible representations at the -point are , where only the 8 and 7 modes are Raman Active.
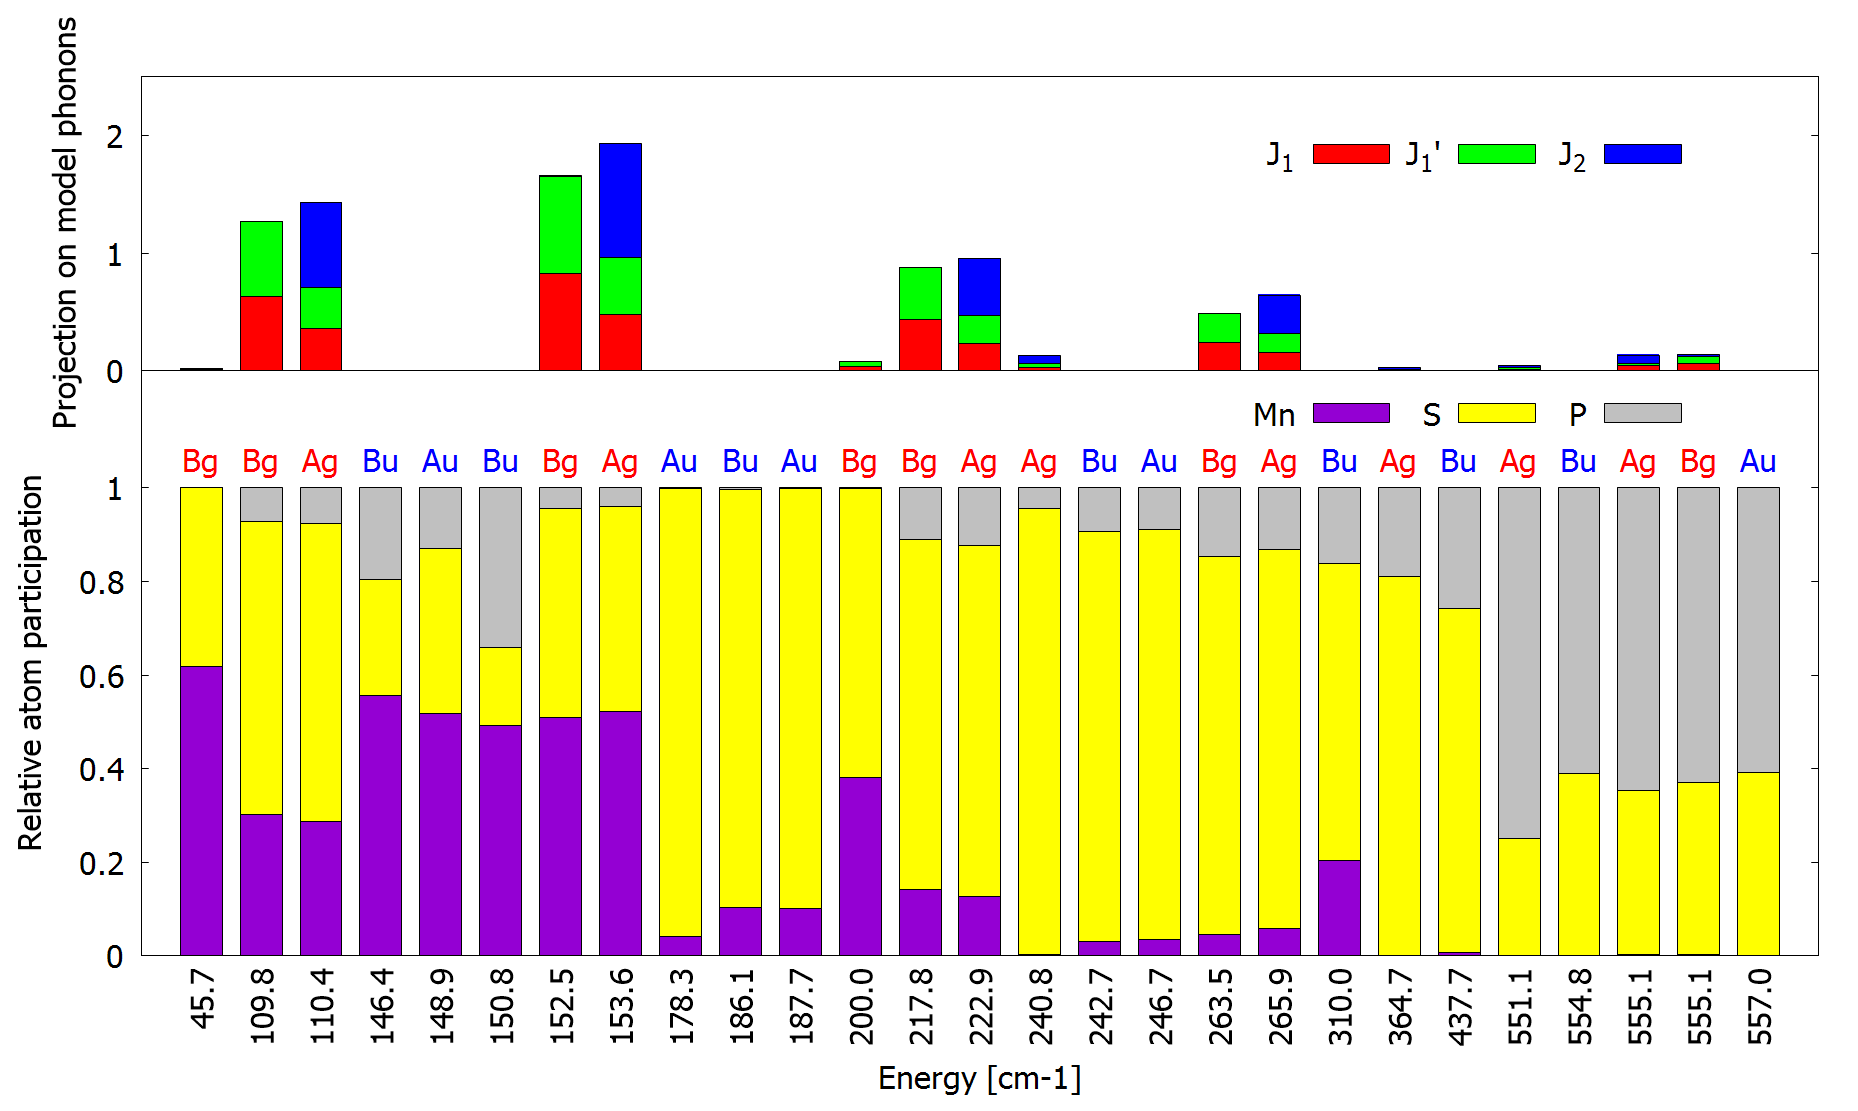
The calculated 27 optical phonon frequencies that span from 46 to 557 cm-1 are shown in Fig. 6. In the lower panel we show schematically the energy of the modes, their symmetry and the relative participation weight of the three atom’s types. For every mode, the corresponding bars are calculated with the normalized eigenvectors of the standard eigenvalue problem:
| (5) |
where , is the mass matrix, the Hessian of the potential energy, and the vector with the atomic displacements. As can be seen from the histogram, the high energy modes are mostly localized in the P and S atoms while the low energies ones concern vibrations of the Mn atoms (see Fig. 6).
The symmetry and energy of the calculated Raman active modes are also shown in Table 2. They compare reasonably well with several reported values obtained from previous calculations Bernasconi et al. (1988); Kim et al. (2019). As can be seen, the energies of some pairs of modes, separated by horizontal lines in Table 2, are almost equal because they would be double degenerate modes in a perfect honeycomb lattice. Experimentally, it is not always easy to resolve the splitting, even though the splitting has been sucessfully resolved on feature X3 in Fig. 2(b) (see also Supplementary Material Fig. S1).
| Calculations | Experiments | ||
| Symmetry | Energy (cm-1) | Energy (cm-1) | Feature |
| Bg | 45.7 | ||
| Bg | 109.8 | 120.2 | X1 |
| Ag | 110.4 | ||
| Bg | 152.5 | 155.1 | X2 |
| Ag | 153.6 | ||
| Bg | 200.0 | ||
| Bg | 217.8 | 228.1 | X3 |
| Ag | 222.9 | 231.9 | |
| Ag | 240.8 | 251.2 | X4 |
| Bg | 263.5 | 278.6 | X5 |
| Ag | 265.9 | ||
| Ag | 364.7 | 387.1 | X6 |
| Ag | 551.1 | 572.5 | X7 |
| Ag | 555.1 | 584.5 | X8 |
| Bg | 555.1 | ||
The correspondence between the experimental features X1 … X8 and the calculated Raman modes is also shown in Table 2. There is an overall good agreement between the corresponding energies, the discrepancy becoming slightly larger for the high energy modes. For the modes above 200 cm-1, the energy difference increases with energy giving rise to an overall difference of 5% for the majority of the modes while the deviation of the mode around 110 cm-1 corresponds to a larger relative difference of about 9%. These relative deviations of about 5 to 10% are frequently found when comparing state-of-the-art DFT calculations with experimental measurements. It is important to note here that the approximations used in our calculations have been chosen to have a good overall description of the magnetic, electronic and structural properties of the system. A different choice of the DFT input parameters (pseudopotentials, Hubbard Hamiltonian, functional), may slightly change the calculated phonon energies and/or the distribution of deviations between the theoretical and experimental energies of different modes. The two calculated modes with irreducible representation Bg around 46 and 200 cm-1 are not visible in the experimental spectra.
VI Discussion and summary
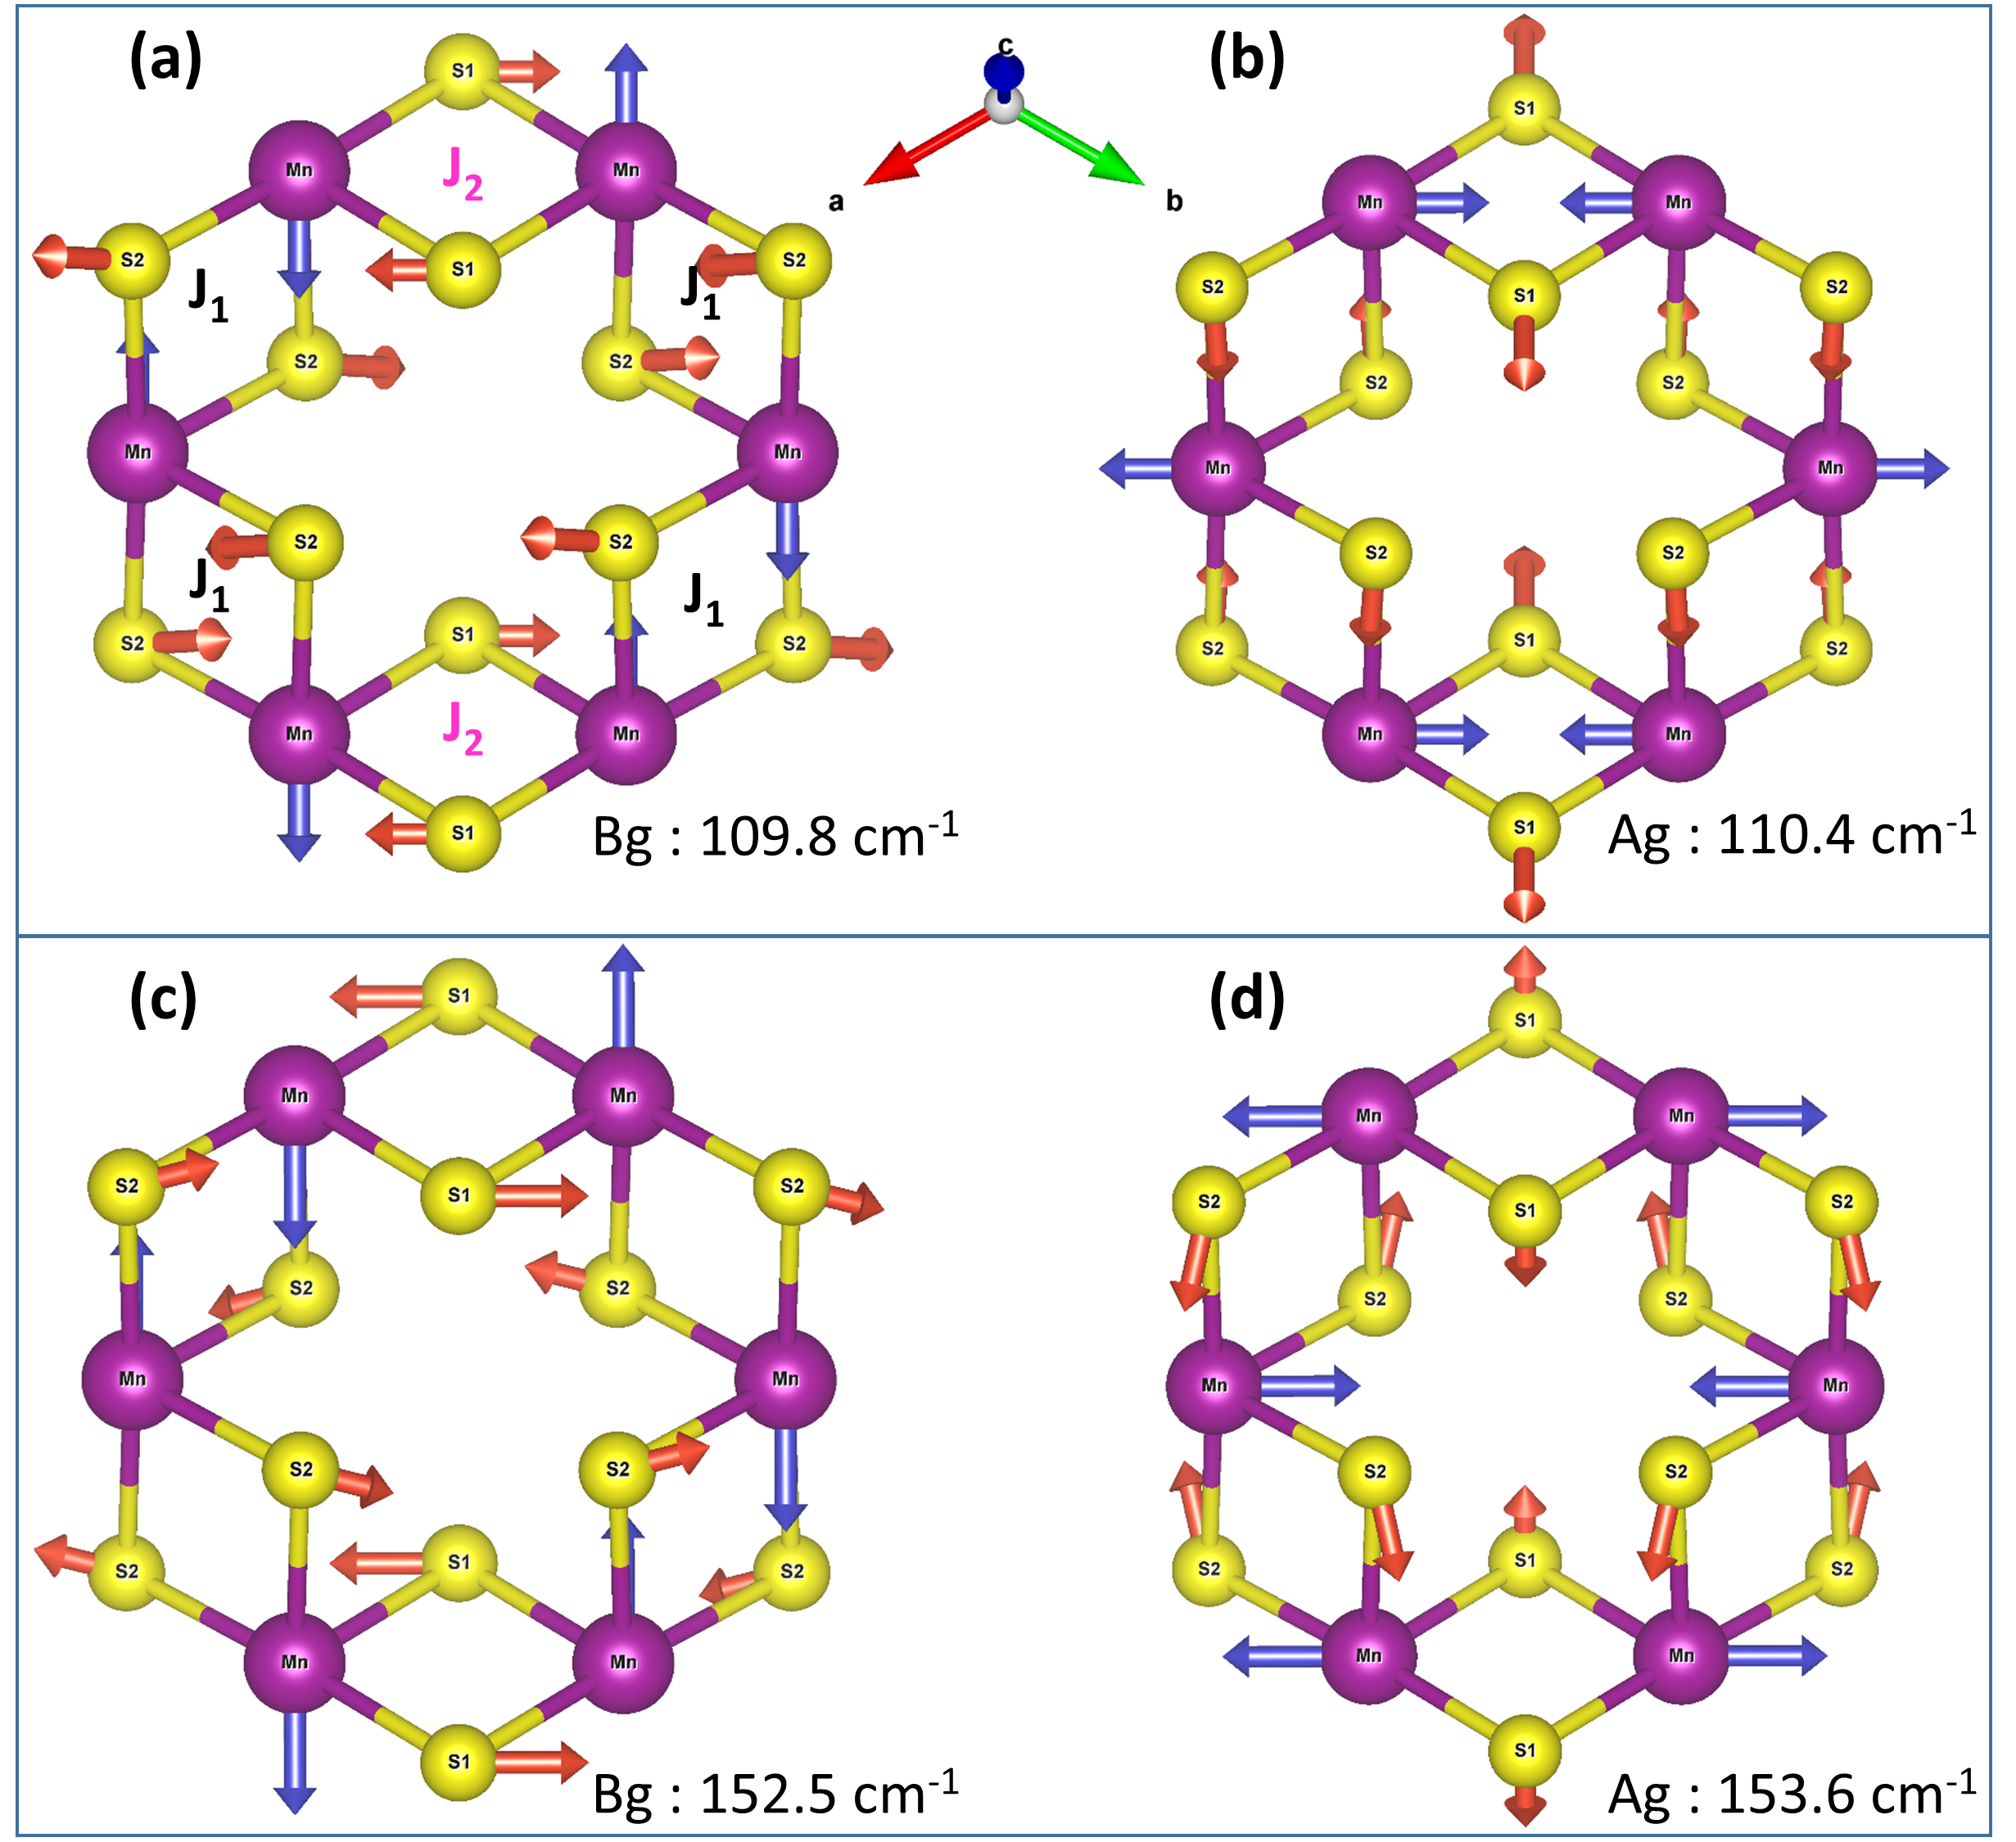
The two Raman modes whose frequencies increase when crossing the Néel temperature at about 120 (X1) and 155 cm-1 (X2) are associated to the two pairs of calculated Raman active modes at 109.8 (Bg) and 110.4 (Ag) for X1 and 152.5 (Bg) and 153.6 cm-1 (Ag) for X2 (see Table 2). As mentioned above, these two pairs of almost degenerate modes are split in energy due to the small distortion of the honeycomb and triangular lattices. For every pair, the eigenvectors of these almost degenerate modes have very similar weights in the Mn, S, and P atoms (see lower panel in Fig. 6) and the relative displacements of the Mn and S atoms for the four modes is shown in Fig. 7.
If we consider the six Mn atoms forming the hexagons in the honeycomb lattice as six consecutive Mn pairs. The effective exchange interactions of the pairs are either the first or the second neighbors intralayer interactions and respectively. These AFM interactions, which participate to stabilize the Néel AFM order at low temperature, can be associated to superexchange paths between the Mn atoms through the S atoms (see Fig. 1(b)).
One can imagine that the modification with temperature of these superexchange paths can be the mechanism at the origin of the magnetoelastic interactions responsible for the temperature dependence of the X1 and X2 modes. Above , due the thermal excitations, the spins localized in some Mn pairs would orient parallel to each other. As the interaction is AFM, the system would try to decrease the superexchange angle in order to decrease the interaction. The slight modification of the angles would explain the energy change of the Raman modes.
In order to visualize this effect, we have considered three virtual phonon modes : each one affecting the superexchange angle associated to two opposite exchange interactions (see Supplementary Information’s Fig. S4). The upper panel in Fig. 6 shows the projections of the 27 optical modes on the three virtual phonons. The projections are siginificative for four pairs of Raman active modes and clearly larger for the two pairs of modes asscociated to peaks X1 and X2.
In conclusion, we have presented a comprehensive picture which largely accounts for the observed sensitivity of the particular phonon modes to the magnetic ordering in layered MnPS3 antiferromagnet. More specifically, we have identified, both in the experiment and theory, that there are essentially two, phonon modes of MnPS3 which appear at 120.2 cm-1 and 155.1 cm-1 in the low temperature Raman scattering spectra, and which show a pronounced change in the vicinity of the critical Néel temperature. The present approach can be extended to other magnetic materials including their thin layers, in reference to tracing the magnetic properties with Raman scattering response due two phonon excitations.
Acknowledgements.
The work has been supported by the EU Graphene Flagship project, the ATOMOPTO project (TEAM programme of the Foundation for Polish Science, co-financed by the EU within the ERDFund)References
- Geim and Grigorieva (2013) A. K. Geim and I. V. Grigorieva, Nature 499, 419 (2013).
- Gibertini et al. (2019) M. Gibertini, M. Koperski, A. F. Morpurgo, and K. S. Novoselov, Nature Nanotechnology 14, 408 (2019).
- Mayorga-Martinez et al. (2017) C. C. Mayorga-Martinez, Z. Sofer, D. Sedmidubský, Š. Huber, A. Y. S. Eng, and M. Pumera, ACS Applied Materials & Interfaces 9, 12563 (2017).
- Kim et al. (2019) K. Kim, S. Y. Lim, J. Kim, J.-U. Lee, S. Lee, P. Kim, K. Park, S. Son, C.-H. Park, J.-G. Park, and H. Cheong, 2D Materials 6, 041001 (2019).
- Momma and Izumi (2011) K. Momma and F. Izumi, Journal of Applied Crystallography 44, 1272 (2011).
- Ouvrard et al. (1985) G. Ouvrard, R. Brec, and J. Rouxel, Materials Research Bulletin 20, 1181 (1985).
- Wildes et al. (1998) A. R. Wildes, B. Roessli, B. Lebech, and K. W. Godfrey, Journal of Physics: Condensed Matter 10, 6417 (1998).
- Giannozzi et al. (2009) P. Giannozzi, S. Baroni, N. Bonini, M. Calandra, R. Car, C. Cavazzoni, D. Ceresoli, G. L. Chiarotti, M. Cococcioni, I. Dabo, A. Dal Corso, S. de Gironcoli, S. Fabris, G. Fratesi, R. Gebauer, U. Gerstmann, C. Gougoussis, A. Kokalj, M. Lazzeri, L. Martin-Samos, N. Marzari, F. Mauri, R. Mazzarello, S. Paolini, A. Pasquarello, L. Paulatto, C. Sbraccia, S. Scandolo, G. Sclauzero, A. P. Seitsonen, A. Smogunov, P. Umari, and R. M. Wentzcovitch, J. Phys. Condens. Matter 21, 395502 (2009).
- Perdew et al. (1996) J. P. Perdew, K. Burke, and M. Ernzerhof, Phys. Rev. Lett. 77, 3865 (1996).
- Gnatchenko et al. (2011) S. L. Gnatchenko, I. S. Kachur, V. G. Piryatinskaya, Y. M. Vysochanskii, and M. I. Gurzan, Low Temperature Physics 37, 144 (2011).
- Cococcioni and de Gironcoli (2005) M. Cococcioni and S. de Gironcoli, Phys. Rev. B 71, 035105 (2005).
- Chittari et al. (2016) B. L. Chittari, Y. Park, D. Lee, M. Han, A. H. MacDonald, E. Hwang, and J. Jung, Physical Review B 94, 184428 (2016).
- Sivadas et al. (2015) N. Sivadas, M. W. Daniels, R. H. Swendsen, S. Okamoto, and D. Xiao, Physical Review B 91, 235425 (2015).
- Li et al. (2013) X. Li, T. Cao, Q. Niu, J. Shi, and J. Feng, Proceedings of the National Academy of Sciences 110, 3738 (2013).
- Monkhorst and Pack (1976) H. J. Monkhorst and J. D. Pack, Phys. Rev. B 13, 5188 (1976).
- Mathey et al. (1980) Y. Mathey, R. Clement, C. Sourisseau, and G. Lucazeau, Inorganic Chemistry 19, 2773 (1980).
- Bernasconi et al. (1988) M. Bernasconi, G. L. Marra, G. Benedek, L. Miglio, M. Jouanne, C. Julien, M. Scagliotti, and M. Balkanski, Physical Review B 38, 12089 (1988).
- Diaz Mesa et al. (2016) I. M. Diaz Mesa, P. J. Foot, and R. A. Kresinski, Materials Research Bulletin 84, 403 (2016).
- Sun et al. (2019) Y. J. Sun, Q. H. Tan, X. L. Liu, Y. F. Gao, and J. Zhang, Journal of Physical Chemistry Letters 10, 3087 (2019).
- Wildes et al. (2006) A. R. Wildes, H. M. Rønnow, B. Roessli, M. J. Harris, and K. W. Godfrey, Physical Review B 74, 094422 (2006).
- Hicks et al. (2019) T. Hicks, T. Keller, and A. Wildes, Journal of Magnetism and Magnetic Materials 474, 512 (2019).
- Fleury et al. (1967) P. A. Fleury, S. P. S. Porto, and R. Loudon, Physical Review Letters 18, 658 (1967).
- Fleury (1969) P. A. Fleury, Physical Review 180, 591 (1969).
- Joy and Vasudevan (1992) P. A. Joy and S. Vasudevan, Physical Review B 46, 5425 (1992).
- Okuda et al. (1986) K. Okuda, K. Kurosawa, S. Saito, M. Honda, Z. Yu, and M. Date, Journal of the Physical Society of Japan 55, 4456 (1986).
- Wildes et al. (1994) A. R. Wildes, S. J. Kennedy, and T. J. Hicks, Journal of Physics: Condensed Matter 6, L335 (1994).
- Goossens et al. (2000) D. J. Goossens, A. R. Wildes, C. Ritter, and T. J. Hicks, Journal of Physics: Condensed Matter 12, 1845 (2000).
- Kurosawa et al. (1983) K. Kurosawa, S. Saito, and Y. Yamaguchi, Journal of the Physical Society of Japan 52, 3919 (1983).
- Ressouche et al. (2010) E. Ressouche, M. Loire, V. Simonet, R. Ballou, A. Stunault, and A. Wildes, Physical Review B 82, 100408 (2010).
- Pich and Schwabl (1994) C. Pich and F. Schwabl, Physical Review B 49, 413 (1994).
- Pich and Schwabl (1995a) C. Pich and F. Schwabl, Journal of Magnetism and Magnetic Materials 148, 30 (1995a).
- Pich and Schwabl (1995b) C. Pich and F. Schwabl, Journal of Magnetism and Magnetic Materials 140-144, 1709 (1995b).
- Goossens (2010) D. J. Goossens, The European Physical Journal B 78, 305 (2010).
- Cleary et al. (1986) D. Cleary, A. Francis, and E. Lifshitz, Chemical Physics 106, 123 (1986).
- Wildes et al. (2007) A. Wildes, H. Rønnow, B. Roessli, M. Harris, and K. Godfrey, Journal of Magnetism and Magnetic Materials 310, 1221 (2007).
- le Flem (1982) G. le Flem, Solid State Communications 42, 591 (1982).
- Radtke et al. (2010) G. Radtke, A. Saúl, H. A. Dabkowska, G. M. Luke, and G. A. Botton, Physical Review Letters 105, 036401 (2010).
- Saúl and Radtke (2011) A. Saúl and G. Radtke, Physical Review Letters 106, 177203 (2011).
- Saúl et al. (2013) A. Saúl, D. Vodenicarevic, and G. Radtke, Physical Review B 87, 024403 (2013).
- Saúl and Radtke (2014) A. Saúl and G. Radtke, Physical Review B 89, 104414 (2014).
- Radtke et al. (2015) G. Radtke, A. Saúl, H. A. Dabkowska, M. B. Salamon, and M. Jaime, Proceedings of the National Academy of Sciences 112, 1971 (2015).
- Saúl et al. (2018) A. Saúl, N. Gauthier, R. M. Askari, M. Côté, T. Maris, C. Reber, A. Lannes, D. Luneau, M. Nicklas, J. M. Law, E. L. Green, J. Wosnitza, A. D. Bianchi, and A. Feiguin, Physical Review B 97, 064414 (2018).