\PHyear2020 \PHnumber059 \PHdate15 April
\ShortTitleProduction of light-flavor hadrons in pp collisions at
\CollaborationALICE Collaboration††thanks: See Appendix A for the list of collaboration members \ShortAuthorALICE Collaboration
The production of , , , , , , , , , and their antiparticles was measured in inelastic proton-proton (pp) collisions at a center-of-mass energy of = 13 TeV at midrapidity () as a function of transverse momentum () using the ALICE detector at the CERN LHC. Furthermore, the single-particle distributions of , , and in inelastic pp collisions at = 7 TeV are reported here for the first time. The distributions are studied at midrapidity within the transverse momentum range GeV/, depending on the particle species. The spectra, integrated yields, and particle yield ratios are discussed as a function of collision energy and compared with measurements at lower and with results from various general-purpose QCD-inspired Monte Carlo models. A hardening of the spectra at high with increasing collision energy is observed, which is similar for all particle species under study. The transverse mass and scaling properties of hadron production are also studied. As the collision energy increases from = 7 to 13 TeV, the yields of non- and single-strange hadrons normalized to the pion yields remain approximately constant as a function of , while ratios for multi-strange hadrons indicate enhancements. The -differential cross sections of , and () are compared with next-to-leading order perturbative QCD calculations, which are found to overestimate the cross sections for and () at high .
1 Introduction
Identified particle spectra and yields, which are among the most fundamental physical observables in high-energy hadronic collisions, have been intensively studied in hadron-collider and cosmic-ray physics for many decades [1]. Hadron production at collider energies originates from soft and hard scattering processes at the partonic level. Hard scatterings, where two partons interact with a large momentum transfer, are responsible for the production of particles with high transverse momenta. This process is theoretically described by perturbative Quantum Chromodynamics (pQCD) calculations based on the factorization theorem [2]. In this approach, the cross section is a convolution of the parton distribution function (PDF), the partonic QCD matrix elements, and the fragmentation function (FF). The PDFs describe the probability densities of finding a parton with a specific flavor carrying fraction of the proton momentum, whereas the FFs encode the probability densities that the parton with a specific flavor fragments into a hadron carrying a fraction of the parton’s longitudinal momentum; both considered at a given energy scale. At the LHC, with increasing center-of-mass collision energy (), the lower regime is probed and contributions from hard-scattering processes increase. In the kinematic region probed by these measurements, high- particles dominantly originate from the fragmentation of gluons [3, 4]. Parameterizations of both the PDFs and FFs are derived from global analyses [5, 6] based on fits to experimental data at various with next-to-leading order (NLO) accuracy. These include single-inclusive hadron production in semi-inclusive electron-positron annihilation data, semi-inclusive deep-inelastic scattering, and single inclusive hadron spectra at high , notably including results at LHC energies. Results presented in this paper can be used as further input for these studies. In particular, identified particle spectra provide new constraints on the gluon-to-pion and, especially, gluon-to-kaon fragmentation functions [7, 8, 9, 10]. While particle production at high is expected to be calculable with pQCD, the LHC results are in general not well reproduced by pQCD calculations, see Ref. [6] and references therein. Charged particle production at high is known to scale with , as observed in a wide energy range up to . This has been observed by the CDF Collaboration in p collisions at the Tevatron [11, 12], by the UA1 Collaboration at the CERN SPS [13], by the STAR Collaboration in pp collisions at RHIC [14], and by the CMS Collaboration [15] at the CERN LHC. Above , significant deviations from the leading-twist NLO pQCD predictions have been reported in Ref. [16] and are investigated in this paper.
The bulk of particles produced at low transverse momenta () originate from soft scattering processes involving small momentum transfers. In this regime, particle production cannot be calculated from first principles. Instead, calculations rely on QCD inspired phenomenological models, which are tuned to reproduce previous measurements. Hence, measurements at low provide further important constraints on such models. The universal transverse mass, , scaling originally proposed by R. Hagedorn [17] was first seen to hold approximately at ISR energies [18]. It was then observed by the PHENIX [19, 20] and STAR [21] collaborations to hold only separately for mesons and baryons at RHIC energies, by applying the approximate scaling relation respectively for pions and protons. At a disagreement was observed for charged kaons and mesons, which indicated a breaking of the generalized scaling behavior [22]. Moreover, recent studies, based on identified particle spectra measured in pp collisions at by ALICE, indicate that scaling also breaks in the low- region [23]. These observations motivate studies of the applicability of scaling of particle production through the precise measurement of identified hadrons at .
The results reported in this paper are the measurements of the production of , , , , , , , , , , , , and at the highest collision energies, and therefore extend the studies of the energy dependence of the production of light-flavor hadrons into new territory. The study of the production of the and resonances, containing respectively one and two strange valence quarks, contributes to a better understanding of strange particle production mechanisms. Because of their short lifetimes ( for and for ), their decay daughters may undergo re-scattering and/or regeneration processes that affect their yields and the shapes of their distributions. In addition, multi-strange baryons, () and (), are of crucial importance due to their dominant strange (s) quark content. Furthermore, the production of , , and in pp collisions at is reported here for the first time, completing the set of reference measurements at that energy [24, 25, 26, 27].
The present measurements serve as important baselines for studies of particle production as a function of the charged-particle multiplicity [28] or event shape (e.g. spherocity) [29] and also provide input to tune the modeling of several contributions in Monte Carlo (MC) event generators such as PYTHIA [30, 31] and EPOS-LHC [32]. In addition, measurements in minimum bias pp collisions reported in this paper serve as reference data to study nuclear effects in proton-lead (p–Pb) and lead-lead (Pb–Pb) collisions.
The paper is organized as follows. In Section 2 the ALICE experimental apparatus and the analyzed data samples are described, focusing on the detectors which are relevant for the presented measurements. In Section 3 the details of the event and track selection criteria and of the Particle IDentification (PID) techniques are discussed. The results are given in Section 4, in which the spectra and the extraction procedures for the -integrated yield and average are presented. Section 5 discusses the results, followed by a summary in Section 6. For the remainder of this paper, the masses will be omitted from the symbols of the strongly decaying particles, which will be denoted as , , and .
2 Experimental setup
A detailed description of the ALICE detector and its performance can be found in Refs. [33, 34]. The main subsystems of the ALICE detector used in this analysis are the V0 detector, the Inner Tracking System (ITS), the Time Projection Chamber (TPC), the Time of Flight (TOF) detector, and the High-Momentum Particle Identification Detector (HMPID).
The V0 detector [35] is used for triggering and beam background suppression. It is made up of two scintillator arrays placed along the beam axis on each side of the interaction point (IP) at cm and cm, covering the pseudorapidity regions (V0A) and (V0C), respectively.
In the measurements of light-flavor hadrons, primary charged particles are considered. Primary particles are defined as particles with a mean proper lifetime that is larger than 1 cm/, which are either produced directly in the interaction or from decays of particles produced at the interaction vertex with shorter than 1 cm/. This excludes particles produced in interactions with the detector material [36]. Primary charged-hadron tracks are reconstructed by the ITS and TPC detectors, which have full azimuthal acceptance within for full-length tracks. They are located inside a solenoidal magnet providing a magnetic field of T.
The ITS [33, 37] is a silicon tracking detector made up of six concentric cylindrically-shaped layers, measuring high-resolution space points near the collision vertex. The two innermost layers consist of Silicon Pixel Detectors (SPD) used to reconstruct the primary vertex of the collision and short track segments called “tracklets". The four outer layers are equipped with silicon drift (SDD) and strip (SSD) detectors and allow measurement of the specific energy loss () with a relative resolution of about 10%. The ITS is also used as a stand-alone tracking detector to reconstruct charged particles with momenta below that are deflected or decay before reaching the TPC.
The TPC [38] is the main tracking detector of ALICE. It is a large volume cylindrical drift detector spanning the approximate radial and longitudinal ranges cm and cm, respectively. The endcaps of the TPC are equipped with multiwire proportional chambers (MWPCs) segmented radially into pad rows. Together with the measurement of the drift time, the TPC provides three dimensional space point information, with up to 159 tracking points. Charged tracks originating from the primary vertex can be reconstructed down to [34], albeit with a lower tracking efficiency for identified charged hadrons with . Combining information from the ITS and TPC allows the momenta of charged particles to be measured for momenta from 0.05 to with a resolution of 1–10%, depending on . The TPC provides charged-hadron identification via measurement of the specific energy loss in the fill gas, with a resolution of [38].
The Time of Flight detector (TOF) [39, 40, 41] is a cylindrical array of multi-gap resistive plate chambers which sits outside the TPC. It covers the pseudorapidity range with (almost) full azimuthal acceptance. The total time-of-flight resolution, including the resolution on the collision time, is about 90 ps in pp collisions.
The HMPID consists of seven proximity focusing Ring Imaging Cherenkov (RICH) counters. Primary charged particles penetrate the radiator volume, filled with liquid , and generate Cherenkov photons that are converted into photoelectrons in thin CsI-coated photocathodes. Photo-electron clusters, together with pad clusters (also called “MIP” clusters) associated with the primary ionization of a particle, form Cherenkov rings. The amplified signal is read out by MWPCs, filled with . The detector covers and , which corresponds to of the TPC geometrical acceptance.
3 Event and track selection
3.1 Event selection
The measurements at are obtained from a minimum bias data sample of pp collisions collected in June 2015 during a period of low pileup in LHC Run 2. The minimum bias trigger required at least one hit in both of the V0 scintillator arrays in coincidence with the arrival of proton bunches from both directions along the beam axis. The mean number of inelastic proton-proton interactions per single bunch crossing ranges between 2% and 14%. A requirement of a coincidence of signals in both V0A and V0C detectors removes contamination from single-diffractive and electromagnetic events. Contamination arising from beam-induced background events, produced outside the interaction region, is removed offline by using timing information from the V0 detector, which has a time resolution better than 1 ns. Background events are further rejected by exploiting the correlation between the number of clusters and the multiplicity of tracklets in the SPD. From the triggered events, only events with a reconstructed primary vertex are considered for the analyses. Additionally, the position of the primary vertex along the beam axis is required to be within cm with respect to the nominal interaction point (center of the ALICE barrel). This requirement ensures that the vast majority of reconstructed tracks are within the central barrel acceptance () and it reduces background events by removing unwanted collisions from satellite bunches. Contamination from pileup events, which have more than one pp collision per bunch crossing, were rejected offline by excluding events with multiple primary vertices reconstructed in the SPD [34]. The pileup-rejected events are less than 1% of the total sample of minimum bias events. The size of the analyzed sample after selections ranges between 40 and 60 million events (corresponding to an integrated luminosity ), depending on the requirements of the analyses of the different particle species.
The measurements of , , and at are obtained by analyzing a sample of about 150 million events (corresponding to an integrated luminosity ) collected in 2010 during the LHC Run 1 data taking period. The corresponding trigger and event selection criteria applied were very similar to those used for the measurements at ; see Refs. [24, 42] for details on the triggering and event selection for these periods.
All corrections are calculated using Monte Carlo events from PYTHIA 6 and PYTHIA 8. PYTHIA 6.425 (Perugia 2011 tune) and PYTHIA 8.210 (Monash 2013 tune) event generators were used for . The PYTHIA 6.421 (Perugia 0 tune) was used for and at because that production was used for correcting the other analyses. The particles produced using these event generators were propagated through a simulation of the ALICE detector using GEANT3 [43].
3.2 Track selection
Tracks from charged particles are reconstructed in the TPC and ITS detectors and then propagated to the outer detectors and matched with reconstructed points in the TOF and HMPID. Additionally, in the analysis of , and , a dedicated tracking algorithm based only on ITS information (ITS stand-alone, ITS-sa) was used to reconstruct low momentum tracks. In the measurements, global tracks, which are reconstructed using the combined ITS and TPC information, are distinguished from ITS-sa tracks.
For analyses using global tracks, track selection criteria are applied to limit the contamination due to secondary particles, to maximize tracking efficiency and improve the and momentum resolution for primary charged particles, and to guarantee an optimal PID quality. The number of crossed pad rows in the TPC is required to be at least 70 (out of a maximum possible of 159); the ratio of the number of crossed pad rows to the number of findable clusters (that is the number of geometrically possible clusters which can be assigned to a track) is restricted to be greater than 0.8, see Ref. [34] for the details. The goodness-of-fit values per cluster () of the track fit in the TPC must be less than 4. Tracks must be associated with at least one cluster in the SPD and the values per cluster in the ITS are restricted in order to select high-quality tracks. The distance of closest approach (DCA) to the primary vertex in the plane perpendicular to the beam axis (DCAxy) is required to be less than 7 times the resolution of this quantity; this selection is dependent, i.e. cm. A loose selection criterion is also applied on the the DCA in the beam direction (DCAz), by rejecting tracks with DCAz larger than 2 cm, to remove tracks from possible residual pileup events. The transverse momentum of each track must be greater than 150 and the pseudorapidity is restricted to the range to avoid edge effects in the TPC acceptance. Additionally, tracks produced by the reconstructed weak decays of pions and kaons (the “kink" decay topology) are rejected.
For the topological reconstruction of weakly decaying particles, the selected global tracks are combined using specific algorithms, as described in Sec. 4.3. Track selection criteria are the same applied for global tracks with a few exceptions: for tracks used in the reconstruction of , , , , , , and , no ITS information is required and special selection criteria are applied on the DCA to the collision vertex, as shown in Table 3. The kink topology tracks that are used to reconstruct the weak decays of do not have ITS information. For the latter, removal of contributions from pileup collisions outside the trigger proton bunch (“out-of-bunch pileup”) is achieved by requiring that at least one charged decay track matches a hit in a “fast” detector (either the ITS or the TOF detector).
ITS stand-alone tracking uses similar selection criteria to those mentioned above. Tracks are required to have at least four ITS clusters, with at least one in the SPD, three in the SSD and SDD and . This further reduces contamination from secondary tracks and provides high resolution for the track impact parameter and optimal resolution for . Similar to global tracks, a -dependent parameterization of the DCAxy selection is used, but with different parameters to account for the different resolution. For the ranges used in this analysis, the selected ITS-sa tracks have the same resolution as those measured in pp collisions at : 6% for pions, 8% for kaons, and 10% for protons [24].
4 Data analysis techniques
Table 1 lists the basic characteristics of the particles studied in this paper. This section describes the techniques used to measure the yields of the various hadron species. In Sec. 4.1, aspects common to all analyses are described, including the correction and normalization procedure and the common sources of systematic uncertainties. Next, the analysis of each hadron species is described in detail. The measurements of charged pions, charged kaons, and (anti)protons, which are performed using several different PID techniques, are described in Sec. 4.2. It is worth noting that charged kaons are also identified using the kink topology of their two-body decays. The measurements of weakly decaying strange hadrons (, , , and their antiparticles) are reported in Sec. 4.3, followed by the strongly decaying resonances (, , and ) in Sec. 4.4.
| Particle | Valence | Mass | Decay | B.R. (%) | ||||||||
| Quark Content | (MeV/) | |||||||||||
| 139.57 | 7.8 m | — | — | |||||||||
| 493.68 | 3.7 m | |||||||||||
| 497.61 | 2.68 cm | |||||||||||
|
Mesons |
895.55 | 4.16 fm | ||||||||||
| 1019.46 | 46.2 fm | |||||||||||
| uud | 938.27 | — | — | — | ||||||||
| uds | 1115.68 | 7.89 cm | ||||||||||
| dss | 1321.71 | 4.91 cm | ||||||||||
|
Baryons |
sss | 1672.45 | 2.46 cm |
4.1 Common aspects of all analyses
In several of the analyses presented below, the measured PID signal is compared to the expected value based on various particle mass hypotheses. The difference between the measured and expected values is expressed in terms of , the standard deviation of the corresponding measured signal distribution. The size of this difference, in multiples of , is denoted . In the following, the values accounting for the resolution of the PID signals measured in the TPC and TOF detectors are denoted as and , respectively.
The corrected yield of each hadron species as a function of is
| (1) |
is obtained by following the procedure described in previous publications. Here, is the number of particles measured in each bin and is the product of the acceptance and the efficiency (including PID efficiency, matching efficiency, detector acceptance, reconstruction, and selection efficiencies). Monte Carlo simulations are used to evaluate , which takes on similar values to those found in our previous analyses. The factor , also known as the “signal-loss” correction, accounts for reductions in the measured particle yields due to event triggering and primary vertex reconstruction. Such losses are more important at low , since events that fail the trigger conditions or fail to have a reconstructible primary vertex tend to have softer particle spectra than the average inelastic collision. For , deviates from unity by a few percent at low to less than one percent for . The trigger configuration used for resulted in negligible signal loss, thus is set to unity for this energy. The factor is used to correct for contamination from secondary and misidentified particles; is non-zero only for the measurements of , , , , and , and it is more important at low . The computation of for those species is described further in the relevant sections below. The factor corrects for inaccuracies in the hadronic production cross sections in GEANT3, which is used in the calculation of to describe the interactions of hadrons with the detector material of ALICE. GEANT4 and FLUKA [45], which have more accurate descriptions of the hadronic cross sections, are used to calculate the correction factor, which can be different from unity by up to a few percent. The correction is applied only for the analyses of , , , , and .
After correction, the yields are normalized to the number of inelastic pp collisions using the ratio of the ALICE visible cross section to the total inelastic cross section. This ratio is for [46] and for [47, 48].
The procedures for the estimation of systematic uncertainties strictly follow those applied in our measurements from LHC Run 1. All described uncertainties are assumed to be strongly correlated among adjacent bins. For the evaluation of the total systematic uncertainty in every analysis, all contributions originating from different sources are considered to be uncorrelated and summed in quadrature. Components of uncertainties related to the ITS-TPC matching efficiency correction and to the event selection are considered correlated among different measurements. The systematic uncertainty due to the normalization to the number of inelastic collisions is for and for independent of . This uncertainty is common to all measured spectra and values (see Sec. 5.1) at a given energy. The systematic uncertainty associated to possible residual contamination from pileup events was estimated varying pileup rejection criteria and was found to be of 1%. The singal loss correction has a small dependence on the Monte Carlo event generator used to calculate it. These variations result in -dependent uncertainties that are largest at low , where they have values of for , for , , , and , and for , , , and .
The systematic uncertainty accounting for the limited knowledge of the material budget is estimated by varying the amount of detector material in the MC simulations within its expected uncertainties [34]. For the analysis of , , , , and , the values are taken from the studies reported in Refs. [49] and [50]. This uncertainty is estimated to be around for , for , for , for , and for ; it is largest at low momenta and tends to be negligible towards higher momenta. For the measurement of and at , the material budget uncertainty is estimated to be , independent of . For the measurements of , , and at , the material budget uncertainty is dependent for low () and constant at higher . For low , the uncertainty reaches maximum values of about 4.7% for , 6.7% for , 6% for , and 3.5% for ; at high , the uncertainty is less than 1% for , , and , and about 1.5% for .
The systematic uncertainty due to the limited description of the hadronic interaction cross sections in the transport code is evaluated using GEANT4 and FLUKA. This leads to uncertainties of up to for , for , for , and for [49]. It is at most for , for and for the strange baryons. It is negligible for at both reported collision energies. In the following sections, details are given on the contributions (specific to each analysis) related to track or topological selections and signal extraction methods, as well as those related to feed-down.
4.2 Identification of primary charged pions, charged kaons, and (anti)protons
To measure the production of primary charged pions, kaons, and (anti)protons over a wide range of , five analyses using distinct PID techniques were carried out. The individual analyses follow the techniques adopted in previous measurements based on data collected at lower center-of-mass energies and for different collision systems during LHC Run 1 [51, 52, 24, 25, 53]. The spectra have been measured from for pions, for kaons, and for protons, up to for all three species. The individual analyses with their respective reaches are summarized in Tab. 2. All the analysis techniques are extensively described in Refs. [51, 49, 24, 7]. Each procedure is discussed separately in Secs. 4.2.1–4.2.5, with special emphasis on those aspects that are relevant for the current measurements. The results for the different analyses are then combined as described in Sec. 4.2.6.
The calculation of in Eq. 1 at low is performed by subtracting the secondary , , and from the primary particle sample. This method is data-driven and it is based on the measured distance of closest approach to the primary vertex in the plane transverse to the beam direction (), following the same procedure adopted in Ref. [24]. The distribution of the selected tracks was fitted in every bin with Monte Carlo templates composed of three ingredients: primary particles, secondaries from material and secondaries from weak decays, each accounting for the expected shapes of the distribution. Because of the different track and PID selection criteria, the contributions are different for each analysis. The resulting corrections are significant at low and decrease towards higher due to decay kinematics. Up to , the contamination is for pions, up to for kaons (in the narrow momentum range where the response for kaons and secondary electrons overlap), and for protons.
| Analysis technique | range (GeV/) | or range | ||||||
| ITS-sa | ||||||||
| TPC-TOF fits | ||||||||
| HMPID | ||||||||
| Kinks | ||||||||
| TPC rel. rise | ||||||||
The main sources of systematic uncertainties for each analysis are summarized in Tab. LABEL:tab:syst:pikp, including contributions common to all analyses. The systematic uncertainty due to the subtraction of secondary particles is estimated by changing the fit range of the distribution, resulting in uncertainties of up to for protons and for pions, with negligible uncertainties for kaons. The uncertainty due to the matching of TPC tracks with ITS hits is estimated to be in the range for depending on , while it takes values around at higher . This uncertainty together with that resulting from the variation of the track quality selection criteria lead to the systematic uncertainty of the global tracking efficiency that varies from 2.2 to 7.3% from low to high , independent of particle species.
4.2.1 ITS stand-alone
In the “ITS stand-alone” analysis, both tracking and PID are performed based on information from the ITS detector only. For the present data sample, the contribution of tracks with wrongly assigned clusters in the ITS is negligible due to the low pseudorapidity density of charged particles, , measured in the pseudorapidity region [54]. The average signal in the four outer ITS layers used for PID is estimated by means of the truncated mean method [51]. The measured for the sample of ITS-sa tracks is shown in the top left panel of Fig. LABEL:fig:PidPerformance, along with the Bethe–Bloch parametrization of the most probable values, which is the same as the one used for the LHC Run 1 analyses [24]. Two identification strategies were used. In the main analysis, a unique identity is assigned to the ITS-sa track according to the mass hypothesis for which the expected specific energy-loss value is the closest to the measured for a track with momentum . The second analysis strategy uses the Bayesian PID approach [55], based on likelihood parametrization with a set of iterative prior probabilities. The identification is based on the maximal probability method in which the species with the highest probability is assigned to a track. For , where the e separation power in the ITS allows high-purity identification of electrons, four mass hypotheses (e//K/p) are considered. For , electrons and pions cannot be separated using their in the ITS detector, and the Bayesian approach is based on the /K/p mass hypotheses only.
For the ITS-sa analysis, the systematic uncertainties related to the PID procedure originate from the different techniques that are used (the truncated mean method and the Bayesian PID approach). These range from about 1 to 5% depending on particle species and . The Lorentz force causes the migration of the cluster position in the ITS by driving the charge in opposite directions depending on the polarity of the magnetic field of the experiment ( effect). The uncertainty related to this effect is estimated by analyzing data samples with opposite magnetic field polarities, for which a difference at the level of is observed.
4.2.2 TPC-TOF fits
In the so-called “TPC-TOF fits” analysis, the distributions of the specific energy loss measured in the TPC and the velocity measured in the TOF detector are fitted with functions that describe the PID signals for different track momentum () intervals. The TPC provides a separation between pions and kaons up to and between kaons and protons up to .
Particle identification using this technique is possible in the ranges , , and for , , and , respectively. The extraction of the raw yield for a given species is done by integrating the distribution in these intervals. In addition, in the transverse momentum ranges for , for , and for , a Gaussian fit is used to remove the background contribution ( for pions, for kaons, and for (anti)protons). The background contribution is small () in all cases, except for at , where it reaches . The TOF analysis uses the sub-sample of global tracks for which the time-of-flight measurement is available. The procedure is performed in narrow regions of pseudorapidity, and , in order to achieve a sufficient level of separation and to strengthen the correlation between the total momentum and the transverse momentum. The TOF matching efficiency for the presented data sample in the pseudorapidity region () increases rapidly with up to around for pions at , for kaons at , and for protons at ; it saturates at higher momenta [56]. The PID performance of the TOF detector is shown in the bottom right panel of Fig. LABEL:fig:PidPerformance, where the velocity of the particles is reported as a function of momentum . The raw particle yields are then obtained by fitting the measured distributions with a TOF response function, where the contribution for a given species is centered around . An additional template is added to account for wrongly associated (mismatched) hits in the TOF detector.
The TPC-TOF fits analysis includes uncertainties related to the PID procedure from several sources. For the TPC part, uncertainties are estimated by integrating the distribution for each particle species in and , and comparing to the integral of the underlying distribution performed within ; the larger resulting uncertainty is used. Similarly, for TOF fits for , the uncertainty related to PID is estimated by integrating the in the range of . This results in uncertainties of up to for , for , and for (anti)protons. At higher , where the separation between particle species becomes small, a better estimate of the uncertainty of the method can be achieved by varying simultaneously the resolution and the tail parameter [24, 56] of the fit function used to describe the PID signal around their nominal values. An additional uncertainty is included to account for the TOF miscalibration, which becomes significant for . This results in uncertainties of up to for , for , and for (anti)protons. An uncertainty related to the matching of tracks to TOF hits arises from differences in the TPC-TOF matching efficiency in real data and simulations. This uncertainty is for , for , and for (anti)protons, independent of .
4.2.3 HMPID
The HMPID analysis extends charged hadron identification into the intermediate- region (), combining the measurement of the emission angle of the Cherenkov photons and the momentum information of the particle under study. The Cherenkov photons are selected using the Hough Transform Method [57]. The measurement of the single photon angle in the HMPID requires the determination of the track parameters, which are calculated for tracks propagated from the central tracking detectors to the radiator volume where the Cherenkov photons are emitted. Each track is extrapolated to the HMPID cathode plane and matched to the closest primary ionization (MIP) cluster. The distance within the cathode plane between the extrapolated track and the matched cluster (denoted ) is restricted to be less than 5 cm to reduce false matches. A mean Cherenkov angle , computed as the weighted average of single photon angles, is associated to each particle track. The PID performance is shown in the bottom left panel of Fig. LABEL:fig:PidPerformance, where the correlation between the reconstructed Cherenkov angle and the track momentum is shown, indicating good agreement with the theoretically expected values. For yield extraction, a statistical unfolding technique is applied by fitting the reconstructed Cherenkov angle distribution in a given momentum interval, which requires a precise knowledge of the detector response function. Yields are evaluated from the integral of each of the three Gaussian functions, corresponding to the signals from pions, kaons, and protons. The HMPID allows pion and kaon identification in the momentum range , while (anti)protons can be distinguished from pions and kaons up to , with separation powers larger than .
Additionally, in the HMPID analysis, a data-driven correction for the selection criterion on the distance has been evaluated by taking the ratio between the number of tracks that pass the selection criterion on and all the tracks in the detector acceptance. This matching efficiency correction is dependent and it is about ; it is lower for particles with velocity [52]. Negatively charged particle tracks have a distance correction lower than positive ones due to a radial residual misalignment of the HMPID chambers and an imperfect estimation of the energy loss in the material traversed by the track.
In the HMPID analysis, the systematic uncertainty has contributions from tracking, PID, and track association [24, 52]. The PID uncertainties are estimated by varying the parameters of the fit function used to extract the raw particle yield. This uncertainty is -dependent and increases with to a maximum value of for and , and for (anti)protons. Furthermore, the uncertainty of the association of the global track to the charged particle signal in the HMPID is obtained by varying the default value of the distance criterion required for the matching. The resulting uncertainty is -dependent with a maximum value of about 4% for (anti)protons at .
4.2.4 TPC relativistic rise
In the TPC relativistic rise analysis charged pions, charged kaons, and (anti)protons can be identified up to . The identification is achieved by measuring the specific energy loss in the TPC in the relativistic rise regime of the Bethe–Bloch curve. The as a function of momentum is shown in the top right panel of Fig. LABEL:fig:PidPerformance, indicating the response for charge-summed , , , and . The separation power between particle species is about () for () at , and it is nearly constant at similar values for larger momenta. The results presented in this paper were obtained using the method detailed in Ref. [52]. As discussed in Refs. [7, 52, 24, 25], is calibrated taking into account chamber gain variations, track curvature and diffusion to obtain the best possible overall performance, which results in a response that essentially only depends on (). The resolution is better at larger rapidities for the same because of the longer integrated track lengths. Hence, to analyze homogeneous samples, the analysis is performed in four equal-width intervals within (, , and ). Samples of topologically identified pions from decays, protons from decays, and electrons from photon conversions were used to parameterize the Bethe–Bloch response as a function of and the relative resolution as a function of . The relative yields of pions, kaons, protons, and electrons are obtained as the , , , and yields normalized to that for inclusive charged particles. They are obtained using four-Gaussian fits to distributions differentially in and intervals. The parameters (mean and width) of the fits are fixed using the parameterized Bethe–Bloch and resolution curves. The relative yields as a function of are found to be independent of and therefore averaged. Particle yields are constructed using the corrected relative yields and the corrected charged particle yields [54]. A Jacobian correction is applied to account for the pseudorapidity-to-rapidity conversion.
In the TPC relativistic rise analysis, the pion and (anti)proton yields are corrected for secondary particles from weak decays using MC simulations for the relative fraction of secondaries. The obtained fraction of secondary pions and (anti)protons are scaled to those extracted from template fits to data. For , the correction is negligible for pions. It is for (anti)protons at , decreases to at , and stays constant from that onward. Moreover, at high , there is a small contamination of primary muons in the pion yields. Due to the similar muon and pion masses, the electron (fractional) yield is subtracted from the pion yield to correct for the muon contamination. This procedure gives a correction to the pion yield in the entire range considered in the analysis. Furthermore, above , both the contamination of kaons and the contamination of (anti)deuterons in the (anti)proton sample are negligible.
The tracking efficiency component is calculated as a relative correction factor. It is the ratio of the inclusive to identified charged particle efficiencies, and is applied to the relative yields. At high this correction is nearly constant, of the order of , depending on the particle species.
In the TPC relativistic rise analysis, the systematic uncertainties mainly originate from event and track selection and the PID procedure. The first component is based on the study of inclusive charged particles [54], and it was recalculated to meet the event selection condition for inelastic events. Its value is estimated to be at high (at which the value is largest). It is the main contribution for pions. The second component was measured following the procedure explained in Ref. [52]. Here, the largest contribution is due to the uncertainties in the parameterization of the response, resulting in uncertainties of for and for (anti)protons, depending on .
4.2.5 Topological reconstruction of kink decays
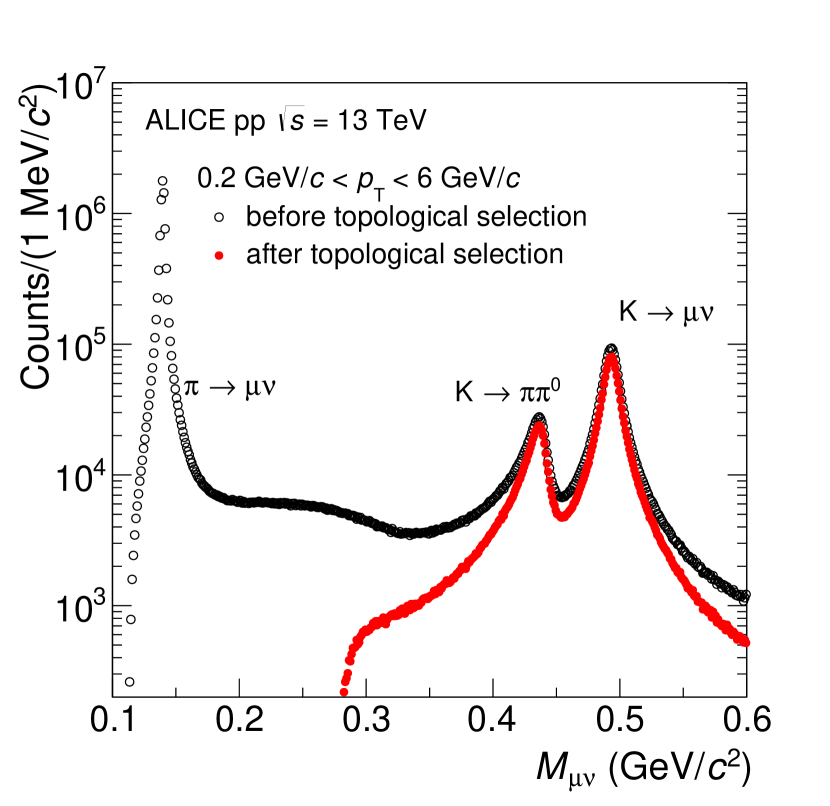
Charged kaons are also measured by reconstructing the vertex of their weak decay in the TPC. The procedure extends the reach of the identification of charged kaons on a track-by-track basis from (available with the HMPID) up to . This method exploits the characteristic kink topology defined by the decay of a charged mother particle to a daughter with the same charge and a neutral daughter [24]. Thanks to the two-body kinematics of the kink topology, it is possible to separate kaon decays from the background mainly caused by pion decays. For this purpose, a topological selection is applied by imposing a selection criterion on the daughter track’s momentum with respect to that of the mother track, and on the decay angle, defined as the angle between the momenta of the mother and the charged daughter track. Furthermore, mother tracks are selected inside a band of the expected for kaons to enhance the purity of the sample. With the assumption that the charged daughter track is a muon and the undetected neutral daughter particle is a neutrino, the reconstructed invariant mass is calculated and is shown in Fig. 1. The raw yield of the topologically selected kaons in a given bin are obtained from the integral of the invariant mass distribution after the topological selection criteria. The contamination due to fake kinks increases with and saturates at , reaching a maximum value of about 5%.
For the topological identification of charged kaons, the size of the correction related to contamination (arising from background or misidentification) was assigned as a -dependent uncertainty on the purity. The kink identification uncertainty is dependent and it ranges from 2.5% at low to 2.2% at high . The systematic uncertainty on the efficiency for findable kink vertices was estimated to be , independent of . The uncertainty due to contamination from fake kinks was estimated to be at most about 5% around , decreasing towards higher .
4.2.6 Combination of , , and spectra from different analyses
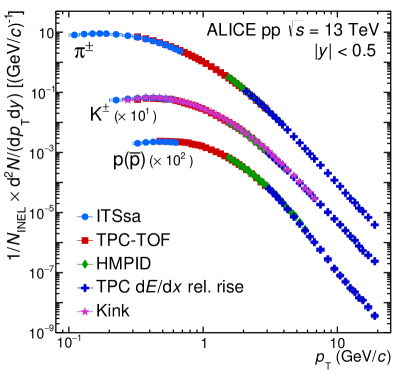
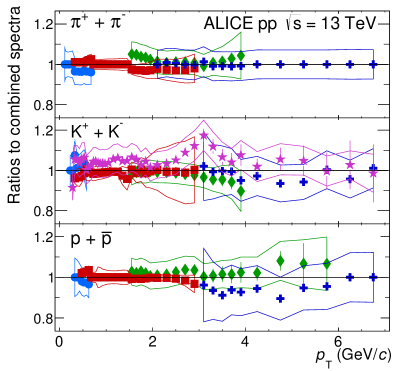
The charged pion, charged kaon and (anti)proton transverse momentum spectra were measured via several independent analyses as described in the preceding sections. To ensure the maximal coverage, the final spectra were calculated as the average of all analyses weighted by the systematic uncertainties that are not shared between analyses, i.e. uncorrelated. The uncertainties related to the ITS-TPC matching efficiency and the global tracking efficiency are largely correlated and were summed in quadrature with the uncorrelated part of the systematic uncertainties obtained after the averaging. Only the TPC relativistic rise analysis is used above , and respectively for pions, kaons, and protons. To verify the validity of the procedure, the spectra obtained from the individual analyses were compared to the final combined ones. The left panel of Fig. 2 shows the , , and spectra obtained from the five analyses discussed above, which are normalized to the number of inelastic collisions (). The right panel of Fig. 2 shows the ratios of the individual spectra to the combined spectra, which illustrates an excellent agreement in the overlapping regions for every particle species within the uncorrelated part of the systematic uncertainties.
4.3 Topological identification of weakly-decaying strange hadrons
Primary strange hadrons , , , , , , and are reconstructed at midrapidity (0.5) via their characteristic weak decay topologies in the channels presented in Tab. 1. Single-strange hadrons , and decay into two oppositely charged daughter particles ( decay). Multi-strange hadrons ( and ) decay into a charged meson (bachelor) plus a decaying particle, giving the two-step process known as a cascade. The identification methods for the ( and ) and cascade-like ( and ) candidates strictly follow those presented in earlier works [58, 27]. An additional selection criterion on (anti)proton momentum () measured at the inner wall of TPC was introduced because of the observed instability of track reconstruction for the lowest bin of and spectra. Several track, PID, and topological selection criteria are applied in order to find and cascade decay candidates. Charged tracks are selected using the standard criteria described in Sec. 3.2. The identity of these daughter tracks is established with the requirement that the specific energy loss measured in the TPC is compatible with the expected mass hypothesis within () for the analysis of and ( and ). These identified tracks are then combined to form invariant mass distributions, and fake combinations are reduced by applying selection criteria on topological variables.
| Hadron species | |||||
| Secondary track selections | |||||
| Pseudorapidity range | 0.8 | 0.8 | 0.8 | 0.8 | |
| DCAxy of daughter track | |||||
| to primary vertex (cm) | 0.06 | 0.06 | 0.04 | 0.03 | |
| DCAxy of bachelor track | |||||
| to primary vertex (cm) | — | — | 0.05 | 0.05 | |
| TPC PID selection () | 5 | 5 | 4 | 4 | |
| selections | |||||
| Rapidity range | 0.5 | 0.5 | — | — | |
| Transverse decay radius (cm) | 0.5 | 0.5 | 1.4 | 1.4 | |
| DCAxy of to primary vertex (cm) | — | — | 0.07 | 0.07 | |
| DCA between daughter tracks () | 1 | 1 | 1.5 | 1.5 | |
| Cosine of Pointing Angles | 0.97 | 0.995 | 0.97 | 0.97 | |
| around nominal mass (MeV/) | — | — | 6 | 6 | |
| Cascade selections | |||||
| Rapidity range | — | — | 0.5 | 0.5 | |
| Transverse decay radius (cm) | — | — | 0.8 | 0.6 | |
| DCA between and bachelor track (cm) | — | — | 1.6 | 1 | |
| Cosine of Pointing Angle | — | — | 0.97 | 0.97 | |
| around nominal mass (MeV/) | — | — | 8 | 8 | |
Values for these selection criteria are summarized in Tab. 3 and a detailed description can be found in Ref. [58]. () candidates compatible with the alternative hypothesis, obtained by changing the mass assumption for the daughter tracks accordingly, are rejected if they lie within a fiducial window around the nominal () mass. A similar selection is applied for the analysis where candidates are rejected if the corresponding invariant mass, obtained by assuming the pion mass hypothesis for the bachelor track, is compatible within with the nominal mass. A selection is also made on the proper lifetime , where is the particle mass and is the distance from the primary vertex to the decay vertex; is required to be less than cm/. A further selection is applied on the pointing angle , the angle between the strange hadron’s momentum vector and the position vector of its decay point with respect to the primary collision vertex. With requirements of for and for and , about 1% of secondary and generated in the detector material is removed.
The particle yields are obtained as a function of by extracting the signals from the relevant invariant mass distributions. Examples of the invariant mass peaks at are shown in Fig. LABEL:fig:InvMass; the distributions of and are very similar to those at . The mean () and the width () values of the distributions are found by fitting the distribution with a Gaussian for the signal plus a linear function describing the background. The extracted values of the distributions both for s and cascades are in good agreement with the accepted values [44] and are well reproduced by MC simulations at and in all measured bins. The widths of the distributions evolve with at (7) TeV by about 7 (14) MeV/ for and 2 (4) MeV/ for and , which agrees with MC simulations within at both reported energies. For the s (cascades) a region containing all the signal (signal region) is defined around the mean within (), while a region to estimate the background (background region) is defined as side-bands from -12 to -6 (-12 to -6) and from 6 to 12 (6 to 19). Given the flatness of the invariant mass distribution in the background region, the estimate of the background in the signal region is obtained rescaling, by the ratio of the widths in the two regions, the sum of the entries of all the bins in the background region. An alternative method, used to estimate a possible systematic uncertainty, uses the fit of the invariant mass distribution in the background region to estimate the background contribution inside the peak region. In both cases, the signal is obtained subtracting the estimated background in the peak region from the integrated counts in the peak region.
The yields for () are significantly affected by secondary particles coming from the decays of () and (). The feed-down fraction is computed for each bin as the detection efficiency of () from decays multiplied by the measured () spectra, thereby assuming that the production rates of charged and neutral are equal. The ratio of secondary to the measured primary yield is about , depending on .
For the and cascade analyses, the main sources of uncertainties are listed in Tab. LABEL:tab:syst:lambdak0s and Tab. LABEL:tab:syst:xiomega, respectively. The values of the selection criteria on the topological variables were varied around their nominal values and the observed deviations for each component were summed in quadrature. Uncertainties related to signal extraction were estimated by varying the values of the width of the signal and background sampling regions with respect to the default one, and adopting an alternative method to estimate the background in the peak region. The procedure resulted in a -dependent uncertainty which rages from 0.2% to 6.8% for s and from 0.9% to 2.4% for the cascades.
For the measurement of , and at , contributions from out-of-bunch pileup are removed as stated in Sec. 3.2. The applied correction reaches a maximum value of about for and about for at high . For and at , a -dependent correction factor, taken from Ref. [28] is applied to remove the out-of-bunch pileup contribution; this correction is at low and rises to at high . A similar correction for and is negligible and hence not applied. The out-of-bunch pileup contribution is found to be negligible for the measurement of , , and at . A systematic uncertainty to account for any residual effect is for the , for , depending on , while it is negligible for .
The (topological selection) and track selection criteria are varied around their default values, producing up to () uncertainties in the and yields at (). The feed-down corrections for and carry uncertainties associated with the method and the uncertainty of the measured spectrum. The values are estimated to be around () for 13 (7) TeV, depending on . The applied selection criteria for PID in the TPC, used for better discrimination between the combinatorial background and the signal for strange baryons, are varied in the range of . For and , this uncertainty is 0.8–6% at and 0.2–3.3% at . For and , it is at most 1% for both collision energies. For the difference was found to be negligible at 13 TeV and at most 2.6% at 7 TeV. The resulting total uncertainties from low to high vary in the ranges 3.6–9.5% for , 6.1–7.8% for , 6.6–3.7% for , and 6.0–6.7% for .
In the invariant mass distribution (shown in Fig. LABEL:fig:InvMass), one could observe for s and cascades an imperfect fit of the tails close to the peak; the excess of candidates comes from misidentified daughters. The removal of this effect though application of further PID selection criteria would reduce significantly the number of candidates while not improving the signal extraction.
4.4 Reconstruction of resonances
Using analysis techniques similar to those described in Ref. [59], and mesons are identified through reconstruction of their decays to charged pions and kaons, while mesons are identified via their decays to pairs of charged kaons. Primary charged tracks are selected using the standard criteria described in Sec. 3.2. Pion and kaon candidates are identified using their specific energy loss measured in the TPC and their velocity measured with the TOF. The specific energy loss for each pion (kaon) candidate with is required to be within 2 of the expected mean value for pions (kaons); a less restrictive selection is applied for lower momenta. In addition, if the charged track is matched to a hit in the TOF, must be within 3 of the expected mean value. For the analysis of the (), all kaon candidates are paired with all oppositely charged pion (kaon) candidates from the same event and the pair invariant mass is calculated. The resulting distributions are shown in Fig. LABEL:fig:InvMass. The combinatorial background is estimated by calculating the invariant mass distribution of like-charge K or KK pairs from the same event, by parameterizing the combinatorial background with a simple function (for only), or by pairing tracks from two different events (the “mixed-event" technique). In order to ensure that the mixed events have similar characteristics, the positions of their primary vertices are required to be separated by less than 1 cm and their charged particle multiplicities are required to differ by no more than 5 reconstructed tracks. The background-subtracted invariant mass distributions are then fitted with a peak function added to a function that parameterizes the residual background contribution from correlated pairs. The peak is described with a Voigtian function, the convolution of a Breit–Wigner function and a Gaussian. The mass resolution for the is much smaller than the width of that resonance and a Breit–Wigner function is used to describe the peak. The yield of the () is then calculated by integrating the invariant mass distribution within , subtracting the integral of the residual background in the same region, and adding the yield from outside the peak region obtained from the peak fit function. The variations in the and yields due to alternate treatments of the combinatorial background, residual background parameterizations, and peak fitting functions are incorporated into the systematic uncertainties.
The systematic uncertainties in the and yields include the contributions listed in Tab. LABEL:tab:syst:phikstar. The contribution due to variations in the PID, track, and event selection criteria (“Track Selection" in the table) is 2–8% for and 1-5% for . Variations in the combinatorial background construction, residual background parameterization, peak parameterization, and fit range (“Signal Extraction" in the table) combine to give an uncertainty of 5–11% for and 2–6% for , depending on . The ITS-TPC matching uncertainty for single particles (pions and kaons) is 2% for all intervals. The uncertainty in the branching ratio is for and negligible for . The total systematic uncertainty for and is estimated to be about and , depending on .
5 Results
For the light-flavor hadrons discussed in this paper, the ratios of yields for particles and antiparticles are around one within the uncertainties, as expected at these collision energies in the midrapidity region. Therefore, all the spectra shown in the following are reported after summing particles and antiparticles, when a distinct antiparticle state exists. Unless explicitly stated, the sums of particles and antiparticles, , , , , , , and are denoted as , , , , , , or simply as , K, , p, , , and , respectively, unless explicitly written.
The uncertainty related to the overall normalization to inelastic (INEL) events is fully correlated between particle species and is not shown explicitly when plotting the results.
5.1 Transverse momentum distributions, integrated yields, and average transverse momenta
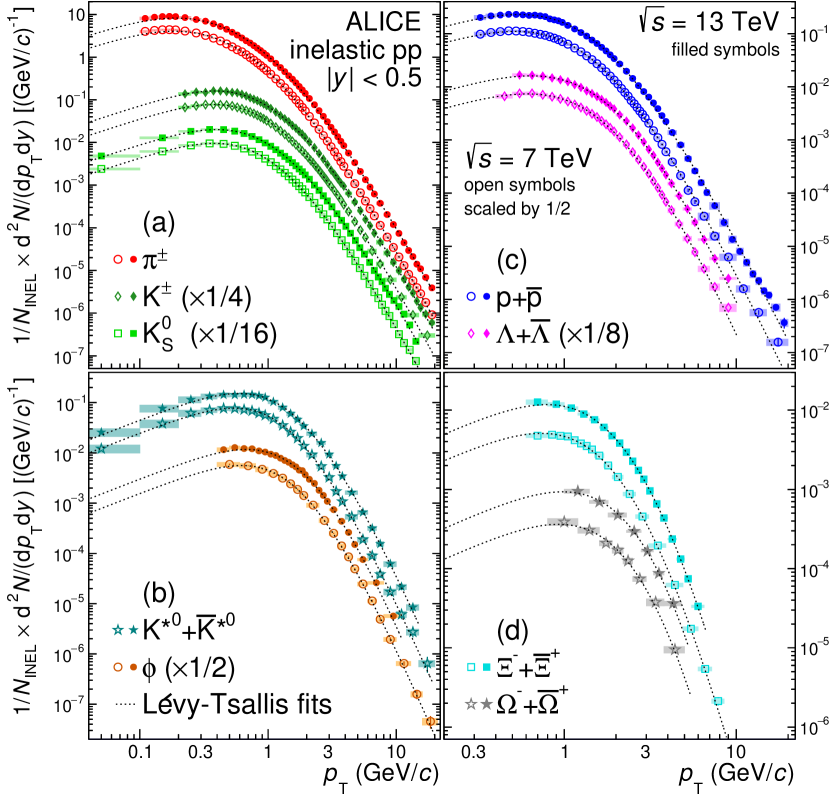
The spectra of light-flavor hadrons measured at midrapidity in inelastic pp collisions at and TeV are given in Fig. 3. The spectra of and measured in this paper at are shown together with other particle species from previous ALICE measurements at the same center-of-mass energy [27, 25, 60]. For INEL pp collisions, the reported distributions of , K, p [27, 25], , and [60] are from the updated measurements of ALICE, with extended reach, and, for resonances, additionally with an improved estimate of the systematic uncertainties. For clarity, some of the spectra have been scaled with the factors indicated in the legends.
The distributions are fitted with Lévy–Tsallis functions [61, 62] in order to extrapolate the spectra to the unmeasured regions, i.e. down to zero and up to high , similar to what was done in previous measurements [24, 58, 27, 26, 63]. This procedure allows the -integrated yields and the average transverse momenta to be extracted, for which the measured as well as the extrapolated distributions are used. The obtained values are given in Tab. 4. The fit function describes well both the low- exponential and high- power-law nature of the distribution, with values in the range . The slope parameter of the Lévy–Tsallis functions decreases for all particle species going from to TeV. For example, for charged pions and (anti)protons it changes from to and from to . No extrapolation is needed for and , as their yields are measured down to . The fractions of extrapolated particle yields outside the measured range at low are given in the last column of Tab. 4.
Other fit ranges and other parameterizations ( exponential, Boltzmann distribution, Bose–Einstein distribution, Fermi–Dirac distribution, Boltzmann–Gibbs blast-wave function [64]) are also used and the resulting variations in the and values are incorporated into the systematic uncertainties. The systematic uncertainties are 4–10% for and 1–3% for , similar to those estimated for measurements during Run 1. For the present measurements, systematic uncertainties are dominant. The average yields for all particles species increase with collision energy. Compared to pp collisions at [24, 27], the average increase of the and the yield per inelastic collision for all measured particle species is about and , respectively. This is in agreement with the increase of the average pseudorapidity density of charged particles produced in as the collision energy increases from to [54].
| Hadron species | (GeV/) | Extrapolated | |
| fraction (%) | |||
| Collision energy: | |||
| negl. | |||
| negl. | |||
| Collision energy: | |||
| negl. | |||
6 Discussion
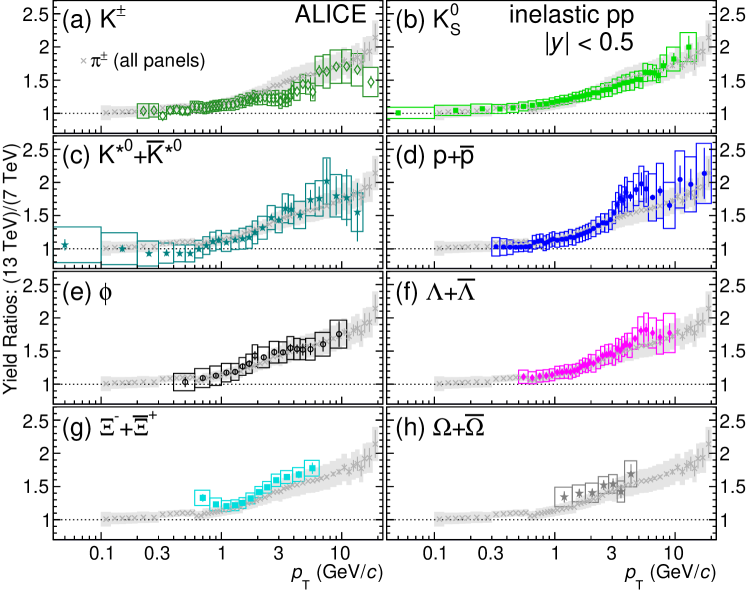
The transverse-momentum spectra reported in Fig. 3 indicate a progressive and significant evolution of the spectral shapes at high with increasing collision energy, which is similar for all particle species under study. This behavior is better visualized in Fig. 4 which shows the corresponding ratios of spectra at to those at [25, 27, 60]. The systematic uncertainties at both collision energies are largely uncorrelated and therefore their sum in quadrature is taken as the systematic uncertainty on the ratios. The uncertainty on the ratio due to normalization is .
The ratios for all hadron species are above unity, which is consistent with the observed increase in the pseudorapidity density of inclusive charged particles with increasing collision energy [54]. Furthermore, all the ratios exhibit a clear increase as a function of , indicating that hard processes become dominant in the production of high- particles. The dependence demonstrates that the spectral shapes are significantly harder at than at , which is also evident in the reduction of the slope parameter of the Lévy–Tsallis functions mentioned above. A universal shape — independent of within uncertainties — can be observed for most species (excluding and ) in the soft regime, . There is a hint that the ratio for may be enhanced above the one for in the region , although the enhancement is barely significant given the uncertainties. Such an enhancement would be consistent with the appearance of the baryon anomaly, an increased baryon-to-meson production ratio at intermediate transverse momenta (), observed in previous ALICE measurements of light-flavor hadron production [7, 65, 53, 25, 66]. It is worth noting that the hardening of the spectra with increasing collision energy has been reported in our earlier work for inclusive charged particles [54], although with different event selection criteria. There, a requirement of at least one charged particle with in was imposed, selecting events corresponding to 75% of the total inelastic cross section. In Ref. [54], the observed trend was found to be well captured by the PYTHIA and EPOS-LHC MC generators. In Sec. 6.5 the ratios of spectra of light-flavor hadrons at to those at are compared to results from these common event generators.
6.1 Scaling properties of hadron production
Two kinds of universal scaling of identified particle production have been observed in high energy pp collisions: transverse mass () scaling, which was originally seen in the lower region of hadron spectra, and scaling [67, 68, 69, 16, 70], observed in the higher region. New studies of the and scaling properties of light-flavor hadrons in pp collisions at and 13 TeV are discussed below.
6.1.1 Transverse mass () scaling
At ISR energies [71, 72] it has been observed that hadron spectra in pp collisions seem to follow an approximately universal curve after scaling with arbitrary normalization factors, an effect known as scaling. The STAR and PHENIX collaborations observed the breaking of -scaling in pp collisions at [21, 19], where a clear separation between baryon and meson spectra was observed for . In pp collisions at , the separation between the baryon and meson spectra seems to increase over the measured range. We, the ALICE collaboration, recently reported a similar breaking in pp collisions at [10]. The measurements in this paper allow this study to be extended to higher and to the highest LHC energies.
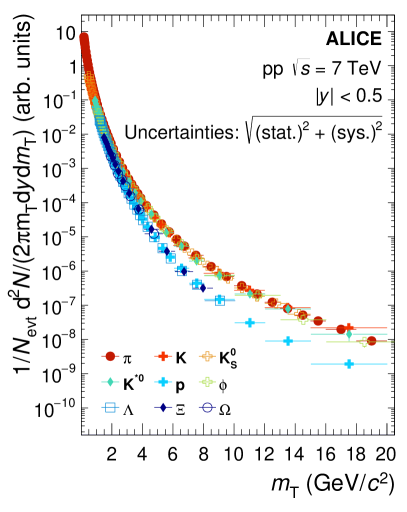
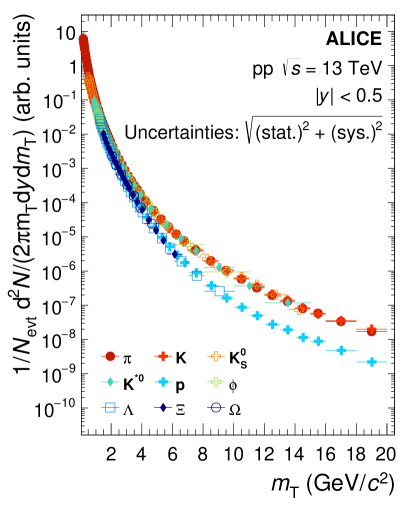
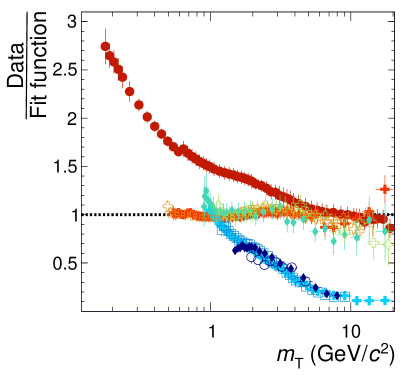
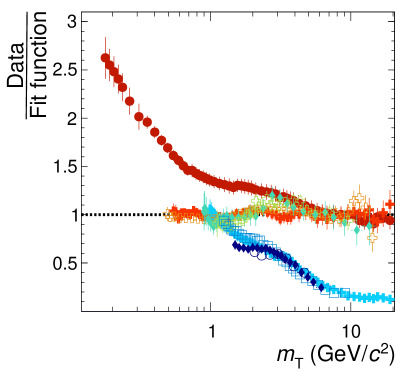
The charged kaon and (anti)proton spectra are fitted separately with a modified Hagedorn function of the form [22]. The meson spectra are then scaled by multiplicative factors so that their integrals over the measured ranges (or for the pions) match the integral of the kaon fit function. Similarly, the baryon spectra are scaled so that their integrals match the integral of the proton fit function over their measured ranges. The baryon spectra are further scaled so that all fits to the spectra have the same value at . Figure 5 shows the result of this study for pp collisions at [25, 27, 60] and 13 TeV, with the lower panels showing the ratios of the various scaled spectra to the fit function.
The pion spectra deviate from the trend followed by the other mesons for , which is likely due to feed-down from resonance decays [73]. The measured primary yield contains a significant contribution mostly from and decays, which, according to a recent study [23], affects the low- () part of the spectrum with increasing importance towards higher collision energies. This is the reason why the spectrum is used as the reference for the other mesons. A clear difference in the slope is observed between the baryon and meson spectra for . The separation between the meson and baryon spectra may be a reflection of the fact that, according to the Lund model of hadronization, meson formation via the fragmentation of strings requires the breakup to only a (quark, anti-quark) pair, while a baryon–antibaryon pair can be formed by the (diquark, anti-diquark) break up of the string [74, 75]. The separation between the (anti)proton and meson spectra becomes approximately constant for .
The breaking of scaling for pions at low as shown in Fig. 5 serves as a motivation to quantify the effect for different mesons. Following Refs. [23, 76], instead of using the spectra, the scaling law can be better studied practically as a function of , (note that the invariant yields are equal in terms of these variables). This requires changing the functional form of the invariant yield parameterization through the substitution , where is the particle mass. In doing so, the -differential invariant yield of a particle species can be obtained by scaling the parameterization of the yield of reference particle species . When both spectra are evaluated at the same transverse mass, , the yield for species is . Here, is a constant offset between the yields for species and , determined in the region where the spectral shapes for the two species are the same (i.e. at high ).
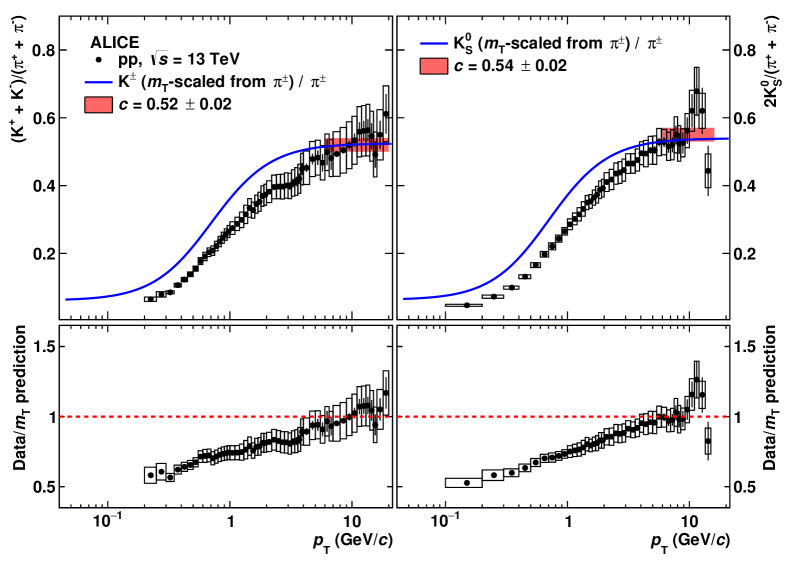
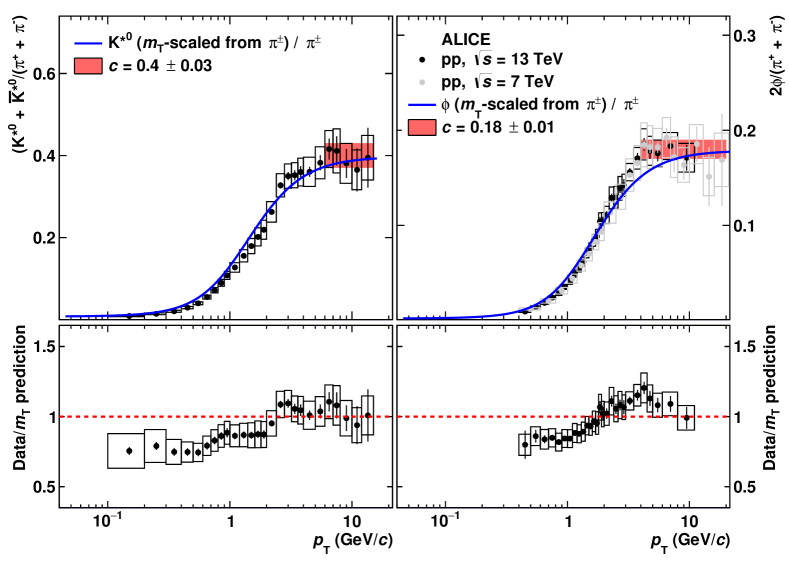
Charged pions are used as the reference species to test the scaling of the /, /, / and / particle ratios. The reference spectrum of is parameterized with a Lévy–Tsallis function, which is also used for the extraction of the -integrated yields and is found to describe the data within over its entire range. The scaling relation is then applied to the parametrized pion yield. The appropriate offset parameter is determined by fitting the measured particle ratios separately in the high- region where they saturate. The measured , , and () yield in pp collisions at 13 (7) TeV are fitted with a constant linear function in the range () with statistical and systematic uncertainties summed in quadrature. The resulting values for the various particle ratios are given in the legends of Fig. 6 and are shown as shaded bands in the region from which they are extracted. The reported widths of the bands correspond to the statistical uncertainties on obtained from the fits.
Along with the measured particle yield ratios, Fig. 6 shows the ratios of the -scaled parameterizations to the reference parametrization (solid blue lines) for the particle species in question. A significant deviation between the parameterized curves and the measured data is observed in the low-to-mid region () for the / and / ratios, which indicates the breaking of empirical scaling. In contrast, the -scaling predictions for the and ratios are notably closer to the measurements. In order to quantify the level of the scale breaking, the double ratios between the measured yield ratios and those based on the -scaling relation are evaluated. The double ratio values for below the threshold of (i.e., below the region used for the determination of the offset parameter ) decrease towards lower , deviating beyond for . The significance of the deviation from the scaling hypothesis is at , far from the threshold (note that adjacent bins have fully uncorrelated uncertainties). This further confirms the breaking of the empirical scaling relation for the quoted region.
6.1.2 scaling
The validity of empirical scaling is tested using the pp measurements reported here and those obtained at [7, 63] and [25, 60]. Due to the lack of a complete set of measurements of hadron yields at high at these three collision energies, only , , , and are used.
The invariant cross sections are determined from the measured invariant yields as , where is the inelastic cross section in pp collisions at [48]. The logarithm of the ratio of the invariant cross sections at two different collision energies, scaled by the logarithm of the ratio of the two collision energies is calculated. This quantity, denoted as in the following, depends on and [77]. It increases with in the low region, where particle production is dominated by soft processes, and appears to saturate in the high region.
The scaling exponents as a function of are extensively studied in Ref. [16] for unidentified hadrons and pions using the data from the E706 [78], PHENIX/ISR [79, 80], PHENIX [79, 81], UA1 [13] and CDF [12, 82] collaborations. The value of decreases towards the high- region. The measured mean exponent value was about in the range and reaches a value of in the range . In our measurements at , we are able to probe an even lower region.
Each distribution is fitted with a constant in the range to obtain the respective values for different energy combinations; these are then averaged to obtain the mean value for each particle species. The spectra for different particle species are scaled by . Within the quoted range, the best scaling is achieved with the exponents for , for , for , and for . The uncertainties on the values are the maximum observed deviations from the mean. The scaling exponents for the meson spectra are found to be consistent within systematic uncertainties, indicating that ratios of meson spectra at high are constant and attain similar values for all beam energies. Figure 7 shows the -scaled spectra for , , , and at collision energies of [7, 63], 7 TeV [25, 60] and 13 TeV.
These results suggest that identified particle yields at LHC energies follow scaling above . The measured scaling exponent at LHC energies is consistent with the -dependent trend of the exponent values [16]. The value of the parameter is found to be reduced at LHC energies compared to lower collision energies [79, 80, 78, 81, 12, 82, 13, 83, 84, 85, 86, 14], which is attributed to the increasing importance of hard scattering processes at higher , as suggested by Fig. 4.
It is also interesting to note that the exponent takes on larger values for baryons than for mesons in the investigated range. On the one hand, this is connected to the decrease of the ratio with increasing (see Fig. 11), as opposed to the constant behavior of the and ratios (see Fig. 6), which suggests that meson spectra are harder than baryon spectra in the corresponding range. On the other hand, as discussed in Ref. [16], the NLO pQCD predictions including higher-twist processes, i.e. in which the detected hadron can be exclusively produced in the hard subprocess reaction, there is evidence for the larger value of the exponent for baryons than for mesons. This is in contrast to the observations based on the leading-twist processes, where the exponent has only a weak dependence on hadron species.
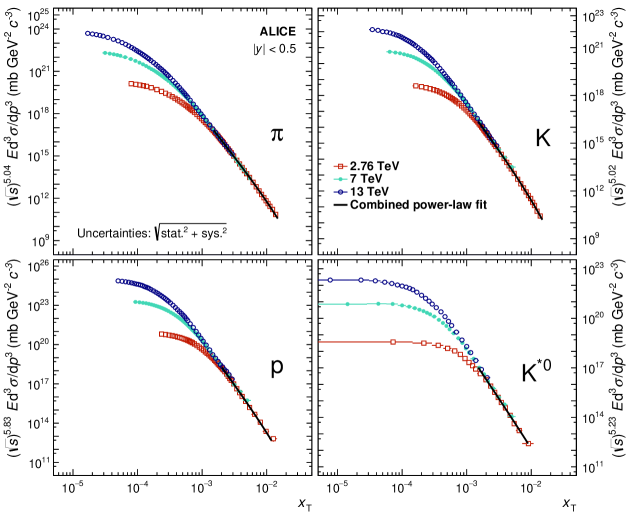
The quality of the scaling behavior is verified by combined fitting the differential cross sections with a power-law function of the form . Here, , , and are free parameters and the region below ( for protons) is excluded to avoid the dominant contribution from soft particle production, which does not follow scaling. The fits are of good quality with values in the range . In spite of the naive assumption of a power law function and the expected non-scaling behaviors discussed in Ref. [87], the measurements agree with the global power law fits within the region of overlap () within roughly , depending on particle species. The measurements from ALICE performed at are consistent over the accessible range () with empirical scaling and with measurements from pp collisions at 2.76 and 7 TeV.
6.2 Excitation functions
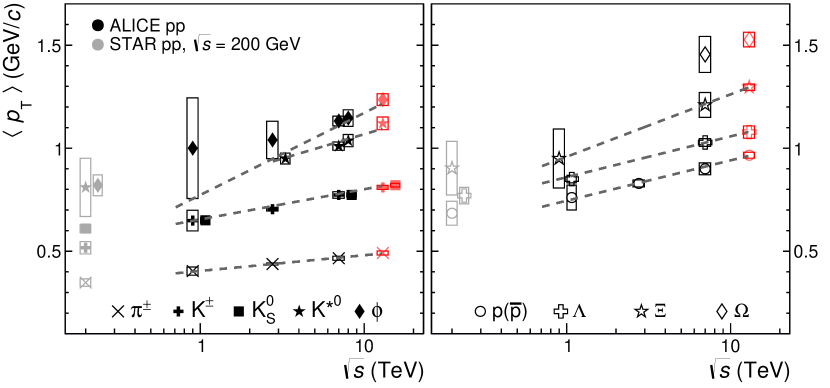
Figure 8 compiles the excitation functions of the average transverse momenta for light-flavor hadrons in inelastic pp collisions; the focus is on the LHC energy regime, but some RHIC results are also shown. As discussed in Ref. [89], the measurement of as a function of the collision energy is particularly useful in probing the saturation scale of the gluons inside the proton.
Results at midrapidity are presented from up to the top LHC energy , spanning nearly two orders of magnitude in center-of-mass energy. The average increases with ; it rises steeper for heavier particles, as seen in our earlier measurements at lower collision energies [24, 27, 26, 60]. The growth of with is attributed to the increasing importance of hard processes for higher collision energies. For single- and multi-strange hadrons, this observation is equivalent to the hardening of as the collision energy increases from 7 to 13 TeV for event classes with a similar , as reported in Ref. [28].
It is worth noting that the proton and have different values than the and , despite the similar masses of these particles. In particular, regardless of the considered , the average transverse momenta are greater for those resonances than for protons or , with the having the largest value. This clearly indicates a violation of mass ordering among these particles. It is noteworthy that in our measurements at as a function of charged-particle multiplicity, the difference in between and (and ) increases with multiplicity [53].
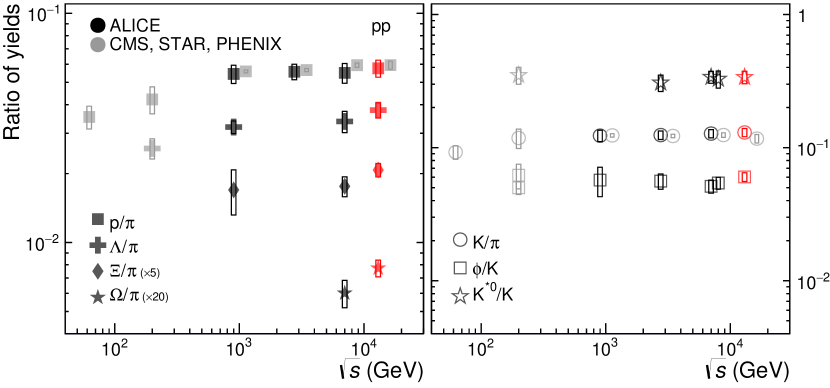
It is of particular importance to study the -integrated particle ratios as a function of collision energy, which might provide more information on hadron production mechanisms and their dependence on the collision energy or charged particle multiplicity. Given the observation of an increase in (multi-)strange hadron production as a function of multiplicity in pp collisions at [93], an increase in these yields with collision energy would also be expected. Figure 9 shows the ratios of particle yields to the yields of pions and kaons as a function of the collision energy; results from ALICE are compared with those from CMS [90] and with STAR [88, 91, 92] and PHENIX [20, 19] results from RHIC measured at 200 and 62.4 GeV. All the ratios except and appear to saturate in the LHC energy regime. For the and ratios, the relative increases are and , respectively; these are larger than the increase of the ratio, indicating that the strangeness content may control the magnitude of the increase in the yield ratios as the energy changes from 7 to 13 TeV.
The ratios of the and yields to those of charged kaons ( and ) do not exhibit any dependence on the collision energy. It is worth noting that there may be a decrease in the ratio in high-multiplicity pp collisions at [53]. In nuclear collisions, such a modification of resonance yields is often described as a consequence of scattering processes during the hadron gas phase of the collision system evolution.
6.3 Mass and baryon number effects on
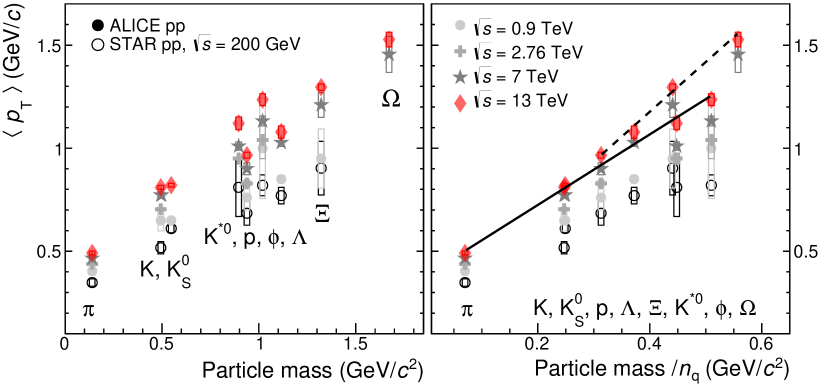
The average transverse momenta as a function of the particle mass are reported in the left panel of Fig. 10 for all light-flavor hadrons under study. The pp results are compared to our earlier measurements reported at lower collision energies [51, 24, 63, 58, 27, 7, 26], and to those measured at by the STAR Collaboration at RHIC [88, 91, 92]. At , two different linear trends can be observed for mesons and baryons separately, reflecting the violation of mass ordering in .
The observation of scale breaking between mesons and baryons as a function of the transverse mass, as discussed in Sec. 6.1.1, might lead to a violation of mass ordering in the average transverse momenta of the produced particles. For particles with similar masses (like , p, , and ), the meson spectra will be harder and the values greater in comparison to the baryons. Furthermore, the softer pion spectra could lead to a deviation of the pion values from the trend observed for the other mesons.
For TeV all the considered hadrons appear to exhibit scaling of with the reduced hadron mass , i.e. the mass normalized by the number of constituent quarks . This is observed in pp collisions at at ALICE and is shown in the right panel of Fig. 10. Reference [94] suggests that such scaling holds even for multi-strange baryons (, ) when the average pseudorapidity density of charged particles measured at mid-pseudorapidity is small ( [95]). At higher collision energies, the scaling behavior is obviously broken. Two separate trends are observed at : one for mesons (slope ) and one for baryons (slope ).
6.4 Yield ratios
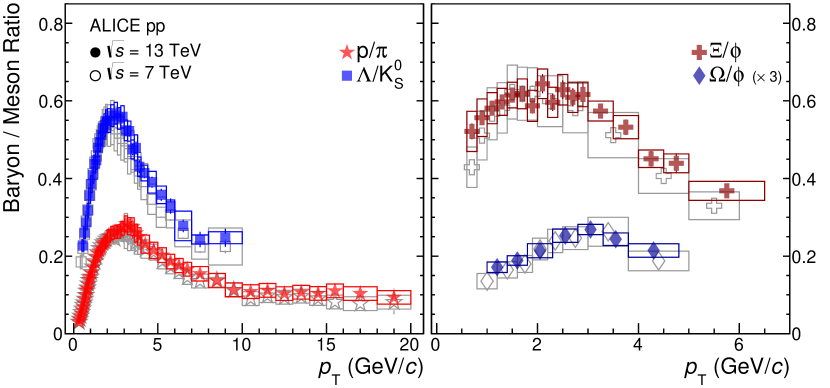
The ratios of hadron yields are investigated as a function of transverse momentum. This allows the spectra of different particle species, characterized by their unique mass and quark content, to be compared. Additionally, measurements at different are included, which helps to quantify any change in spectral shapes with . The uncertainties related to normalization cancel in these ratios. Figure 11 shows the , (left panel), , and (right panel) baryon-to-meson ratios as a function of at [25, 66, 27] (open symbols) and (full symbols). The left panel includes particle ratios with baryons containing zero () and one () strange valence quark, whereas the right panel collects ratios for hadrons with two () and three () strange quarks. The ratio compares hadrons that consist entirely of strange valence (anti)quarks: three for in and two for .
At low , all of the ratios increase with as expected from the higher observed for higher mass particles. In this regime, all of the ratios at show good agreement with those at within their systematic uncertainties, suggesting that the collision energy has no observable effect on the magnitude or shape of these yield ratios. This observation remains valid in the higher region. Within the systematic uncertainties the , , , and ratios are consistent for the two collision energies. It is noteworthy that the ratio at has a hint of enhancement at intermediate with respect to that at , however this is barely significant given the quoted uncertainties. From onward, the ratio becomes fairly constant for both collision energies.
6.5 Comparison to theoretical models
The high-precision measurements of the spectra reported in this paper are crucial inputs for the further tuning of Monte Carlo event generators and to improve the understanding of particle production mechanisms at the investigated collision energies. The measurements of the light-flavor hadron species presented above are compared with Monte Carlo model predictions based on general-purpose event generators: PYTHIA 6, PYTHIA 8, and EPOS-LHC.
The PYTHIA MC model contains a rigorous description of hard scatterings through pQCD, combined with phenomenological models for semi-hard/soft processes. The Perugia-2011 tune [96] for PYTHIA 6 and the Monash 2013 tune [31] for PYTHIA 8, which have different sets of parameters, are used. The PYTHIA 8 model uses an updated parameter set for Lund hadronization for light (and heavy) quarks. The widely-used Monash 2013 tune has an improved description of diffractive processes with respect to PYTHIA 6. Both sets of parameters have been obtained from recent (2011 and 2013) analyses of minimum bias, underlying event, and/or Drell–Yan measurements in pp collisions at ; the Monash 2013 tune was optimized to describe early data collected by the LHC experiments as well as lower energy data. Moreover, both versions of the model have strong final-state parton interactions implemented through different color reconnection models [97, 98]. As a consequence of the different energy evolution of the cutoff for multiple parton interactions, the Monash tune has larger multiple parton interaction activity at a given collision energy than the Perugia tune.
Conversely, the EPOS-LHC event generator (used with the CRMC package, version 1.5.4) invokes Gribov’s Reggeon Field Theory [99] for multiple scatterings; this formalism features collective hadronization with the core-corona mechanism [100]. After multiple scattering, the final-state partonic system consists mainly of longitudinal flux tubes that fragment into string segments. If the energy density from string segments is high enough, they fuse into the so-called “core” region, which then evolves hydrodynamically and eventually hadronizes to form the bulk part of the system. On the other hand, in the low-density region the strings expand and eventually break via the production of quark-antiquark pairs, which hadronize using the unmodified string fragmentation and form the “corona” region. The EPOS-LHC model uses recent data available from LHC, which helps in reproducing minimum bias results with transverse momenta up to a few GeV/.
Figure LABEL:fig:models shows the ratios of spectra extracted from the PYTHIA 8, PYTHIA 6, and EPOS-LHC models to the spectra measured at 7 and 13 TeV; the models give similar descriptions of the data at both energies. For the comparison of the measured data to the MC generators, the total fractional uncertainties of the data are shown, i.e. the statistical and systematic uncertainties of the measurement have been summed in quadrature. Both PYTHIA versions can generally describe the shapes of particle spectra with reasonable accuracy at intermediate (), but generally give softer spectra than observed at low (), although pions show the opposite trend, with a harder spectrum. This low- behavior is due to the fact that the MC generators are known to have difficulties at describing diffractive processes that play a role at very low [46]. In contrast, at high PYTHIA predicts harder spectra.
For the most abundant pions and charged kaons, the spectral shapes above are described significantly better by PYTHIA 8 than PYTHIA 6. For both and , the model-to-measured ratios for both PYTHIA versions are qualitatively similar, although PYTHIA 8 provides a better agreement with the data at mid-to-high than PYTHIA 6. These PYTHIA tunes describe the (anti)proton spectra best for . For single-strange () and multi-strange (, ) baryons, both of the PYTHIA tunes underestimate the amount of produced particles in almost the entire range. A similar discrepancy is observed for the case of PYTHIA 6 with the Perugia 2011 tune at [27] and with older tunes (D6T, ATLAS-CSC, Perugia 0) for the as reported for in Ref. [58]. It is worth noting that a discrepancy is also observed when the yields of , , and measured as a function of the charged-particle multiplicity [28] are compared to results from PYTHIA and EPOS-LHC. In all cases, the observed deviation becomes larger for hadrons with higher strange valence quark content. In Fig. LABEL:fig:models, the model underestimates the measured yields by a factor of two (four), although the discrepancy weakens for the towards higher values. For the meson (with zero net strangeness content), PYTHIA predicts yields within for , while at higher the measured yields and the PYTHIA values agree within uncertainties.
For , , and , the EPOS-LHC model predicts the spectral shape and normalization better than both of the PYTHIA tunes in the entire range. For the resonances and multi-strange baryons, EPOS-LHC gives harder spectra than the measured ones and performs better than PYTHIA at describing the yields of the multi-strange baryons. The EPOS-LHC model gives an accurate description for the baryon at both in shape and normalization, but deviates at higher . The model also describes the shape of the spectrum of baryons, which have higher strangeness content, but does not reproduce the yield. For the and (reported here for the first time at both 7 and 13 TeV), as well as and , the models give similar descriptions at both collision energies. However, at the agreement in normalization worsens for at intermediate , while EPOS-LHC predicts harder spectra at higher . For the meson, the EPOS-LHC model shows a marginal agreement with the data at low , and monotonically deviates from the measured spectrum as the increases.
Generally, the deviations of these models from the ALICE measurements are similar to those observed at lower , which were reported in Refs. [63, 26] for and and in Ref. [24] for , , and , although with a restricted reach for the latter three particle species. To study how the models follow the changes in spectral shapes and normalization as a function of as the energy increases from 7 to 13 TeV, Fig. 12 shows the double ratios: the ratios of the measured spectra at to (see Fig. 4) are divided by the same ratios obtained from MC models. The comparisons indicate that the models capture well the increase of the yields with for the mesons shown in panels (a) – (e); for , , and , such an observation between two distinct collision energies in this regime is reported here for the first time. For charged kaons, the models predict a more pronounced hardening with collision energy at high . The tension seen in the range originates from the different analysis techniques which were used to obtain the combined spectra for and at . Note that the normalization uncertainties at both energies are not included in the reported fractional uncertainties in the figure. For both and mesons, the similarity of the deviations of the PYTHIA model (though with a different tune) from ALICE measurements was seen in our earlier measurements at and , as reported in Ref. [63]. Panels (f) and (g) demonstrate that the PYTHIA 6 and EPOS-LHC models agree with the measurements of and , in contrast, PYTHIA 8 systematically underestimates the measured data for . For the multi-strange baryons (panels (h) and (i)), EPOS-LHC predicts the evolution of the spectra above the best, however the PYTHIA models also agree with the measured data for the baryons above . For baryons, the model description for PYTHIA 8 improves as the strangeness content increases.
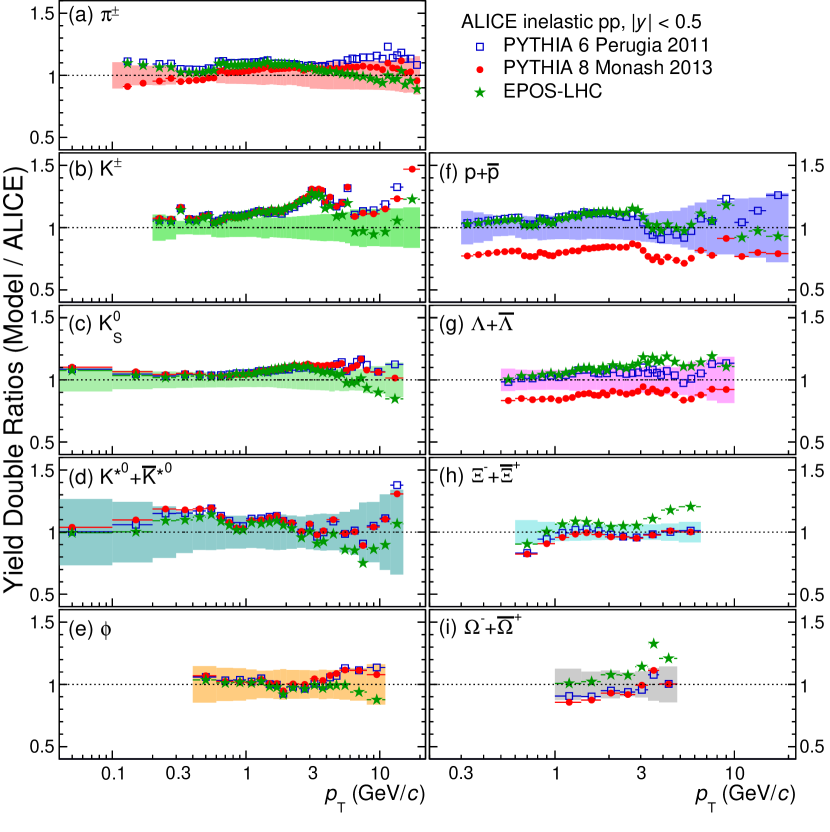
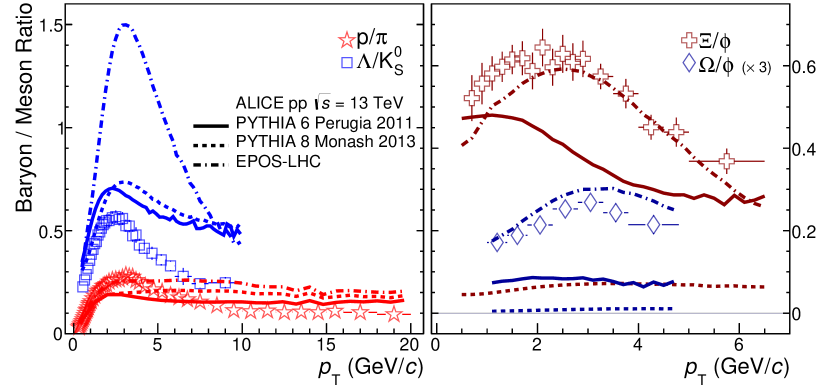
The relative impact of the hardening observed in the spectra in Fig. 4 for the various light-flavor hadrons is better seen in terms of the -dependent yield ratios of different particle species. The comparison of these ratios to MC models allows the different hadronization mechanisms implemented in the event generators to be tested. In Fig. 13 the -dependent baryon-to-meson ratios measured in pp collisions at and discussed in the previous section are shown as a function of and compared with the same MC models discussed above. The ratios for multi-strange baryons are better approximated by PYTHIA 6 than PYTHIA 8. As discussed for multi-strange baryon measurements performed by ALICE in pp collisions at [27], this is a consequence of the removal of the “popcorn” mechanism [101] in the Perugia 2011 tune which in turn suppresses baryon production by favoring soft quark-antiquark pairing.
Although the Perugia 2011 tune reproduces the shape of the baryon spectrum within roughly (as seen in Fig. LABEL:fig:models), the ratio given by this model has large deviations from the data for , the same region where the model meson spectrum has its largest disagreement with the measured data (about ). The Perugia 2011 tune better characterizes the evolution of the ratio than the Monash 2013 tune of PYTHIA 8 for . The EPOS-LHC model gives a good description of the shapes of the multi-strange baryon-to-meson ratios in the entire range of the measurements. The model predicts quantitatively the magnitude of the () ratio with reasonable accuracy above (below) . All three models approximate the evolution of the ratio qualitatively, but systematically over-predict its magnitude for the full range. The PYTHIA 8 and EPOS-LHC models predict the maximum of the ratio at higher values than measured. EPOS-LHC fails to reproduce the magnitude of the ratio, deviating from the measured ratio by about a factor of three at the maximum of the peak. The ratio is well described by the models in the low- region (), however they fail to follow the enhancement and depletion behavior seen in the region between and . All three models indicate a flattening behavior above , similar to what is seen in the measured data.
6.6 Comparison to pQCD calculations
The measured invariant cross sections are compared to next-to-leading order (NLO) perturbative QCD calculations using CT10NLO proton PDFs [102] with the DSS (de Florian, Sassot, and Stratmann) FF set [103, 3]. For charged pions a new version of the DSS FFs is available: the DSS14 FF [5] set. The NLO calculations are based on Ref. [104] which applies the same factorization scale value, for the factorization, renormalization and fragmentation scales. The variation of the scales to and gives an estimate of the theoretical uncertainty; the PDF uncertainties are negligible in comparison to the scale uncertainty. The rather large scale uncertainty observed at lower () stabilizes at for , which is the region where the NLO calculations are trustworthy and free from non-perturbative effects.
The production of , , and from hard scattering becomes dominated by gluon fragmentation with increasing collision energy in the range of the measurement [3]. The presented identified charged-hadron spectra can therefore help to constrain the gluon-to-charged-hadron fragmentation function [4] which is of crucial importance to a better description of the LHC charged-hadron data with NLO pQCD (see e.g. Ref. [105]). The invariant differential cross sections for , , and are shown in the left panel of Fig. 14 in comparison to NLO pQCD calculations. Since, to date, no calculation exists for the scale uncertainties of the DSS14, only the DSS FFs with the corresponding scale uncertainties are reported in the figure. In the right panel of Fig. 14 the ratios of the measured data and the NLO pQCD calculations to the Lévy–Tsallis fits of the , , and cross sections are shown. For the NLO pQCD calculations, employing the DSS14 FFs and using the DSS scale uncertainties, over-predict the measured pion cross section by up to a factor of approximately two, but describe the shape of the spectrum rather well. Similar discrepancies between NLO pQCD calculations and the measured cross sections have also been reported for the measurements of neutral pions () at and 8 TeV [106, 10] from ALICE, leaving room for future improvements in the calculations. It is worth noting that the published measurement at [106] adds important constraints for gluon FFs, which would help reduce the FF uncertainties. The NLO calculations describe charged kaons better than pions, which is reflected in the better agreement between the calculated cross section and with the measured data-to-fit ratio within the quoted uncertainties. The deviations between the NLO calculations and the data generally increase with . This increase is significantly stronger for protons, which deviate the most from the measured values for all scale choices. The NLO calculations significantly overestimate the measured data at high .
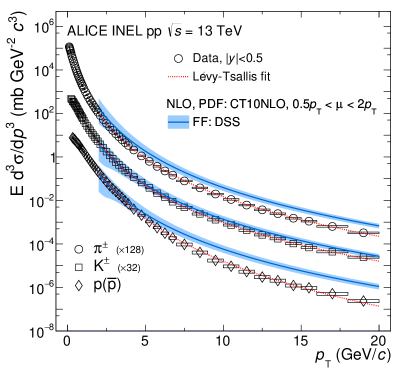
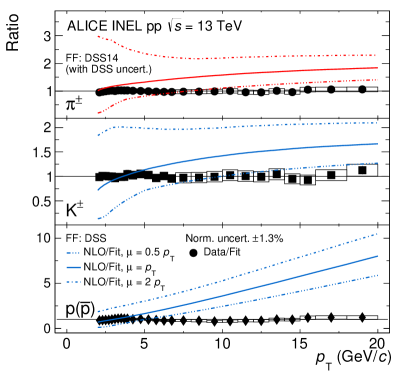
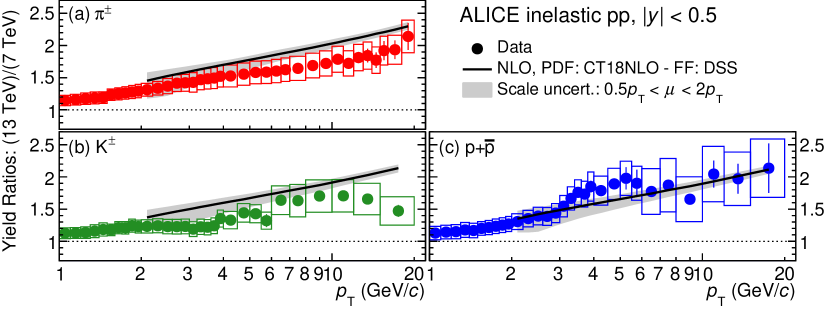
At lower () the discrepancy between the NLO calculations and the measured data is reduced for all particle species, but at the cost of an increase of the scale uncertainties. In this regime, soft parton interactions and resonance decays dominate particle production, which cannot be described within the framework of pQCD. This is also reflected in the shape of the distributions, which is not described by the calculation. The presented results show that independent fragmentation works rather well for mesons, in particular for , however for (anti)protons the spectral shape deviates towards the high- region.
Though the dependence of the cross sections at a given collision energy is not described well by the NLO calculations, the dependence of the ratios of the spectra at 7 [25] and 13 TeV is described better. Such a comparison is shown in Fig. 15, where the ratio of invariant yields in inelastic pp collisions at 13 TeV to those at 7 TeV is compared to the same ratio calculated using NLO pQCD. The agreement between the data and NLO calculations is notably improved compared to the NLO results for the spectra themselves. Taking a double ratio, where the ratios of the measured spectra at 13 and 7 TeV are divided by the ratios from the NLO pQCD calculations, the observed difference is below () for pions (kaons and protons).
7 Summary
The production of light-flavor hadrons at midrapidity was measured in inelastic pp collisions at . Additionally, single-particle distributions of , , and were also measured in inelastic pp collisions at . The presented measurements complement the existing ones at lower collision energies, allowing particle production to be studied over a wide range of . All distributions are observed to become harder for with increasing collision energy.
The -integrated hadron yields normalized to the pion yields saturate as a function of at LHC energies for the studied non-strange and single-strange hadrons. In contrast, a hint of an increase in the multi-strange hadron yields is apparent as increases from 7 to 13 TeV, the increase being more pronounced for baryons, which have the largest strange quark content among the studied hadrons. This observation is similar to our recent measurements performed as a function of charged-particle multiplicity in pp collisions at 7 and 13 TeV [53, 28].
A significant deviation from the empirical transverse mass scaling relation of the production cross sections between and and is observed for . Empirical scaling for , , , and is well satisfied (within roughly 20–40%) in the hard scattering region of particle production.
Next-to-leading order pQCD calculations performed at , using the DSS14 FFs for and the DSS FFs for and , over-predict the measured spectra both for charged pions and (anti)protons, suggesting that the fragmentation functions are not well tuned in the accessible kinematic domain of the presented measurement.
The measured hadron spectra are compared with results of Monte Carlo calculations. The results of PYTHIA calculations only partially describe the measured data, while the EPOS-LHC model describes several aspects of the data, notably strangeness production. However, further tuning of the models is warranted in order to improve their descriptions of the measured trends.
Acknowledgements
The ALICE Collaboration would like to thank all its engineers and technicians for their invaluable contributions to the construction of the experiment and the CERN accelerator teams for the outstanding performance of the LHC complex. The ALICE Collaboration gratefully acknowledges the resources and support provided by all Grid centres and the Worldwide LHC Computing Grid (WLCG) collaboration. The ALICE Collaboration acknowledges the following funding agencies for their support in building and running the ALICE detector: A. I. Alikhanyan National Science Laboratory (Yerevan Physics Institute) Foundation (ANSL), State Committee of Science and World Federation of Scientists (WFS), Armenia; Austrian Academy of Sciences, Austrian Science Fund (FWF): [M 2467-N36] and Nationalstiftung für Forschung, Technologie und Entwicklung, Austria; Ministry of Communications and High Technologies, National Nuclear Research Center, Azerbaijan; Conselho Nacional de Desenvolvimento Científico e Tecnológico (CNPq), Financiadora de Estudos e Projetos (Finep), Fundação de Amparo à Pesquisa do Estado de São Paulo (FAPESP) and Universidade Federal do Rio Grande do Sul (UFRGS), Brazil; Ministry of Education of China (MOEC) , Ministry of Science & Technology of China (MSTC) and National Natural Science Foundation of China (NSFC), China; Ministry of Science and Education and Croatian Science Foundation, Croatia; Centro de Aplicaciones Tecnológicas y Desarrollo Nuclear (CEADEN), Cubaenergía, Cuba; Ministry of Education, Youth and Sports of the Czech Republic, Czech Republic; The Danish Council for Independent Research | Natural Sciences, the VILLUM FONDEN and Danish National Research Foundation (DNRF), Denmark; Helsinki Institute of Physics (HIP), Finland; Commissariat à l’Energie Atomique (CEA) and Institut National de Physique Nucléaire et de Physique des Particules (IN2P3) and Centre National de la Recherche Scientifique (CNRS), France; Bundesministerium für Bildung und Forschung (BMBF) and GSI Helmholtzzentrum für Schwerionenforschung GmbH, Germany; General Secretariat for Research and Technology, Ministry of Education, Research and Religions, Greece; National Research, Development and Innovation Office, Hungary; Department of Atomic Energy Government of India (DAE), Department of Science and Technology, Government of India (DST), University Grants Commission, Government of India (UGC) and Council of Scientific and Industrial Research (CSIR), India; Indonesian Institute of Science, Indonesia; Centro Fermi - Museo Storico della Fisica e Centro Studi e Ricerche Enrico Fermi and Istituto Nazionale di Fisica Nucleare (INFN), Italy; Institute for Innovative Science and Technology , Nagasaki Institute of Applied Science (IIST), Japanese Ministry of Education, Culture, Sports, Science and Technology (MEXT) and Japan Society for the Promotion of Science (JSPS) KAKENHI, Japan; Consejo Nacional de Ciencia (CONACYT) y Tecnología, through Fondo de Cooperación Internacional en Ciencia y Tecnología (FONCICYT) and Dirección General de Asuntos del Personal Academico (DGAPA), Mexico; Nederlandse Organisatie voor Wetenschappelijk Onderzoek (NWO), Netherlands; The Research Council of Norway, Norway; Commission on Science and Technology for Sustainable Development in the South (COMSATS), Pakistan; Pontificia Universidad Católica del Perú, Peru; Ministry of Science and Higher Education, National Science Centre and WUT ID-UB, Poland; Korea Institute of Science and Technology Information and National Research Foundation of Korea (NRF), Republic of Korea; Ministry of Education and Scientific Research, Institute of Atomic Physics and Ministry of Research and Innovation and Institute of Atomic Physics, Romania; Joint Institute for Nuclear Research (JINR), Ministry of Education and Science of the Russian Federation, National Research Centre Kurchatov Institute, Russian Science Foundation and Russian Foundation for Basic Research, Russia; Ministry of Education, Science, Research and Sport of the Slovak Republic, Slovakia; National Research Foundation of South Africa, South Africa; Swedish Research Council (VR) and Knut & Alice Wallenberg Foundation (KAW), Sweden; European Organization for Nuclear Research, Switzerland; Suranaree University of Technology (SUT), National Science and Technology Development Agency (NSDTA) and Office of the Higher Education Commission under NRU project of Thailand, Thailand; Turkish Atomic Energy Agency (TAEK), Turkey; National Academy of Sciences of Ukraine, Ukraine; Science and Technology Facilities Council (STFC), United Kingdom; National Science Foundation of the United States of America (NSF) and United States Department of Energy, Office of Nuclear Physics (DOE NP), United States of America.
References
- [1] D. d’Enterria, R. Engel, T. Pierog, S. Ostapchenko, and K. Werner, “Constraints from the first LHC data on hadronic event generators for ultra-high energy cosmic-ray physics”, Astropart. Phys. 35 (2011) 98–113, arXiv:1101.5596 [astro-ph.HE].
- [2] J. C. Collins, D. E. Soper, and G. F. Sterman, “Factorization of Hard Processes in QCD”, Adv. Ser. Direct. High Energy Phys. 5 (1989) 1–91, arXiv:hep-ph/0409313 [hep-ph].
- [3] D. de Florian, R. Sassot, and M. Stratmann, “Global analysis of fragmentation functions for protons and charged hadrons”, Phys. Rev. D76 (2007) 074033, arXiv:0707.1506 [hep-ph].
- [4] D. d’Enterria, K. J. Eskola, I. Helenius, and H. Paukkunen, “Confronting current NLO parton fragmentation functions with inclusive charged-particle spectra at hadron colliders”, Nucl. Phys. B883 (2014) 615–628, arXiv:1311.1415 [hep-ph].
- [5] D. de Florian, R. Sassot, M. Epele, R. J. Hernández-Pinto, and M. Stratmann, “Parton-to-Pion Fragmentation Reloaded”, Phys. Rev. D91 no. 1, (2015) 014035, arXiv:1410.6027 [hep-ph].
- [6] D. de Florian, M. Epele, R. J. Hernández-Pinto, R. Sassot, and M. Stratmann, “Parton-to-Kaon Fragmentation Revisited”, Phys. Rev. D95 no. 9, (2017) 094019, arXiv:1702.06353 [hep-ph].
- [7] ALICE Collaboration, B. Abelev et al., “Production of charged pions, kaons and protons at large transverse momenta in pp and Pb–Pb collisions at =2.76 TeV”, Phys. Lett. B736 (2014) 196–207, arXiv:1401.1250 [nucl-ex].
- [8] ALICE Collaboration, S. Acharya et al., “Production of and mesons up to high transverse momentum in pp collisions at 2.76 TeV”, Eur. Phys. J. C77 no. 5, (2017) 339, arXiv:1702.00917 [hep-ex]. [Eur. Phys. J.C77,no.9,586(2017)].
- [9] ALICE Collaboration, K. Koch, “ and measurement with photon conversions in ALICE in proton-proton collisions at 7 TeV”, Nucl. Phys. A855 (2011) 281–284, arXiv:1103.2217 [hep-ex].
- [10] ALICE Collaboration, S. Acharya et al., “ and meson production in proton-proton collisions at TeV”, Eur. Phys. J. C78 no. 3, (2018) 263, arXiv:1708.08745 [hep-ex].
- [11] CDF Collaboration, T. Aaltonen et al., “Measurement of Particle Production and Inclusive Differential Cross Sections in Collisions at TeV”, Phys. Rev. D79 (2009) 112005, arXiv:0904.1098 [hep-ex]. [Erratum: Phys. Rev.D82,119903(2010)].
- [12] CDF Collaboration, F. Abe et al., “Transverse Momentum Distributions of Charged Particles Produced in Interactions at GeV and 1800 GeV”, Phys. Rev. Lett. 61 (1988) 1819.
- [13] UA1 Collaboration, C. Albajar et al., “A Study of the General Characteristics of Collisions at = 0.2 TeV to 0.9 TeV”, Nucl. Phys. B335 (1990) 261–287.
- [14] STAR Collaboration, J. Adams et al., “Identified hadron spectra at large transverse momentum in p+p and d+Au collisions at 200 GeV”, Phys. Lett. B637 (2006) 161–169, arXiv:nucl-ex/0601033 [nucl-ex].
- [15] CMS Collaboration, S. Chatrchyan et al., “Charged particle transverse momentum spectra in collisions at and 7 TeV”, JHEP 08 (2011) 086, arXiv:1104.3547 [hep-ex].
- [16] F. Arleo, S. J. Brodsky, D. S. Hwang, and A. M. Sickles, “Higher-Twist Dynamics in Large Transverse Momentum Hadron Production”, Phys. Rev. Lett. 105 (2010) 062002, arXiv:0911.4604 [hep-ph].
- [17] R. Hagedorn, “Statistical thermodynamics of strong interactions at high energies”, Nuovo Cimento, Suppl. 3 no. CERN-TH-520, (1965) 147–186. http://cds.cern.ch/record/346206.
- [18] G. Gatoff and C. Y. Wong, “Origin of the soft spectra”, Phys. Rev. D46 (1992) 997–1006.
- [19] PHENIX Collaboration, A. Adare et al., “Measurement of neutral mesons in p+p collisions at = 200 GeV and scaling properties of hadron production”, Phys. Rev. D83 (2011) 052004, arXiv:1005.3674 [hep-ex].
- [20] PHENIX Collaboration, A. Adare et al., “Identified charged hadron production in collisions at and 62.4 GeV”, Phys. Rev. C83 (2011) 064903, arXiv:1102.0753 [nucl-ex].
- [21] STAR Collaboration, B. I. Abelev et al., “Strange particle production in p+p collisions at 200 GeV”, Phys. Rev. C75 (2007) 064901, arXiv:nucl-ex/0607033 [nucl-ex].
- [22] P. K. Khandai, P. Sett, P. Shukla, and V. Singh, “Transverse Mass Spectra and Scaling of Hadrons at RHIC and LHC Energies”, arXiv:1205.0648 [hep-ph].
- [23] L. Altenkämper, F. Bock, C. Loizides, and N. Schmidt, “Applicability of transverse mass scaling in hadronic collisions at energies available at the CERN Large Hadron Collider”, Phys. Rev. C96 no. 6, (2017) 064907, arXiv:1710.01933 [hep-ph].
- [24] ALICE Collaboration, J. Adam et al., “Measurement of pion, kaon and proton production in proton-proton collisions at TeV”, Eur. Phys. J. C75 no. 5, (2015) 226, arXiv:1504.00024 [nucl-ex].
- [25] ALICE Collaboration, J. Adam et al., “Multiplicity dependence of charged pion, kaon, and (anti)proton production at large transverse momentum in p-Pb collisions at = 5.02 TeV”, Phys. Lett. B760 (2016) 720–735, arXiv:1601.03658 [nucl-ex].
- [26] ALICE Collaboration, B. Abelev et al., “Production of and in collisions at TeV”, Eur. Phys. J. C72 (2012) 2183, arXiv:1208.5717 [hep-ex].
- [27] ALICE Collaboration, B. Abelev et al., “Multi-strange baryon production in collisions at TeV with ALICE”, Phys. Lett. B712 (2012) 309–318, arXiv:1204.0282 [nucl-ex].
- [28] ALICE Collaboration, S. Acharya et al., “Multiplicity dependence of (multi-)strange hadron production in proton-proton collisions at = 13 TeV”, Eur. Phys. J. C 80 no. 2, (2020) 167, arXiv:1908.01861 [nucl-ex].
- [29] ALICE Collaboration, S. Acharya et al., “Charged-particle production as a function of multiplicity and transverse spherocity in pp collisions at and 13 TeV”, Eur. Phys. J. C79 no. 10, (2019) 857, arXiv:1905.07208 [nucl-ex].
- [30] P. Z. Skands, “Tuning Monte Carlo generators: The Perugia tunes”, Phys. Rev. D82 (2010) 074018, arXiv:1005.3457 [hep-ph].
- [31] P. Z. Skands, S. Carrazza, and J. Rojo, “Tuning PYTHIA 8.1: the Monash 2013 tune”, Eur. Phys. J. C74 (2014) 3024, arXiv:1404.5630 [hep-ph].
- [32] T. Pierog, I. Karpenko, J. M. Katzy, E. Yatsenko, and K. Werner, “EPOS LHC: Test of collective hadronization with data measured at the CERN Large Hadron Collider”, Phys. Rev. C92 no. 3, (2015) 034906, arXiv:1306.0121 [hep-ph].
- [33] ALICE Collaboration, K. Aamodt et al., “The ALICE experiment at the CERN LHC”, J. Instrum. 3 (2008) S08002.
- [34] ALICE Collaboration, B. Abelev et al., “Performance of the ALICE Experiment at the CERN LHC”, Int. J. Mod. Phys. A29 (2014) 1430044, arXiv:1402.4476 [nucl-ex].
- [35] ALICE Collaboration, E. Abbas et al., “Performance of the ALICE VZERO system”, JINST 8 (2013) P10016, arXiv:1306.3130 [nucl-ex].
- [36] ALICE Collaboration, “The ALICE definition of primary particles”,. https://cds.cern.ch/record/2270008.
- [37] ALICE Collaboration, K. Aamodt et al., “Alignment of the ALICE Inner Tracking System with cosmic-ray tracks”, J. Inst. 5 (2010) P03003, arXiv:1001.0502 [physics.ins-det].
- [38] J. Alme et al., “The ALICE TPC, a large 3-dimensional tracking device with fast readout for ultra-high multiplicity events”, Nucl. Instrum. Methods Phys. Res. A 622 (2010) 316–67.
- [39] A. N. Akindinov et al., “Particle identification with the ALICE TOF detector at very high particle multiplicity”, Eur. Phys. J. C 32 (2004) s165–77.
- [40] A. Akindinov et al., “The ALICE Time-Of-Flight system: Construction, assembly and quality tests”, Nuovo Cimento B 124 (2009) 235.
- [41] A. Akindinov et al., “Results of the ALICE time-of-flight detector from the 2009 cosmic-ray data taking”, Eur. Phys. J. C 68 (2010) 601.
- [42] ALICE Collaboration, J. Adam et al., “Pseudorapidity and transverse-momentum distributions of charged particles in proton-proton collisions at TeV”, Phys. Lett. B753 (2016) 319–329, arXiv:1509.08734 [nucl-ex].
- [43] R. Brun, F. Carminati, and S. Giani, GEANT – Detector Description and Simulation Tool, CERN Program Library Long Writeup W5013. CERN, Geneva, 1994.
- [44] Particle Data Group Collaboration, M. Tanabashi et al., “Review of particle physics”, Phys. Rev. D 98 (Aug, 2018) 030001.
- [45] G. Battistoni, S. Muraro, P. R. Sala, F. Cerutti, A. Ferrari, S. Roesler, A. Fasso, and J. Ranft, “The FLUKA code: Description and benchmarking”, AIP Conf. Proc. 896 (2007) 31–49. [,31(2007)].
- [46] ALICE Collaboration, B. Abelev et al., “Measurement of inelastic, single- and double-diffraction cross sections in proton–proton collisions at the LHC with ALICE”, Eur. Phys. J. C73 no. 6, (2013) 2456, arXiv:1208.4968 [hep-ex].
- [47] ALICE Collaboration, J. Adam et al., “ALICE luminosity determination for pp collisions at TeV”, ALICE-PUBLIC-2016-002 (2016) 1.
- [48] C. Loizides, J. Kamin, and D. d’Enterria, “Improved Monte Carlo Glauber predictions at present and future nuclear colliders”, Phys. Rev. C97 no. 5, (2018) 054910, arXiv:1710.07098 [nucl-ex]. [erratum: Phys. Rev.C99,no.1,019901(2019)].
- [49] ALICE Collaboration, B. Abelev et al., “Centrality dependence of , K, p production in Pb-Pb collisions at = 2.76 TeV”, Phys. Rev. C88 (2013) 044910, arXiv:1303.0737 [hep-ex].
- [50] ALICE Collaboration, J. Adam et al., “Production of and in p–Pb collisions at TeV”, Eur. Phys. J. C76 (2016) 245, arXiv:1601.07868 [nucl-ex].
- [51] ALICE Collaboration, K. Aamodt et al., “Production of pions, kaons and protons in collisions at GeV with ALICE at the LHC”, Eur. Phys. J. C71 (2011) 1655, arXiv:1101.4110 [hep-ex].
- [52] ALICE Collaboration, J. Adam et al., “Centrality dependence of the nuclear modification factor of charged pions, kaons, and protons in Pb-Pb collisions at TeV”, Phys. Rev. C93 no. 3, (2016) 034913, arXiv:1506.07287 [nucl-ex].
- [53] ALICE Collaboration, S. Acharya et al., “Multiplicity dependence of light-flavor hadron production in pp collisions at = 7 TeV”, Phys. Rev. C99 no. 2, (2019) 024906, arXiv:1807.11321 [nucl-ex].
- [54] ALICE Collaboration, J. Adam et al., “Pseudorapidity and transverse-momentum distributions of charged particles in proton-proton collisions at 13 TeV”, Phys. Lett. B753 (2016) 319–329, arXiv:1509.08734 [nucl-ex].
- [55] ALICE Collaboration, J. Adam et al., “Particle identification in ALICE: a Bayesian approach”, Eur. Phys. J. Plus 131 no. 5, (2016) 168, arXiv:1602.01392 [physics.data-an].
- [56] A. Akindinov et al., “Performance of the ALICE Time-Of-Flight detector at the LHC”, Eur. Phys. J. Plus 128 (2013) 44.
- [57] ALICE Collaboration, D. Di Bari, “The pattern recognition method for the CsI-RICH detector in ALICE”, Nucl. Instrum. Meth. A502 (2003) 300–304.
- [58] ALICE Collaboration, K. Aamodt et al., “Strange particle production in proton-proton collisions at 0.9 TeV with ALICE at the LHC”, Eur. Phys. J. C71 (2011) 1594, arXiv:1012.3257 [hep-ex].
- [59] ALICE Collaboration, B. Abelev et al., “ and production in Pb–Pb collisions at TeV”, Phys. Rev. C 91 (2015) 024609, arXiv:1404.0495 [nucl-ex].
- [60] ALICE Collaboration, S. Acharya et al., “ and production at midrapidity in pp collisions at = 8 TeV”, Phys. Rev. C 102 no. 2, (2020) 024912, arXiv:1910.14410 [nucl-ex].
- [61] C. Tsallis, “Possible Generalization of Boltzmann-Gibbs Statistics”, J. Statist. Phys. 52 (1988) 479–487.
- [62] STAR Collaboration, B. I. Abelev et al., “Strange particle production in p+p collisions at = 200 GeV”, Phys. Rev. C 75 (2007) 064901, arXiv:nucl-ex/0607033.
- [63] ALICE Collaboration, J. Adam et al., “K and meson production at high transverse momentum in pp and Pb-Pb collisions at = 2.76 TeV”, Phys. Rev. C95 no. 6, (2017) 064606, arXiv:1702.00555 [nucl-ex].
- [64] E. Schnedermann, J. Sollfrank, and U. Heinz, “Thermal phenomenology of hadrons from 200 GeV S+S collisions”, Phys. Rev. C 48 (1993) 2462–75.
- [65] ALICE Collaboration, S. Acharya et al., “Production of charged pions, kaons, and (anti-)protons in Pb-Pb and inelastic collisions at = 5.02 TeV”, Phys. Rev. C 101 no. 4, (2020) 044907, arXiv:1910.07678 [nucl-ex].
- [66] ALICE Collaboration, B. Abelev et al., “ and production in Pb-Pb collisions at = 2.76 TeV”, Phys. Rev. Lett. 111 (2013) 222301, arXiv:1307.5530 [nucl-ex].
- [67] S. J. Brodsky and G. R. Farrar, “Scaling Laws at Large Transverse Momentum”, Phys. Rev. Lett. 31 (1973) 1153–1156.
- [68] D. Sivers, S. J. Brodsky, and R. Blankenbecler, “Large transverse momentum processes”, Physics Reports 23 no. 1, (1976) 1 – 121. http://www.sciencedirect.com/science/article/pii/0370157376900156.
- [69] R. Blankenbecler, S. J. Brodsky, and J. F. Gunion, “Magnitude of large-transverse-momentum cross sections”, Phys. Rev. D 18 (Aug, 1978) 900–926. https://link.aps.org/doi/10.1103/PhysRevD.18.900.
- [70] F. Arleo, D. d’Enterria, and A. S. Yoon, “Single-inclusive production of large- charged particles in hadronic collisions at TeV energies and perturbative QCD predictions”, JHEP 06 (2010) 035, arXiv:1003.2963 [hep-ph].
- [71] British-Scandinavian Collaboration, B. Alper et al., “The Production of Charged Particles with High Transverse Momentum in Proton-Proton Collisions at the CERN ISR”, Nucl. Phys. B87 (1975) 19.
- [72] UA5 Collaboration, K. Alpgard et al., “First Results on Complete Events from p anti-p Collisions at the Center-of-Mass Energy of 540 GeV”, Phys. Lett. 107B (1981) 310–314.
- [73] K. Jiang, Y. Zhu, W. Liu, H. Chen, C. Li, L. Ruan, Z. Tang, Z. Xu, and Z. Xu, “Onset of radial flow in p+p collisions”, Phys. Rev. C91 no. 2, (2015) 024910, arXiv:1312.4230 [nucl-ex].
- [74] B. Andersson, G. Gustafson, and T. Sjöstrand, “A model for baryon production in quark and gluon jets”, Nuclear Physics B 197 no. 1, (1982) 45 – 54. http://www.sciencedirect.com/science/article/pii/0550321382901535.
- [75] B. Andersson, G. Gustafson, and T. Sjöstrand, “Baryon Production in Jet Fragmentation and Decay”, Phys. Scripta 32 (1985) 574.
- [76] J. Schaffner-Bielich, D. Kharzeev, L. D. McLerran, and R. Venugopalan, “Generalized scaling of the transverse mass spectrum at the relativistic heavy-ion collider”, Nucl. Phys. A705 (2002) 494–507, arXiv:nucl-th/0108048 [nucl-th].
- [77] R. F. Cahalan, K. A. Geer, J. Kogut, and L. Susskind, “Asymptotic freedom and the absence of vector-gluon exchange in wide-angle hadronic collisions”, Phys. Rev. D 11 (Mar, 1975) 1199–1212. https://link.aps.org/doi/10.1103/PhysRevD.11.1199.
- [78] Fermilab E706 Collaboration, L. Apanasevich et al., “Production of and mesons at large transverse momenta in and Interactions at 530 and 800 GeV/c.”, Phys. Rev. D 68 (2003) 052001, arXiv:hep-ex/0204031.
- [79] PHENIX Collaboration, A. Adare et al., “Inclusive cross section and double helicity asymmetry for production in collisions at GeV”, Phys. Rev. D 79 (2009) 012003, arXiv:0810.0701 [hep-ex].
- [80] F. Arleo and D. d’Enterria, “Single inclusive pion -spectra in proton-proton collisions at GeV: Data versus perturbative QCD calculations”, Phys. Rev. D 78 (2008) 094004, arXiv:0807.1252 [hep-ph].
- [81] PHENIX Collaboration, A. Adare et al., “Inclusive cross-section and double helicity asymmetry for production in collisions at 200 GeV: Implications for the polarized gluon distribution in the proton”, Phys. Rev. D 76 (2007) 051106, arXiv:0704.3599 [hep-ex].
- [82] CDF Collaboration, D. Acosta et al., “Soft and Hard Interactions in Collisions at 1800 and 630 GeV”, Phys. Rev. D 65 (2002) 072005.
- [83] British-Scandinavian Collaboration, B. Alper et al., “Production Spectra of , K±, p± at Large Angles in Proton Proton Collisions in the CERN Intersecting Storage Rings”, Nucl. Phys. B 100 (1975) 237–290.
- [84] PHENIX Collaboration, S. Adler et al., “Mid-rapidity neutral pion production in proton proton collisions at = 200 GeV”, Phys. Rev. Lett. 91 (2003) 241803, arXiv:hep-ex/0304038.
- [85] D. Antreasyan, J. Cronin, H. J. Frisch, M. Shochet, L. Kluberg, P. Piroue, and R. L. Sumner, “Production of Hadrons at Large Transverse Momentum in 200 GeV, 300 GeV and 400 GeV p-p and p-nucleus collisions”, Phys. Rev. D 19 (1979) 764–778.
- [86] UA2 Collaboration, M. Banner et al., “Inclusive Production at the {CERN} Collider”, Phys. Lett. B 115 (1982) 59–64.
- [87] R. Sassot, P. Zurita, and M. Stratmann, “Inclusive Hadron Production in the CERN-LHC Era”, Phys. Rev. D82 (2010) 074011, arXiv:1008.0540 [hep-ph].
- [88] STAR Collaboration, B. I. Abelev et al., “Systematic Measurements of Identified Particle Spectra in pp, d+Au and Au+Au Collisions from STAR”, Phys. Rev. C79 (2009) 034909, arXiv:0808.2041 [nucl-ex].
- [89] D. d’Enterria and T. Pierog, “Global properties of proton-proton collisions at = 100 TeV”, JHEP 08 (2016) 170, arXiv:1604.08536 [hep-ph].
- [90] CMS Collaboration, A. M. Sirunyan et al., “Measurement of charged pion, kaon, and proton production in proton-proton collisions at ”, Phys. Rev. D 96 (Dec, 2017) 112003. https://link.aps.org/doi/10.1103/PhysRevD.96.112003.
- [91] STAR Collaboration, J. Adams et al., “ meson production in Au+Au and p+p collisions at = 200 GeV”, Phys. Lett. B612 (2005) 181–189, arXiv:nucl-ex/0406003 [nucl-ex].
- [92] STAR Collaboration, J. Adams et al., “Identified particle distributions in pp and Au+Au collisions at = 200 GeV”, Phys. Rev. Lett. 92 (2004) 112301, arXiv:nucl-ex/0310004 [nucl-ex].
- [93] ALICE Collaboration, J. Adam et al., “Enhanced production of multi-strange hadrons in high-multiplicity proton-proton collisions”, Nature Phys. 13 (2017) 535–539, arXiv:1606.07424 [nucl-ex].
- [94] A. Ortiz, “Mean scaling with at the LHC: Absence of (hydro) flow in small systems?”, Nucl. Phys. A943 (2015) 9–17, arXiv:1506.00584 [hep-ph].
- [95] ALICE Collaboration, K. Aamodt et al., “Charged-particle multiplicity measurement in proton-proton collisions at TeV with ALICE at LHC”, Eur. Phys. J. C68 (2010) 345–354, arXiv:1004.3514 [hep-ex].
- [96] P. Z. Skands, “Tuning Monte Carlo Generators: The Perugia Tunes”, Phys. Rev. D82 (2010) 074018, arXiv:1005.3457 [hep-ph].
- [97] P. Z. Skands and D. Wicke, “Non-perturbative QCD effects and the top mass at the Tevatron”, Eur. Phys. J. C52 (2007) 133–140, arXiv:hep-ph/0703081 [HEP-PH].
- [98] T. Sjöstrand, S. Ask, J. R. Christiansen, R. Corke, N. Desai, P. Ilten, S. Mrenna, S. Prestel, C. O. Rasmussen, and P. Z. Skands, “An Introduction to PYTHIA 8.2”, Comput. Phys. Commun. 191 (2015) 159–177, arXiv:1410.3012 [hep-ph].
- [99] G. A. Schuler and T. Sjöstrand, “Hadronic diffractive cross sections and the rise of the total cross section”, Phys. Rev. D49 (1994) 2257–2267.
- [100] K. Werner, “Core-corona separation in ultrarelativistic heavy ion collisions”, Phys. Rev. Lett. 98 (2007) 152301, arXiv:0704.1270 [nucl-th].
- [101] P. Eden and G. Gustafson, “Baryon production in the string fragmentation picture”, Z. Phys. C75 (1997) 41–49, arXiv:hep-ph/9606454 [hep-ph].
- [102] H.-L. Lai, M. Guzzi, J. Huston, Z. Li, P. M. Nadolsky, J. Pumplin, and C. P. Yuan, “New parton distributions for collider physics”, Phys. Rev. D82 (2010) 074024, arXiv:1007.2241 [hep-ph].
- [103] D. de Florian, R. Sassot, and M. Stratmann, “Global analysis of fragmentation functions for pions and kaons and their uncertainties”, Phys. Rev. D75 (2007) 114010, arXiv:hep-ph/0703242 [HEP-PH].
- [104] I. Helenius, K. J. Eskola, H. Honkanen, and C. A. Salgado, “Impact-Parameter Dependent Nuclear Parton Distribution Functions: EPS09s and EKS98s and Their Applications in Nuclear Hard Processes”, JHEP 07 (2012) 073, arXiv:1205.5359 [hep-ph].
- [105] ALICE Collaboration, B. Abelev et al., “Energy Dependence of the Transverse Momentum Distributions of Charged Particles in pp Collisions Measured by ALICE”, Eur. Phys. J. C73 no. 12, (2013) 2662, arXiv:1307.1093 [nucl-ex].
- [106] ALICE Collaboration, B. Abelev et al., “Neutral pion and meson production in proton-proton collisions at TeV and TeV”, Phys. Lett. B717 (2012) 162–172, arXiv:1205.5724 [hep-ex].
Appendix A The ALICE Collaboration
S. Acharya\Irefnorg141&D. Adamová\Irefnorg94&A. Adler\Irefnorg73&J. Adolfsson\Irefnorg80&M.M. Aggarwal\Irefnorg99&G. Aglieri Rinella\Irefnorg33&M. Agnello\Irefnorg30&N. Agrawal\Irefnorg10,\Irefnorg53&Z. Ahammed\Irefnorg141&S. Ahmad\Irefnorg16&S.U. Ahn\Irefnorg75&A. Akindinov\Irefnorg91&M. Al-Turany\Irefnorg106&S.N. Alam\Irefnorg141&D.S.D. Albuquerque\Irefnorg122&D. Aleksandrov\Irefnorg87&B. Alessandro\Irefnorg58&H.M. Alfanda\Irefnorg6&R. Alfaro Molina\Irefnorg70&B. Ali\Irefnorg16&Y. Ali\Irefnorg14&A. Alici\Irefnorg10,\Irefnorg26,\Irefnorg53&A. Alkin\Irefnorg2&J. Alme\Irefnorg21&T. Alt\Irefnorg67&L. Altenkamper\Irefnorg21&I. Altsybeev\Irefnorg112&M.N. Anaam\Irefnorg6&C. Andrei\Irefnorg47&D. Andreou\Irefnorg33&H.A. Andrews\Irefnorg110&A. Andronic\Irefnorg144&M. Angeletti\Irefnorg33&V. Anguelov\Irefnorg103&C. Anson\Irefnorg15&T. Antičić\Irefnorg107&F. Antinori\Irefnorg56&P. Antonioli\Irefnorg53&N. Apadula\Irefnorg79&L. Aphecetche\Irefnorg114&H. Appelshäuser\Irefnorg67&S. Arcelli\Irefnorg26&R. Arnaldi\Irefnorg58&M. Arratia\Irefnorg79&I.C. Arsene\Irefnorg20&M. Arslandok\Irefnorg103&A. Augustinus\Irefnorg33&R. Averbeck\Irefnorg106&S. Aziz\Irefnorg77&M.D. Azmi\Irefnorg16&A. Badalà\Irefnorg55&Y.W. Baek\Irefnorg40&S. Bagnasco\Irefnorg58&X. Bai\Irefnorg106&R. Bailhache\Irefnorg67&R. Bala\Irefnorg100&A. Balbino\Irefnorg30&A. Baldisseri\Irefnorg137&M. Ball\Irefnorg42&S. Balouza\Irefnorg104&D. Banerjee\Irefnorg3&R. Barbera\Irefnorg27&L. Barioglio\Irefnorg25&G.G. Barnaföldi\Irefnorg145&L.S. Barnby\Irefnorg93&V. Barret\Irefnorg134&P. Bartalini\Irefnorg6&K. Barth\Irefnorg33&E. Bartsch\Irefnorg67&F. Baruffaldi\Irefnorg28&N. Bastid\Irefnorg134&S. Basu\Irefnorg143&G. Batigne\Irefnorg114&B. Batyunya\Irefnorg74&D. Bauri\Irefnorg48&J.L. Bazo Alba\Irefnorg111&I.G. Bearden\Irefnorg88&C. Beattie\Irefnorg146&C. Bedda\Irefnorg62&N.K. Behera\Irefnorg60&I. Belikov\Irefnorg136&A.D.C. Bell Hechavarria\Irefnorg144&F. Bellini\Irefnorg33&R. Bellwied\Irefnorg125&V. Belyaev\Irefnorg92&G. Bencedi\Irefnorg145&S. Beole\Irefnorg25&A. Bercuci\Irefnorg47&Y. Berdnikov\Irefnorg97&D. Berenyi\Irefnorg145&R.A. Bertens\Irefnorg130&D. Berzano\Irefnorg58&M.G. Besoiu\Irefnorg66&L. Betev\Irefnorg33&A. Bhasin\Irefnorg100&I.R. Bhat\Irefnorg100&M.A. Bhat\Irefnorg3&H. Bhatt\Irefnorg48&B. Bhattacharjee\Irefnorg41&A. Bianchi\Irefnorg25&L. Bianchi\Irefnorg25&N. Bianchi\Irefnorg51&J. Bielčík\Irefnorg36&J. Bielčíková\Irefnorg94&A. Bilandzic\Irefnorg104,\Irefnorg117&G. Biro\Irefnorg145&R. Biswas\Irefnorg3&S. Biswas\Irefnorg3&J.T. Blair\Irefnorg119&D. Blau\Irefnorg87&C. Blume\Irefnorg67&G. Boca\Irefnorg139&F. Bock\Irefnorg33,\Irefnorg95&A. Bogdanov\Irefnorg92&S. Boi\Irefnorg23&L. Boldizsár\Irefnorg145&A. Bolozdynya\Irefnorg92&M. Bombara\Irefnorg37&G. Bonomi\Irefnorg140&H. Borel\Irefnorg137&A. Borissov\Irefnorg92&H. Bossi\Irefnorg146&E. Botta\Irefnorg25&L. Bratrud\Irefnorg67&P. Braun-Munzinger\Irefnorg106&M. Bregant\Irefnorg121&M. Broz\Irefnorg36&E. Bruna\Irefnorg58&G.E. Bruno\Irefnorg105&M.D. Buckland\Irefnorg127&D. Budnikov\Irefnorg108&H. Buesching\Irefnorg67&S. Bufalino\Irefnorg30&O. Bugnon\Irefnorg114&P. Buhler\Irefnorg113&P. Buncic\Irefnorg33&Z. Buthelezi\Irefnorg71,\Irefnorg131&J.B. Butt\Irefnorg14&J.T. Buxton\Irefnorg96&S.A. Bysiak\Irefnorg118&D. Caffarri\Irefnorg89&A. Caliva\Irefnorg106&E. Calvo Villar\Irefnorg111&R.S. Camacho\Irefnorg44&P. Camerini\Irefnorg24&A.A. Capon\Irefnorg113&F. Carnesecchi\Irefnorg10,\Irefnorg26&R. Caron\Irefnorg137&J. Castillo Castellanos\Irefnorg137&A.J. Castro\Irefnorg130&E.A.R. Casula\Irefnorg54&F. Catalano\Irefnorg30&C. Ceballos Sanchez\Irefnorg52&P. Chakraborty\Irefnorg48&S. Chandra\Irefnorg141&W. Chang\Irefnorg6&S. Chapeland\Irefnorg33&M. Chartier\Irefnorg127&S. Chattopadhyay\Irefnorg141&S. Chattopadhyay\Irefnorg109&A. Chauvin\Irefnorg23&C. Cheshkov\Irefnorg135&B. Cheynis\Irefnorg135&V. Chibante Barroso\Irefnorg33&D.D. Chinellato\Irefnorg122&S. Cho\Irefnorg60&P. Chochula\Irefnorg33&T. Chowdhury\Irefnorg134&P. Christakoglou\Irefnorg89&C.H. Christensen\Irefnorg88&P. Christiansen\Irefnorg80&T. Chujo\Irefnorg133&C. Cicalo\Irefnorg54&L. Cifarelli\Irefnorg10,\Irefnorg26&F. Cindolo\Irefnorg53&G. Clai\Irefnorg53\AreforgI&J. Cleymans\Irefnorg124&F. Colamaria\Irefnorg52&D. Colella\Irefnorg52&A. Collu\Irefnorg79&M. Colocci\Irefnorg26&M. Concas\Irefnorg58\AreforgII&G. Conesa Balbastre\Irefnorg78&Z. Conesa del Valle\Irefnorg77&G. Contin\Irefnorg24,\Irefnorg59&J.G. Contreras\Irefnorg36&T.M. Cormier\Irefnorg95&Y. Corrales Morales\Irefnorg25&P. Cortese\Irefnorg31&M.R. Cosentino\Irefnorg123&F. Costa\Irefnorg33&S. Costanza\Irefnorg139&P. Crochet\Irefnorg134&E. Cuautle\Irefnorg68&P. Cui\Irefnorg6&L. Cunqueiro\Irefnorg95&D. Dabrowski\Irefnorg142&T. Dahms\Irefnorg104,\Irefnorg117&A. Dainese\Irefnorg56&F.P.A. Damas\Irefnorg114,\Irefnorg137&M.C. Danisch\Irefnorg103&A. Danu\Irefnorg66&D. Das\Irefnorg109&I. Das\Irefnorg109&P. Das\Irefnorg85&P. Das\Irefnorg3&S. Das\Irefnorg3&A. Dash\Irefnorg85&S. Dash\Irefnorg48&S. De\Irefnorg85&A. De Caro\Irefnorg29&G. de Cataldo\Irefnorg52&J. de Cuveland\Irefnorg38&A. De Falco\Irefnorg23&D. De Gruttola\Irefnorg10&N. De Marco\Irefnorg58&S. De Pasquale\Irefnorg29&S. Deb\Irefnorg49&H.F. Degenhardt\Irefnorg121&K.R. Deja\Irefnorg142&A. Deloff\Irefnorg84&S. Delsanto\Irefnorg25,\Irefnorg131&W. Deng\Irefnorg6&D. Devetak\Irefnorg106&P. Dhankher\Irefnorg48&D. Di Bari\Irefnorg32&A. Di Mauro\Irefnorg33&R.A. Diaz\Irefnorg8&T. Dietel\Irefnorg124&P. Dillenseger\Irefnorg67&Y. Ding\Irefnorg6&R. Divià\Irefnorg33&D.U. Dixit\Irefnorg19&Ø. Djuvsland\Irefnorg21&U. Dmitrieva\Irefnorg61&A. Dobrin\Irefnorg66&B. Dönigus\Irefnorg67&O. Dordic\Irefnorg20&A.K. Dubey\Irefnorg141&A. Dubla\Irefnorg106&S. Dudi\Irefnorg99&M. Dukhishyam\Irefnorg85&P. Dupieux\Irefnorg134&R.J. Ehlers\Irefnorg95,\Irefnorg146&V.N. Eikeland\Irefnorg21&D. Elia\Irefnorg52&E. Epple\Irefnorg146&B. Erazmus\Irefnorg114&F. Erhardt\Irefnorg98&A. Erokhin\Irefnorg112&M.R. Ersdal\Irefnorg21&B. Espagnon\Irefnorg77&G. Eulisse\Irefnorg33&D. Evans\Irefnorg110&S. Evdokimov\Irefnorg90&L. Fabbietti\Irefnorg104,\Irefnorg117&M. Faggin\Irefnorg28&J. Faivre\Irefnorg78&F. Fan\Irefnorg6&A. Fantoni\Irefnorg51&M. Fasel\Irefnorg95&P. Fecchio\Irefnorg30&A. Feliciello\Irefnorg58&G. Feofilov\Irefnorg112&A. Fernández Téllez\Irefnorg44&A. Ferrero\Irefnorg137&A. Ferretti\Irefnorg25&A. Festanti\Irefnorg33&V.J.G. Feuillard\Irefnorg103&J. Figiel\Irefnorg118&S. Filchagin\Irefnorg108&D. Finogeev\Irefnorg61&F.M. Fionda\Irefnorg21&G. Fiorenza\Irefnorg52&F. Flor\Irefnorg125&S. Foertsch\Irefnorg71&P. Foka\Irefnorg106&S. Fokin\Irefnorg87&E. Fragiacomo\Irefnorg59&U. Frankenfeld\Irefnorg106&U. Fuchs\Irefnorg33&C. Furget\Irefnorg78&A. Furs\Irefnorg61&M. Fusco Girard\Irefnorg29&J.J. Gaardhøje\Irefnorg88&M. Gagliardi\Irefnorg25&A.M. Gago\Irefnorg111&A. Gal\Irefnorg136&C.D. Galvan\Irefnorg120&P. Ganoti\Irefnorg83&C. Garabatos\Irefnorg106&E. Garcia-Solis\Irefnorg11&K. Garg\Irefnorg114&C. Gargiulo\Irefnorg33&A. Garibli\Irefnorg86&K. Garner\Irefnorg144&P. Gasik\Irefnorg104,\Irefnorg117&E.F. Gauger\Irefnorg119&M.B. Gay Ducati\Irefnorg69&M. Germain\Irefnorg114&J. Ghosh\Irefnorg109&P. Ghosh\Irefnorg141&S.K. Ghosh\Irefnorg3&M. Giacalone\Irefnorg26&P. Gianotti\Irefnorg51&P. Giubellino\Irefnorg58,\Irefnorg106&P. Giubilato\Irefnorg28&P. Glässel\Irefnorg103&A. Gomez Ramirez\Irefnorg73&V. Gonzalez\Irefnorg106,\Irefnorg143&L.H. González-Trueba\Irefnorg70&S. Gorbunov\Irefnorg38&L. Görlich\Irefnorg118&A. Goswami\Irefnorg48&S. Gotovac\Irefnorg34&V. Grabski\Irefnorg70&L.K. Graczykowski\Irefnorg142&K.L. Graham\Irefnorg110&L. Greiner\Irefnorg79&A. Grelli\Irefnorg62&C. Grigoras\Irefnorg33&V. Grigoriev\Irefnorg92&A. Grigoryan\Irefnorg1&S. Grigoryan\Irefnorg74&O.S. Groettvik\Irefnorg21&F. Grosa\Irefnorg30&J.F. Grosse-Oetringhaus\Irefnorg33&R. Grosso\Irefnorg106&R. Guernane\Irefnorg78&M. Guittiere\Irefnorg114&K. Gulbrandsen\Irefnorg88&T. Gunji\Irefnorg132&A. Gupta\Irefnorg100&R. Gupta\Irefnorg100&I.B. Guzman\Irefnorg44&R. Haake\Irefnorg146&M.K. Habib\Irefnorg106&C. Hadjidakis\Irefnorg77&H. Hamagaki\Irefnorg81&G. Hamar\Irefnorg145&M. Hamid\Irefnorg6&R. Hannigan\Irefnorg119&M.R. Haque\Irefnorg62,\Irefnorg85&A. Harlenderova\Irefnorg106&J.W. Harris\Irefnorg146&A. Harton\Irefnorg11&J.A. Hasenbichler\Irefnorg33&H. Hassan\Irefnorg95&D. Hatzifotiadou\Irefnorg10,\Irefnorg53&P. Hauer\Irefnorg42&S. Hayashi\Irefnorg132&S.T. Heckel\Irefnorg67,\Irefnorg104&E. Hellbär\Irefnorg67&H. Helstrup\Irefnorg35&A. Herghelegiu\Irefnorg47&T. Herman\Irefnorg36&E.G. Hernandez\Irefnorg44&G. Herrera Corral\Irefnorg9&F. Herrmann\Irefnorg144&K.F. Hetland\Irefnorg35&H. Hillemanns\Irefnorg33&C. Hills\Irefnorg127&B. Hippolyte\Irefnorg136&B. Hohlweger\Irefnorg104&J. Honermann\Irefnorg144&D. Horak\Irefnorg36&A. Hornung\Irefnorg67&S. Hornung\Irefnorg106&R. Hosokawa\Irefnorg15&P. Hristov\Irefnorg33&C. Huang\Irefnorg77&C. Hughes\Irefnorg130&P. Huhn\Irefnorg67&T.J. Humanic\Irefnorg96&H. Hushnud\Irefnorg109&L.A. Husova\Irefnorg144&N. Hussain\Irefnorg41&S.A. Hussain\Irefnorg14&D. Hutter\Irefnorg38&J.P. Iddon\Irefnorg33,\Irefnorg127&R. Ilkaev\Irefnorg108&H. Ilyas\Irefnorg14&M. Inaba\Irefnorg133&G.M. Innocenti\Irefnorg33&M. Ippolitov\Irefnorg87&A. Isakov\Irefnorg94&M.S. Islam\Irefnorg109&M. Ivanov\Irefnorg106&V. Ivanov\Irefnorg97&V. Izucheev\Irefnorg90&B. Jacak\Irefnorg79&N. Jacazio\Irefnorg33&P.M. Jacobs\Irefnorg79&S. Jadlovska\Irefnorg116&J. Jadlovsky\Irefnorg116&S. Jaelani\Irefnorg62&C. Jahnke\Irefnorg121&M.J. Jakubowska\Irefnorg142&M.A. Janik\Irefnorg142&T. Janson\Irefnorg73&M. Jercic\Irefnorg98&O. Jevons\Irefnorg110&M. Jin\Irefnorg125&F. Jonas\Irefnorg95,\Irefnorg144&P.G. Jones\Irefnorg110&J. Jung\Irefnorg67&M. Jung\Irefnorg67&A. Jusko\Irefnorg110&P. Kalinak\Irefnorg63&A. Kalweit\Irefnorg33&V. Kaplin\Irefnorg92&S. Kar\Irefnorg6&A. Karasu Uysal\Irefnorg76&O. Karavichev\Irefnorg61&T. Karavicheva\Irefnorg61&P. Karczmarczyk\Irefnorg33&E. Karpechev\Irefnorg61&U. Kebschull\Irefnorg73&R. Keidel\Irefnorg46&M. Keil\Irefnorg33&B. Ketzer\Irefnorg42&Z. Khabanova\Irefnorg89&A.M. Khan\Irefnorg6&S. Khan\Irefnorg16&S.A. Khan\Irefnorg141&A. Khanzadeev\Irefnorg97&Y. Kharlov\Irefnorg90&A. Khatun\Irefnorg16&A. Khuntia\Irefnorg118&B. Kileng\Irefnorg35&B. Kim\Irefnorg60&B. Kim\Irefnorg133&D. Kim\Irefnorg147&D.J. Kim\Irefnorg126&E.J. Kim\Irefnorg72&H. Kim\Irefnorg17,\Irefnorg147&J. Kim\Irefnorg147&J.S. Kim\Irefnorg40&J. Kim\Irefnorg103&J. Kim\Irefnorg147&J. Kim\Irefnorg72&M. Kim\Irefnorg103&S. Kim\Irefnorg18&T. Kim\Irefnorg147&T. Kim\Irefnorg147&S. Kirsch\Irefnorg67&I. Kisel\Irefnorg38&S. Kiselev\Irefnorg91&A. Kisiel\Irefnorg142&J.L. Klay\Irefnorg5&C. Klein\Irefnorg67&J. Klein\Irefnorg33,\Irefnorg58&S. Klein\Irefnorg79&C. Klein-Bösing\Irefnorg144&M. Kleiner\Irefnorg67&A. Kluge\Irefnorg33&M.L. Knichel\Irefnorg33&A.G. Knospe\Irefnorg125&C. Kobdaj\Irefnorg115&M.K. Köhler\Irefnorg103&T. Kollegger\Irefnorg106&A. Kondratyev\Irefnorg74&N. Kondratyeva\Irefnorg92&E. Kondratyuk\Irefnorg90&J. Konig\Irefnorg67&P.J. Konopka\Irefnorg33&L. Koska\Irefnorg116&O. Kovalenko\Irefnorg84&V. Kovalenko\Irefnorg112&M. Kowalski\Irefnorg118&I. Králik\Irefnorg63&A. Kravčáková\Irefnorg37&L. Kreis\Irefnorg106&M. Krivda\Irefnorg63,\Irefnorg110&F. Krizek\Irefnorg94&K. Krizkova Gajdosova\Irefnorg36&M. Krüger\Irefnorg67&E. Kryshen\Irefnorg97&M. Krzewicki\Irefnorg38&A.M. Kubera\Irefnorg96&V. Kučera\Irefnorg33,\Irefnorg60&C. Kuhn\Irefnorg136&P.G. Kuijer\Irefnorg89&L. Kumar\Irefnorg99&S. Kundu\Irefnorg85&P. Kurashvili\Irefnorg84&A. Kurepin\Irefnorg61&A.B. Kurepin\Irefnorg61&A. Kuryakin\Irefnorg108&S. Kushpil\Irefnorg94&J. Kvapil\Irefnorg110&M.J. Kweon\Irefnorg60&J.Y. Kwon\Irefnorg60&Y. Kwon\Irefnorg147&S.L. La Pointe\Irefnorg38&P. La Rocca\Irefnorg27&Y.S. Lai\Irefnorg79&R. Langoy\Irefnorg129&K. Lapidus\Irefnorg33&A. Lardeux\Irefnorg20&P. Larionov\Irefnorg51&E. Laudi\Irefnorg33&R. Lavicka\Irefnorg36&T. Lazareva\Irefnorg112&R. Lea\Irefnorg24&L. Leardini\Irefnorg103&J. Lee\Irefnorg133&S. Lee\Irefnorg147&F. Lehas\Irefnorg89&S. Lehner\Irefnorg113&J. Lehrbach\Irefnorg38&R.C. Lemmon\Irefnorg93&I. León Monzón\Irefnorg120&E.D. Lesser\Irefnorg19&M. Lettrich\Irefnorg33&P. Lévai\Irefnorg145&X. Li\Irefnorg12&X.L. Li\Irefnorg6&J. Lien\Irefnorg129&R. Lietava\Irefnorg110&B. Lim\Irefnorg17&V. Lindenstruth\Irefnorg38&A. Lindner\Irefnorg47&S.W. Lindsay\Irefnorg127&C. Lippmann\Irefnorg106&M.A. Lisa\Irefnorg96&A. Liu\Irefnorg19&J. Liu\Irefnorg127&S. Liu\Irefnorg96&W.J. Llope\Irefnorg143&I.M. Lofnes\Irefnorg21&V. Loginov\Irefnorg92&C. Loizides\Irefnorg95&P. Loncar\Irefnorg34&J.A. Lopez\Irefnorg103&X. Lopez\Irefnorg134&E. López Torres\Irefnorg8&J.R. Luhder\Irefnorg144&M. Lunardon\Irefnorg28&G. Luparello\Irefnorg59&Y.G. Ma\Irefnorg39&A. Maevskaya\Irefnorg61&M. Mager\Irefnorg33&S.M. Mahmood\Irefnorg20&T. Mahmoud\Irefnorg42&A. Maire\Irefnorg136&R.D. Majka\Irefnorg146&M. Malaev\Irefnorg97&Q.W. Malik\Irefnorg20&L. Malinina\Irefnorg74\AreforgIII&D. Mal’Kevich\Irefnorg91&P. Malzacher\Irefnorg106&G. Mandaglio\Irefnorg55&V. Manko\Irefnorg87&F. Manso\Irefnorg134&V. Manzari\Irefnorg52&Y. Mao\Irefnorg6&M. Marchisone\Irefnorg135&J. Mareš\Irefnorg65&G.V. Margagliotti\Irefnorg24&A. Margotti\Irefnorg53&J. Margutti\Irefnorg62&A. Marín\Irefnorg106&C. Markert\Irefnorg119&M. Marquard\Irefnorg67&C.D. Martin\Irefnorg24&N.A. Martin\Irefnorg103&P. Martinengo\Irefnorg33&J.L. Martinez\Irefnorg125&M.I. Martínez\Irefnorg44&G. Martínez García\Irefnorg114&S. Masciocchi\Irefnorg106&M. Masera\Irefnorg25&A. Masoni\Irefnorg54&L. Massacrier\Irefnorg77&E. Masson\Irefnorg114&A. Mastroserio\Irefnorg52,\Irefnorg138&A.M. Mathis\Irefnorg104,\Irefnorg117&O. Matonoha\Irefnorg80&P.F.T. Matuoka\Irefnorg121&A. Matyja\Irefnorg118&C. Mayer\Irefnorg118&F. Mazzaschi\Irefnorg25&M. Mazzilli\Irefnorg52&M.A. Mazzoni\Irefnorg57&A.F. Mechler\Irefnorg67&F. Meddi\Irefnorg22&Y. Melikyan\Irefnorg61,\Irefnorg92&A. Menchaca-Rocha\Irefnorg70&C. Mengke\Irefnorg6&E. Meninno\Irefnorg29,\Irefnorg113&M. Meres\Irefnorg13&S. Mhlanga\Irefnorg124&Y. Miake\Irefnorg133&L. Micheletti\Irefnorg25&D.L. Mihaylov\Irefnorg104&K. Mikhaylov\Irefnorg74,\Irefnorg91&A.N. Mishra\Irefnorg68&D. Miśkowiec\Irefnorg106&A. Modak\Irefnorg3&N. Mohammadi\Irefnorg33&A.P. Mohanty\Irefnorg62&B. Mohanty\Irefnorg85&M. Mohisin Khan\Irefnorg16\AreforgIV&Z. Moravcova\Irefnorg88&C. Mordasini\Irefnorg104&D.A. Moreira De Godoy\Irefnorg144&L.A.P. Moreno\Irefnorg44&I. Morozov\Irefnorg61&A. Morsch\Irefnorg33&T. Mrnjavac\Irefnorg33&V. Muccifora\Irefnorg51&E. Mudnic\Irefnorg34&D. Mühlheim\Irefnorg144&S. Muhuri\Irefnorg141&J.D. Mulligan\Irefnorg79&M.G. Munhoz\Irefnorg121&R.H. Munzer\Irefnorg67&H. Murakami\Irefnorg132&S. Murray\Irefnorg124&L. Musa\Irefnorg33&J. Musinsky\Irefnorg63&C.J. Myers\Irefnorg125&J.W. Myrcha\Irefnorg142&B. Naik\Irefnorg48&R. Nair\Irefnorg84&B.K. Nandi\Irefnorg48&R. Nania\Irefnorg10,\Irefnorg53&E. Nappi\Irefnorg52&M.U. Naru\Irefnorg14&A.F. Nassirpour\Irefnorg80&C. Nattrass\Irefnorg130&R. Nayak\Irefnorg48&T.K. Nayak\Irefnorg85&S. Nazarenko\Irefnorg108&A. Neagu\Irefnorg20&R.A. Negrao De Oliveira\Irefnorg67&L. Nellen\Irefnorg68&S.V. Nesbo\Irefnorg35&G. Neskovic\Irefnorg38&D. Nesterov\Irefnorg112&L.T. Neumann\Irefnorg142&B.S. Nielsen\Irefnorg88&S. Nikolaev\Irefnorg87&S. Nikulin\Irefnorg87&V. Nikulin\Irefnorg97&F. Noferini\Irefnorg10,\Irefnorg53&P. Nomokonov\Irefnorg74&J. Norman\Irefnorg78,\Irefnorg127&N. Novitzky\Irefnorg133&P. Nowakowski\Irefnorg142&A. Nyanin\Irefnorg87&J. Nystrand\Irefnorg21&M. Ogino\Irefnorg81&A. Ohlson\Irefnorg80,\Irefnorg103&J. Oleniacz\Irefnorg142&A.C. Oliveira Da Silva\Irefnorg130&M.H. Oliver\Irefnorg146&C. Oppedisano\Irefnorg58&A. Ortiz Velasquez\Irefnorg68&A. Oskarsson\Irefnorg80&J. Otwinowski\Irefnorg118&K. Oyama\Irefnorg81&Y. Pachmayer\Irefnorg103&V. Pacik\Irefnorg88&D. Pagano\Irefnorg140&G. Paić\Irefnorg68&J. Pan\Irefnorg143&S. Panebianco\Irefnorg137&P. Pareek\Irefnorg49,\Irefnorg141&J. Park\Irefnorg60&J.E. Parkkila\Irefnorg126&S. Parmar\Irefnorg99&S.P. Pathak\Irefnorg125&B. Paul\Irefnorg23&H. Pei\Irefnorg6&T. Peitzmann\Irefnorg62&X. Peng\Irefnorg6&L.G. Pereira\Irefnorg69&H. Pereira Da Costa\Irefnorg137&D. Peresunko\Irefnorg87&G.M. Perez\Irefnorg8&Y. Pestov\Irefnorg4&V. Petráček\Irefnorg36&M. Petrovici\Irefnorg47&R.P. Pezzi\Irefnorg69&S. Piano\Irefnorg59&M. Pikna\Irefnorg13&P. Pillot\Irefnorg114&O. Pinazza\Irefnorg33,\Irefnorg53&L. Pinsky\Irefnorg125&C. Pinto\Irefnorg27&S. Pisano\Irefnorg10,\Irefnorg51&D. Pistone\Irefnorg55&M. Płoskoń\Irefnorg79&M. Planinic\Irefnorg98&F. Pliquett\Irefnorg67&M.G. Poghosyan\Irefnorg95&B. Polichtchouk\Irefnorg90&N. Poljak\Irefnorg98&A. Pop\Irefnorg47&S. Porteboeuf-Houssais\Irefnorg134&V. Pozdniakov\Irefnorg74&S.K. Prasad\Irefnorg3&R. Preghenella\Irefnorg53&F. Prino\Irefnorg58&C.A. Pruneau\Irefnorg143&I. Pshenichnov\Irefnorg61&M. Puccio\Irefnorg33&J. Putschke\Irefnorg143&L. Quaglia\Irefnorg25&R.E. Quishpe\Irefnorg125&S. Ragoni\Irefnorg110&S. Raha\Irefnorg3&S. Rajput\Irefnorg100&J. Rak\Irefnorg126&A. Rakotozafindrabe\Irefnorg137&L. Ramello\Irefnorg31&F. Rami\Irefnorg136&S.A.R. Ramirez\Irefnorg44&R. Raniwala\Irefnorg101&S. Raniwala\Irefnorg101&S.S. Räsänen\Irefnorg43&R. Rath\Irefnorg49&V. Ratza\Irefnorg42&I. Ravasenga\Irefnorg89&K.F. Read\Irefnorg95,\Irefnorg130&A.R. Redelbach\Irefnorg38&K. Redlich\Irefnorg84\AreforgV&A. Rehman\Irefnorg21&P. Reichelt\Irefnorg67&F. Reidt\Irefnorg33&X. Ren\Irefnorg6&R. Renfordt\Irefnorg67&Z. Rescakova\Irefnorg37&K. Reygers\Irefnorg103&V. Riabov\Irefnorg97&T. Richert\Irefnorg80,\Irefnorg88&M. Richter\Irefnorg20&P. Riedler\Irefnorg33&W. Riegler\Irefnorg33&F. Riggi\Irefnorg27&C. Ristea\Irefnorg66&S.P. Rode\Irefnorg49&M. Rodríguez Cahuantzi\Irefnorg44&K. Røed\Irefnorg20&R. Rogalev\Irefnorg90&E. Rogochaya\Irefnorg74&D. Rohr\Irefnorg33&D. Röhrich\Irefnorg21&P.S. Rokita\Irefnorg142&F. Ronchetti\Irefnorg51&A. Rosano\Irefnorg55&E.D. Rosas\Irefnorg68&K. Roslon\Irefnorg142&A. Rossi\Irefnorg28,\Irefnorg56&A. Rotondi\Irefnorg139&A. Roy\Irefnorg49&P. Roy\Irefnorg109&O.V. Rueda\Irefnorg80&R. Rui\Irefnorg24&B. Rumyantsev\Irefnorg74&A. Rustamov\Irefnorg86&E. Ryabinkin\Irefnorg87&Y. Ryabov\Irefnorg97&A. Rybicki\Irefnorg118&H. Rytkonen\Irefnorg126&O.A.M. Saarimaki\Irefnorg43&S. Sadhu\Irefnorg141&S. Sadovsky\Irefnorg90&K. Šafařík\Irefnorg36&S.K. Saha\Irefnorg141&B. Sahoo\Irefnorg48&P. Sahoo\Irefnorg48&R. Sahoo\Irefnorg49&S. Sahoo\Irefnorg64&P.K. Sahu\Irefnorg64&J. Saini\Irefnorg141&S. Sakai\Irefnorg133&S. Sambyal\Irefnorg100&V. Samsonov\Irefnorg92,\Irefnorg97&D. Sarkar\Irefnorg143&N. Sarkar\Irefnorg141&P. Sarma\Irefnorg41&V.M. Sarti\Irefnorg104&M.H.P. Sas\Irefnorg62&E. Scapparone\Irefnorg53&J. Schambach\Irefnorg119&H.S. Scheid\Irefnorg67&C. Schiaua\Irefnorg47&R. Schicker\Irefnorg103&A. Schmah\Irefnorg103&C. Schmidt\Irefnorg106&H.R. Schmidt\Irefnorg102&M.O. Schmidt\Irefnorg103&M. Schmidt\Irefnorg102&N.V. Schmidt\Irefnorg67,\Irefnorg95&A.R. Schmier\Irefnorg130&J. Schukraft\Irefnorg88&Y. Schutz\Irefnorg33,\Irefnorg136&K. Schwarz\Irefnorg106&K. Schweda\Irefnorg106&G. Scioli\Irefnorg26&E. Scomparin\Irefnorg58&M. Šefčík\Irefnorg37&J.E. Seger\Irefnorg15&Y. Sekiguchi\Irefnorg132&D. Sekihata\Irefnorg132&I. Selyuzhenkov\Irefnorg92,\Irefnorg106&S. Senyukov\Irefnorg136&D. Serebryakov\Irefnorg61&A. Sevcenco\Irefnorg66&A. Shabanov\Irefnorg61&A. Shabetai\Irefnorg114&R. Shahoyan\Irefnorg33&W. Shaikh\Irefnorg109&A. Shangaraev\Irefnorg90&A. Sharma\Irefnorg99&A. Sharma\Irefnorg100&H. Sharma\Irefnorg118&M. Sharma\Irefnorg100&N. Sharma\Irefnorg99&S. Sharma\Irefnorg100&A.I. Sheikh\Irefnorg141&K. Shigaki\Irefnorg45&M. Shimomura\Irefnorg82&S. Shirinkin\Irefnorg91&Q. Shou\Irefnorg39&Y. Sibiriak\Irefnorg87&S. Siddhanta\Irefnorg54&T. Siemiarczuk\Irefnorg84&D. Silvermyr\Irefnorg80&G. Simatovic\Irefnorg89&G. Simonetti\Irefnorg33&B. Singh\Irefnorg104&R. Singh\Irefnorg85&R. Singh\Irefnorg100&R. Singh\Irefnorg49&V.K. Singh\Irefnorg141&V. Singhal\Irefnorg141&T. Sinha\Irefnorg109&B. Sitar\Irefnorg13&M. Sitta\Irefnorg31&T.B. Skaali\Irefnorg20&M. Slupecki\Irefnorg126&N. Smirnov\Irefnorg146&R.J.M. Snellings\Irefnorg62&C. Soncco\Irefnorg111&J. Song\Irefnorg125&A. Songmoolnak\Irefnorg115&F. Soramel\Irefnorg28&S. Sorensen\Irefnorg130&I. Sputowska\Irefnorg118&J. Stachel\Irefnorg103&I. Stan\Irefnorg66&P. Stankus\Irefnorg95&P.J. Steffanic\Irefnorg130&E. Stenlund\Irefnorg80&D. Stocco\Irefnorg114&M.M. Storetvedt\Irefnorg35&L.D. Stritto\Irefnorg29&A.A.P. Suaide\Irefnorg121&T. Sugitate\Irefnorg45&C. Suire\Irefnorg77&M. Suleymanov\Irefnorg14&M. Suljic\Irefnorg33&R. Sultanov\Irefnorg91&M. Šumbera\Irefnorg94&V. Sumberia\Irefnorg100&S. Sumowidagdo\Irefnorg50&S. Swain\Irefnorg64&A. Szabo\Irefnorg13&I. Szarka\Irefnorg13&U. Tabassam\Irefnorg14&S.F. Taghavi\Irefnorg104&G. Taillepied\Irefnorg134&J. Takahashi\Irefnorg122&G.J. Tambave\Irefnorg21&S. Tang\Irefnorg6,\Irefnorg134&M. Tarhini\Irefnorg114&M.G. Tarzila\Irefnorg47&A. Tauro\Irefnorg33&G. Tejeda Muñoz\Irefnorg44&A. Telesca\Irefnorg33&L. Terlizzi\Irefnorg25&C. Terrevoli\Irefnorg125&D. Thakur\Irefnorg49&S. Thakur\Irefnorg141&D. Thomas\Irefnorg119&F. Thoresen\Irefnorg88&R. Tieulent\Irefnorg135&A. Tikhonov\Irefnorg61&A.R. Timmins\Irefnorg125&A. Toia\Irefnorg67&N. Topilskaya\Irefnorg61&M. Toppi\Irefnorg51&F. Torales-Acosta\Irefnorg19&S.R. Torres\Irefnorg36,\Irefnorg120&A. Trifiro\Irefnorg55&S. Tripathy\Irefnorg49,\Irefnorg68&T. Tripathy\Irefnorg48&S. Trogolo\Irefnorg28&G. Trombetta\Irefnorg32&L. Tropp\Irefnorg37&V. Trubnikov\Irefnorg2&W.H. Trzaska\Irefnorg126&T.P. Trzcinski\Irefnorg142&B.A. Trzeciak\Irefnorg36,\Irefnorg62&T. Tsuji\Irefnorg132&A. Tumkin\Irefnorg108&R. Turrisi\Irefnorg56&T.S. Tveter\Irefnorg20&K. Ullaland\Irefnorg21&E.N. Umaka\Irefnorg125&A. Uras\Irefnorg135&G.L. Usai\Irefnorg23&M. Vala\Irefnorg37&N. Valle\Irefnorg139&S. Vallero\Irefnorg58&N. van der Kolk\Irefnorg62&L.V.R. van Doremalen\Irefnorg62&M. van Leeuwen\Irefnorg62&P. Vande Vyvre\Irefnorg33&D. Varga\Irefnorg145&Z. Varga\Irefnorg145&M. Varga-Kofarago\Irefnorg145&A. Vargas\Irefnorg44&M. Vasileiou\Irefnorg83&A. Vasiliev\Irefnorg87&O. Vázquez Doce\Irefnorg104,\Irefnorg117&V. Vechernin\Irefnorg112&E. Vercellin\Irefnorg25&S. Vergara Limón\Irefnorg44&L. Vermunt\Irefnorg62&R. Vernet\Irefnorg7&R. Vértesi\Irefnorg145&L. Vickovic\Irefnorg34&Z. Vilakazi\Irefnorg131&O. Villalobos Baillie\Irefnorg110&G. Vino\Irefnorg52&A. Vinogradov\Irefnorg87&T. Virgili\Irefnorg29&V. Vislavicius\Irefnorg88&A. Vodopyanov\Irefnorg74&B. Volkel\Irefnorg33&M.A. Völkl\Irefnorg102&K. Voloshin\Irefnorg91&S.A. Voloshin\Irefnorg143&G. Volpe\Irefnorg32&B. von Haller\Irefnorg33&I. Vorobyev\Irefnorg104&D. Voscek\Irefnorg116&J. Vrláková\Irefnorg37&B. Wagner\Irefnorg21&M. Weber\Irefnorg113&A. Wegrzynek\Irefnorg33&S.C. Wenzel\Irefnorg33&J.P. Wessels\Irefnorg144&J. Wiechula\Irefnorg67&J. Wikne\Irefnorg20&G. Wilk\Irefnorg84&J. Wilkinson\Irefnorg10,\Irefnorg53&G.A. Willems\Irefnorg144&E. Willsher\Irefnorg110&B. Windelband\Irefnorg103&M. Winn\Irefnorg137&W.E. Witt\Irefnorg130&Y. Wu\Irefnorg128&R. Xu\Irefnorg6&S. Yalcin\Irefnorg76&Y. Yamaguchi\Irefnorg45&K. Yamakawa\Irefnorg45&S. Yang\Irefnorg21&S. Yano\Irefnorg137&Z. Yin\Irefnorg6&H. Yokoyama\Irefnorg62&I.-K. Yoo\Irefnorg17&J.H. Yoon\Irefnorg60&S. Yuan\Irefnorg21&A. Yuncu\Irefnorg103&V. Yurchenko\Irefnorg2&V. Zaccolo\Irefnorg24&A. Zaman\Irefnorg14&C. Zampolli\Irefnorg33&H.J.C. Zanoli\Irefnorg62&N. Zardoshti\Irefnorg33&A. Zarochentsev\Irefnorg112&P. Závada\Irefnorg65&N. Zaviyalov\Irefnorg108&H. Zbroszczyk\Irefnorg142&M. Zhalov\Irefnorg97&S. Zhang\Irefnorg39&X. Zhang\Irefnorg6&Z. Zhang\Irefnorg6&V. Zherebchevskii\Irefnorg112&D. Zhou\Irefnorg6&Y. Zhou\Irefnorg88&Z. Zhou\Irefnorg21&J. Zhu\Irefnorg6,\Irefnorg106&Y. Zhu\Irefnorg6&A. Zichichi\Irefnorg10,\Irefnorg26&G. Zinovjev\Irefnorg2&N. Zurlo\Irefnorg140&
Affiliation notes
orgIItalian National Agency for New Technologies, Energy and Sustainable Economic Development (ENEA), Bologna, Italy
orgIIDipartimento DET del Politecnico di Torino, Turin, Italy
orgIIIM.V. Lomonosov Moscow State University, D.V. Skobeltsyn Institute of Nuclear, Physics, Moscow, Russia
orgIVDepartment of Applied Physics, Aligarh Muslim University, Aligarh, India
orgVInstitute of Theoretical Physics, University of Wroclaw, Poland
Collaboration Institutes
org1A.I. Alikhanyan National Science Laboratory (Yerevan Physics Institute) Foundation, Yerevan, Armenia
org2Bogolyubov Institute for Theoretical Physics, National Academy of Sciences of Ukraine, Kiev, Ukraine
org3Bose Institute, Department of Physics and Centre for Astroparticle Physics and Space Science (CAPSS), Kolkata, India
org4Budker Institute for Nuclear Physics, Novosibirsk, Russia
org5California Polytechnic State University, San Luis Obispo, California, United States
org6Central China Normal University, Wuhan, China
org7Centre de Calcul de l’IN2P3, Villeurbanne, Lyon, France
org8Centro de Aplicaciones Tecnológicas y Desarrollo Nuclear (CEADEN), Havana, Cuba
org9Centro de Investigación y de Estudios Avanzados (CINVESTAV), Mexico City and Mérida, Mexico
org10Centro Fermi - Museo Storico della Fisica e Centro Studi e Ricerche “Enrico Fermi’, Rome, Italy
org11Chicago State University, Chicago, Illinois, United States
org12China Institute of Atomic Energy, Beijing, China
org13Comenius University Bratislava, Faculty of Mathematics, Physics and Informatics, Bratislava, Slovakia
org14COMSATS University Islamabad, Islamabad, Pakistan
org15Creighton University, Omaha, Nebraska, United States
org16Department of Physics, Aligarh Muslim University, Aligarh, India
org17Department of Physics, Pusan National University, Pusan, Republic of Korea
org18Department of Physics, Sejong University, Seoul, Republic of Korea
org19Department of Physics, University of California, Berkeley, California, United States
org20Department of Physics, University of Oslo, Oslo, Norway
org21Department of Physics and Technology, University of Bergen, Bergen, Norway
org22Dipartimento di Fisica dell’Università ’La Sapienza’ and Sezione INFN, Rome, Italy
org23Dipartimento di Fisica dell’Università and Sezione INFN, Cagliari, Italy
org24Dipartimento di Fisica dell’Università and Sezione INFN, Trieste, Italy
org25Dipartimento di Fisica dell’Università and Sezione INFN, Turin, Italy
org26Dipartimento di Fisica e Astronomia dell’Università and Sezione INFN, Bologna, Italy
org27Dipartimento di Fisica e Astronomia dell’Università and Sezione INFN, Catania, Italy
org28Dipartimento di Fisica e Astronomia dell’Università and Sezione INFN, Padova, Italy
org29Dipartimento di Fisica ‘E.R. Caianiello’ dell’Università and Gruppo Collegato INFN, Salerno, Italy
org30Dipartimento DISAT del Politecnico and Sezione INFN, Turin, Italy
org31Dipartimento di Scienze e Innovazione Tecnologica dell’Università del Piemonte Orientale and INFN Sezione di Torino, Alessandria, Italy
org32Dipartimento Interateneo di Fisica ‘M. Merlin’ and Sezione INFN, Bari, Italy
org33European Organization for Nuclear Research (CERN), Geneva, Switzerland
org34Faculty of Electrical Engineering, Mechanical Engineering and Naval Architecture, University of Split, Split, Croatia
org35Faculty of Engineering and Science, Western Norway University of Applied Sciences, Bergen, Norway
org36Faculty of Nuclear Sciences and Physical Engineering, Czech Technical University in Prague, Prague, Czech Republic
org37Faculty of Science, P.J. Šafárik University, Košice, Slovakia
org38Frankfurt Institute for Advanced Studies, Johann Wolfgang Goethe-Universität Frankfurt, Frankfurt, Germany
org39Fudan University, Shanghai, China
org40Gangneung-Wonju National University, Gangneung, Republic of Korea
org41Gauhati University, Department of Physics, Guwahati, India
org42Helmholtz-Institut für Strahlen- und Kernphysik, Rheinische Friedrich-Wilhelms-Universität Bonn, Bonn, Germany
org43Helsinki Institute of Physics (HIP), Helsinki, Finland
org44High Energy Physics Group, Universidad Autónoma de Puebla, Puebla, Mexico
org45Hiroshima University, Hiroshima, Japan
org46Hochschule Worms, Zentrum für Technologietransfer und Telekommunikation (ZTT), Worms, Germany
org47Horia Hulubei National Institute of Physics and Nuclear Engineering, Bucharest, Romania
org48Indian Institute of Technology Bombay (IIT), Mumbai, India
org49Indian Institute of Technology Indore, Indore, India
org50Indonesian Institute of Sciences, Jakarta, Indonesia
org51INFN, Laboratori Nazionali di Frascati, Frascati, Italy
org52INFN, Sezione di Bari, Bari, Italy
org53INFN, Sezione di Bologna, Bologna, Italy
org54INFN, Sezione di Cagliari, Cagliari, Italy
org55INFN, Sezione di Catania, Catania, Italy
org56INFN, Sezione di Padova, Padova, Italy
org57INFN, Sezione di Roma, Rome, Italy
org58INFN, Sezione di Torino, Turin, Italy
org59INFN, Sezione di Trieste, Trieste, Italy
org60Inha University, Incheon, Republic of Korea
org61Institute for Nuclear Research, Academy of Sciences, Moscow, Russia
org62Institute for Subatomic Physics, Utrecht University/Nikhef, Utrecht, Netherlands
org63Institute of Experimental Physics, Slovak Academy of Sciences, Košice, Slovakia
org64Institute of Physics, Homi Bhabha National Institute, Bhubaneswar, India
org65Institute of Physics of the Czech Academy of Sciences, Prague, Czech Republic
org66Institute of Space Science (ISS), Bucharest, Romania
org67Institut für Kernphysik, Johann Wolfgang Goethe-Universität Frankfurt, Frankfurt, Germany
org68Instituto de Ciencias Nucleares, Universidad Nacional Autónoma de México, Mexico City, Mexico
org69Instituto de Física, Universidade Federal do Rio Grande do Sul (UFRGS), Porto Alegre, Brazil
org70Instituto de Física, Universidad Nacional Autónoma de México, Mexico City, Mexico
org71iThemba LABS, National Research Foundation, Somerset West, South Africa
org72Jeonbuk National University, Jeonju, Republic of Korea
org73Johann-Wolfgang-Goethe Universität Frankfurt Institut für Informatik, Fachbereich Informatik und Mathematik, Frankfurt, Germany
org74Joint Institute for Nuclear Research (JINR), Dubna, Russia
org75Korea Institute of Science and Technology Information, Daejeon, Republic of Korea
org76KTO Karatay University, Konya, Turkey
org77Laboratoire de Physique des 2 Infinis, Irène Joliot-Curie, Orsay, France
org78Laboratoire de Physique Subatomique et de Cosmologie, Université Grenoble-Alpes, CNRS-IN2P3, Grenoble, France
org79Lawrence Berkeley National Laboratory, Berkeley, California, United States
org80Lund University Department of Physics, Division of Particle Physics, Lund, Sweden
org81Nagasaki Institute of Applied Science, Nagasaki, Japan
org82Nara Women’s University (NWU), Nara, Japan
org83National and Kapodistrian University of Athens, School of Science, Department of Physics , Athens, Greece
org84National Centre for Nuclear Research, Warsaw, Poland
org85National Institute of Science Education and Research, Homi Bhabha National Institute, Jatni, India
org86National Nuclear Research Center, Baku, Azerbaijan
org87National Research Centre Kurchatov Institute, Moscow, Russia
org88Niels Bohr Institute, University of Copenhagen, Copenhagen, Denmark
org89Nikhef, National institute for subatomic physics, Amsterdam, Netherlands
org90NRC Kurchatov Institute IHEP, Protvino, Russia
org91NRC «Kurchatov» Institute - ITEP, Moscow, Russia
org92NRNU Moscow Engineering Physics Institute, Moscow, Russia
org93Nuclear Physics Group, STFC Daresbury Laboratory, Daresbury, United Kingdom
org94Nuclear Physics Institute of the Czech Academy of Sciences, Řež u Prahy, Czech Republic
org95Oak Ridge National Laboratory, Oak Ridge, Tennessee, United States
org96Ohio State University, Columbus, Ohio, United States
org97Petersburg Nuclear Physics Institute, Gatchina, Russia
org98Physics department, Faculty of science, University of Zagreb, Zagreb, Croatia
org99Physics Department, Panjab University, Chandigarh, India
org100Physics Department, University of Jammu, Jammu, India
org101Physics Department, University of Rajasthan, Jaipur, India
org102Physikalisches Institut, Eberhard-Karls-Universität Tübingen, Tübingen, Germany
org103Physikalisches Institut, Ruprecht-Karls-Universität Heidelberg, Heidelberg, Germany
org104Physik Department, Technische Universität München, Munich, Germany
org105Politecnico di Bari, Bari, Italy
org106Research Division and ExtreMe Matter Institute EMMI, GSI Helmholtzzentrum für Schwerionenforschung GmbH, Darmstadt, Germany
org107Rudjer Bošković Institute, Zagreb, Croatia
org108Russian Federal Nuclear Center (VNIIEF), Sarov, Russia
org109Saha Institute of Nuclear Physics, Homi Bhabha National Institute, Kolkata, India
org110School of Physics and Astronomy, University of Birmingham, Birmingham, United Kingdom
org111Sección Física, Departamento de Ciencias, Pontificia Universidad Católica del Perú, Lima, Peru
org112St. Petersburg State University, St. Petersburg, Russia
org113Stefan Meyer Institut für Subatomare Physik (SMI), Vienna, Austria
org114SUBATECH, IMT Atlantique, Université de Nantes, CNRS-IN2P3, Nantes, France
org115Suranaree University of Technology, Nakhon Ratchasima, Thailand
org116Technical University of Košice, Košice, Slovakia
org117Technische Universität München, Excellence Cluster ’Universe’, Munich, Germany
org118The Henryk Niewodniczanski Institute of Nuclear Physics, Polish Academy of Sciences, Cracow, Poland
org119The University of Texas at Austin, Austin, Texas, United States
org120Universidad Autónoma de Sinaloa, Culiacán, Mexico
org121Universidade de São Paulo (USP), São Paulo, Brazil
org122Universidade Estadual de Campinas (UNICAMP), Campinas, Brazil
org123Universidade Federal do ABC, Santo Andre, Brazil
org124University of Cape Town, Cape Town, South Africa
org125University of Houston, Houston, Texas, United States
org126University of Jyväskylä, Jyväskylä, Finland
org127University of Liverpool, Liverpool, United Kingdom
org128University of Science and Technology of China, Hefei, China
org129University of South-Eastern Norway, Tonsberg, Norway
org130University of Tennessee, Knoxville, Tennessee, United States
org131University of the Witwatersrand, Johannesburg, South Africa
org132University of Tokyo, Tokyo, Japan
org133University of Tsukuba, Tsukuba, Japan
org134Université Clermont Auvergne, CNRS/IN2P3, LPC, Clermont-Ferrand, France
org135Université de Lyon, Université Lyon 1, CNRS/IN2P3, IPN-Lyon, Villeurbanne, Lyon, France
org136Université de Strasbourg, CNRS, IPHC UMR 7178, F-67000 Strasbourg, France, Strasbourg, France
org137Université Paris-Saclay Centre d’Etudes de Saclay (CEA), IRFU, Départment de Physique Nucléaire (DPhN), Saclay, France
org138Università degli Studi di Foggia, Foggia, Italy
org139Università degli Studi di Pavia, Pavia, Italy
org140Università di Brescia, Brescia, Italy
org141Variable Energy Cyclotron Centre, Homi Bhabha National Institute, Kolkata, India
org142Warsaw University of Technology, Warsaw, Poland
org143Wayne State University, Detroit, Michigan, United States
org144Westfälische Wilhelms-Universität Münster, Institut für Kernphysik, Münster, Germany
org145Wigner Research Centre for Physics, Budapest, Hungary
org146Yale University, New Haven, Connecticut, United States
org147Yonsei University, Seoul, Republic of Korea