Strain-stabilized superconductivity
Superconductivity is among the most fascinating and well-studied quantum states of matter. Despite over 100 years of research, a detailed understanding of how features of the normal-state electronic structure determine superconducting properties has remained elusive. For instance, the ability to deterministically enhance the superconducting transition temperature by design, rather than by serendipity, has been a long sought-after goal in condensed matter physics and materials science, but achieving this objective may require new tools, techniques and approaches. Here, we report the first instance of the transmutation of a normal metal into a superconductor through the application of epitaxial strain. We demonstrate that synthesizing RuO2 thin films on (110)-oriented TiO2 substrates enhances the density of states near the Fermi level, which stabilizes superconductivity under strain, and suggests that a promising strategy to create new transition-metal superconductors is to apply judiciously chosen anisotropic strains that redistribute carriers within the low-energy manifold of orbitals.
In typical weak-coupling theories of superconductivity, the effective attraction between electrons is mediated by the exchange of bosons having a characteristic energy scale , and superconductivity condenses below a transition temperature parameterized as Carbotte (1990):
| (1) |
where is the density of states (DOS) near the Fermi level, is the electron-boson coupling strength, and is the Coulomb pseudopotential that describes the residual Coulomb repulsion between quasiparticles 111For simplicity, we assume that all of the non-isotropic - and -dependencies that appear in a more realistic formulation of the Cooper pairing problem have been averaged away. Note that within the range of validity of equation (1)—viz., —increasing (increasing ) generally enhances (suppresses) , respectively, assuming that superconductivity remains the dominant instability..
Experimental methods that boost are highly desired from a practical perspective. Furthermore, by analyzing how these available knobs couple to the normal-state properties on the right side of equation (1), one can envisage engineering the electronic structure and electron-boson coupling to optimize . For example, increasing is a frequently suggested route towards realizing higher , but how to achieve this for specific materials often remains unclear.
Chemical doping and hydrostatic pressure have been the most common knobs used to manipulate superconductivity. Unfortunately, doping has the complication of introducing substitutional disorder, whereas pressure studies are incompatible with most probes of electronic structure. Moreover, because large pressures are usually required to appreciably increase Hamlin (2015), pressure-enhanced superconductivity exists transiently—typically in different structural polymorphs than at ambient conditions—rendering it inaccessible for applications.
An alternative strategy for controlling superconductivity is epitaxial strain engineering. This approach is static, disorder-free, allows for the use of sophisticated experimental probes Burganov et al. (2016), and enables integration with other materials in novel artificial interfaces and device structures Ohtomo and Hwang (2004); Kawasaki et al. (2018). To date, epitaxial strain has only been used to modulate in known superconductors Lock J. M. and Bragg William Lawrence (1951); Locquet et al. (1998); *si_strain_1999; *si_epitaxial-strain-induced_2001; *bozovic_epitaxial_2002. In this letter, we report the first example of a new superconductor created through epitaxial strain, starting from a compound, RuO2, previously not known to be superconducting 222In principle, assuming that all Fermi liquids are eventually unstable towards superconductivity at low enough temperatures and magnetic fields (including internal fields arising from magnetic impurities), this is not strictly a change in the ground state of the system. However, for our purposes, extremely low temperatures and fields below what are experimentally achievable can be thought of as effectively zero, justifying the use of phrases such as “strain-induced superconductivity” interchangeably with “huge enhancement of critical temperature”.. By comparing the results of angle-resolved photoemission spectroscopy (ARPES) experiments with density functional theory (DFT) calculations, we show that splittings between the effective low-energy orbital degrees of freedom in RuO2 respond sensitively to appropriate modes of strain, and we discuss how this approach may open the door to strain tuning of superconductivity in other materials.
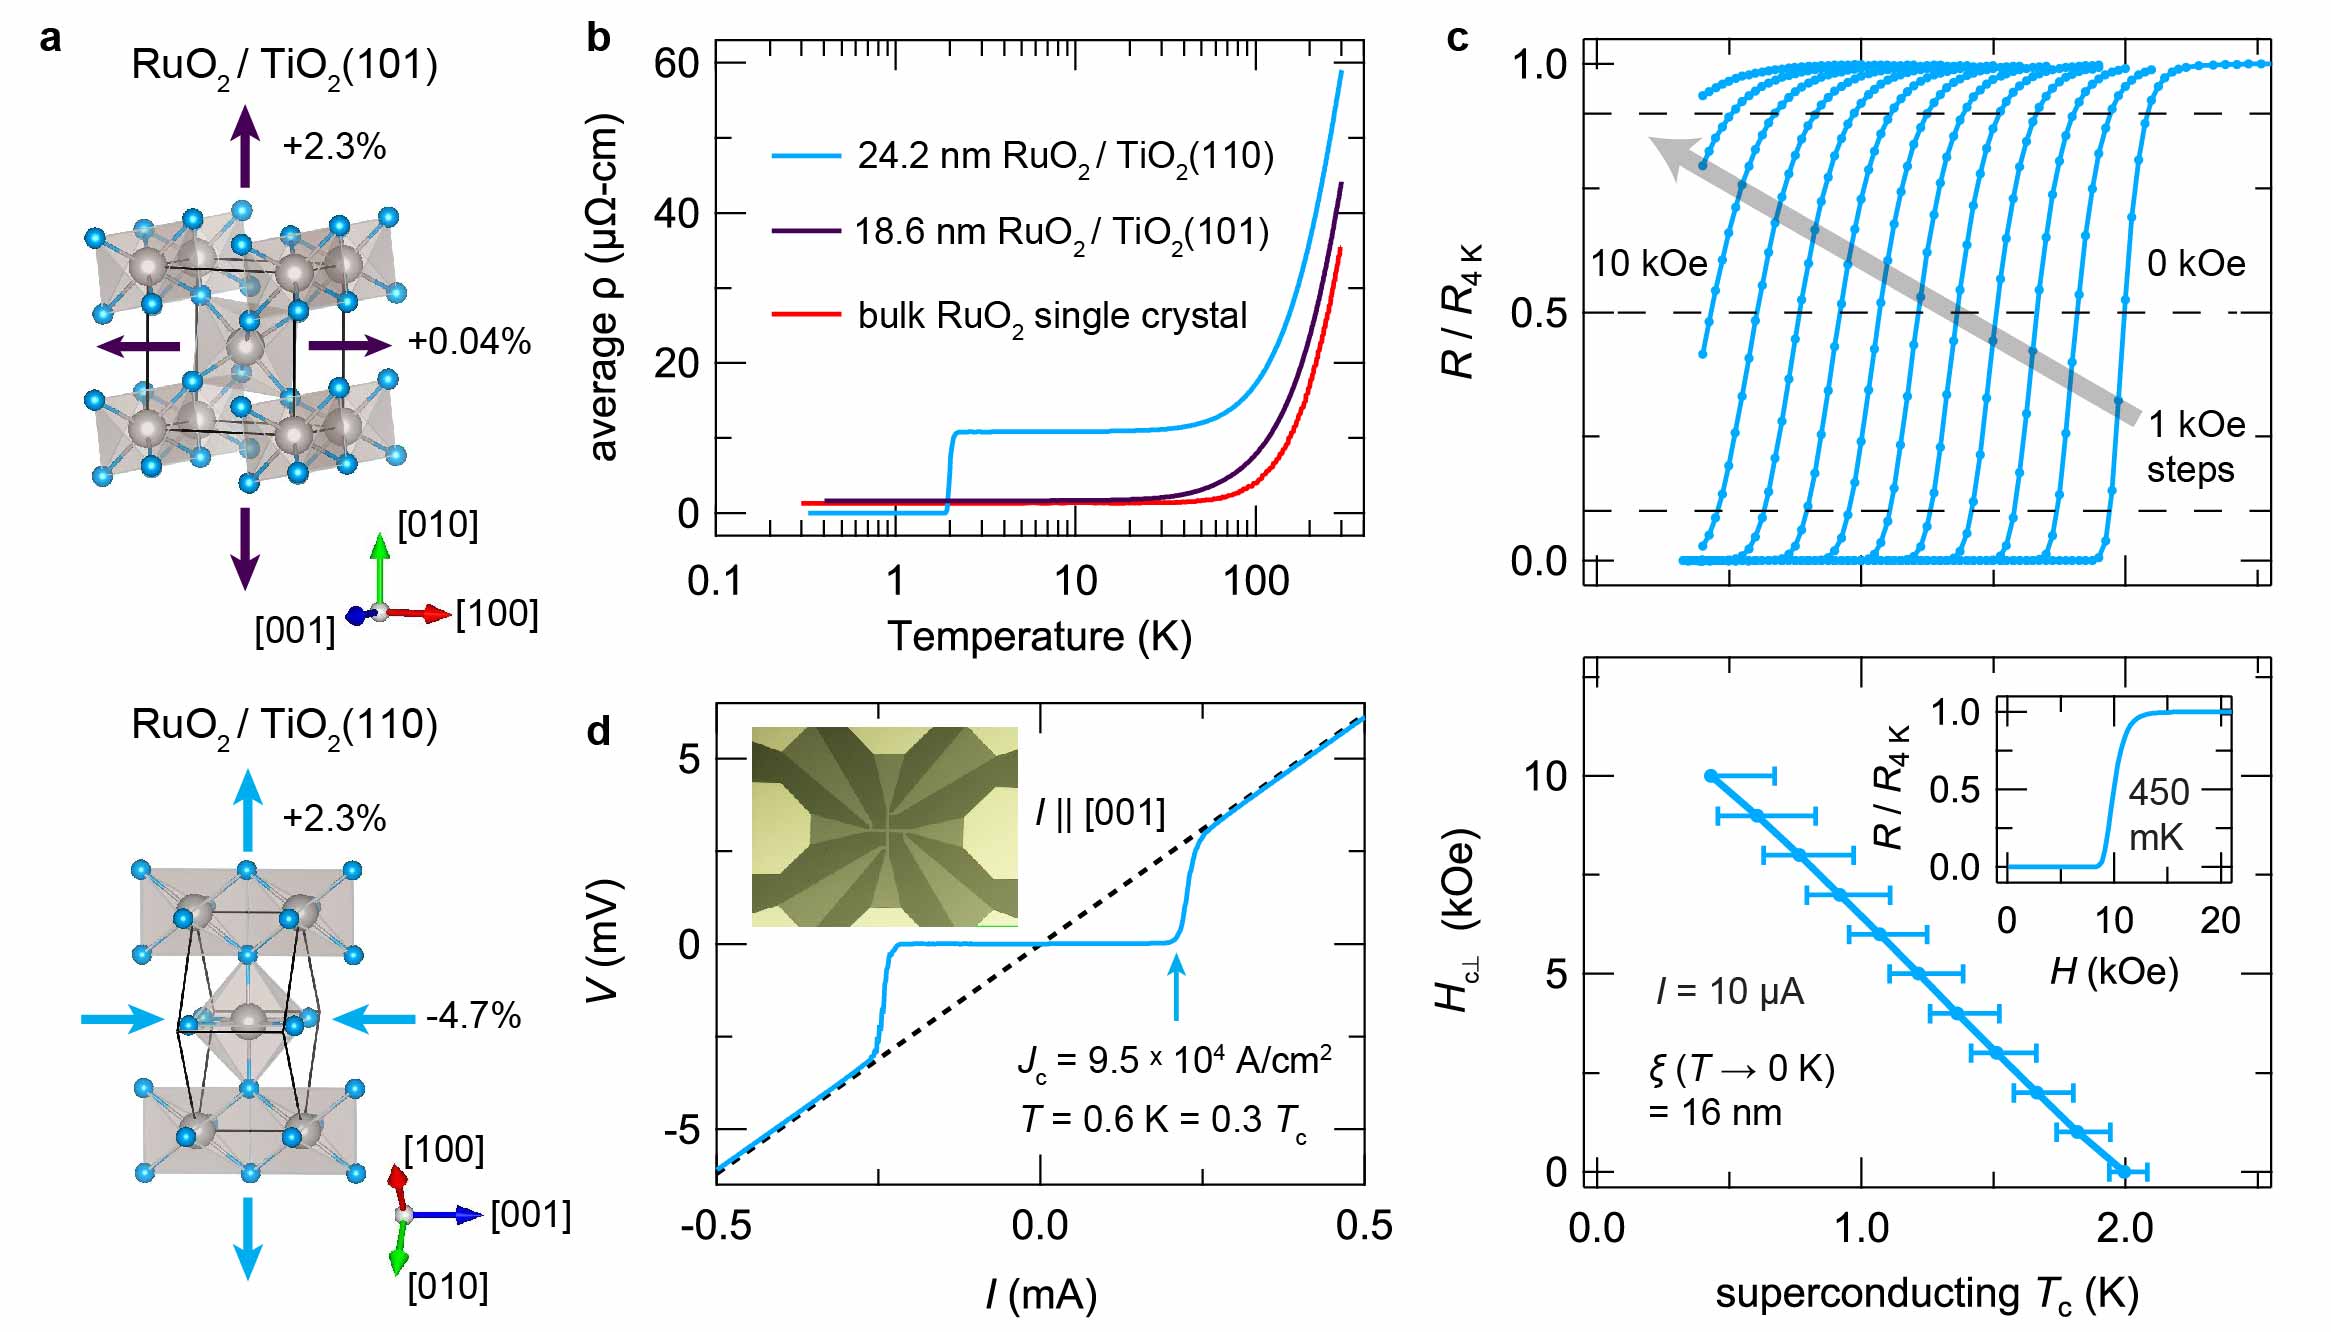
Bulk RuO2 crystallizes in the ideal tetragonal rutile structure (space group , ) with lattice constants at 295 K of Berlijn et al. (2017). RuO2 thin films in distinct epitaxial strain states were synthesized using oxide molecular-beam epitaxy by employing different orientations of isostructural TiO2 substrates, Burdett et al. (1987). As shown in Fig. 1a, the surfaces of (101)-oriented substrates are spanned by the and lattice vectors of TiO2, which ideally impart in-plane tensile strains on RuO2 (at 295 K) of and , respectively. On TiO2(110), the lattice mismatches with RuO2 are larger: along and along . Figure 1b shows electrical resistivity measurements for RuO2 films, along with results for bulk RuO2 single crystals from Ref. Lin et al. (2004). To compare with bulk RuO2, for the thin-film samples we plot the geometric mean of along the two in-plane directions; the intrinsic resistivity anisotropy is known to be small (Supplementary Fig. S1).
data for the lightly strained RuO2/TiO2(101) sample—henceforth referred to as RuO2(101)—are nearly indistinguishable from bulk, exhibiting metallic behavior with a low residual resistivity . In contrast, a clear superconducting transition is observed for the more heavily strained RuO2/TiO2(110) sample—referred to as RuO2(110)—at K. Magnetoresistance measurements with applied along (the out-of-plane direction) show a suppression of with increasing fields and an extrapolated value of kOe, corresponding to an average in-plane superconducting coherence length of nm (Supplementary Fig. S2). In Fig. 1d, we show a curve measured on a lithographically patterned resistivity bridge at , from which we extract a critical current density A/. This large value of (over one order of magnitude larger than values reported on typical elemental superconductors with comparable s) indicates that the superconductivity does not arise from a filamentary network, structural defects, minority phases, or from the substrate-film interface, which would all yield much smaller values of .
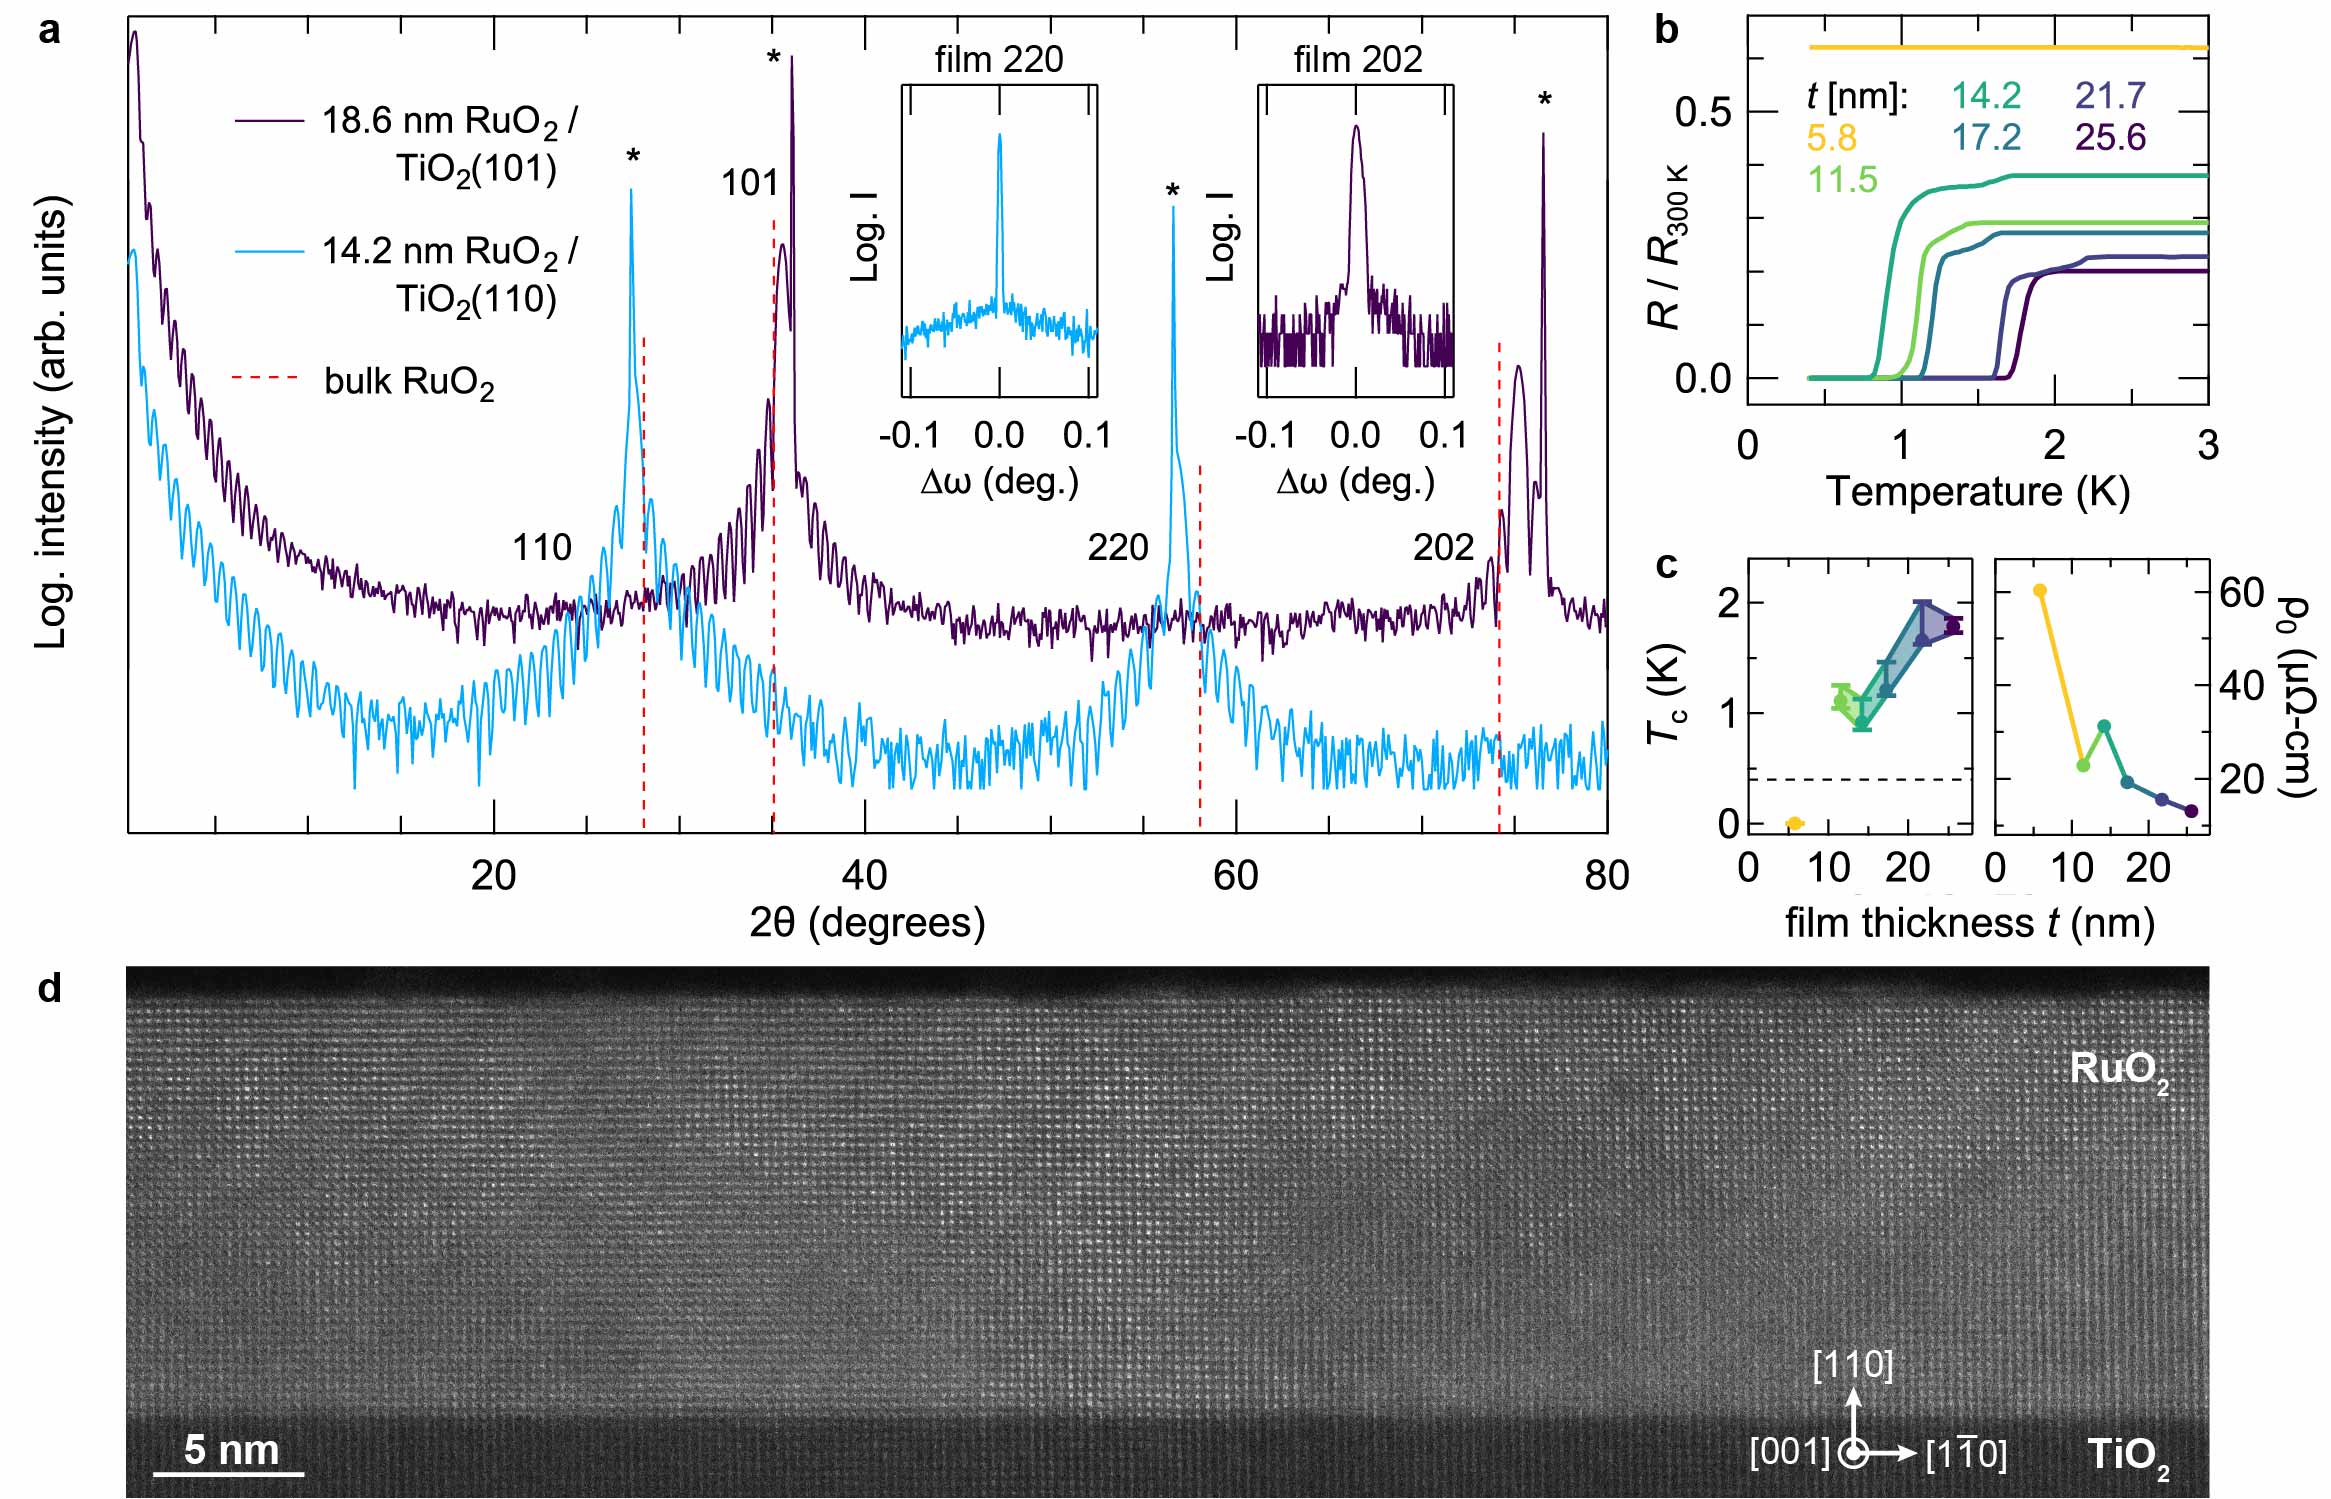
In order to disentangle the effects of strain from other possible sources of superconductivity, we compare RuO2 films as functions of strain and film thickness, . In Fig. 2a, we plot x-ray diffraction (XRD) data from similar-thickness films of RuO2(101) and RuO2(110), showing that the bulk-averaged crystal structures of the films are strained as expected along the out-of-plane direction based on their net in-plane lattice mismatches with TiO2. The primary 101 and 202 film peaks of RuO2(101) are shifted to larger angles than bulk RuO2, corresponding to a compression of , while Nelson-Riley analysis of the primary 110, 220 and 330 (not shown) peak positions for RuO2(110) evidence a expansion of relative to bulk. In Fig. 2b,c, we plot resistivity data showing that reducing in RuO2(110) decreases , characteristic of numerous families of thin-film superconductors Pinto et al. (2018); Meyer et al. (2015), with dropping below our experimental threshold (0.4 K) between and . This suppression of with thickness indicates superconductivity is not confined near the substrate-film interface, so possible interfacial modifications of the crystal structure Gozar et al. (2008), carrier density He et al. (2013), substrate-film mode coupling Lee et al. (2014), and non-stoichiometry in the films or substrates Paik et al. (2015); Yoshimatsu et al. (2017) can all be eliminated as potential causes of superconductivity. These conclusions are also supported by the facts that superconductivity is not observed in RuO2(101) films, nor in bare TiO2 substrates treated in an identical fashion to the RuO2 films. Finally, in Fig. 2d we show a scanning transmission electron microscopy (STEM) image of a superconducting RuO2(110) sample, which confirms uniform growth of the film over lateral length scales exceeding those expected to be relevant for superconductivity (e.g., ), with no evidence of minority phases and a chemically abrupt interface between RuO2 and TiO2 (Supplementary Figs. S5-S7).
We believe the thickness dependence of results primarily from the competition between: 1) an intrinsic strain-induced enhancement of that should be maximized for thinner, commensurately strained RuO2(110) films, versus 2) disorder-induced suppressions of that become amplified in the ultrathin limit (see versus in Fig. 2c). While the thinnest films experience the largest substrate-imposed strains, stronger disorder scattering (likely from interfacial defects) reduces below our detection threshold. Films of intermediate thickness () have lower residual resistivities and higher s, but do exhibit signatures of partial strain relaxation. Nevertheless, a detailed analysis of misfit dislocations by STEM and XRD reciprocal-space mapping (Supplementary Figs. S3-S10) indicates that these films are largely structurally homogeneous and, on average, much closer to commensurately strained than fully relaxed. Finally, in much thicker samples ( nm) where a more significant volume fraction of the film should be relaxed, the strain is further released by oriented micro-cracks that make these samples spatially inhomogeneous and cause anisotropic distributions of current flow, preventing reliable resistivity measurements (Supplementary Fig. S11).
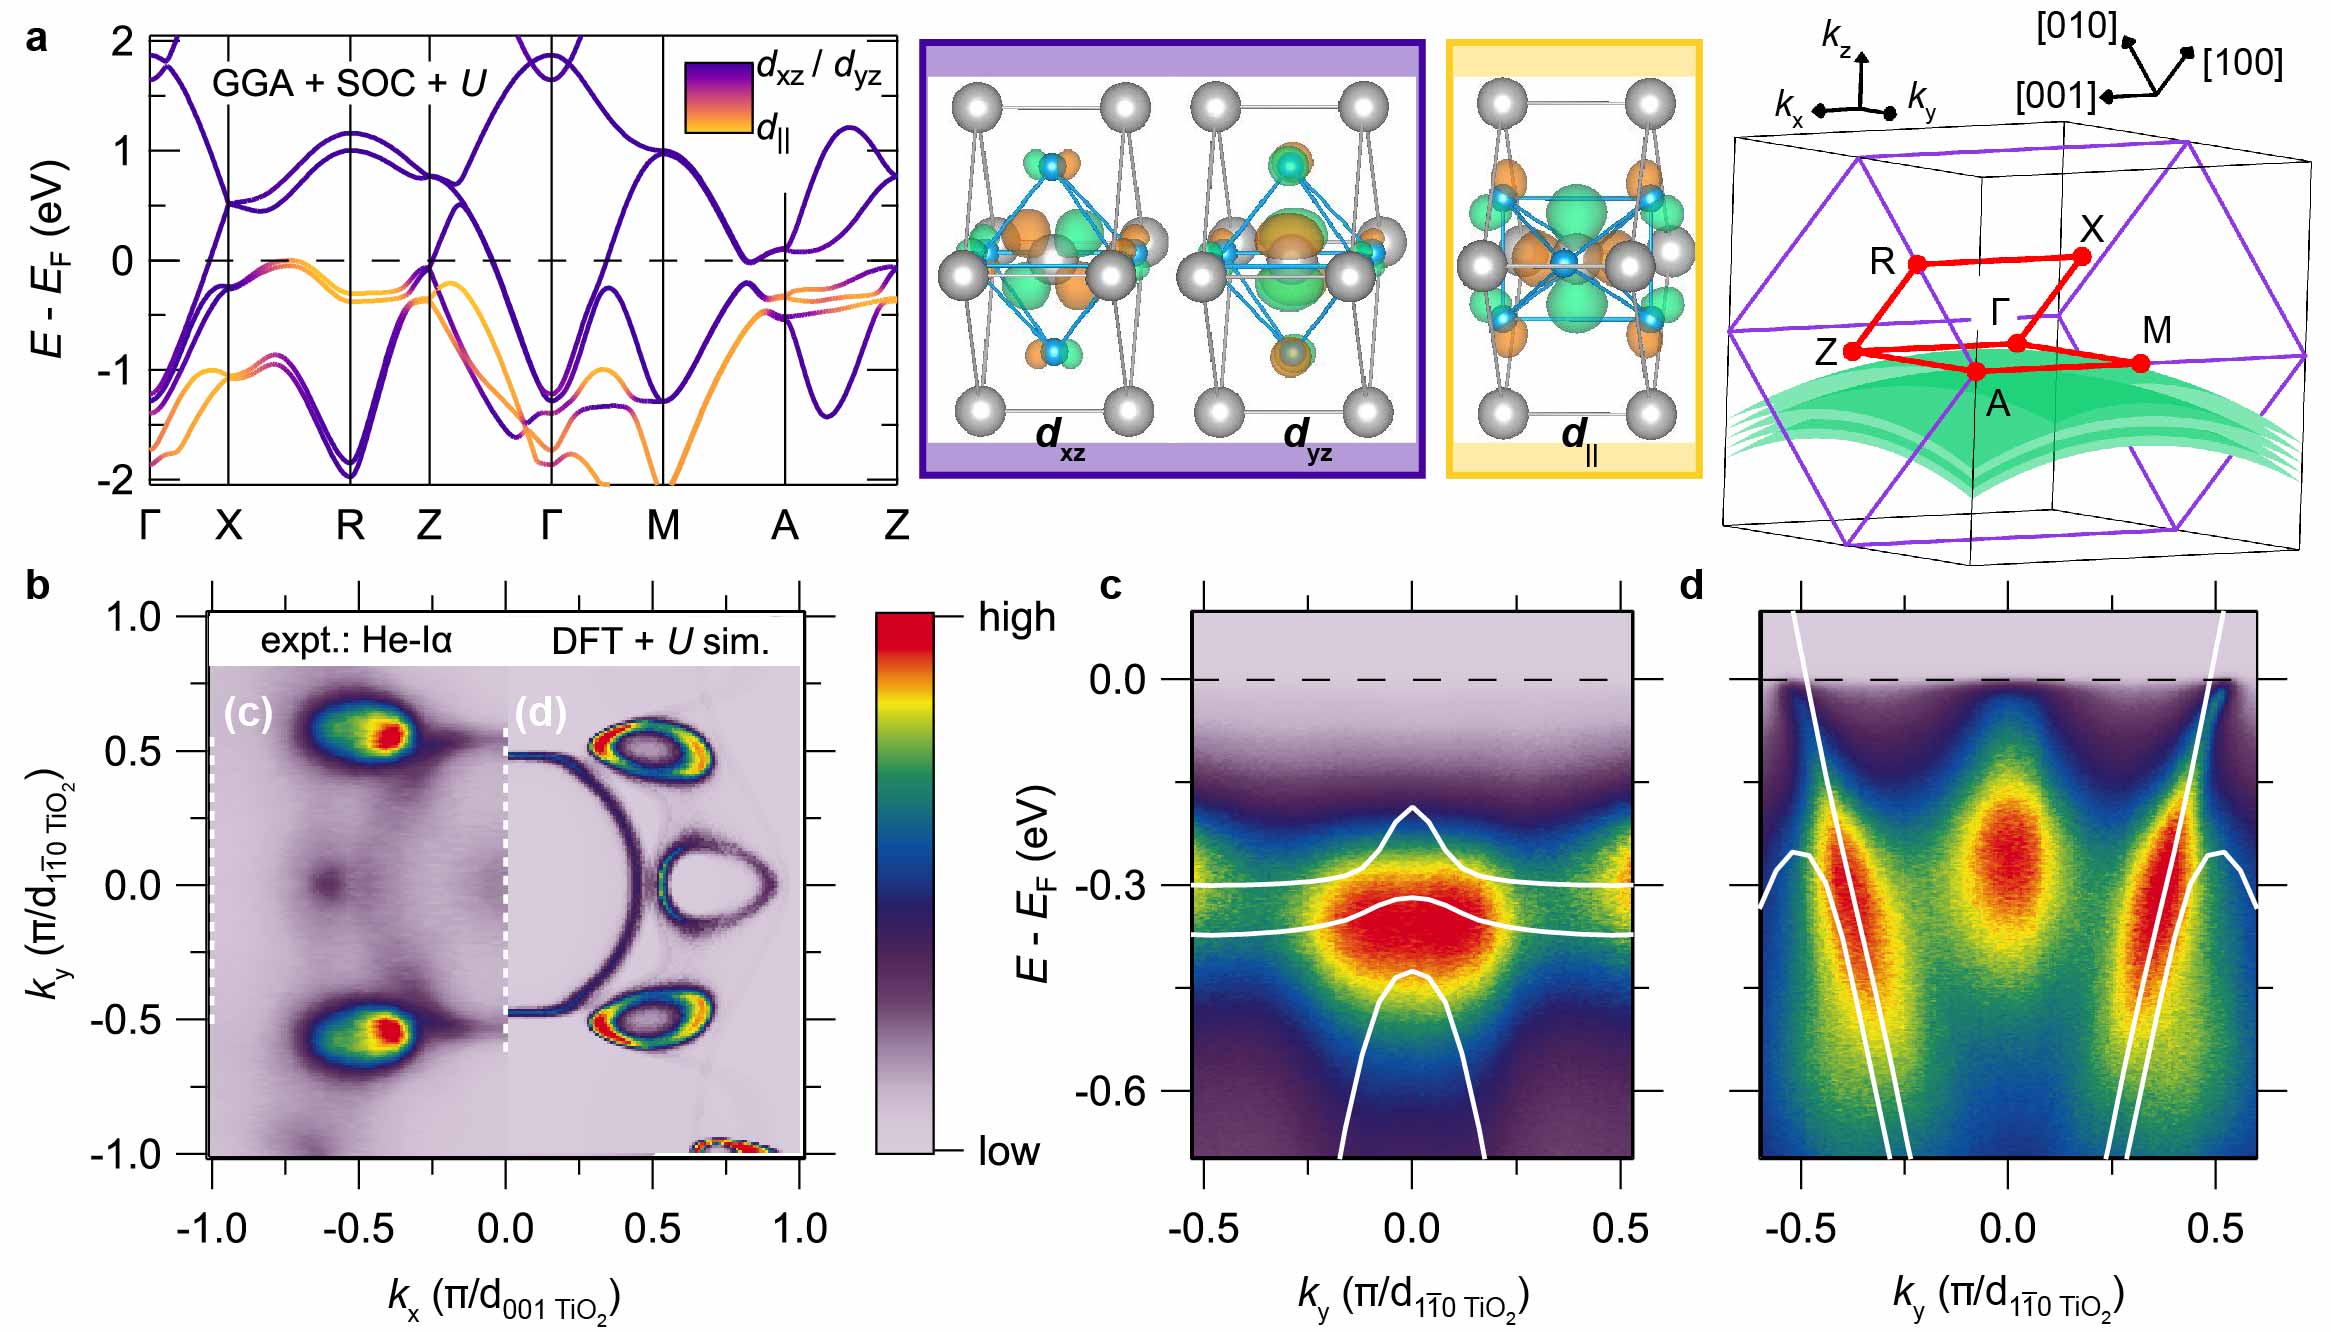
Having established the strain-induced nature of the superconductivity in RuO2(110), we now explore its underlying origin using a combination of DFT and ARPES. In Fig. 3a, we present the electronic structure of commensurately strained RuO2(110) calculated by DFT ( = 2 eV), following the methods of Berlijn et al. Berlijn et al. (2017). Despite being constructed of RuO6 octahedra having the same electronic configuration as in (Ca,Sr,Ba)RuO3, the electronic structure of RuO2 is markedly different from that of perovskite-based ruthenates. These distinctions arise from a sizable ligand-field splitting of the orbitals, such that the most natural description of the low-energy electronic structure is in terms of states derived from two distinct types of orbitals: and , , as illustrated by plots of Wannier functions in Fig. 3 Goodenough (1971); Eyert et al. (2000). Viewed in the band basis in Fig. 3a, the differentiation in -space between these orbitals becomes apparent: the near- states form mostly flat bands concentrated around the (Z-R-A) plane, whereas the , states form more isotropically dispersing bands distributed uniformly throughout the Brillouin zone.
In many other ruthenates (such as Sr2RuO4 and Ca2RuO4), static mean-field electronic structure calculations (such as DFT) often predict quantitatively incorrect effective masses Mravlje et al. (2011); *mackenzie_quantum_1996; *tamai_high-resolution_2019; Ricco et al. (2018); *sutter_orbitally_2019 or even qualitatively incorrect ground states Sutter et al. (2017) because these approaches neglect local atomic-like (Hund’s rule) spin correlations that strongly renormalize the low-energy quasiparticle excitations. Therefore, it is imperative to compare DFT calculations for RuO2 with experimental data, to establish the reliability of any theoretically predicted dependence of the electronic structure on strain. The left half of Fig. 3b shows the Fermi surface of RuO2(110) measured with He-I (21.2 eV) photons at 17 K, which agrees well with a non-magnetic DFT+ simulation of the Fermi surface at a reduced out-of-plane momentum of (right half of Fig. 3b). In Fig. 3c,d, we plot energy versus momentum spectra acquired along the dashed lines in Fig. 3b: in Fig. 3c, the spectrum is dominated by the flat bands around a binding energy of 300 meV, whereas in Fig. 3d the , bands are steeply dispersing and can be tracked down to several hundred meV below , both of which are well reproduced by DFT calculations. The agreement between the experimental and DFT band velocities is consistent with recent ARPES studies of Ir-doped RuO2 single crystals Jovic et al. (2018) and with earlier specific heat measurements of the Sommerfeld coefficient in bulk RuO2, which suggested a modest momentum-averaged mass renormalization of Passenheim and McCollum (1969); Glassford and Chelikowsky (1994). The fact that the true electronic structure of RuO2 can be well accounted for by DFT+ allows us to utilize such calculations to understand how epitaxial strains can be employed to engineer features of the electronic structure to enhance the instability towards superconductivity.
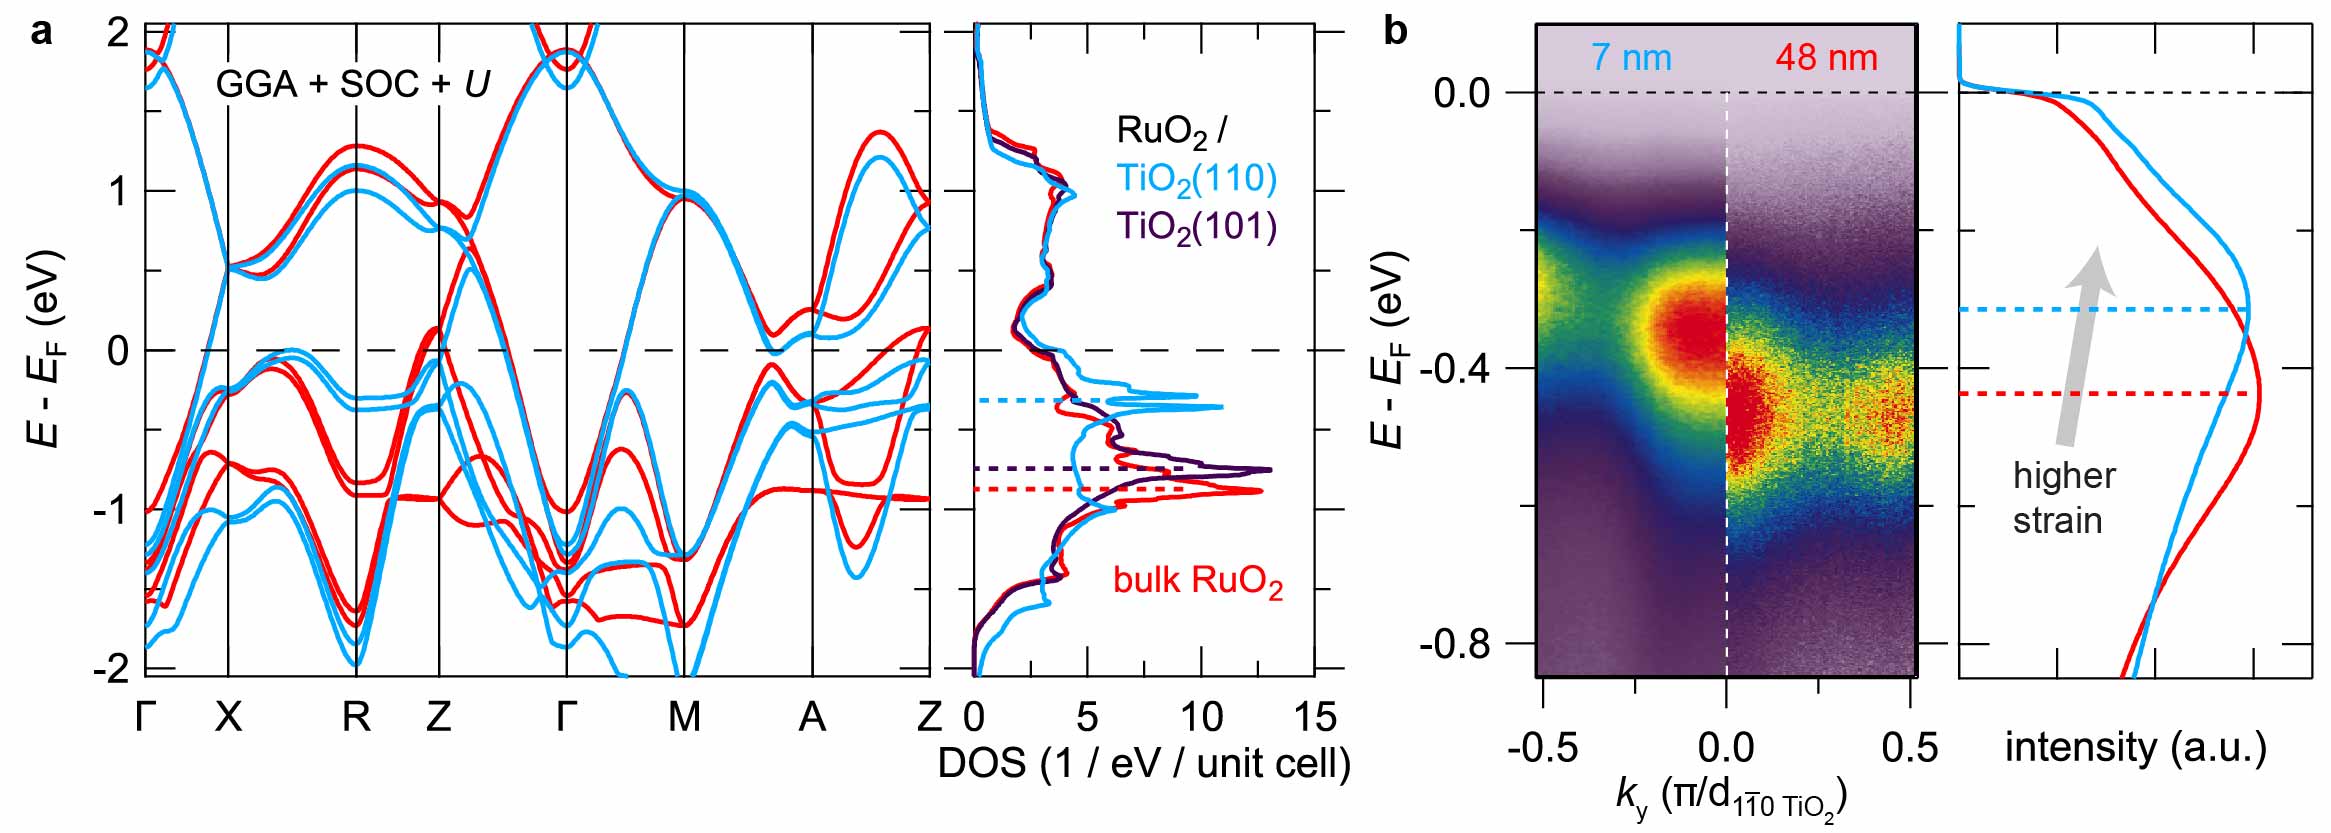
In Fig. 4a, we show the strain dependence of the DFT band structure (left panel) and DOS (right panel) for RuO2(110), RuO2(101), and bulk RuO2. While the results for RuO2(101) are almost identical to bulk, the results for RuO2(110) exhibit significant differences: the large -derived peak in the DOS (centered around a binding energy of 800 meV for bulk) is split into multiple peaks for RuO2(110), several of which are shifted closer to the Fermi level, thereby increasing . In our studies, we found that this strain-dependent trend was robust against details of the DFT calculations, such as whether was finite (Supplementary Fig. S12). In order to determine whether this strain dependence of is realized in experiment, we compared the electronic structure of a thin (7 nm) highly strained RuO2(110) film with a much thicker (48 nm) strain-relaxed RuO2(110) film. The surface lattice constants of the 48 nm thick film were closer to bulk RuO2 than the 7 nm thick film (Supplementary Fig. S14), so we expect that the surface electronic structure probed by ARPES of the thicker film to be more representative of bulk RuO2. Comparisons between the RuO2(110) and RuO2(101) surfaces are less straightforward, since different parts of the three-dimensional Brillouin zone are sampled by ARPES (Supplementary Fig. S15). Figure 4b shows spectra side-by-side for the 7 nm (left) and 48 nm (right) films of RuO2(110) along the same cut (c) through -space from Fig. 3 where the photoemission intensity is dominated by initial states. The higher levels of strain present at the film surface for the 7 nm thick sample cause a substantial shift of the flat bands towards by meV relative to the more relaxed 48 nm thick sample. Integrating the ARPES data over the full measured region of -space for both samples gives the average energy distribution curves plotted in the right half of Fig. 4b, which show that spectral weight near is enhanced as the states move towards , in qualitative agreement with the trend predicted by DFT. Our results show that the primary electronic effect of epitaxial strains in RuO2(110) is to alter the relative occupancies of the and , orbitals as compared with bulk, and to push a large number of states with character closer to , which enhances and likely .
Observations of Fermi-liquid-like quasiparticles near that scatter at higher energies primarily via their interaction with phonons Glassford and Chelikowsky (1994), along with the fact that superconductivity in RuO2(110) persists in the dirty limit (Supplementary Fig. S9), are both consistent with conventional Cooper pairing, suggesting that calculations assuming an electron-phonon mechanism may be enlightening. We performed DFT-based Migdal-Eliashberg calculations of for bulk RuO2 and strained RuO2(110) that indeed indicate epitaxial strain can enhance by several orders of magnitude. For bulk RuO2, we find that the empirical Coulomb pseudopotential must satisfy to be compatible with the experimentally measured upper bound on . For this range of , for RuO2(110) can be as high as (Supplementary Fig. S16). A robust strain-induced enhancement of the electron-phonon coupling boosts by a factor of 20 (for ), and this ratio becomes even larger for higher values of (e.g. for , ). Although these estimations of are broadly consistent with our experimental findings, conventional superconductivity in RuO2 remains a working hypothesis until measurements of the order parameter are possible.
We believe our results demonstrate that a promising strategy to create new transition-metal superconductors is to apply judiciously chosen anisotropic strains that modulate degeneracies among orbitals near . Many classic studies of conventional superconductors that have nearly-free-electron -derived states spanning show decreases in under hydrostatic pressure, due to lattice stiffening Smith and Chu (1967). In a limited number of elements where actually increases under pressure, electron transfer between orbitals has been suggested as causing the enhanced s Hamlin (2015); a drawback of this approach, however, is that large pressures of GPa are typically required to, e.g., double . More recently, measurements on single crystals of the unconventional superconductor Sr2RuO4 have shown that uniaxial pressures of only can boost by more than a factor of two Steppke et al. (2017). Independent of the underlying mechanism, it appears that anisotropic strains may prove much more effective than hydrostatic pressure for tuning superconductivity in multi-orbital systems, as shown here for RuO2, as well as in Sr2RuO4.
Sizable coupling between the lattice and electronic degrees of freedom in rutile-like crystal structures has been well established both theoretically Eyert et al. (2000) and experimentally in VO2, where strain-induced variations in the orbital occupancies can modify the metal-insulator transition by Muraoka and Hiroi (2002); *aetukuri_control_2013. Therefore, it may be promising to explore other less strongly correlated (i.e., and ) rutile compounds such as MoO2 for strain-stabilized superconductivity, instead of employing chemical doping Alves et al. (2010); *alves_superconductivity_2012; *parker_evidence_2014. Finally, since RuO2/TiO2(110) is the first known stoichiometric superconductor within the rutile family, further optimization of the superconductivity may enable the creation of structures that integrate superconductivity with other functional properties that have been extensively studied in other rutile compounds, such as high photocatalytic efficiency, half-metallic ferromagnetism, and large spin Hall conductivities.
Acknowledgements
The authors thank Y. Li for assistance with electrical transport measurements. This work was supported through the National Science Foundation [Platform for the Accelerated Realization, Analysis, and Discovery of Interface Materials (PARADIM)] under Cooperative Agreement No. DMR-1539918, NSF DMR-1709255, the Air Force Office of Scientific Research Grant No. FA9550-15-1-0474, and the Department of Energy (Award No. DE-SC0019414). This research is funded in part by the Gordon and Betty Moore Foundation’s EPiQS Initiative through Grant No. GBMF3850 to Cornell University. This work made use of the Cornell Center for Materials Research (CCMR) Shared Facilities, which are supported through the NSF MRSEC Program (No. DMR-1719875). The FEI Titan Themis 300 was acquired through NSF-MRI-1429155, with additional support from Cornell University, the Weill Institute, and the Kavli Institute at Cornell. Device fabrication and substrate preparation were performed in part at the Cornell NanoScale Facility, a member of the National Nanotechnology Coordinated Infrastructure (NNCI), which is supported by the NSF (Grant No. ECCS-1542081).
Author contributions
H.P., N.J.S., and H.P.N. synthesized the samples by MBE. J.P.R., H.P., N.J.S., and H.P.N. characterized the samples by XRD. J.P.R., L.M., and Y.L. characterized the samples by electrical transport; L.M. patterned resistivity bridges on select films. J.P.R., J.K.K., J.N.N., and B.D.F. characterized the samples by ARPES and LEED. B.H.G. characterized the samples by STEM. J.P.R. performed DFT calculations of the electronic structure and B.P. performed DFT-based calculations of the electron-phonon coupling. L.F.K., D.G.S., and K.M.S. supervised the various aspects of this project. J.P.R. and K.M.S. wrote the manuscript with input from all authors.
Competing interests
The authors declare no competing interests.
Data availability statement
The datasets generated during and analysed during the current study are available from the corresponding author on reasonable request.
Methods
Film synthesis
Epitaxial thin films of RuO2 were synthesized on various orientations of rutile TiO2 substrates using a GEN10 reactive oxide molecular-beam epitaxy (MBE) system (Veeco Instruments). Prior to growth, TiO2 substrates (Crystec, GmbH) were cleaned with organic solvents, etched in acid, and annealed in air to produce starting surfaces with step-terrace morphology, following the methods in Ref. Yamamoto et al. (2005). Elemental ruthenium (99.99% purity, ESPI Metals) was evaporated using an electron-beam evaporator in background oxidant partial pressures of Torr of distilled ozone ( 80% O3 + 20% O2) at substrate temperatures of C, as measured by a thermocouple. Reflection high-energy electron diffraction was used to monitor the surface crystallinity of the films in situ and showed characteristic oscillations in intensity during most of the Ru deposition, indicating a layer-by-layer growth mode following the initial nucleation of several-monolayer-thick RuO2 islands He et al. (2015).
Film characterization
The crystal structures of all RuO2 thin-film samples were characterized via lab-based x-ray diffraction (XRD) measurements with Cu-K radiation (Rigaku SmartLab and Malvern Panalytical Empyrean diffractometers). Four-point probe electrical transport measurements were conducted on greater than 20 RuO2 films from 300 K down to a base temperature of 0.4 K using a Physical Properties Measurement System equipped with a He-3 refrigerator (Quantum Design). All RuO2 / TiO2(110) samples were superconducting with s ranging from K, except for ultrathin films with residual resistivities , as described in the main text and supplemental information. A systematic investigation of how the crystal structures, structural defects and superconducting properties (e.g. and ) of the films are correlated—and how these vary under different film synthesis conditions—is beyond the scope of the present work and will be published elsewhere.
A subset of films studied by XRD and transport were also characterized in situ by angle-resolved photoemission spectroscopy (ARPES) and low-energy electron diffraction (LEED). For these measurements, films were transferred under ultrahigh vacuum immediately following growth to an analysis chamber with a base pressure of Torr equipped with a helium plasma discharge lamp, a hemispherical electron analyzer (VG Scienta R4000), and a four-grid LEED optics (SPECS ErLEED 150).
A subset of films studied by XRD and transport were also imaged using cross-sectional scanning transmission electron microscopy. Cross-sectional specimens were prepared using the standard focused ion beam (FIB) lift-out process on a Thermo Scientific Helios G4 X FIB. High-angle annular dark-field scanning transmission electron microscopy (HAADF-STEM) images were acquired on an aberration-corrected FEI Titan Themis at 300 keV with a probe convergence semi-angle of 21.4 mrad and inner and outer collection angles of 68 and 340 mrad.
Electronic structure calculations
Non-magnetic density functional theory (DFT) calculations for the electronic structure of RuO2 were performed using the Quantum ESPRESSO software package Giannozzi et al. (2009); *giannozzi_advanced_2017 with fully relativistic ultrasoft pseudopotentials for Ru and O Dal Corso (2014). We represented the Kohn-Sham wavefunctions in a basis set of plane waves extending up to a kinetic energy cutoff of 60 Ry, and used a cutoff of 400 Ry for representing the charge density. Brillouin zone integrations were carried out on an -mesh with 70 meV of Gaussian smearing. Perdew, Burke and Ernzerhof’s parametrization of the generalized gradient approximation was employed as the exchange-correlation functional Perdew et al. (1996), supplemented by an on-site correction of eV within spheres surrounding the Ru sites, following Ref. Berlijn et al. (2017).
After obtaining self-consistent Kohn-Sham eigenstates via DFT, we used the pw2wannier and Wannier90 codes Mostofi et al. (2014) to construct 20 Wannier functions spanning the manifold of eigenstates surrounding (20 = 10 Kramers-degenerate -orbitals per Ru atom 2 Ru atoms per unit cell). Following Ref. Eyert (2002), to account for the non-symmorphic space group symmetries of rutile crystal structures, we referenced the trial orbitals employed in the Wannierisation routine to locally rotated coordinate systems centered on the two Ru sites within each unit cell. Orbital designations employed in the main text such as and , refer to projections onto this basis of Wannier functions. The more computationally efficient Wannier basis was used to calculate quantities that required dense meshes to be properly converged, such as the the projected Fermi surface in Fig. 3 ( -mesh) and the near- density of states traces in Fig. 4 ( -meshes).
Because the RuO2 samples studied in this work are thin films subject to biaxial epitaxial strains imposed by differently oriented rutile TiO2 substrates, we performed DFT + Wannier calculations of the electronic structure for several different crystal structures of RuO2 as summarized in the supplemental information (Supplementary Table 1). We used the ISOTROPY software package Stokes et al. to study distortions of the parent tetragonal rutile crystal structure that are induced in biaxially strained thin films. Crystal structures and Wannier functions were visualized using the VESTA software package Momma and Izumi (2011).
Electron-phonon coupling calculations
To generate the inputs required for the electron-phonon coupling calculations described below, first-principles electronic structure and phonon calculations were performed using the Quantum ESPRESSO software package with norm-conserving pseudopotentials and plane-wave basis sets Giannozzi et al. (2009); *giannozzi_advanced_2017. Here we employed a kinetic energy cutoff of 160 Ry, an electronic momentum -point mesh of , of Methfessel-Paxton smearing for the occupation of the electronic states, and a tolerance of for the total energy convergence. The generalized gradient approximation as implemented in the PBEsol functional Perdew et al. (2008) was employed as the exchange-correlation functional. For the Wannier interpolation, we used an interpolating electron-momentum mesh of and a phonon-momentum mesh of . Results for bulk RuO2 were calculated using the crystal structure that minimizes the DFT-computed total energy with the PBEsol functional: and . Results for strained RuO2(110) were calculated by changing the lattice constants of this “bulk” crystal structure by along , along , along , and setting . The lattice constant along and internal coordinates of this simulated RuO2(110) structure were determined by allowing the structure to relax so as to (locally) minimize the DFT-computed total energy.
Electron-phonon coupling calculations were performed using the EPW code Poncé et al. (2016), using an interpolated electron-momentum mesh of and an interpolated phonon-momentum mesh of . The isotropic Eliashberg spectral function and total electron-phonon coupling constant (integrated over all phonon modes and wavevectors) were calculated with a phonon smearing of 0.2 meV. From the calculated and , we estimated the superconducting transition temperature using the semi-empirical McMillan-Allen-Dynes formula McMillan (1968); *allen_transition_1975:
| (2) |
References
- Carbotte (1990) J. P. Carbotte, Reviews of Modern Physics 62, 1027 (1990).
- Note (1) For simplicity, we assume that all of the non-isotropic - and -dependencies that appear in a more realistic formulation of the Cooper pairing problem have been averaged away. Note that within the range of validity of equation (1)—viz., —increasing (increasing ) generally enhances (suppresses) , respectively, assuming that superconductivity remains the dominant instability.
- Hamlin (2015) J. J. Hamlin, Physica C: Superconductivity and its Applications Superconducting Materials: Conventional, Unconventional and Undetermined, 514, 59 (2015).
- Burganov et al. (2016) B. Burganov, C. Adamo, A. Mulder, M. Uchida, P. King, J. Harter, D. Shai, A. Gibbs, A. Mackenzie, R. Uecker, M. Bruetzam, M. Beasley, C. Fennie, D. Schlom, and K. Shen, Physical Review Letters 116, 197003 (2016).
- Ohtomo and Hwang (2004) A. Ohtomo and H. Y. Hwang, Nature 427, 423 (2004).
- Kawasaki et al. (2018) J. K. Kawasaki, D. Baek, H. Paik, H. P. Nair, L. F. Kourkoutis, D. G. Schlom, and K. M. Shen, Physical Review Materials 2, 054206 (2018).
- Lock J. M. and Bragg William Lawrence (1951) Lock J. M. and Bragg William Lawrence, Proceedings of the Royal Society of London. Series A. Mathematical and Physical Sciences 208, 391 (1951).
- Locquet et al. (1998) J.-P. Locquet, J. Perret, J. Fompeyrine, E. Mächler, J. W. Seo, and G. V. Tendeloo, Nature 394, 453 (1998).
- Si et al. (1999) W. Si, H.-C. Li, and X. X. Xi, Applied Physics Letters 74, 2839 (1999).
- Si and Xi (2001) W. Si and X. X. Xi, Applied Physics Letters 78, 240 (2001).
- Bozovic et al. (2002) I. Bozovic, G. Logvenov, I. Belca, B. Narimbetov, and I. Sveklo, Physical Review Letters 89, 107001 (2002).
- Note (2) In principle, assuming that all Fermi liquids are eventually unstable towards superconductivity at low enough temperatures and magnetic fields (including internal fields arising from magnetic impurities), this is not strictly a change in the ground state of the system. However, for our purposes, extremely low temperatures and fields below what are experimentally achievable can be thought of as effectively zero, justifying the use of phrases such as “strain-induced superconductivity” interchangeably with “huge enhancement of critical temperature”.
- Lin et al. (2004) J. J. Lin, S. M. Huang, Y. H. Lin, T. C. Lee, H. Liu, X. X. Zhang, R. S. Chen, and Y. S. Huang, Journal of Physics: Condensed Matter 16, 8035 (2004).
- Berlijn et al. (2017) T. Berlijn, P. Snijders, O. Delaire, H.-D. Zhou, T. Maier, H.-B. Cao, S.-X. Chi, M. Matsuda, Y. Wang, M. Koehler, P. Kent, and H. Weitering, Physical Review Letters 118, 077201 (2017).
- Burdett et al. (1987) J. K. Burdett, T. Hughbanks, G. J. Miller, J. W. Richardson, and J. V. Smith, Journal of the American Chemical Society 109, 3639 (1987).
- Pinto et al. (2018) N. Pinto, S. J. Rezvani, A. Perali, L. Flammia, M. V. Milošević, M. Fretto, C. Cassiago, and N. D. Leo, Scientific Reports 8, 1 (2018).
- Meyer et al. (2015) T. L. Meyer, L. Jiang, S. Park, T. Egami, and H. N. Lee, APL Materials 3, 126102 (2015).
- Gozar et al. (2008) A. Gozar, G. Logvenov, L. F. Kourkoutis, A. T. Bollinger, L. A. Giannuzzi, D. A. Muller, and I. Bozovic, Nature 455, 782 (2008).
- He et al. (2013) S. He, J. He, W. Zhang, L. Zhao, D. Liu, X. Liu, D. Mou, Y.-B. Ou, Q.-Y. Wang, Z. Li, L. Wang, Y. Peng, Y. Liu, C. Chen, L. Yu, G. Liu, X. Dong, J. Zhang, C. Chen, Z. Xu, X. Chen, X. Ma, Q. Xue, and X. J. Zhou, Nature Materials 12, 605 (2013).
- Lee et al. (2014) J. J. Lee, F. T. Schmitt, R. G. Moore, S. Johnston, Y.-T. Cui, W. Li, M. Yi, Z. K. Liu, M. Hashimoto, Y. Zhang, D. H. Lu, T. P. Devereaux, D.-H. Lee, and Z.-X. Shen, Nature 515, 245 (2014).
- Paik et al. (2015) H. Paik, J. A. Moyer, T. Spila, J. W. Tashman, J. A. Mundy, E. Freeman, N. Shukla, J. M. Lapano, R. Engel-Herbert, W. Zander, J. Schubert, D. A. Muller, S. Datta, P. Schiffer, and D. G. Schlom, Applied Physics Letters 107, 163101 (2015).
- Yoshimatsu et al. (2017) K. Yoshimatsu, O. Sakata, and A. Ohtomo, Scientific Reports 7, 12544 (2017).
- Goodenough (1971) J. B. Goodenough, Journal of Solid State Chemistry 3, 490 (1971).
- Eyert et al. (2000) V. Eyert, R. Horny, K.-H. Höck, and S. Horn, Journal of Physics: Condensed Matter 12, 4923 (2000).
- Mravlje et al. (2011) J. Mravlje, M. Aichhorn, T. Miyake, K. Haule, G. Kotliar, and A. Georges, Physical Review Letters 106, 096401 (2011).
- Mackenzie (1996) A. P. Mackenzie, Physical Review Letters 76, 3786 (1996).
- Tamai et al. (2019) A. Tamai, M. Zingl, E. Rozbicki, E. Cappelli, S. Ricco, A. de la Torre, S. McKeown Walker, F. Bruno, P. King, W. Meevasana, M. Shi, M. Radovic, N. Plumb, A. Gibbs, A. Mackenzie, C. Berthod, H. Strand, M. Kim, A. Georges, and F. Baumberger, Physical Review X 9, 021048 (2019).
- Ricco et al. (2018) S. Ricco, M. Kim, A. Tamai, S. M. Walker, F. Y. Bruno, I. Cucchi, E. Cappelli, C. Besnard, T. K. Kim, P. Dudin, M. Hoesch, M. J. Gutmann, A. Georges, R. S. Perry, and F. Baumberger, Nature Communications 9, 4535 (2018).
- Sutter et al. (2019) D. Sutter, M. Kim, C. E. Matt, M. Horio, R. Fittipaldi, A. Vecchione, V. Granata, K. Hauser, Y. Sassa, G. Gatti, M. Grioni, M. Hoesch, T. K. Kim, E. Rienks, N. C. Plumb, M. Shi, T. Neupert, A. Georges, and J. Chang, Physical Review B 99, 121115 (2019).
- Sutter et al. (2017) D. Sutter, C. G. Fatuzzo, S. Moser, M. Kim, R. Fittipaldi, A. Vecchione, V. Granata, Y. Sassa, F. Cossalter, G. Gatti, M. Grioni, H. M. Rønnow, N. C. Plumb, C. E. Matt, M. Shi, M. Hoesch, T. K. Kim, T.-R. Chang, H.-T. Jeng, C. Jozwiak, A. Bostwick, E. Rotenberg, A. Georges, T. Neupert, and J. Chang, Nature Communications 8, 15176 (2017).
- Jovic et al. (2018) V. Jovic, R. J. Koch, S. K. Panda, H. Berger, P. Bugnon, A. Magrez, K. E. Smith, S. Biermann, C. Jozwiak, A. Bostwick, E. Rotenberg, and S. Moser, Physical Review B 98, 241101 (2018).
- Passenheim and McCollum (1969) B. C. Passenheim and D. C. McCollum, The Journal of Chemical Physics 51, 320 (1969).
- Glassford and Chelikowsky (1994) K. M. Glassford and J. R. Chelikowsky, Physical Review B 49, 7107 (1994).
- Smith and Chu (1967) T. F. Smith and C. W. Chu, Physical Review 159, 353 (1967).
- Steppke et al. (2017) A. Steppke, L. Zhao, M. E. Barber, T. Scaffidi, F. Jerzembeck, H. Rosner, A. S. Gibbs, Y. Maeno, S. H. Simon, A. P. Mackenzie, and C. W. Hicks, Science 355, eaaf9398 (2017).
- Muraoka and Hiroi (2002) Y. Muraoka and Z. Hiroi, Applied Physics Letters 80, 583 (2002).
- Aetukuri et al. (2013) N. B. Aetukuri, A. X. Gray, M. Drouard, M. Cossale, L. Gao, A. H. Reid, R. Kukreja, H. Ohldag, C. A. Jenkins, E. Arenholz, K. P. Roche, H. A. Dürr, M. G. Samant, and S. S. P. Parkin, Nature Physics 9, 661 (2013).
- Alves et al. (2010) L. M. S. Alves, V. I. Damasceno, C. A. M. dos Santos, A. D. Bortolozo, P. A. Suzuki, H. J. Izario Filho, A. J. S. Machado, and Z. Fisk, Physical Review B 81, 174532 (2010).
- Alves et al. (2012) L. M. S. Alves, C. a. M. dos Santos, S. S. Benaion, A. J. S. Machado, B. S. de Lima, J. J. Neumeier, M. D. R. Marques, J. A. Aguiar, R. J. O. Mossanek, and M. Abbate, Journal of Applied Physics 112, 073923 (2012).
- Parker et al. (2014) D. Parker, J. C. Idrobo, C. Cantoni, and A. S. Sefat, Physical Review B 90, 054505 (2014).
- Yamamoto et al. (2005) Y. Yamamoto, K. Nakajima, T. Ohsawa, Y. Matsumoto, and H. Koinuma, Japanese Journal of Applied Physics 44, L511 (2005).
- He et al. (2015) Y. He, D. Langsdorf, L. Li, and H. Over, The Journal of Physical Chemistry C 119, 2692 (2015).
- Giannozzi et al. (2009) P. Giannozzi, S. Baroni, N. Bonini, M. Calandra, R. Car, C. Cavazzoni, D. Ceresoli, G. L. Chiarotti, M. Cococcioni, I. Dabo, A. D. Corso, S. d. Gironcoli, S. Fabris, G. Fratesi, R. Gebauer, U. Gerstmann, C. Gougoussis, A. Kokalj, M. Lazzeri, L. Martin-Samos, N. Marzari, F. Mauri, R. Mazzarello, S. Paolini, A. Pasquarello, L. Paulatto, C. Sbraccia, S. Scandolo, G. Sclauzero, A. P. Seitsonen, A. Smogunov, P. Umari, and R. M. Wentzcovitch, Journal of Physics: Condensed Matter 21, 395502 (2009).
- Giannozzi et al. (2017) P. Giannozzi, O. Andreussi, T. Brumme, O. Bunau, M. B. Nardelli, M. Calandra, R. Car, C. Cavazzoni, D. Ceresoli, M. Cococcioni, N. Colonna, I. Carnimeo, A. D. Corso, S. d. Gironcoli, P. Delugas, R. A. DiStasio, A. Ferretti, A. Floris, G. Fratesi, G. Fugallo, R. Gebauer, U. Gerstmann, F. Giustino, T. Gorni, J. Jia, M. Kawamura, H.-Y. Ko, A. Kokalj, E. Küçükbenli, M. Lazzeri, M. Marsili, N. Marzari, F. Mauri, N. L. Nguyen, H.-V. Nguyen, A. Otero-de-la Roza, L. Paulatto, S. Poncé, D. Rocca, R. Sabatini, B. Santra, M. Schlipf, A. P. Seitsonen, A. Smogunov, I. Timrov, T. Thonhauser, P. Umari, N. Vast, X. Wu, and S. Baroni, Journal of Physics: Condensed Matter 29, 465901 (2017).
- Dal Corso (2014) A. Dal Corso, Computational Materials Science 95, 337 (2014).
- Perdew et al. (1996) J. P. Perdew, K. Burke, and M. Ernzerhof, Physical Review Letters 77, 3865 (1996).
- Mostofi et al. (2014) A. A. Mostofi, J. R. Yates, G. Pizzi, Y.-S. Lee, I. Souza, D. Vanderbilt, and N. Marzari, Computer Physics Communications 185, 2309 (2014).
- Eyert (2002) V. Eyert, Annalen der Physik 11, 650 (2002).
- (49) H. T. Stokes, D. M. Hatch, and B. J. Campbell, “Isotropy software suite,” .
- Momma and Izumi (2011) K. Momma and F. Izumi, Journal of Applied Crystallography 44, 1272 (2011).
- Perdew et al. (2008) J. P. Perdew, A. Ruzsinszky, G. I. Csonka, O. A. Vydrov, G. E. Scuseria, L. A. Constantin, X. Zhou, and K. Burke, Physical Review Letters 100, 136406 (2008).
- Poncé et al. (2016) S. Poncé, E. R. Margine, C. Verdi, and F. Giustino, Computer Physics Communications 209, 116 (2016).
- McMillan (1968) W. L. McMillan, Physical Review 167, 331 (1968).
- Allen and Dynes (1975) P. B. Allen and R. C. Dynes, Physical Review B 12, 905 (1975).