Search for Continuous Gravitational Waves from the Central Compact Objects in Supernova Remnants Cassiopeia A, Vela Jr. and G347.30.5
Abstract
We perform a sub-threshold follow-up search for continuous nearly-monochromatic gravitational waves from the central compact objects associated with the supernova remnants Vela Jr., Cassiopeia A, and SNR G347.30.5. Across the three targets, we investigate the most promising 10,000 combinations of gravitational wave frequency and frequency derivative values, based on the results from an Einstein@Home search of the LIGO O1 observing run data, dedicated to these objects. The selection threshold is set so that a signal could be confirmed using the newly released O2 run LIGO data. In order to achieve best sensitivity we perform two separate follow-up searches, on two distinct stretches of the O2 data. Only one candidate survives the first O2 follow-up investigation, associated with the central compact object in SNR G347.30.5, but it is not conclusively confirmed. In order to assess a possible astrophysical origin we use archival X-ray observations and search for amplitude modulations of a pulsed signal at the putative rotation frequency of the neutron star and its harmonics. This is the first extensive electromagnetic follow-up of a continuous gravitational wave candidate performed to date. No significant associated signal is identified. New X-ray observations contemporaneous with the LIGO O3 run will enable a more sensitive search for an electromagnetic counterpart. A focused gravitational wave search in O3 data based on the parameters provided here should be easily able to shed light on the nature of this outlier. Noise investigations on the LIGO instruments could also reveal the presence of a coherent contamination.
1 Introduction
At the time of writing, gravitational waves from 14 binary black hole mergers and a binary neutron star merger have been reported (Abbott et al., 2020; Venumadhav et al., 2020; Nitz et al., 2019; Abbott et al., 2019a). All of these signals are visible in the detectors for less than a second, or several tens of seconds for a binary neutron star merger, and present a strain amplitude of for most of that time.
This paper is about a different type of signal: a persistent train of nearly monochromatic gravitational waves with an amplitude four (or more) orders of magnitude weaker than that of the binary merger signals.
Various physical mechanisms have been suggested that could give rise to continuous gravitational waves: deformations of the compact object, including asymmetric mass distribution (Johnson-McDaniel & Owen, 2013), ringing (r-modes) (Owen et al., 1998), and non axi-symmetric flows of bulk matter induced by differential rotation between the core of the star and its crust through Ekman pumping (Singh, 2017), as well as more exotic scenarios, for instance involving very low mass cold dark matter binaries (Horowitz & Reddy, 2019; Horowitz et al., 2020) or emission from boson clouds around black holes (Arvanitaki et al., 2015; Zhu et al., 2020).
The relationship between the spin frequency of the star and the frequency of the continuous gravitational wave signal depends on the emission mechanism but typically the continuous gravitational wave frequency does not exceed twice the spin frequency. So, in the high sensitive band of the LIGO detectors – between 20 Hz and 2 kHz – we expect continuous gravitational waves from neutron stars with spin periods in the range 1-100 ms.
Perhaps among the most promising candidates for continuous gravitational wave emission are young, isolated neutron stars. These could have a high spindown and hence a potentially large energy budget to be radiated away in gravitational waves.
The central compact objects associated with supernova remnants could indeed be young isolated neutron stars. We know of 10 objects at the center of supernova remnants (Gotthelf et al., 2013). Three of these objects are known pulsars (with spin periods ms) whose slow spin-down rate implies a low spin-down power and weak magnetic dipole field. The rest are undetected as pulsars and their timing properties remain a mystery.
In the past the youngest/closest supernova remnants with identified central compact objects have been chosen as targets for gravitational wave searches that span a broad range of physically plausible signal frequencies and frequency-derivatives (Lindblom & Owen, 2020; Millhouse et al., 2020; Ming et al., 2019; Abbott et al., 2019b; Zhu et al., 2016; Aasi et al., 2015a).
In this paper we use the released LIGO O2 data set to further the results of the O1-data search (Ming et al., 2019) for continuous gravitational wave emission from the compact object in the supernova remnants Vela Jr., Cassiopeia A and SNR G347.30.5. The targets and search setups were chosen based on an optimization scheme that maximizes the total detection probability over search setups and astrophysical targets, assuming a total computing budget of a few months on the Einstein@Home volunteer distributed computing project (Einstein@Home, 2019; Ming et al., 2016, 2018). The detection probability depends on the assumed source and signal properties (distance, age, ellipticity, frequency) as well as on the sensitivity of the search pipeline (search setup and search parameters, noise level).
In Section 2.1, we present the results of the sub-threshold search of Einstein@Home candidates from Ming et al. (2019). In Section 2.2 we describe the follow-up search using part of the LIGO O2 data set. With this search we find a marginal candidate for the source associated with SNR G347.30.5, which is however not definitely confirmed in the second part of the O2 data (Section 2.3.1). We report a search for an electromagnetic counterpart for this candidate in Section 2.3.2. In Section 3 we compute the upper limits on the intrinsic gravitational wave amplitude stemming from the LIGO search. Finally, in Section 4, we summarize our conclusions.
| range | [20-1500] Hz | [20-1500] Hz | [20-1500] Hz |
|---|---|---|---|
| range (@ 100 Hz) | [- ] Hz/s | [- ] Hz/s | [- ] Hz/s |
| range (@ 100 Hz) | [ - ] Hz/s2 | [ - ] Hz/s2 | [ - ] Hz/s2 |
| RA (J2000, in radians) | |||
| DEC (J2000, in radians) |
| 245 hr | 369 hr | 489 hr | |
|---|---|---|---|
| 12 | 8 | 6 | |
| Hz | Hz | Hz | |
| Hz/s | Hz/s | Hz/s | |
| 5 | 9 | 9 | |
| 21 | 21 | 11 |
2 The Search
The search described in this paper targets nearly monochromatic gravitational waves (see for example Section II of Jaranowski et al. (1998)) from compact objects in three supernova remnants, CXOU J232327.9+584842 in Cassiopeia A (Tananbaum, 1999), CXOU J085201.4-461753 in Vela Jr. (Slane et al., 2001), and 1WGA J1713.4-3949 in SNR G347.30.5 (Pferffermann & Aschenbach, 1996), referred to herein as J232327, J085201, and J1713, respectively. No pulsations have been reported from any of these sources.
We use public data from the first (O1; 2015-2016) and second (O2; 2017) run of the advanced LIGO detectors (Abbott et al., 2016; Aasi et al., 2015b; LIGO, 2018, 2019; Vallisneri et al., 2015). Measured on a fully coherent search, and assuming that the O1 and O2 sensitivities are comparable, the relative strain sensitivity improvement from using the O2 data over the O1 data is 27%. But the real value of the O2 data for follow-ups of candidates, is not in the raw sensitivity gain. It rather lies in that the new data is independent of the data where the candidates are originally identified. Together with the fact that the follow-up searches cover a more limited parameter space than the original ones, this makes it possible to assess the significance of a finding on the new data, including confidently claiming a detection.
We use a large-scale hierarchical scheme that was first deployed in Papa et al. (2016) and that has now become standard practice in broad continuous wave searches (Abbott et al., 2017; V. Dergachev & Eggenstein, 2019; Abbott et al., 2019c; Dergachev & Papa, 2019; Palomba et al., 2019; Dergachev & Papa, 2020). The first, and most computationally intensive search on the O1 data is carried out on the Einstein@Home volunteer computing project and it is followed by two follow-up stages on candidates above threshold. We refer to these as Stage-0, Stage-1 and Stage-2. The setup of the Einstein@Home search and of the O1 follow-up stages is described in Ming et al. (2019). The thresholds used here are lower than the ones used in Ming et al. (2019) and candidates exist that survive all O1 follow-up stages. These surviving candidates are further inspected using O2 data.
2.1 The O1 searches
The searched waveforms are defined by frequency and frequency derivative parameters and in these ranges:
| (1) |
The ages of the compact objects are taken equal to yrs, yrs, yrs for J232327, J085201, and J1713 respectively. These age values incorporate the uncertainties on the birth-dates of our targets (Wang et al., 1997; Iyudin, 1999; Fesen et al., 2006; Allen et al., 2015), airing towards the smaller estimates, which yield a broader (and hence more conservative, safer) search range – see Ming et al. (2018) for more details. The frequency derivative ranges for Hz are shown in Table LABEL:tab:SearchParams, for reference. The frequency and frequency derivatives are defined at the barycentric reference time (epoch of the ephemeris) , which is first given in Table LABEL:tab:SearchParams.
The basic building block of the hierarchical search is the stack-slide semi-coherent search that uses the global correlation transform (GCT) method (Pletsch & Allen, 2009; Pletsch, 2008, 2010): The data is divided in segments, and each segment is searched coherently combining the data from both detectors with a matched filter called the -statisitic (Cutler & Schutz, 2005). The -statisitic optimally combines together the data from the two detectors at different times based on their noise level and the antenna sensitivity pattern and also references arrival time to the solar system barycenter based on the sub-arcsec coordinates for each target. The results from these coherent searches are appropriately summed, one per segment, yielding an average detection statistic value over all the segments, . For a stack-slide search on Gaussian noise, follows a chi-squared distribution with degrees of freedom, . When the search becomes a fully coherent search.
In Table LABEL:tab:GridSpacings we show the main parameters of the Stage-0 searches: the frequency spacing and the first and second order frequency derivative spacings and . We refer the reader to Ming et al. (2019) for a detailed description of the search setup.
Based on the coherent -statistics, a new statistics is constructed that is robust to the presence of persistent and transient lines in the data: . This detection statistic tests the signal hypothesis not only against the Gaussian noise hypothesis but also against the hypothesis that a persistent or transient spectral artefact in one of the two data streams is contaminating the data (Keitel et al., 2014; Keitel, 2016). eases the impact on the detection efficiency and false alarm rate of various types of spectral artefacts in the data and we use it to rank the search results on the volunteer computers and based on it, select the results that are returned to the main server.
A result, or candidate, is defined by the targeted sky position (one of three), by the frequency, first- and second-order frequency derivatives and by its detection statistic value.
We consider only the “undisturbed” frequency bands identified in Ming et al. (2019), i.e. frequency bands where the bulk of the search results do not display major deviations from what is expected in the absence of large noise artefacts. We apply to the candidates from these bands the same semi-coherent DM-off veto (S. J. Zhu & Walsh, 2017) and the same clustering procedure as in Ming et al. (2019); A. Singh & Walsh (2017). The DM-off veto discards candidates whose detection statistic increases when the astrophysical Doppler modulation is removed from the searched signal waveform (Doppler Modulation-off). The clustering procedure bundles together high detection statistic values which are close enough in parameter space that they can be ascribed to the same root cause. This saves computations in the follow-up stages because not all close-by candidates are searched independently.
From this set we further select those candidates whose detection statistic value lies above a given threshold. Since the number of templates covered in a fixed frequency interval increases with frequency, we set a different detection threshold in the frequency ranges [20-250] Hz, [250-520] Hz and [520-1500] Hz. We refer to these as the low, mid and high frequency range, respectively. Table LABEL:tab:Thresholds shows the values of the thresholds for the different targets and frequencies. The thresholds are such that overall a few thousand candidates are followed up from each target. We use different thresholds for the different targets in the same frequency range because a different number of waveforms are probed for the different targets, due to the different age: for the younger targets a broader range of frequency derivatives is sampled.
The Stage-1 and Stage-2 follow-ups use the same search setup for all targets, with a coherent time-baseline of about 60 days (1440 hrs) and the entire O1 data set, respectively. Candidates survive from one stage to the next if their detection statistic value increases consistently with what is expected from a signal.
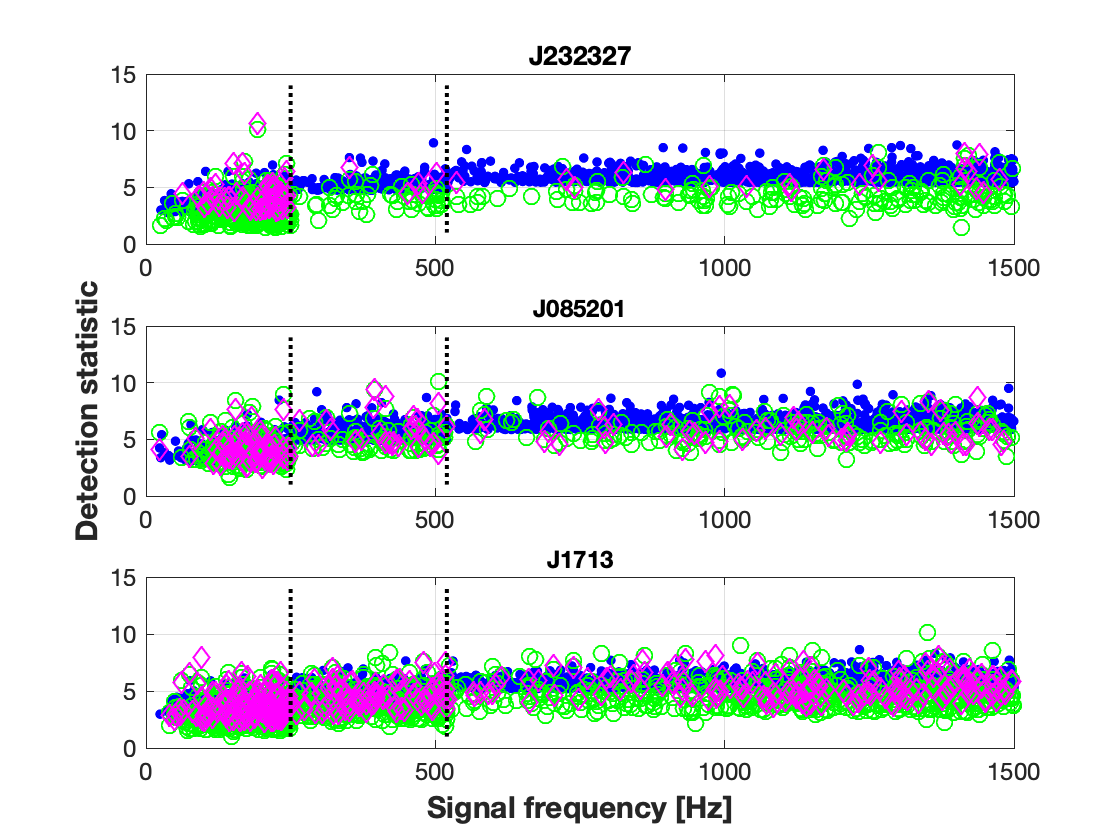
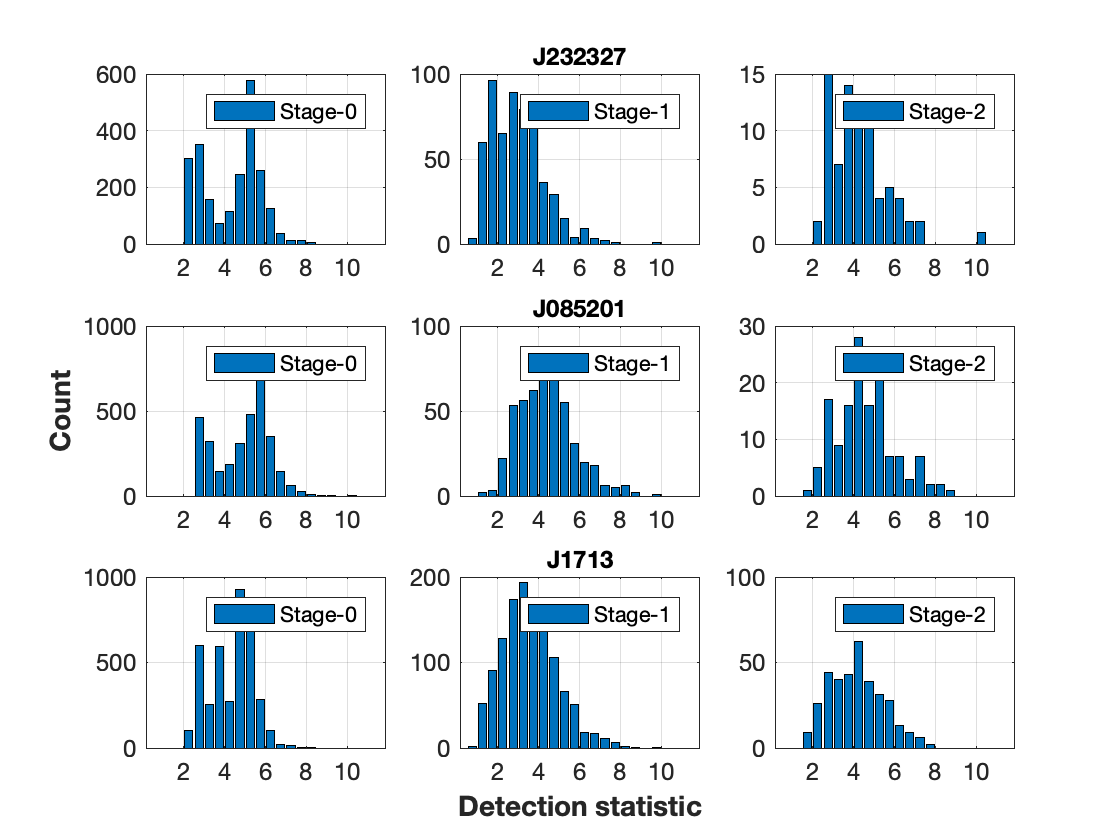
Initially we have 3275 candidates from the J085201 search, 2269 from J232327 and 3918 from J1713. The DM-off veto rejects 557, 1223 and 1032 candidates for J085201, J232327 and J1713, respectively. Figure 2 shows the detection statistic values of these candidates as a function of frequency throughout these follow-up stages and Figure 2 the distribution of their detection statistic values.
After each follow-up search the number of surviving candidates decreases and at the end of the last stage we are left with candidates of which 142 are from J085201, 81 from J232327 and 352 from J1713. We note that the fraction of candidates surviving the last stage on O1 data is about 4% of the original ones for J085201 and J232327 and 9% for J1713. This is consistent with the initial search setup for J1713 having a significantly longer coherence time-baseline compared to the other searches, and hence the follow-up searches having less discriminatory power for the J1713 candidates, that were selected based on more stringent criteria, to start with.
2.2 The follow-up searches on the first half of O2
In order to reduce the trials factor of the last stage follow-up, we perform two separate searches in O2. For the first follow-up search on O2 data we only use a portion of the available data, O2a, which is comparable in duration with the O1 set and spans about 120 days. In fact, an interruption in the science run of LIGO between May 9th and June 8th 2017, provides a natural split of the data in two sets. We use the same search setup as for the last stage on O1, which is fully coherent. We search a region which corresponds to the 99% confidence signal-parameters containment region, based on signal simulation-and-recovery Monte Carlos. We consider the most significant result from each follow-up.
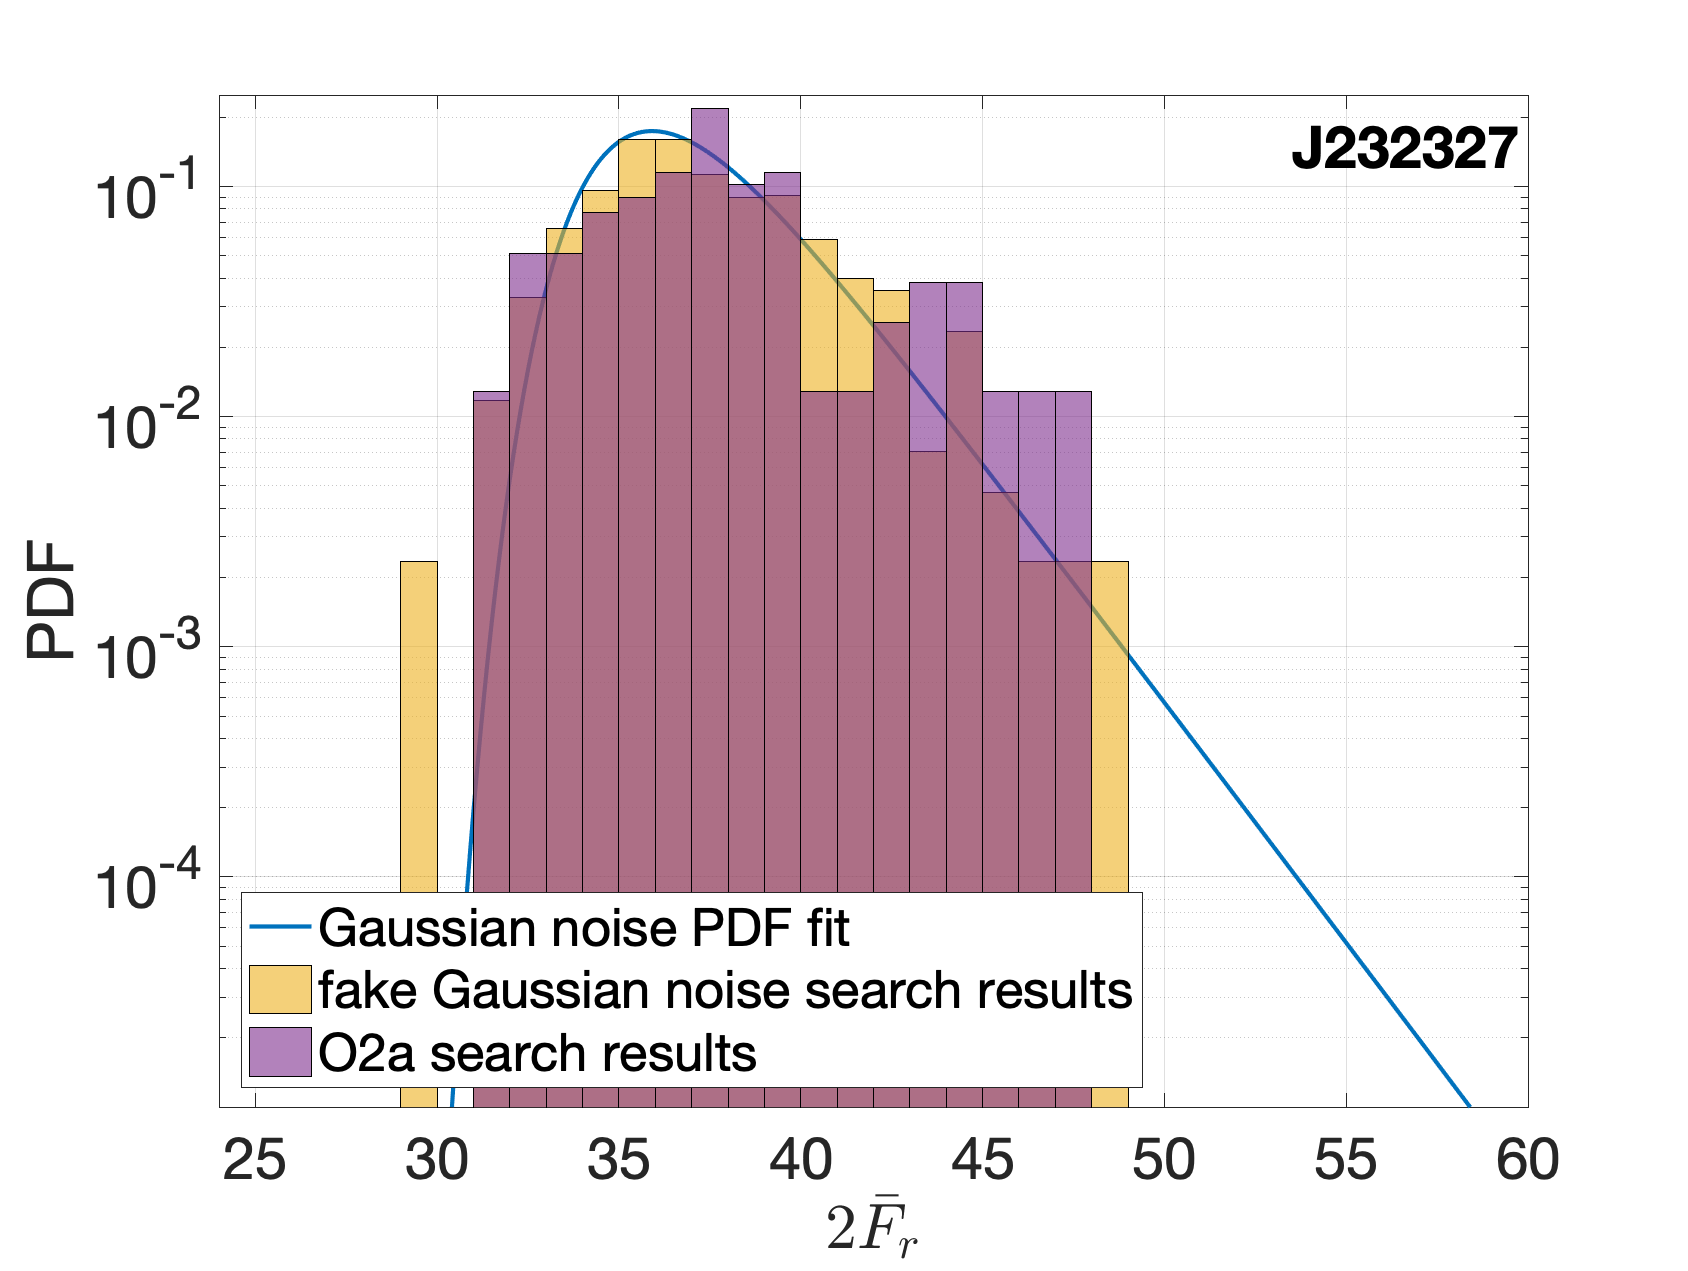
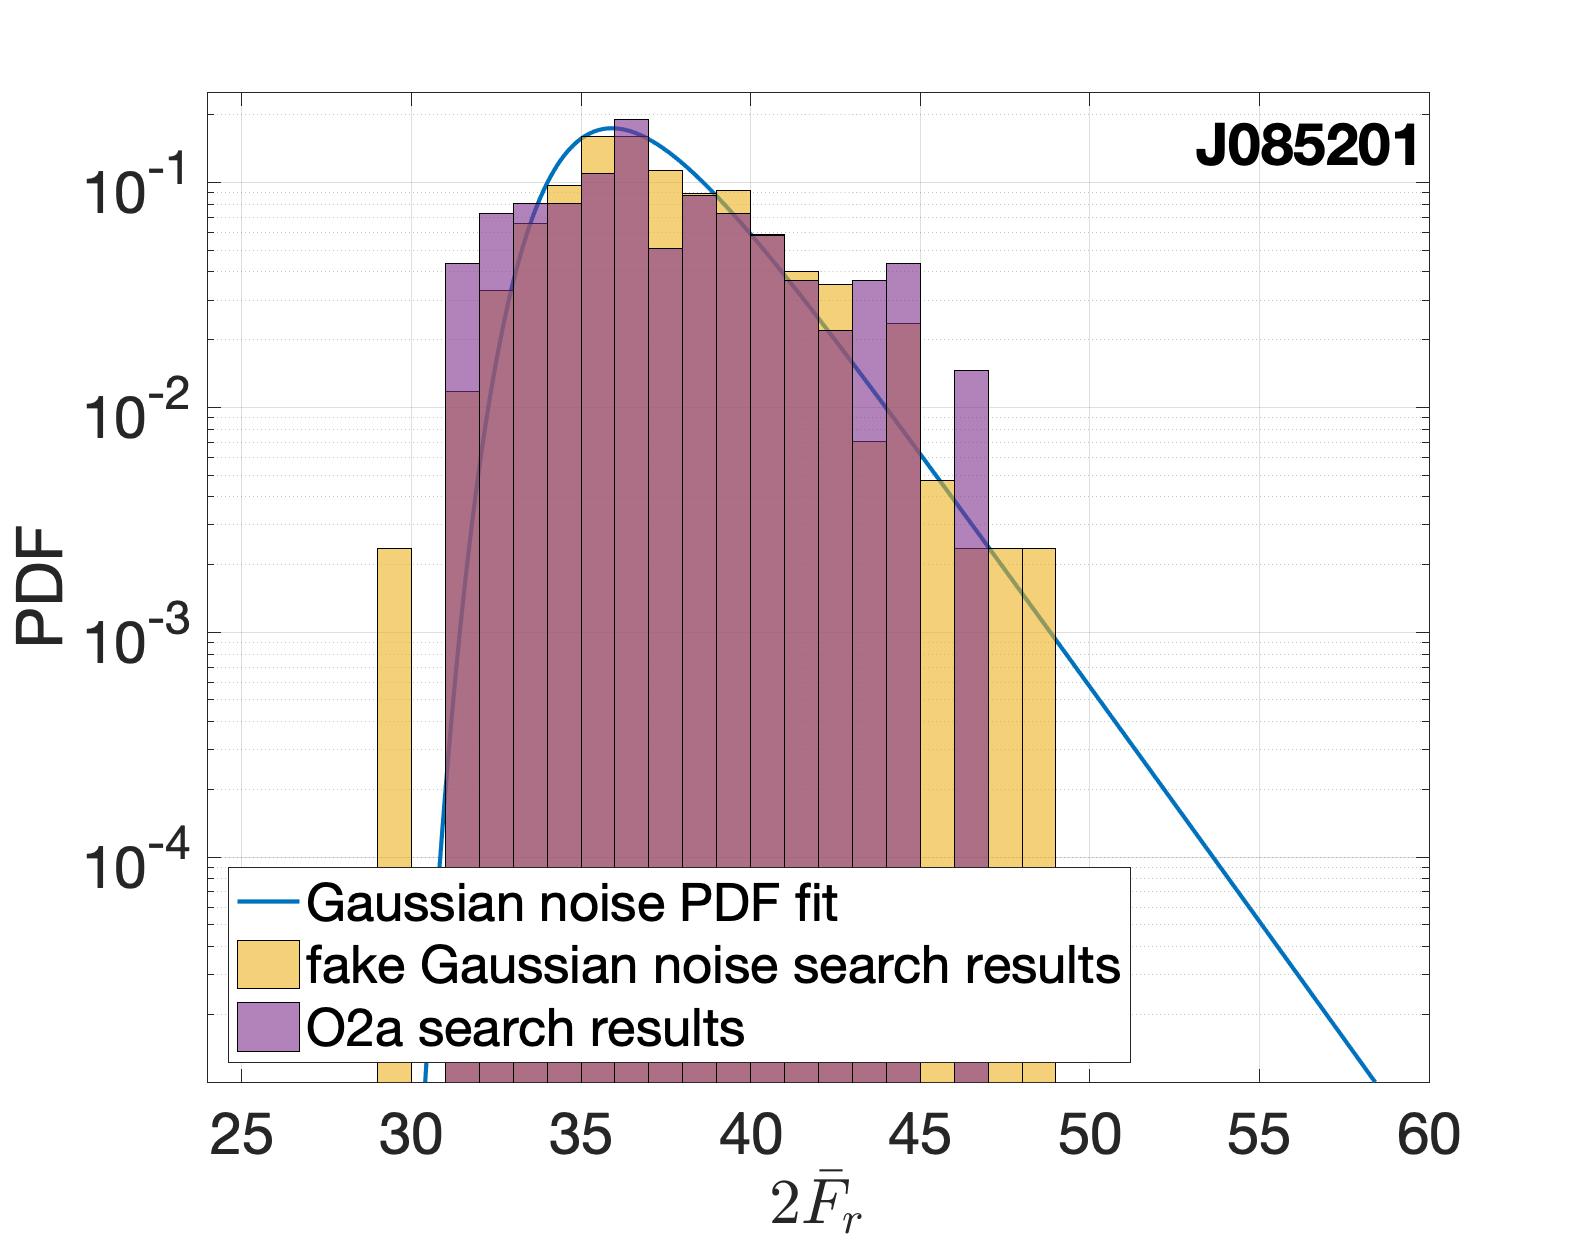
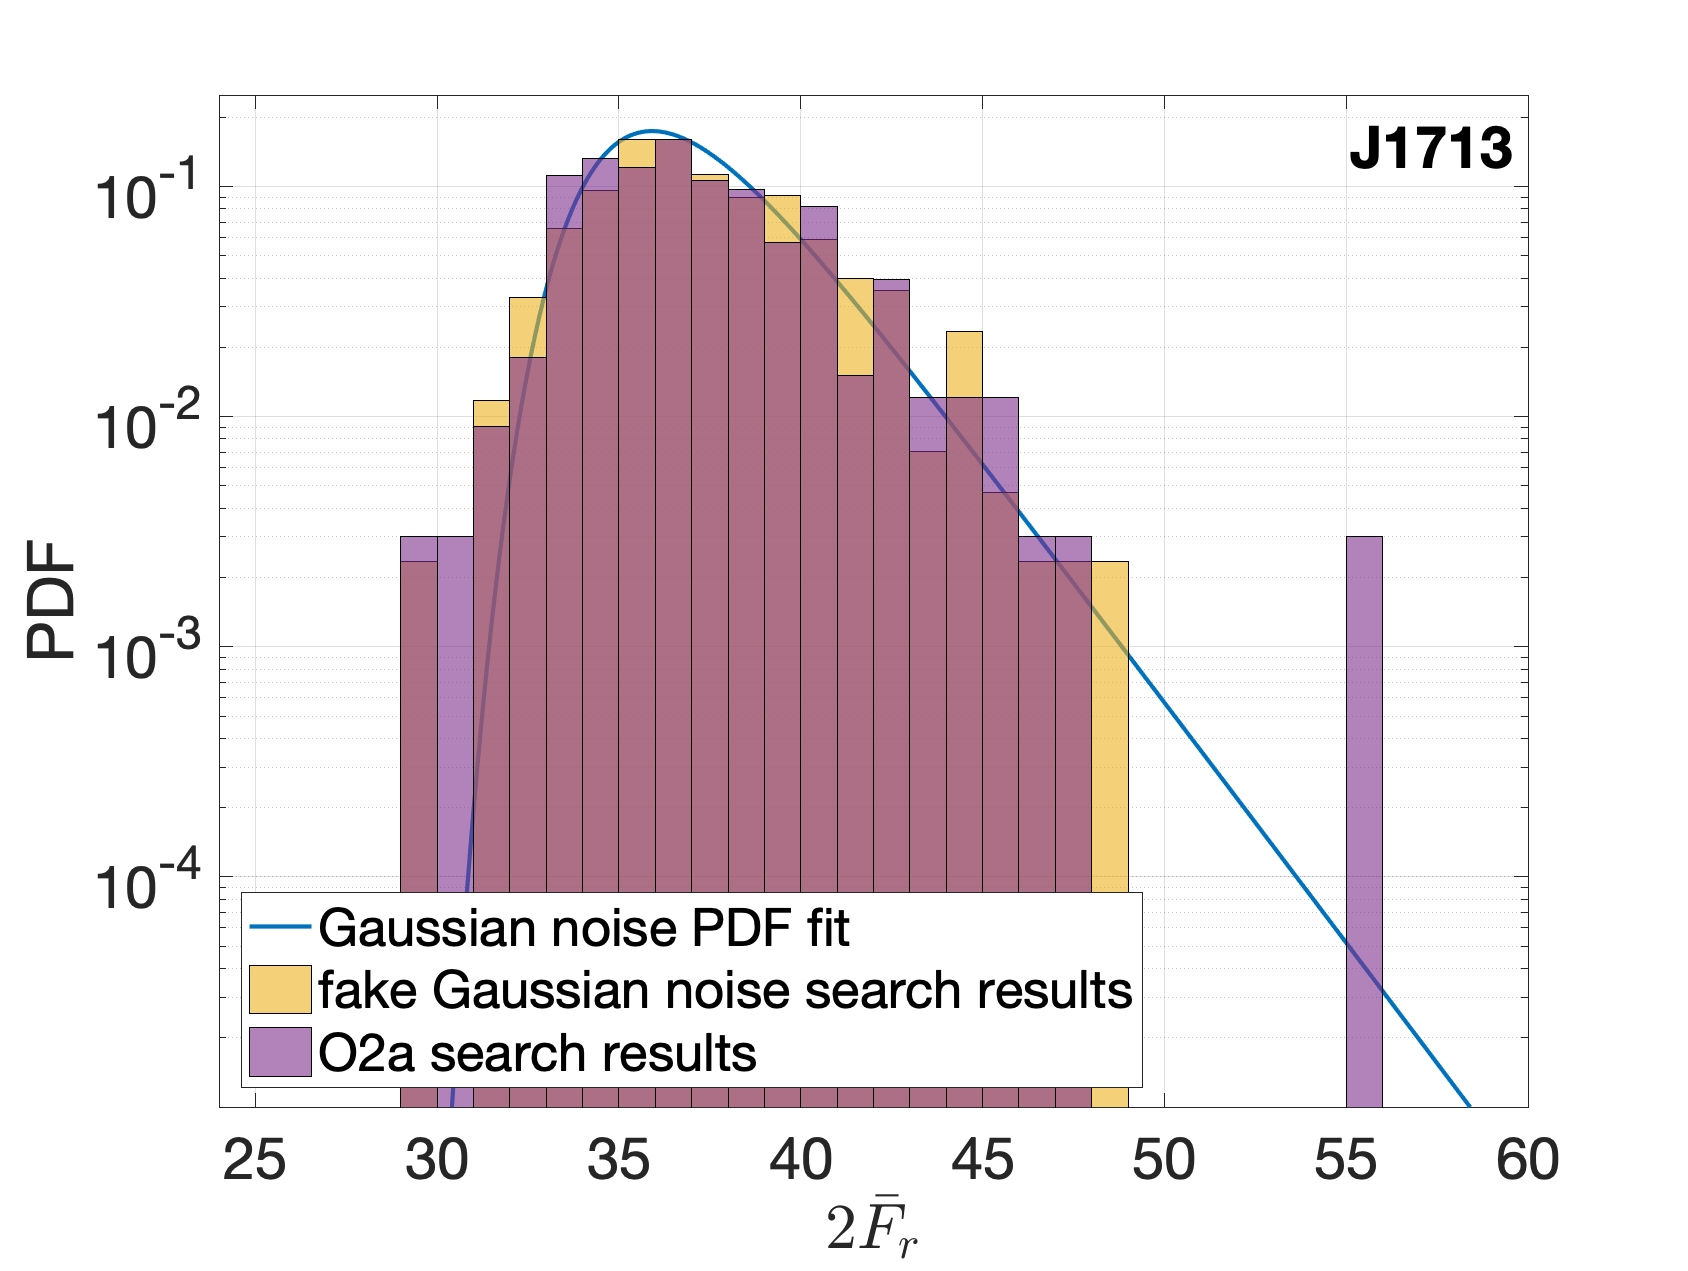
We follow-up only the outliers that do not fall in O2 spectral regions possibly contaminated by lines: 137 from J085201, 78 from J232327 and 331 from J1713, which amounts to 95% of the O1 outliers. Each search covers about 14 million templates. If these templates had no overlap, the 14 million results would be independent of each other and the distribution of the maximum over every 14 million template search for Gaussian noise would be known. In reality nearby templates present a large overlap: the grids are constructed in this way in order to reduce the false dismissal rate for signals whose parameters lie in-between the grid points. We find that the actual distribution for Gaussian noise data is well modelled assuming a smaller number of independent searches (8.2 million). This is what the solid line (red) in Figure 3 shows. The fit was performed on the results of identical searches on fake Gaussian noise, which is what the yellow bars show.
The darker (purple) bars in Figure 3 are the normalised histogram for the detection statistic of the results of the searches. For J232327 and J085201 the distributions are completely consistent with Gaussian noise (the lighter, yellow bars). For J1713 an outlier is noticeable at 56.
The p-value associated with the J1713 most significant candidate is about . This is an estimate of the probability that noise alone would produce a value of the detection statistic like the one associated with that candidate in a single follow-up search. Since 546 such searches were performed, this translates into an overall p-value of about . This is a marginal candidate but we have more data (the second half of O2) that can be used to validate it or discard it. We report further analyses on this candidate in the next section.
The O2a data set comprises 86% of the amount of data of the O1 data set, hence the detection statistic values from O1 and O2a are remarkably consistent under the assumption of the O1 result being drawn from a distribution with a non-centrality parameter (SNR2) and the O2a result being drawn from a distribution with a non centrality parameter 86% .
2.3 The J1713 candidate
2.3.1 The follow-up search on the second part of O2
We perform a fully coherent search on the second “half” of O2 (O2b). The amount of data in this set is about 76% of the O1 data set and 89% of the O2a data. The expected in O2b based on O1 (O2a) is 52.8 (50.1) with a standard deviation of at least 14111This holds under the assumption that the non-centrality parameter estimate carries no uncertainty. This is not the case, so these numbers are a lower estimate of the standard deviation, which can actually be larger by up to a factor of 2 (Prix, 2017).. The expected value for the O2b search due to Gaussian noise (based on Monte Carlos) is less than with a standard deviation of . The measured value of has a Gaussian p-value of and is within a standard deviations of the expected value on the signal distribution.
We combine all the data and search the O1+O2 data set. It would be very demanding to carry out this search many times on Gaussian noise in order to provide an estimate of the p-value as done for the O2b search. We hence resort to a conservative estimate of the Gaussian-noise significance based on the number of searched templates. The search covers templates and if they were all independent the maximum expected value for in Gaussian noise would be with a standard deviation of . The value that we find is . Based on the O1 value, the expected O1+O2 is about , with a standard deviation of at least . The value that we find does not seem consistent with Gaussian noise but also falls short of the expectations based on the O1 signal-hypothesis by a few standard deviations.
A summary of the J1713 follow-up results is given in Table LABEL:tab:candParams.
| [Hz] | |||||
|---|---|---|---|---|---|
| [Hz/s] | |||||
| [Hz/s2] | |||||
| [s-1] |
2.3.2 X-ray data search
As the central compact objects associated with the targeted SNRs have only been detected in the X-ray energy band, we use archival X-ray observations of 1WGA J1713.4-3949 acquired with sufficient time resolution to cross-check for an electromagnetic counterpart to the gravitational wave candidate. Table LABEL:xraylog presents the ROSAT, Rossi-XTE, and XMM-Newton observations used in this work. These observations are processed, reduced, and analyzed following the standard procedures for each mission. The photon arrival times are corrected to the solar system barycenter using the Chandra coordinates of J1713 (Mignani et al., 2008).
| 500466 | ROSAT/HRI | Nominal | 1996-08-31 | 31 | 901 | 0.1-2.5 | 61 |
| 40145-01 | RXTE/PCA | GoodXenon | 1999-06-14 | 8.4 | 905 | 2-5 | 1 |
| 0722190101 | XMM/MOS | CC-mode | 2013-08-24 | 139 | 139 | 0.5-5 | 1500 |
For the ROSAT data, source photons are extracted from a circular aperture yielding 1343 counts for the 31 ks exposure in the 0.12.5 keV ROSAT bandpass. The XMM-Newton EPIC-MOS data are obtained in one-dimensional continuous clocking mode (CC-mode) with 1.5 ms timing resolution, corresponding to a Nyquist frequency of 333.3 Hz. Data are extracted from the central wide region of the CCD for a total of 59,781 source counts in the keV optimal range for the central compact object. The Rossi-XTE data is restricted to the top layer of the proportional counter (25 keV) whose lower limit just covers the harder end of the soft central compact object spectrum (0.55 keV), resulting in reduced sensitivity for the pulsar search using a total of 87,305 counts.
We search these data sets for a coherent pulsed signal over the full Nyquist range including the three basic electromagnetic rotation frequency ranges compatible with the gravitational wave frequency , namely at , , and the broad r-mode interval . We first look for a strong signal within the full range of possible frequencies, namely, Hz222With the exception of the XMM-Newton data set for which Hz., that allows for the large time span between the X-ray and LIGO data sets, and the extrapolated uncertainties in the spin-down measurement, conservatively estimated as Hz and Hz/s. We also conduct a more sensitive narrow range search around the candidate parameters () extrapolated to the X-ray data epoch, also allowing for the uncertainties quoted above.
We use the O1+O2 search parameters given in the last column of Table LABEL:tab:candParams. The rapid spin-down associated with this signal requires that we include the first derivative in the search. We evaluate the signal significance using an FFT algorithm, the test (Buccheri et al., 1983), where n=1,2,3 harmonics, and the H-test (de Jager et al., 1989), to check for power at higher harmonics. In these searches, we oversample the parameter space by a factor of 2.
Given the large time span of the data sets and the small number of photons, it is most practical to perform the timing search using GPU technology applied to discrete Fourier transform algorithms (, H-test) instead of FFTs. In the case of XMM-Newton, the upper range of the search is limited by the Nyquist frequency for this data set. For the Rossi-XTE data, because of the large span between closely grouped data segments, in order to evaluate the power as a function of frequency, we average fixed sized FFTs on 5 available data intervals corresponding to these groups.
None of the above searches of the X-ray data yields a significant () signal close to the expected X-ray frequencies and , or ones consistent with the r-mode range.
3 Upper limits
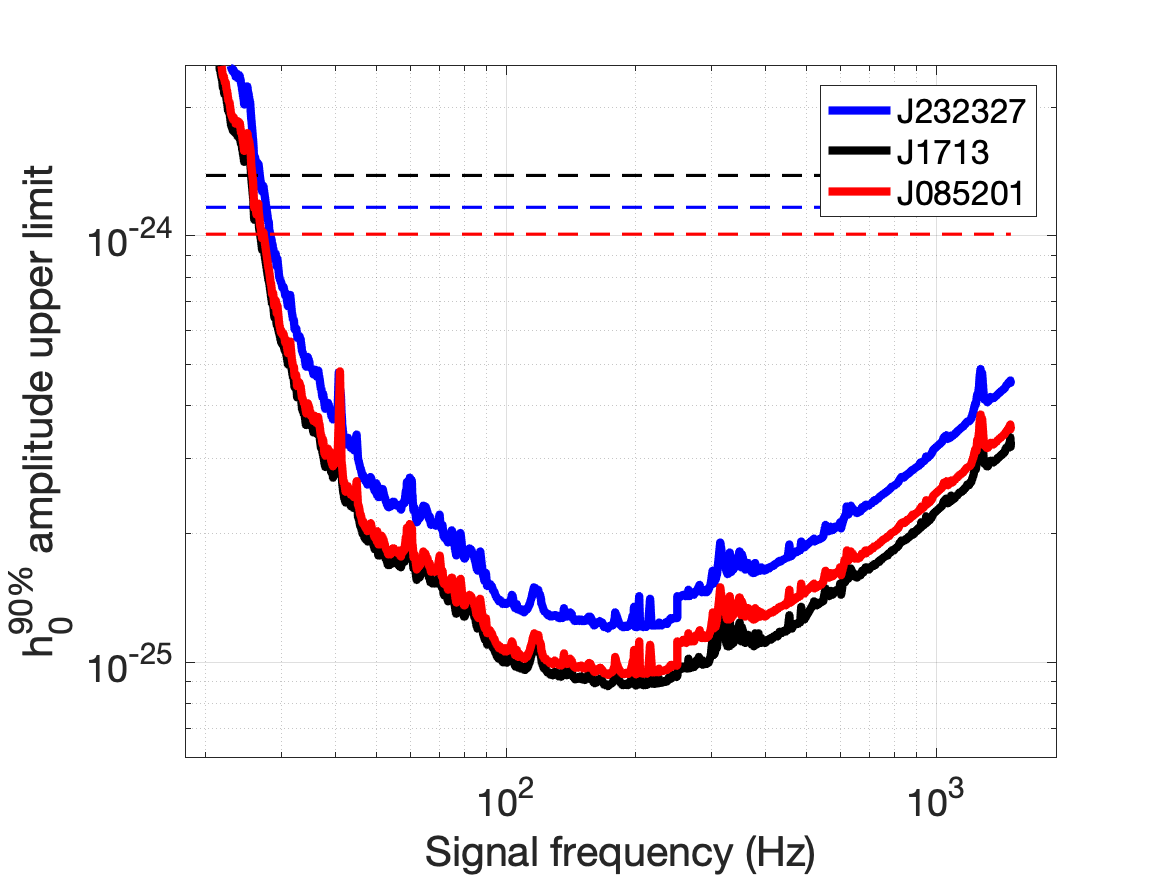
We set frequentist 90% confidence upper limits on the maximum gravitational wave amplitude consistent with our results as function of the signal frequency, . Specifically, is the expected gravitational-wave intrinsic amplitude such that 90% of a population of signals with parameter values in our search range would have been detected by our search. In the absence of a detection these represent the smallest amplitude signals that we can exclude. The are determined through search-and-recovery Monte Carlos aimed at measuring the detection efficiency on a set of simulated signals added to the real data. More details of the standard procedure are provided in Ming et al. (2019). The basic idea is that the confidence level – 90% in this case – is the detection efficiency measured through the Monte Carlos and the corresponds to the signal amplitude such that the detection confidence is 90%. The most constraining upper limits are all close to signal frequencies of 172.5 Hz and are for CasA, for J085201 and for J1713. Figures 4 show all the upper limit curves discussed in this section.
The sensitivity depth (Behnke et al., 2015; Dreissigacker et al., 2018) expresses the sensitivity of a search:
| (2) |
where is the noise level associated with a signal of frequency , it is the same as the one reported in Ming et al. (2019) and it is available in machine-readable format at AEI (2020). Table LABEL:tab:sensDepth shows the sensitivity depth values of the searches in the different frequency ranges. As expected, the sensitivity depth is larger for the targets searched with an initial longer coherent baseline, i.e. for the older targets (J1713 is the eldest and then comes J085201). Furthermore, as the number of spindown templates increases, due to the trials factor, the detection threshold is increased (see Table LABEL:tab:Thresholds) and the search becomes less sensitive. For this reason or the same target, the sensitivity depth is higher at lower frequencies.
| 20-250 Hz | 65.4 (60.3) | 84.2 (76.5) | 89.4 (82.9) |
|---|---|---|---|
| 250-520 Hz | 58.0 (54.5) | 74.3 (70.1) | 85.6 (79.1) |
| 520-1500 Hz | 57.8 (53.7) | 73.9 (70.0) | 81.4 (76.4) |
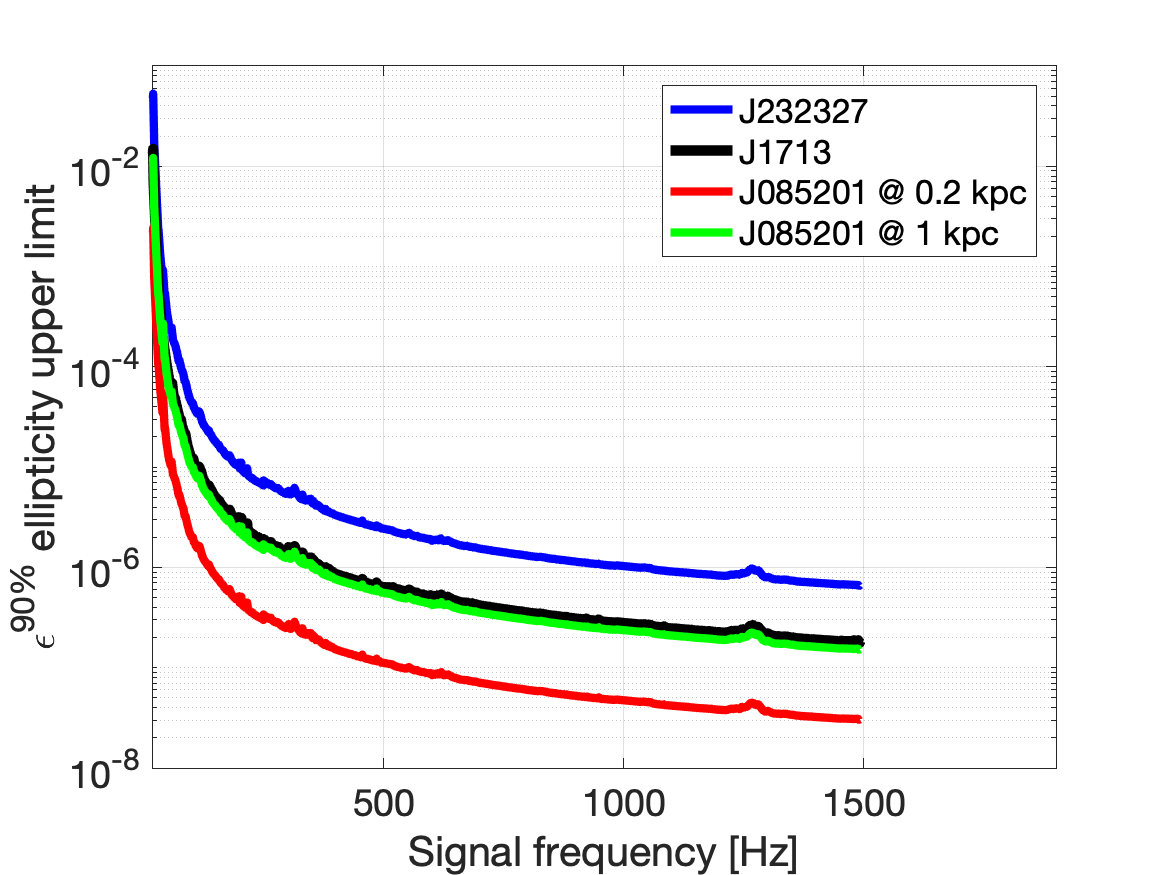
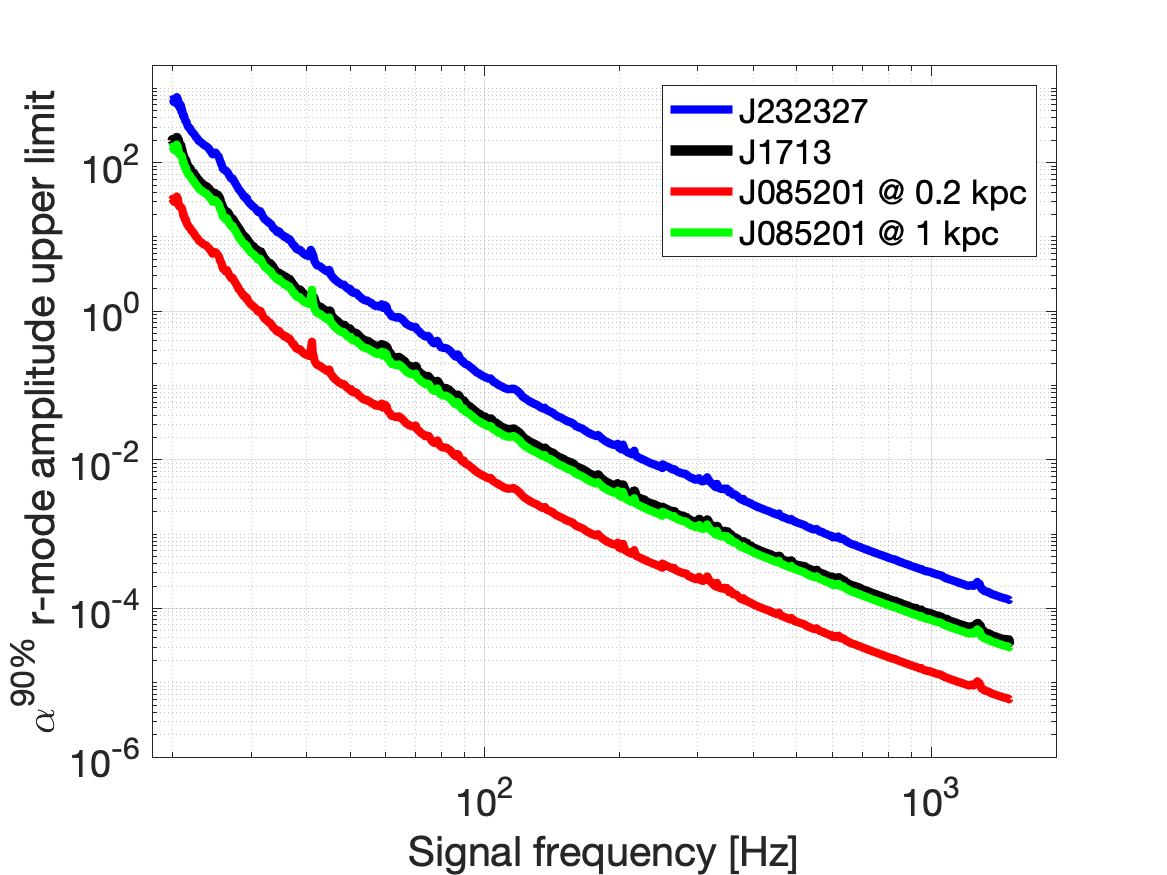
The upper limits on the amplitude can be readily translated in upper limits on the equatorial deformation of the star (assuming the moment of inertia in the direction of the spin axis kg m2) and r-mode amplitude (under the same assumptions as Owen (2010)), as follows:
| (3) | ||||
For the upper limits on and shown in Figure 4 we set the distances of the targets as follows: for J232327 we take kpc, following the estimate kpc of Reed et al. (1995); for J1713 we take kpc which is the center of the interval kpc of Cassam-Chenai et al. (2004); there is no consensus on the distance of J085201 so, from Allen et al. (2015) we consider two extremes: a distance of kpc and of kpc, corresponding to the nearest and farthest that the object could be.
4 Conclusions
We follow-up about 10,000 sub-threshold candidates from an Einstein@Home search on O1 LIGO data for signals from J085201, J232327, and J1713 - the central compact objects in the supernova remnants Vela Jr., Cassiopeia A and SNR G347.30.5, respectively. At the threshold values set in this search a confident detection could not be claimed based on O1 data alone, but our follow-up searches on the newly released LIGO O2 data would be able to confirm a candidate stemming from a real signal.
Only one candidate from the first O2 follow-up warrants further investigation. This is at a frequency of about 369 Hz and comes from the search that targets emission from J1713. The follow-up search results on the remainder of O2 data (O2b) fall short of the expected value and overall are not completely conclusive. If this candidate were of astrophysical origin it is unlikely that it would be a perfectly continuous and phase-coherent signal across all the observing periods that we have examined. We note that the search by Millhouse et al. (2020), which is robust against timing noise, does not produce any outlier consistent with ours, albeit the sensitivity of that search is not clear.
The timing solutions of Table LABEL:tab:candParams for the J1713 outlier imply a characteristic spin-down age of years, a spin-down energy loss rate of erg/s and a surface magnetic field of G. The characteristic age is consistent with that of a young NS associated with a undispersed supernova remnant (). The implied magnetic field is higher than of the detected central compact object pulsars but at the lower range for the rotation-powered pulsars. The large spin-down energy is in excess of the most energetic pulsars known (c.f. Crab pulsar, ergs/s) and nearly all pulsars with ergs/s display bright X-ray and/or radio pulsar wind nebulae (Gotthelf, 2004), with several notable exceptions. No wind nebula are associated with the known central compact object pulsars.
In the spirit of “leaving no stone unturned” we conduct an exhaustive timing search to identify an electromagnetic counterpart for this candidate. Since this source is only seen in X-ray emission, we analyze all available archival X-ray data on J1713 acquired with sufficient timing resolution. Although we do not find a significant signal at any of the expected frequencies, the sensitivity of the search is low, due to the many years gap between the LIGO and X-ray observations. This gap produces a very high number of search trials that results in a loss of sensitivity of our search.
New X-ray observations, contemporaneous with the LIGO runs, are planned, which should provide a more sensitive assessment333At the same X-ray signal strength the observation will be orders of magnitude more significant. of the J1713 candidate. A gravitational wave search in O3 data based on the parameters provided here should be easily able to shed light on the nature of this outlier. Noise investigations on the LIGO instruments could also reveal that the origin of outlier is a coherent contamination.
We set new upper limits on the intrinsic continuous gravitational wave amplitude from J232327, J085201, and J1713, improving on those already set in Ming et al. (2019). Our upper limits are below the age-based indirect upper limit (see for instance section 3 of Wette et al. (2008) for a definition) over most of the searched frequency range. Ellipticities at and above are excluded for all targets above 1000 Hz (rotation frequency 500 Hz) and for J1713 above 370 Hz (rotation frequency 185 Hz). In fact for J1713 our results exclude ellipticities larger than above 920 Hz. This range of ellipticity values is interesting: neutron star crusts should readily be able to sustain ellipticities of the order of (Johnson-McDaniel & Owen, 2013; Baiko & Chugunov, 2018). If r-modes are the gravitational-wave emission mechanism, our upper limits exclude amplitudes greater than for all targets above 580 Hz ( 435 Hz rotation frequency) and for J1713 above 360 Hz (rotation frequency 270 Hz). In fact for J1713 our results exclude r-mode amplitudes larger than above 440 Hz (rotation frequency 330 Hz). Estimates of the r-mode amplitude yield values of or higher for several neutron-star hydrodynamic evolution scenarios (Bondarescu et al., 2009; Owen, 2010). These are well within the reach of this search.
The focus of the work presented here is however not in the upper limits but in detection, i.e. investigating whether any of the outliers examined was due to a gravitational wave signal. Since the sensitivity of our search remains unmatched (Lindblom & Owen, 2020; Millhouse et al., 2020), investigating 10,000 new candidates further moves in uncharted territory.
This work also presents the first extensive follow-up of a continuous gravitational wave candidate in electromagnetic data and sets the stage for more investigations of this nature, including electromagnetic sub-threshold surveys followed by focused gravitational wave searches. It will be a combination of sensitive data and ingenuous search techniques, perhaps comprising multi-messenger observations, that will eventually secure the first detection of a continuous gravitational wave signal.
5 Acknowledgments
The authors gratefully acknowledge the support of the many thousands of Einstein@Home volunteers, without whom this search would not have been possible.
M.A. Papa and B. Allen gratefully acknowledge support from NSF PHY grant 1816904. E.V. Gotthelf acknowledges support from NASA grant 80NSSC18K0452 & SAO grant GO9-19046X.
The authors thank the LIGO Scientific Collaboration for access to the data and gratefully acknowledge the support of the United States National Science Foundation (NSF) for the construction and operation of the LIGO Laboratory and Advanced LIGO as well as the Science and Technology Facilities Council (STFC) of the United Kingdom, and the Max-Planck-Society (MPS) for support of the construction of Advanced LIGO. Additional support for Advanced LIGO was provided by the Australian Research Council. This research has made use of data, software and/or web tools obtained from the LIGO Open Science Center (https://losc.ligo.org), a service of LIGO Laboratory, the LIGO Scientific Collaboration and the Virgo Collaboration, to which the authors have also contributed. LIGO is funded by the U.S. National Science Foundation. Virgo is funded by the French Centre National de Recherche Scientifique (CNRS), the Italian Istituto Nazionale della Fisica Nucleare (INFN) and the Dutch Nikhef, with contributions by Polish and Hungarian institutes. The follow-up studies for the J1713 outlier have also employed the PyFstat software suite (Ashton et al., 2020) and the Falcon search code (Dergachev & Papa, 2019).
References
- A. Singh & Walsh (2017) A. Singh, M. A. Papa, H. B. E., & Walsh, S. 2017, Phys. Rev. D, 96, 082003, doi: 10.1103/PhysRevD.96.082003
- Aasi et al. (2015a) Aasi, J., et al. 2015a, Astrophys. J., 813, 39, doi: 10.1088/0004-637X/813/1/39
- Aasi et al. (2015b) —. 2015b, Class. Quant. Grav., 32, 074001, doi: 10.1088/0264-9381/32/7/074001
- Abbott et al. (2020) Abbott, B., et al. 2020, Astrophys. J. Lett., 892, L3, doi: 10.3847/2041-8213/ab75f5
- Abbott et al. (2016) Abbott, B. P., et al. 2016, Phys. Rev. Lett., 116, 131103, doi: 10.1103/PhysRevLett.116.131103
- Abbott et al. (2017) —. 2017, Phys. Rev., D96, 122004, doi: 10.1103/PhysRevD.96.122004
- Abbott et al. (2019a) —. 2019a, Phys. Rev., X9, 031040, doi: 10.1103/PhysRevX.9.031040
- Abbott et al. (2019b) —. 2019b, Astrophys. J., 875, 122, doi: 10.3847/1538-4357/ab113b
- Abbott et al. (2019c) —. 2019c, Phys. Rev., D100, 024004, doi: 10.1103/PhysRevD.100.024004
- AEI (2020) AEI. 2020, Supplementary material for the publication, https://www.aei.mpg.de/continuouswaves/O1GY-DirectedSearches
- Allen et al. (2015) Allen, G., Chow, K., DeLaney, T., et al. 2015, Astrophys. J., 798, 82, doi: 10.1088/0004-637X/798/2/82
- Arvanitaki et al. (2015) Arvanitaki, A., Baryakhtar, M., & Huang, X. 2015, Physical Review D, 91, 084011
- Ashton et al. (2020) Ashton, G., Keitel, D., & Prix, R. 2020, PyFstat-v1.3, 1.3, Zenodo, doi: 10.5281/zenodo.3620861. https://doi.org/10.5281/zenodo.3620861
- Baiko & Chugunov (2018) Baiko, D., & Chugunov, A. 2018, Mon. Not. Roy. Astron. Soc., 480, 5511, doi: 10.1093/mnras/sty2259
- Behnke et al. (2015) Behnke, B., Papa, M. A., & Prix, R. 2015, Phys. Rev., D91, 064007, doi: 10.1103/PhysRevD.91.064007
- Bondarescu et al. (2009) Bondarescu, R., Teukolsky, S. A., & Wasserman, I. 2009, Phys. Rev. D, 79, 104003, doi: 10.1103/PhysRevD.79.104003
- Buccheri et al. (1983) Buccheri, R., et al. 1983, Astron. Astrophys., 128, 245
- Cassam-Chenai et al. (2004) Cassam-Chenai, G., Decourchelle, A., Ballet, J., et al. 2004, Astron. Astrophys., 427, 199, doi: 10.1051/0004-6361:20041154
- Cutler & Schutz (2005) Cutler, C., & Schutz, B. F. 2005, Phys. Rev., D72, 063006, doi: 10.1103/PhysRevD.72.063006
- de Jager et al. (1989) de Jager, O. C., Raubenheimer, B. C., & Swanepoel, J. W. H. 1989, å, 221
- Dergachev & Papa (2019) Dergachev, V., & Papa, M. A. 2019, Phys. Rev. Lett., 123, 101101, doi: 10.1103/PhysRevLett.123.101101
- Dergachev & Papa (2020) —. 2020, Phys. Rev. D, 101, 022001
- Dreissigacker et al. (2018) Dreissigacker, C., Prix, R., & Wette, K. 2018, Phys. Rev., D98, 084058, doi: 10.1103/PhysRevD.98.084058
- Einstein@Home (2019) Einstein@Home. 2019, The volunteer computing project Einstein@Home, https://einsteinathome.org/
- Fesen et al. (2006) Fesen, R. A., Hammell, M. C., Morse, J., et al. 2006, The Astrophysical Journal, 645, 283, doi: 10.1086/504254
- Gotthelf (2004) Gotthelf, E. V. 2004, in IAU Symposium, Vol. 218, Young Neutron Stars and Their Environments, ed. F. Camilo & B. M. Gaensler, 225
- Gotthelf et al. (2013) Gotthelf, E. V., Halpern, J. P., & Alford, J. 2013, ApJ, 765
- Horowitz et al. (2020) Horowitz, C. J., Papa, M. A., & Reddy, S. 2020, Phys. Lett., B800, 135072, doi: 10.1016/j.physletb.2019.135072
- Horowitz & Reddy (2019) Horowitz, C. J., & Reddy, S. 2019, Phys. Rev. Lett., 122, 071102, doi: 10.1103/PhysRevLett.122.071102
- Iyudin (1999) Iyudin, A. 1999, Nucl. Phys. A, 654, 900c, doi: 10.1016/S0375-9474(00)88568-1
- Jaranowski et al. (1998) Jaranowski, P., Krolak, A., & Schutz, B. F. 1998, Phys. Rev., D58, 063001, doi: 10.1103/PhysRevD.58.063001
- Johnson-McDaniel & Owen (2013) Johnson-McDaniel, N., & Owen, B. 2013, Phys. Rev. D, 88, 044004
- Keitel (2016) Keitel, D. 2016, Phys. Rev., D93, 084024, doi: 10.1103/PhysRevD.93.084024
- Keitel et al. (2014) Keitel, D., Prix, R., Papa, M. A., Leaci, P., & Siddiqi, M. 2014, Phys. Rev., D89, 064023, doi: 10.1103/PhysRevD.89.064023
- LIGO (2018) LIGO. 2018, The O1 Data Release, https://www.gw-openscience.org/O1/, doi: https://doi.org/10.7935/K57P8W9D
- LIGO (2019) —. 2019, The O2 Data Release, https://www.gw-openscience.org/O2/, doi: 10.7935/CA75-FM95
- Lindblom & Owen (2020) Lindblom, L., & Owen, B. J. 2020, Phys. Rev. D, 101, 083023, doi: 10.1103/PhysRevD.101.083023
- Mignani et al. (2008) Mignani, R., Zaggia, S., De Luca, A., et al. 2008, Astron. Astrophys., 484, 457, doi: 10.1051/0004-6361:20079076
- Millhouse et al. (2020) Millhouse, M., Strang, L., & Melatos, A. 2020. https://arxiv.org/abs/2003.08588
- Ming et al. (2016) Ming, J., Krishnan, B., Papa, M. A., Aulbert, C., & Fehrmann, H. 2016, Phys. Rev., D93, 064011, doi: 10.1103/PhysRevD.93.064011
- Ming et al. (2018) Ming, J., Papa, M. A., Krishnan, B., et al. 2018, Phys. Rev., D97, 024051, doi: 10.1103/PhysRevD.97.024051
- Ming et al. (2019) Ming, J., Papa, M. A., Singh, A., et al. 2019, Phys. Rev., D100, 024063, doi: 10.1103/PhysRevD.100.024063
- Nitz et al. (2019) Nitz, A. H., Dent, T., Davies, G. S., et al. 2019, Astrophys. J., 891, 123, doi: 10.3847/1538-4357/ab733f
- Owen (2010) Owen, B. J. 2010, Phys. Rev., D82, 104002, doi: 10.1103/PhysRevD.82.104002
- Owen et al. (1998) Owen, B. J., Lindblom, L., Cutler, C., et al. 1998, Phys. Rev., D58, 084020, doi: 10.1103/PhysRevD.58.084020
- Palomba et al. (2019) Palomba, C., et al. 2019, Phys. Rev. Lett., 123, 171101, doi: 10.1103/PhysRevLett.123.171101
- Papa et al. (2016) Papa, M. A., et al. 2016, Phys. Rev., D94, 122006, doi: 10.1103/PhysRevD.94.122006
- Pavlov et al. (2001) Pavlov, G. G., Sanwal, D., Kızıltan, B., & Garmire, G. P. 2001, The Astrophysical Journal, 559, L131, doi: 10.1086/323975
- Pferffermann & Aschenbach (1996) Pferffermann, E., & Aschenbach, B. 1996, in Proceeding of the International Conference on X-ray Astronomy and Astrophysics: Roentgenstrahlung from the Univers, 267–268
- Pletsch (2008) Pletsch, H. J. 2008, Phys. Rev. D, 78, 102005. https://arxiv.org/abs/0807.1324
- Pletsch (2010) —. 2010, Phys. Rev. D, 82, 042002. https://arxiv.org/abs/1005.0395
- Pletsch & Allen (2009) Pletsch, H. J., & Allen, B. 2009, Phys. Rev. Lett., 103, 181102
- Prix (2017) Prix, R. 2017, Coherent F-statistic on semi-coherent candidate F. https://dcc.ligo.org/LIGO-T1700236/public
- Reed et al. (1995) Reed, J. E., Hester, J., Fabian, A., & Winkler, P. 1995, Astrophys. J., 440, 706, doi: 10.1086/175308
- S. J. Zhu & Walsh (2017) S. J. Zhu, M. A. P., & Walsh, S. 2017, Phys. Rev. D, 96, 124007, doi: 10.1103/PhysRevD.96.124007
- Singh (2017) Singh, A. 2017, Phys. Rev., D95, 024022, doi: 10.1103/PhysRevD.95.024022
- Slane et al. (2001) Slane, P., Hughes, J. P., Edgar, R. J., et al. 2001, Astrophys. J., 548, 814, doi: 10.1086/319033
- Tananbaum (1999) Tananbaum, H. 1999, Cassiopeia A, http://www.cbat.eps.harvard.edu/iauc/07200/07246.html
- V. Dergachev & Eggenstein (2019) V. Dergachev, M. A. Papa, B. S., & Eggenstein, H. B. 2019, Phys. Rev. D, D99, 084048
- Vallisneri et al. (2015) Vallisneri, M., Kanner, J., Williams, R., Weinstein, A., & Stephens, B. 2015, J. Phys. Conf. Ser., 610, 012021, doi: 10.1088/1742-6596/610/1/012021
- Venumadhav et al. (2020) Venumadhav, T., Zackay, B., Roulet, J., Dai, L., & Zaldarriaga, M. 2020, Phys. Rev. D, 101, 083030, doi: 10.1103/PhysRevD.101.083030
- Wang et al. (1997) Wang, Z. R., Qu, Q. Y., & Chen, Y. 1997, A&A, 318, L59
- Wette et al. (2008) Wette, K., et al. 2008, Class. Quant. Grav., 25, 235011, doi: 10.1088/0264-9381/25/23/235011
- Zhu et al. (2020) Zhu, S. J., Baryakhtar, M., Papa, M. A., et al. 2020. https://arxiv.org/abs/2003.03359
- Zhu et al. (2016) Zhu, S. J., et al. 2016, Phys. Rev., D94, 082008, doi: 10.1103/PhysRevD.94.082008