Molecular dynamics approach for predicting release temperatures of noble gases in pre-solar nanodiamonds
Abstract
Pre-solar meteoritic nanodiamond grains carry an array of isotopically distinct noble gas components and provide information on the history of nucleosynthesis, galactic mixing and the formation of the Solar system. In this paper, we develop a molecular dynamics approach to predict thermal release pattern of implanted noble gases (He and Xe) in nanodiamonds. We provide atomistic details of the unimodal temperature release distribution for He and a bimodal behavior for Xe. Intriguingly, our model shows that the thermal release process of noble gases is highly sensitive to the impact and annealing parameters as well as to position of the implanted ion in crystal lattice and morphology of the nanograin. In addition, the model elegantly explains the unimodal and bimodal patterns of noble gas release via the interstitial and substutional types of defects formed. In summary, our simulations confirm that low-energy ion-implantation is a viable way for the incorporation of noble gases into nanodiamonds and we provide explanation of experimentally observed peculiarities of gas release.
I Introduction
Concentration of noble gases (NG) in primitive chondrites may greatly exceed terrestrial abundancies. Several NG components, different in chemical and isotopic composition, can be distinguished using step combustion experiments (see [1] for review). A significant fraction of the anomalous components, i.e., those with isotopic composition markedly different from the solar, reside in nanodiamond (ND) grains, which are relatively abundant in some primitive chondrites with content as high as 1500 ppm.
Step combustion and pyrolysis experiments allowed to distinguish three NG components present in NDs – P3, HL and P6. Each of these components contain all five NGs (He, Ne, Ar, Kr, Xe); understanding of Xe is, arguably, less ambiguous than the other elements. The P3 and, possibly, the P6 components, are not dramatically different from the solar elemental and isotopic patterns, but still their composition cannot be derived from the solar by fractionation.
The P6 component is volumetrically the least important and is yet insufficiently characterized. At least a fraction of the P3 and P6-related 129Xe is derived from the decay of 129I, implying the initial presence of currently extinct iodine in NDs (e.g., Gilmour, et al. [2]). The HL component is characterized by marked excess in the relative abundance of heavy (H) and light (L) isotopes. The heavy isotopes – 134Xe and 136Xe – are produced by -process only, or, at least, overwhelmingly. The light isotopes – 124Xe and 126Xe – are formed via the -process. Historically, the only feasible explanation for the origin of the HL component was a mixture of NGs produced in - and -processes in supernovae explosions of type I [3] or II [4]. However, none of the current models of the -process fit the experimentally observed isotopic pattern and models with variable degree of robustness were proposed [5, 1]. In any case, isotopic patterns suggest that NDs carrying the HL, and, likely also the P3 and P6 components, should be of presolar origin. This view is also supported by the association of isotopically anomalous Pt, Ba, Te and some other elements with ND-rich fractions. Importantly, all attempts to separate individual carriers of the L and H components failed, thus indicating thorough mixing of several independent populations of NDs in presolar nebula or elsewhere. Since only approximately out of ND grains contains a Xe ion, and all isotopic analyses require billions of grains, the mixing is not that surprising. Existence of several populations of NDs, possibly of different origin and/or stellar sources, is also suggested by C and N isotopic composition [6].
Step pyrolysis/oxidation experiments revealed complex patterns of NG release from NDs. For heavy NGs – Ar, Kr, Xe, the gas release pattern is bimodal. Although some variations between meteorites with different thermal histories occur, in general the P3 component is released mostly at low temperatures (200–900) with a peak at 450–550∘C; the HL component peaks between 1300–1450∘C (overall range 1100–1600) and the P6 component evolve at yet higher temperatures. For Ne the bimodality is much less pronounced and for He it is probably absent, although its composition changes with the release temperature.
The mechanism of incorporation of NGs into ND grains is a subject of ongoing debate. In principle, three mechanisms may be responsible for the introduction of an impurity atom into an ND grain: (1) growth process; (2) diffusion and/or adsorption; (3) ion implantation. The largest atom ever introduced into the diamond lattice purely by growth processes relevant for the formation process of NDs in space – plasma-assisted Chemical Vapour Deposition – is tin [7]. However, in contrast to NGs, Sn, Ge, and other heavy elements belong to group IV of the periodic table as well as C. Subsequently, the introduction of these elements is crystallochemically feasible even despite large differences in atomic radii with C. Diffusion in diamond is extremely sluggish [8], which effectively rules out any diffusion-related processes at low temperatures, relevant for meteoritic NDs. The surface adsorption of some elements is possible, and several works suggest that the P3 component might be trapped in near-surface, perhaps partly graphitised layers of the grains (e.g., Fisenko, et al. [9]). However, ion implantation, where NGs are driven into pre-existing NDs [10, 11, 12, 2], seems to be the only feasible option [13].
The implantation hypothesis was strongly supported by experimental work by Koscheev, et al. [14] who implanted a low energy (700 eV) NG ions into synthetic NDs with diameters 4–5 nm. Pyrolysis measurements observed a single broad temperature distribution for He and Ne, and a bimodal distribution for Ar, Kr and Xe, corresponding closely to those found for meteoritic NDs [13, 15]. Similar studies by Verchovsky, et al. [16] also found a bimodal distribution, albeit in the latter case the high dose implantation most likely amorphised the ND grains, greatly complicating interpretation. However, physical mechanism of the bimodal gas release pattern remains unexplained and raised important questions whether the observed multimodality is real or results from experimental artifacts. For example, a single layer of ND grains was used as a target in Koscheev, et al. [14]. However, formation of a uniform truly single layer is notoriously difficult and it is impossible to exclude a possibility that an ion penetrates the ND particle in a top layer and is implanted with smaller energy into underlying grain. In addition, presence of doubly charges ions during the implantation experiment is not fully excluded.
In this work, we use the molecular dynamics (MD) approach and apply it to the question of the single and bimodal temperature-release of NGs. To the best of our knowledge, atomistic simulation methods have not previously been applied to this problem. We simulate the implantation and pyrolysis processes for He and Xe, and find excellent agreement with experimental data collected from NDs. We reproduce the single release peak for He and bimodal release for Xe. The simulations explain how the mass, implantation depth and crystallographic location of the NGs gives rise to the experimental observations, and for the first time provide an atomistic explanation of the release mechanism. Although we do not provide an explanation for the origin of isotopic anomalies in NDs, our results are useful in the estimation of the composition of end-members of P3 and HL components and in studies of isotopic fractionation of released NGs.
Our paper is structured as follows. In the methodology we introduce our MD approach, which includes an Arrhenius framework to map the simulation temperatures onto their experimental equivalent. Our first results are qualitative, using visualization and movie of the implantation and thermal release processes to highlight the differences between He and Xe. The second set of results involves robust statistical analysis of a large number of simulations spanning many implantation energies, implantation directions and annealing temperatures. The final section uses the Arrhenius approach to make direct comparison between meteoritic data and the simulations.
II Methodology
II.1 Simulation methods
The MD simulations are performed using the Environment Dependent Interaction Potential (EDIP) [17] for C–C interactions in combination with the standard Ziegler-Biersack-Littmark (ZBL) potential [18] to describe close approaches (see [19] for further details). EDIP has proved itself to be highly transferable [20, 21] and has previously been successful in simulations of many different forms of C such as diamond [22, 23, 24, 25], carbon onions [26], amorphous carbon [27, 28], nanotubes [29], peapods [30] and carbide-derived carbons [31, 32]. One aspect of EDIP which is still being developed is the ability to describe hydrogen; accordingly, none of the simulations presented here include hydrogen. To describe He–C and Xe–C interactions, we use a Lennard-Jones (LJ) potential coupled with the ZBL potential, with interpolation between the two interactions controlled using Fermi-type switching functions as described in [24] and [33]. This combination of the LJ and ZBL potentials is identical to our recent article [34] where we studied the modification of NDs by Xe implantation. Full details are provided in the Supplementary Information.
We perform our simulations using an in-house MD package. Implantation simulations are carried out in an NVE ensemble (meaning number of particles (N), volume (V) and energy (E) are conserved quantities), using Verlet integration and a variable timestep [35]. Annealing simulations are performed in an NVT ensemble using a velocity-rescaling thermostat. Periodic boundary conditions are not employed. All simulations use a 4999-atom ND with a diameter of 3.9 nm; this size is similar to synthetic and meteoritic NDs [13, 15, 14] (meteoritic NDs are characterized by a log-normal size distribution with a median of 2.6 nm and maximal sizes up to 10 nm or more [11]).
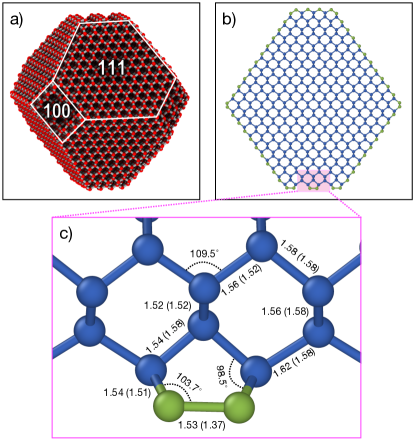
As shown in Figure 1, the ND has a truncated octahedral form which is the stable geometry for dehydrogenated NDs [37]. The {100} faces of the ND are reconstructed in a 21 manner to eliminate dangling bonds. The local environment, bond length and bond angles in this reconstructed geometry are shown in Figure 1(c) and compared with density-functional-theory (DFT) data from de La Pierre, et al. [36]. Most of the bond lengths are very similar (within 0.04 Å), the only exception being the – bond which is 0.16 Å larger with EDIP. The {111} faces are not reconstructed, as this is the stable configuration with EDIP. We note that EDIP does not predict the 21 -bonded chain reconstruction [38] of the {111} face; EDIP favours the 11 geometry by 3.6 J/m2, whereas DFT calculations [36] favour the 21 geometry by 0.93 J/m2. We do not expect the 11 geometry preferred by EDIP impacts on our results because both reconstructions graphitize in a smilar manner and produce the same final structure and orientation relative to the rest of the ND.
The coordinates of the ND were generated using a methodology described in our recent article studying Xe implantation [34]. The key idea is to cut the ND out of an infinite crystal using clipping planes in the 100 and 111 directions. Using the notation of Fogg, et al. [34], the ND used in this work was generated with =20 Å and =17 Å. Prior to implantation, the ND is equilibrated at 300 K.
Implantation simulations are 1 ps in length, sufficient to model the ballistic phase of ion implantation into the ND. To generate a wide variety of implantation conditions, the initial position and direction of the implanted species (either He or Xe) was systematically varied. Following our previous studies [24, 33, 39, 34], the initial position is taken from a 25-point solution to the Thomson problem [40] which distributes coordinates uniformly on a sphere (the Cartesian coordinates are provided in [19]). Some implantations are performed directly towards the centre of the ND, while others are directed slightly (up to 10 Å) away from the centre-of-mass. After the system equilibrates, the implantation depth is computed relative to the nearest crystallographic face, {100} or {111}. For the He implantations the mass was 4 amu, while the Xe implantations use a mass of 133 amu, the same as in [39, 34] and slightly higher than the average isotopic value of 131.3 amu. Additional Xe simulations use masses of 124 and 136 amu, corresponding to the lightest and heaviest stable isotopes.
Annealing simulations extending up to 1 ns are performed to study the thermal release process. Coordination analysis is performed by counting the number of nearest neighbours within a cutoff of 1.85 Å. For the purposes of analysis and visualization, C atoms are considered to be , and hybridized if they have two, three and four neighbours, respectively. Visualization is performed using the OVITO package [41].
II.2 Mapping to experimental temperatures
Generally speaking, the timescale of MD simulations are on the order of nanoseconds, around 13 orders shorter than the experimental annealing time. This enormous difference complicates comparison between simulations and experiments, as thermally activated events will be suppressed in the simulations due to vastly shorter time. Many different solutions to the MD timescale problem have been proposed [42, 43, 44], but here we employ a simple temperature-acceleration approach that we have used successfully on other C systems [31]. The first step is to assume Arrhenius behavior and a single activation energy, which corresponds to the relation
| (1) |
where is the frequency of events, is the attempt frequency, is the temperature, is Boltzmann’s constant and is the activation energy. The correspondence between the experimental and simulation temperature is determined by equating the time-frequency product (i.e., ) to ensure that for the same activation energy the same number of events occur in both simulation and experiment. This yields the following expression
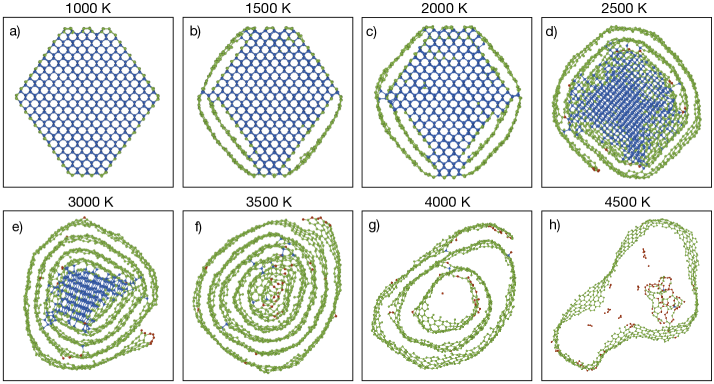
| (2) |
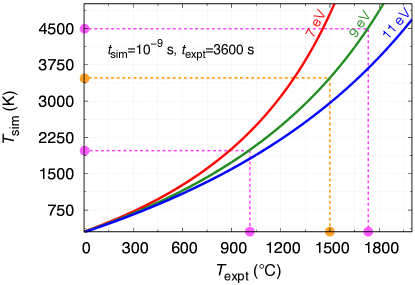
This equation links the experimental temperature and time ( and ) with those of the simulation ( and ) with the only parameter being the activation energy. To determine , we make use of experimental data on graphitization of NDs, where it is known that 1500∘C is required to convert NDs into a carbon onion [45, 46, 47, 48, 49]. To identify the correponding temperature on the MD timescale we performed a set of 1 ns simulations at different annealing temperatures and found that onionization of the ND occurs at around 3500 K (see Figure 2). Using these two temperatures and suitable times (= s and =3600 s [46, 45, 47, 48, 49]), we obtain via Equation 2 a value of =9 eV. Having determined the activation energy, we can employ Equation 2 to map any simulation temperature to its experimental equivalent using the relation shown in Figure 3. For example, the pink lines in the figure show that a simulation temperature of 4500 K is equivalent to an experimental temperature of 1730∘C, and a simulation at 2000 K is equivalent to an experiment at 1000∘C. The latter also serves as a convenient dividing line between main peaks of Xe-P3 and Xe-HL components [13, 15]. To provide a sense of scale, Figure 3 also shows calibration curves for two other activation energies. Note that due to the logarithm term in Equation 2 the value of has minimal sensitivity to the choice of . This point is discussed in detail in de Tomas, et al. [31]. Finally, we note that throughout this manuscript we adopt the convention that experimental temperatures are given in Celsius and simulation temperatures are in Kelvin. This helps conceptually separate the two quantities which otherwise might be confused with one another.
III Results and Discussion
III.1 Individual implantation and thermal release events
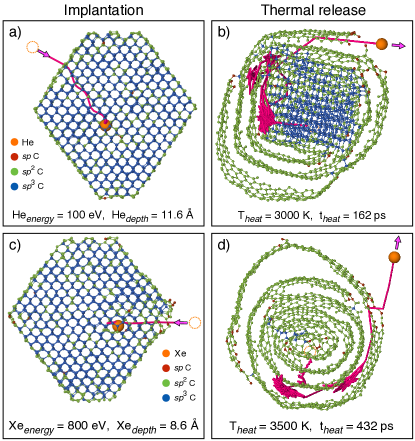
Representative examples of the implantation and thermal release processes for He and Xe are shown in Figure 4. Panels (a) and (c) show that the implantation processes for He and Xe differ substantially, with the higher mass and size of the Xe having a large effect. For He, only a relatively modest energy (100 eV) is needed to implant the atom into the centre of the ND, and the He undergoes multiple deviations along the implantation trajectory (pink line) since the C atoms are three times heavier. In contrast, the implanting Xe simply slows down, and these are the C atoms which move. Around 800 eV of kinetic energy is needed to implant into the central region, similar to the value of circa 700 eV used by Koscheev, et al. [14] in their experiments.
Once the implanted ND system has equilibrated, the entire cluster is heated to find the temperature at which the NG atom escapes. Examples of this process are shown in panels (b) and (d). For both species, thermal release occurs at relatively high simulation temperatures; 3000 K for He and 3500 K for Xe. As seen in Figure 2, these temperatures are sufficient to transform portions of the ND into a onion-like structure. Due to its small size, the He is able to escape before the ND has completely onionized. The complexity of the process can be appreciated in the first part of the Supplementary Movie which shows how the He travels along multiple 110 channels, and traverses a substantial fraction of the ND before escaping. In the case of Xe, the ND is fully transformed into a carbon onion and the release process is more difficult as the Xe must pass through the graphitic shells. The pink trajectory in panel (d) shows that the release process involves two local minima in which the Xe jiggles back-and-forth many times before escaping. An animation sequence of this process is provided in the second part of the Supplementary Movie.
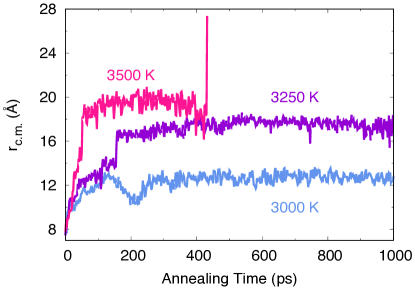
To determine the temperature at which He and Xe are released we perform 1 ns annealing simulations at many different temperatures and monitor the distance between the NG species and the center of the mass of the system. An example of our methodology is provided in Figure 5 which shows this quantity () for Xe as a function of time for three different annealing temperatures, using the implanted ND in Figure 4(c) as the starting structure. At 3000 K (blue line) the Xe remains the same distance from the center of mass. This occurs because the Xe becomes trapped at the interface between the ND core and onionized outer layers (see Figure 2(e)). At 3250 K (violet line) the Xe moves towards the surface of the ND during the first 170 ps of annealing, but afterwards it is trapped between the graphitic sheets. Note that at around 30 and 160 ps, there are two significant surges in where the Xe atom passes through the graphitic sheets. At 3500 K (pink line), the Xe is initially trapped between the sheets, but after moving between them, finally exits through a gap in the outer shell at 432 ps, producing a sharp jump in .
III.2 Statistical analysis
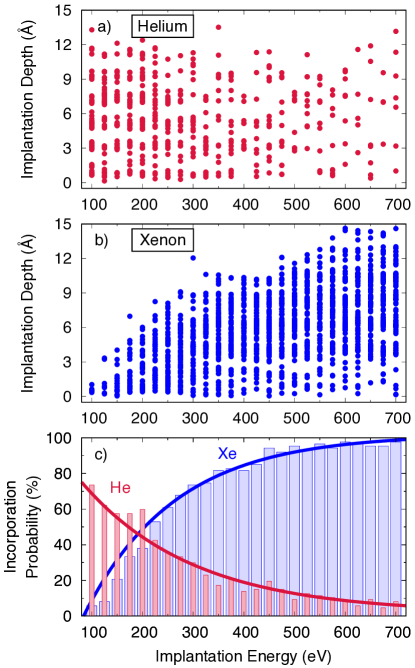
To collect a statistically significant data set a large number of implantation and thermal release simulations need to be performed. The first step is to perform simulations that implant He and Xe into a wide variety of configurations within the ND. For each species a total of 1875 implantations were performed; 25 different energies, each with 75 different initial conditions (i.e., directions and/or impact parameters). A summary of the resultant implantation depth and incorporation probability is shown in Figure 6. Panels (a) and (b) show the implantation depth of He and Xe as a function of implantation energy, where each dot indicates an implantation event whereby the NG species remains with the ND. Impacts where the He or Xe leave the ND are not shown. The fewest dots occur for high He implantation energies (where He passes through the ND) and low Xe implantation energies (where Xe is reflected). The distribution of depths differs considerably between the two species. For He, the implantation depth spans the maximum possible range, extending from the surface to the centre of the ND, and the implantation depth is uncorrelated with energy. In contrast, low energies result in only shallow implantation of Xe, while nearly 600 eV is required to span the full range of depths. High Xe implantation energies still produce a large number of shallow implantation depths, which is perhaps due to the small size of the ND.
Figure 6(c) quantifies the incorporation probability of He and Xe as a function of implantation energy. The probabilities for the two species are strikingly different, and are driven by the mass difference relative to C. This data shows that low energies are optimal for He implantation, while efficient Xe implantation requires many hundreds of eV. Noting that He is the most abundant NG in meteoritic NDs [50], this data imposes constraints on the astrophysical conditions for He incorporation via implantation.
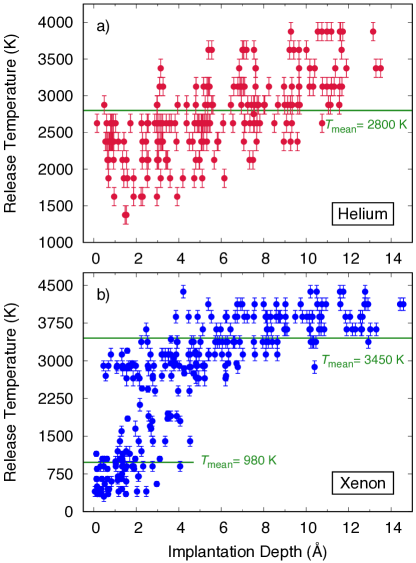
The second step in performing the statistical analysis uses the coordinates associated with each dot in Figure 6 as the starting structure of thousands of thermal release simulations. All simulations run for 1 ns, except for when indicate that release has occurred; in such cases the simulation is terminated. If thermal release does not occur, the simulation is rerun at a higher temperature. Typically, the temperature increment between successive simulations is 100–250 K. The raw simulation data showing the relationship between the release temperature of the NG and the implantation depth is shown in Figure 7. The dots and error bars indicate the precision, meaning that if a NG atom releases at a temperature but not at a lower temperature , then the dot denotes and the error bar indicates the range . Panel (b) shows that the Xe release temperatures cluster into two groups and correlate with the depth of the implanted atom. The average temperature for these two clusters are indicated by the green lines, with a dividing line of 2000 K used to separate the groups. Varying this number by several hundred Kelvin makes little difference to the averages. For He, no clustering occurs, and the release temperature gradually increases with implantation depth. In this case the green line indicates the average temperature for the full data set.
III.3 Comparison with experiment
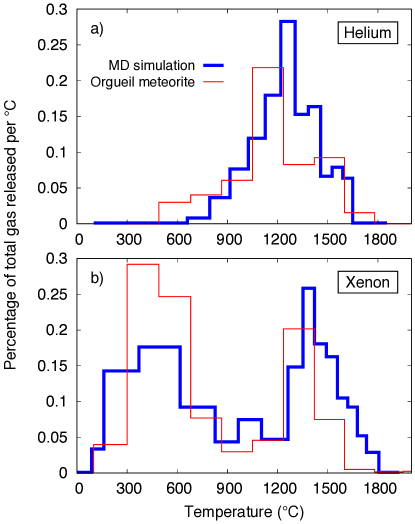
Figure 7(a) shows that a minimum of 1300 K is required to release He and by 4000 K all He is released. In contrast, the Xe data in panel (b) spans a broader range, with a minimum release temperature of only 400 K and a maximum of nearly 4500 K, at which point the ND is effectively destroyed (see Figure. 2(h)). The observation of two temperature clusters for Xe and a single broad distribution for He is in good qualitative agreement with the meteoritic ND observations. To map the simulation temperatures onto their experimental equivalents, we employ the Arrhenius approach explained in the Methodology, using an activation energy of =9 eV. By histogram binning the simulation data in Figure 7 and applying the transformation in Equation 2 we obtain a data set shown as thick blue lines in Figure 8. On the same scale we show experimental data for the Orgueil meteoritic NDs extracted from Huss and Lewis [13, 15]. The agreement is remarkable, with the simulations reproducing all of the main meteoritic ND characteristics, including (i) the unimodal vs bimodal character, (ii) the position of the peaks, (iii) the widths of the distributions, and (iv) the maximum and minimum release temperatures. This is the first time that MD simulation has predicted these important effects.
The high level of experimental detail reproduced by the simulations provides post-hoc justification for the Arrhenius approach, confirming that the presumption of a dominant activation energy is reasonable for this class of problem. All of the predicted temperatures are correctly positioned relative to their experimental equivalents; this includes the onset of He and Xe release, the position of the release peaks, and even the upper limit at 1800∘C, which corresponds to destruction of the ND and the release of any remaining gases. Regarding Figure 8(b), it is important to note that the simulations cannot predict the relative height of the peaks in the bimodal distribution, since this is function of the balance between shallow and deeply implanted Xe which is not known.
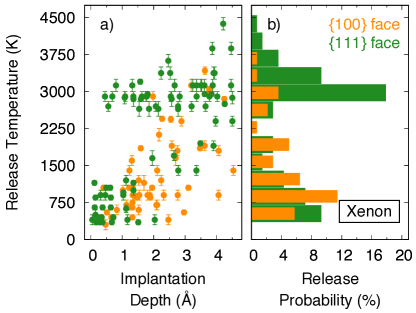
Having reproduced the essential characteristics of NG release, we can address some of the most fundamental questions related to meteoritic NDs. Specifically, we can examine the atomistic origin of the low- and high-temperature peaks of Xe release, and understand why He exhibits unimodal behaviour. Considering first the question of Xe, the raw simulation data in Figure 7(b) provides clues as to why release occurs at two distinct temperatures. The low-temperature peak is seen to be strongly correlated with proximity to the surface, with 4.5 Å being the critical depth beyond which low-temperature release is impossible. In contrast, high-temperature release is possible for all implantation depths, and even for depths around 1 Å there are two distinct temperature-release populations. The origin of this behaviour is that the surface of the ND progressively graphitizes with temperature, with the {111} faces transforming prior to the {100} faces (see Figure 2). As a result, Xe located close to a {111} faces can become trapped by the developing graphitic layers, and once the layer has fully formed, the Xe is too large to easily diffuse through the hexagonal graphene-like network. This effect is quantified in Figure 9 which replots the Xe data in Figure 7(b) for shallow depths. Panel (a) colour codes each configuration according to the closest crystallographic face, while panel (b) shows a histogram of the thermal release temperatures. It is apparent that the low-temperature peak contains roughly equal contributions from Xe near the {100} and {111} faces, while the high-temperature component is dominated by Xe close to the {111} faces. Placing these observations in a gas release context, we can assert that high temperature peak (such as main peak of Xe-HL) is associated with either deeply buried Xe or shallow burial near a {111} faces, while the ions released at low temperatures (in particular, e.g., Xe-P3) sits just a few Ångströms from the surface, and has no crystallographic preference.
The other major result in Figure 7 is the prediction of the unimodal release distribution for He. The animation sequences reveal that this behaviour can be linked to the nature of the He defect within the ND. In particular, the simulations show that He prefers a tetrahedral interstitial (T-site) in the diamond lattice. Manual inspection of a large number of implantation events show the He is always in an interstitial position; substitutional defects and other lattice damage are not observed. The geometry of the T-site defect is shown in Figure 10(a), with the four orange lines between He and C highlighting the tetrahedral symmetry. The intersitial He diffuses amongst the 110 channels in the lattice, passing through a hexagonal interstitial (H-site) transition state enroute to another T-site. This behaviour means that in the low-temperature range, the He effectively performs a random walk around the ND. Even if the {111} faces has graphitized, which typically occurs at around 1500 K in the simulations (800∘C in the experiments), the He cannot escape through the graphitic layer. Only once the {100} faces begins to graphitize does the He atom escape. These observations elegantly explain why the onset of He release is so much higher than Xe. Additionally, the smaller size of He means that it is more mobile than Xe, which in turn explains why the peak release temperature for He is lower than that of the corresponding Xe high-temperature peak.
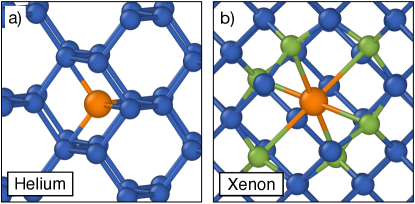
The analysis of He migration in our MD simulations is supported by DFT calculations of NG defects in bulk diamond [51] which similarly conclude that He forms an interstitial defect on the T-site and diffuses via the H-site. The distances predicted by EDIP compare well with those from DFT. For the T-site, the EDIP (DFT) values are 1.61 (1.58) Å for C–He, 1.60 (1.57) Å for the three extended C–C bonds, and 1.52 (1.50) Å for the single compressed C–C bond. For the H-site, the EDIP and DFT bond lengths are identical to two significant figures, 1.57 Å for the C–He distance and 1.63 Å for the C–C bonds. The prediction for the relative energetics is only qualitative, with EDIP favouring the T-site by 0.14 eV, whereas with DFT the T-site is preferred by 2.3 eV. This large difference means that He is mobile at room temperature in the MD simulations. The observation that the simulated He release temperature agrees well with experimental observations shows that He release is driven by the thermally-induced modification of the ND.
For the case of Xe defects in diamond, DFT calculations by Goss, et al. [51] and Drumm, et al. [52] show that the preferred structure is a substitutional site involving an adjacent vacancy (Xes-V), with the Xe placed at the midpoint (Figure 10(b)). In the relaxed structure the Xe is located equidistance from six carbon atoms; with EDIP this distance is 2.25 Å as compared to 2.15 Å in the DFT calculation of Drumm, et al. [52]. Returning our attention to the simulation data in Figure 8(b), we can assign the low-temperature Xe release peak to an Xes-V defect near the surface. Since this defect compromises the stability of the diamond surface, the Xe is able to escape at modest temperatures of a few hundred degrees Celsius.
The DFT study by Goss, et al. [51] also studies other NGs and divides them into two groups: (i) He and Ne which occupy the intersitial T-site and diffuse via the H-site, and (ii) Ar, Kr and Xe which occupy substitional sites with vacancies. This distinction between the interstitial T-site and the substitutional-vacancy provides a plausible explanation for the meteoritic ND data, where He and Ne have unimodal release peaks, while Ar, Kr and Xe have bimodal distributions. To the best of our knowledge, this connection between defect type and temperature-release behaviour has not previously been made.
III.4 Isotopic effects
Investigation of NG release kinetics from synthetic NDs reveal marked mass-dependent fractionation for all elements [14]. Namely, the gases released at high temperatures become progressively enriched in heavy isotopes. At 1400∘C, the magnitude of this effect reaches 0.99 % per amu, and 1.44 % per amu for Xe and Kr, respectively; even larger values are observed for lighter elements [53]. Our MD approach naturally explains this observation.
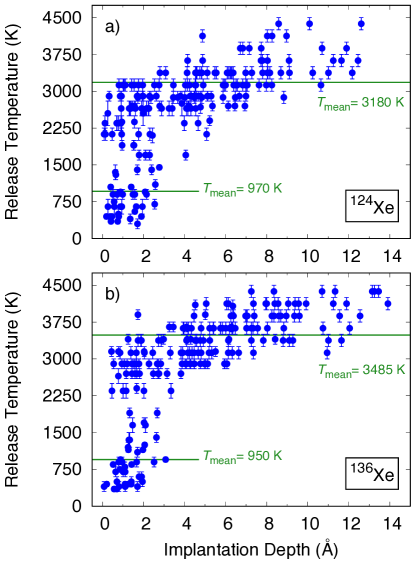
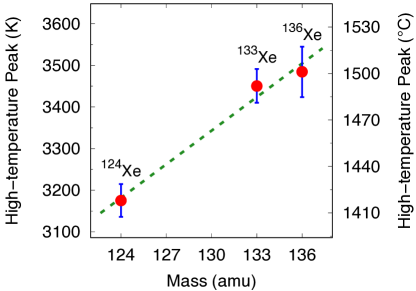
Figure 11 shows thermal release data for 124Xe and 136Xe. As seen earlier, the release profile is again bimodal. For the low-temperature peak, the release temperature is similar across both isotopes, spanning a narrow range between 950 and 980 K, but for the high-temperature peak there is a large isotopic effect with the simulation release temperature varying from 3180 K for 124Xe to 3485 K for 136Xe. Figure 12 plots the mean release temperature for the high-temperature peak for three Xe isotopes, with the left axis showing the simulation temperature and the right axis the equivalent experimental value; error bars denote the standard-error-in-the-mean. Between the lightest and heaviest isotope, the predicted temperature difference is over 80∘C.
The isotopic effect in Figure 12 can be plausibly attributed to the effect of mass on the vibrational frequency during thermal release. An alternative explanation focusing on implantation is less attractive, since a spectrum of implantation energies are employed and there is no obvious reason why a mass difference would generate different types of defects. Regarding the thermal release process, Figure 4(d) (and Supplementary Movie) shows that the 133Xe atom escapes after an extended period of constant “jiggling”. For about 350 ps (between and ps), the Xe is trapped between two graphitic shells and can be seen to move back-and-forth many times before eventually escaping. This observation helps explain why the lighter Xe isotopes release at the lower temperatures as the smaller mass implies a higher vibrational frequency and hence faster reaction rate.
IV Discussion and implications to meteoritic NDs
All calculations performed in our work are relevant for a ND grain with well-defined morphology. It is shown that proximity of the implanted atom to a given crystallographic face – {100} or {111} – can be important for the temperature of gas release. Here an important question arises: what is the minimal size of a ND grain, which develops crystallographic faces? For meteoritic NDs the situation is not obvious, since all imaged grains appear rounded and grains found in situ in meteorites [54] are always associated with disordered –C; spectroscopic data – EELS [55] and XANES [56] also indicate significant amount of -bonding. The origin of this shell is unclear: it may result from severe thermochemical treatment employed for separation of NDs from meteorite and thus represent damaged diamond surfaces and/or be a secondary material precipitated from the acids. Alternatively, they may reflect deviation of morphology of small grains of meteoritic NDs from assumed cuboctahedron shape. However, high resolution TEM studies complemented by DFT modeling of synthetic NDs grains showed well-developed faceting even for the grains less than 2 nm, although the shell is always present [57, 58]. We note also that very small (1.6 nm in diameter) meteoritic NDs may possess intense photon emission of the Si-V defect [59]; the fact indicating fairly perfect ordering of the nanograin lattice and little contribution of surface states.
An important related issue is the presence and eventual influence of surface functional groups on ND grains on the results of our calculations. As noted above, the environment of formation of NDs in space remains debatable, and chemical treatment complicates discussion of their surface chemistry. In the case of NDs in outer space, the presence of significant concentrations of surface-bound N and O is not very plausible. However, hydrogen is almost certainly present, as suggested both by direct astronomical observations of C-H vibrations at 3.43 and 3.53 m assigned to NDs [60, 61] and unusual isotopic composition of hydrogen in meteoritic NDs, possibly inherited from their formation [62]. However, the extent of the surface hydrogenation is yet uncertain; see discussion in Shiryaev, et al. [63]. The influence of surficial hydrogen on the results of our calculations requires additional investigation, but we recall again that even for 1.6 nm ND grains influence of surface states appears to be minor.
The current work provides atomistic explanation of a remarkable phenomenon – release pattern of heavy NGs implanted into ND grains is bimodal and is unimodal for He. We show that the release patterns are satisfactorily explained by such peculiarities of the behavior of the implanted ion in a nanograin, as implantation depth, in-grain diffusion and thermal evolution of the grain structure heated by the ion impact. Besides general interest for understanding of size effects in interaction of ions with matter, this work is relevant to carbon dust evolution in space. Two main scientific tasks are important: (i) origin of isotopically different NG components and (ii) presence of different ND populations, differing in origin, size and/or morphology.
Xenon belonging to two of the three main NG components in NDs – P3 and HL – releases in two main peaks. It is usually assumed that the low temperature peak is dominated by the P3 gases and the high temperature one by the HL gases. The P3 gases appear to reside in traps with broad range of activation energies [15] and are readily lost during thermal metamorphism of the parent bodies of meteorites. Investigation of size-separated NDs revealed that the ratio of P3/HL decreases in small ND grains, but the absolute concentrations of both components increase with the size [12, 64].
Although the present work does not reject the possibility of association of the P3 component with species adsorbed in surficial -containing shells, it shows that monoenergetic implantation alone nicely explains both components. In this case, both low- and high-temperature peaks should be present in a given irradiated population of NDs, implying that if implanted, the P3 and HL gases should contribute to the whole release pattern. In fact, Huss and Lewis [15] and Huss, et al. [53] suggested that an important fraction of HL gases – “labile HL” – is released roughly simultaneously with the P3 component and thus was lost during thermal metamorphism of parent meteorite and/or due to heating in the nebula. In contrast, Koscheev, et al. [14] and Fisenko, et al. [65] proposed that it is the P3 component, which dominates both low- and high-temperature release peaks. Taken together with the hypotheses discussed above, our work indicates that calculation of the Xe-HL isotopic composition should include corrections both for the high-temperature P3 release and for preferential enrichment in heavy isotopes at these steps due to isotopic fractionation. Derivation of the isotopic composition of the “pure” HL component remains nevertheless difficult since it is likely a product of more than one nucleosynthetic process.
The claim that the P3 component should have a high-temperature component also requires the assumption that isotopes of other elements should be implanted. In particular, the contribution of extinct iodine isotopes – 129I and, perhaps, 128I, is invoked for the explanation of the Xe-P3 composition (see Gilmour, et al. [2, 66] for details). Contribution of surface-bound 129I can be ruled out since the energy of the -decay is far too small to drive the Xe recoil into an ND grain. Subsequently, implantation of radioactive iodine isotopes should have occurred. In recent work, Gilmour, et al. [66] suggested that a fraction of Xe released at high temperatures was also produced in situ from iodine. Although we have not explicitly analysed the behaviour of implanted iodine, we believe that the similarity in masses between I and Xe should lead to qualitatively similar behaviour of these elements.
The decrease of the P3/HL ratio in smaller ND grains is; however, more difficult to explain unambiguously. In small grains almost all implants will be in close proximity to the surface and direct application of our modeling would suggest higher fraction of the low-temperature release. However, distortion of shape of the smallest grains [58] influences curvature of the facets and thus may strongly influence diffusion paths of an implant. Variations of the curvature as well and interaction of the implant with surface shell may also be responsible for broad range of bonding energies of the P3 traps. In the same time, there is an ample evidence that NDs from every meteorite represent a mixture of several independent populations of grains [6, 12], which may have very different sources.
Examination of Figures 9 and 11 might give some hints for the origin of the high-temperature Xe-P6. The highest release temperatures were observed for few events of very deep Xe implantation. Examination of size-separated NDs suggests that the P6 component appears to be present mostly in coarse grains [2]. Our calculations addressed only relatively small ND grains with a diameter of 3.9 nm. Examination of larger grains is computationally very expensive and was not performed, but it is reasonable that for a given implantation energy and larger grain size, a larger fraction of the ions will stop at greater depths. The release temperature of these ions will also tend to cluster at higher values.
Last but not least, a result of our calculations is a confirmation of the stability of a Xe-V point defect in a ND grain. In annealed ion-implanted macroscopic diamond this defect possess rather strong infra-red photoluminescence (lines at 793–794 and 811–813 nm) when excited by visible light [67](and references therein). In nanoparticles the annealing required for conversion of the implant to the favourable configuration occurs during the implantation process itself. Together with luminescence of the silicon-vacancy (Si-V) defects [63], the Xe-V complex opens a new possibility for eventual observation of NDs in stellar environments.
V Conclusion
In this work we developed a molecular dynamics approach to address the important unresolved question of the origin of the unimodal and bimodal thermal release patterns of NGs from meteoritic NDs. Our technique employs a large number (circa ) of small MD simulations to calculate the thermal release pattern of implanted NGs in ND and provides detailed atomistic insight. We reproduce the known experimental profiles for He and Xe, and propose that the position and structure of the noble-gas defect are responsible for the unimodal and bimodal patterns, respectively. In the case of Xe, we show that the low temperature component is associated with shallow implantation on the {100} faces, while the Xe-HL component is a mixture of deeply buried defects and shallow implantation on the {111} faces. Although our simulation methodology does not capture every single experimental detail, it appears that a relatively straightforward description of the system captures the key features. Areas of extension in future work include the addition of hydrogen, modelling of the sp2+x shell, and improved potentials to describe the energetics of defect migration and the {111} surface reconstruction.
The MD methodology is natural fit for cloud-computing facilities and can be easily extended to other systems where NGs are found in pre-solar grains. In NDs, obvious directions for future work include unimodal release in 3He, 20Ne, 21Ne and 22Ne and bimodal behaviour of 38Ar, 36Ar, 84Kr and 86Kr. Success in replication of the isotopic effects may serve as a tool to investigate computationally implantation processes of short-living isotopes; for example, spanning the whole range of known Xe isotopes from 108Xe to 148Xe.
Aside from NDs, there are several other materials relevant for interstellar dust studies where our MD methodology can be applied. These include silicon carbide (SiC) and graphite [68, 69, 1, 70, 71, 72]. These pre-solar materials have high melting points and therefore are suitable for our Arrhenius-based approach. Ballistic stage of ion implantation in nano- and micron-sized C and SiC grains was studied using Monte-Carlo-based approach (SRIM) [73]. However, these calculations cannot address grain heating, annihilation of defects and many other effects. Therefore, whereas the range of ions is rather accurately predicted, the overall impact of the implantation on nanograins remains elusive. A number of successful atomistic simulation studies address high-temperature effects in SiC [74], graphite and carbide-derived carbons [31, 32]. These structures provide a natural starting point for further atomistic simulations to reveal the astrophysical secrets of NGs in pre-solar grains.
The main findings of our work are summarized as following;
-
(i)
Upon heating, monoenergetic Xe ions implanted into an ND grain will be released in two distinct peaks at markedly different temperatures.
-
(ii)
Implanted monoenergetically He ions will be released as a single broad peak with an onset shifted to higher temperatures relative to Xe.
-
(iii)
Isotopic fractionation favouring heavy isotopes accompanies high-temperature steps.
-
(iv)
Differences in the behaviour of implanted NGs are explained by diverse types of formed lattice defects and diffusion paths.
-
(vi)
Exact release pattern of the implanted NGs depends on the morphology of the grain, the position of the implant in the grain, and the peculiarities of the impact.
-
(vii)
Our results suggest that the implantation scenario can explain both the P3 and HL components of Xe in NDs. In addition, both components should possess low- and high-temperature release peaks. The absence of a low-temperature peak for the HL and, possibly, for the P6 component is due to post-implantation annealing of the grains.
Acknowledgements
We gratefully acknowledge many helpful discussions with Ulrich Ott. NAM acknowledges fellowship FT120100924 from the Australian Research Council. Computational resources were provided by the Pawsey Supercomputing Centre with funding from the Australian Government and the Government of Western Australia.
Supplementary Information
Molecular dynamics approach for predicting release temperatures of noble gases in pre-solar nanodiamonds
In this Supplementary Information, we provide further information on:
-
•
Helium–carbon and xenon–carbon interactions.
-
•
Annealing of pristine ND
-
•
Movies of helium and xenon release processes at high temperature.
All the equations, sections and figure in Supplementary Information are labeled
with the prefix “S” to be distinguished from those that appear in the body of
the paper.
S1 He–C and Xe–C interactions
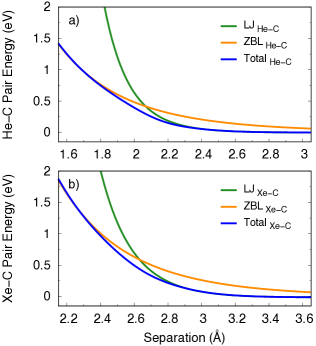
As described in the Methodology section of the main text, for the He–C and Xe–C interactions, we use the standard Ziegler-Biersack-Littmark (ZBL) potential coupled with a Lennard-Jones (LJ) potential. The LJ potential has the form
| (S1) |
where for He–C interactions =0.0013 eV and =2.98 Å [75] and for Xe–C interactions =0.0114 eV and =3.332 Å [76]. Following [24] and [33], the total interaction energy is expressed as
| (S2) |
where is a Fermi-type switching function, =0.09 Å and =0.07 Å [34]. The Fermi function is given by
| (S3) |
where controls the sharpness of the transition and is the cutoff distance; these parameters are chosen manually to ensure smoothness. For Xe–C we use =8 Å and =2.7 Å, the same as our recent implantation studies [39, 34], while for He–C we use =9.2 Å and =2.2 Å. Figure S1 illustrates the He–C and Xe–C interaction energy covering the ZBL and LJ regimes. Further discussion and full details of the interpolation process are provided in Buchan, et al. [24] and Christie, et al. [33].
S2 Annealing of pristine ND
As described in the main text, the the simulation temperatures are mapped onto their experimental equivalent using the Arrhenius relation. Calibration is performed using the graphitization of NDs into C onions as a reference point. Figure 2 in the main text illustrates cross-sectional snapshots of the annealed ND for eight different temperatures. Panel (a) shows that at 1000 K there is insufficient temperature to graphitize the ND on this timescale, while at 1500 and 2000 K (panels (b) and (c)) some of the bonds on the {111} faces are broken and graphitic shells form. The reason this occurs is that –C hybridized atoms near the surface can easily rearrange into graphite with –C hybridization [46, 77, 78, 79]. At higher annealing temperatures of 2500 and 3000 K (panels (d) and (e)), graphitization proceeds further inwards, creating structures with a diamond core surrounded by a graphitic shell. This core-shell structure is in good agreement with previous experimental and simulation studies [46, 45, 47, 80, 48, 81, 82, 83]. At 3500 K (panel (f)), a pure carbon onion (or concentric fullerene) is obtained and only a few small number of atoms (1%) have been lost via evaporation. At this point we have identified the temperature at which the experimental result is reproduced on the timescale that is affordable in the simulation. At the slightly higher temperature of 4000 K (panel (g)), around 8% of the atoms evaporate and the C atom develops a hollow core; similar structures are seen in Figure 8(e) of Lau, et al. [26]. At the highest temperature of 4500 K (panel (h)), the ND is completely destroyed and more than 29% of atoms are evaporated, creating a large, disordered fullerene.
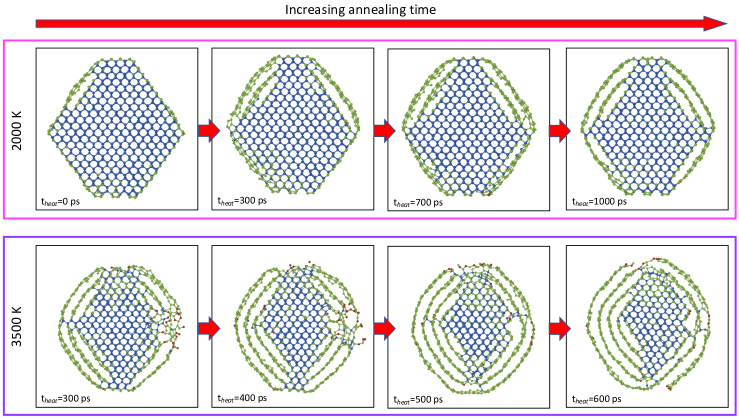
The time-evolution of the graphitization process is shown in Figure S2 for two different annealing temperatures. The upper panel shows data at 2000 K, where as time increases, the {111} faces graphitize first, following later by the {100} faces. At the higher temperature of 3500 K (lower panel), a similar sequence occurs, with the addition of an unravelling process which is facilitated by the development of spirals.
S3 Supplementary Movie
Time evolution of He (first part) and Xe (second part) release processes from 3.9 nm ND during the high-temperature annealing (as discussed at the Figure 4 in the main text). The thickness of the slice is 1 nm. The pink lines indicate the He and Xe trajectories, and the He and Xe are shown as an orange circle. C atoms are shown as red, green and blue circles with –C, –C and –C hybridizations, respectively.
References
- [1] Ulrich Ott. Planetary and pre-solar noble gases in meteorites. Chem Erde-Geochem., 74:519–544, 2014.
- [2] J D Gilmour, A B Verchovsky, A V Fisenko, G Holland, and G Turner. Xenon isotopes in size separated nanodiamonds from Efremovka: 129Xe*, Xe-P3, and Xe-P6. Geochim. Cosmochim. Acta, 69:4133–4148, 2005.
- [3] Uffe G Jørgensen. Formation of Xe-HL-enriched diamond grains in stellar environments. Nature, 332:702–705, 1988.
- [4] D Heymann and M Dziczkaniec. Xenon from intermediate zones of supernovae. In Lunar and Planetary Science Conference Proceedings, volume 10, pages 1943–1959, 1979.
- [5] U. Ott, A. Besmehn, K. Farouqi, O. Hallmann, P. Hoppe, K.-L. Kratz, K. Melber, and A. Wallner. New attempts to understand nanodiamond stardust. Publications of the Astronomical Society of Australia, 29(2):90–97, 2012.
- [6] Sara S Russell, John W Arden, and CT Pillinger. A carbon and nitrogen isotope study of diamond from primitive chondrites. Meteoritics & Planetary Science, 31(3):343–355, 1996.
- [7] Mika T Westerhausen, Aleksandra T Trycz, Connor Stewart, Milad Nonahal, Blake Regan, Mehran Kianinia, and Igor Aharonovich. Controlled doping of gev and snv color centers in diamond using chemical vapor deposition. ACS applied materials & interfaces, 12(26):29700–29705, 2020.
- [8] Kenneth T Koga, James A Van Orman, and Michael J Walter. Diffusive relaxation of carbon and nitrogen isotope heterogeneity in diamond: a new thermochronometer. Physics of the Earth and Planetary Interiors, 139(1-2):35–43, 2003.
- [9] AV Fisenko and LF Semjonova. On nature of bimodal release of noble gases during pyrolysis of the meteoritic nanodiamonds. Geochemistry International, 48(12):1177–1184, 2010.
- [10] R S Lewis and E Anders. Isotopically anomalous xenon in meteorites - A new clue to its origin. Astrophys. J, 247:1122–1124, 1981.
- [11] Roy S Lewis, Tang Ming, John F Wacker, Edward Anders, and Eric Steel. Interstellar diamonds in meteorites. Nature, 326:160–162, 1987.
- [12] A B Verchovsky, A V Fisenko, L F Semjonova, I P Wright, M R Lee, and C T Pillinger. C, N, and Noble Gas Isotopes in Grain Size Separates of Presolar Diamonds from Efremovka. Science, 281:1165–1168, 1998.
- [13] Gary R Huss and Roy S Lewis. Noble gases in presolar diamonds I: Three distinct components and their implications for diamond origins. Meteoritics, 29:791–810, 1994.
- [14] A P Koscheev, M D Gromov, R K Mohapatra, and Ulrich Ott. History of trace gases in presolar diamonds inferred from ion-implantation experiments. Nature, 412:615–617, 2001.
- [15] Gary R Huss and Roy S Lewis. Noble gases in presolar diamonds II: Component abundances reflect thermal processing. Meteoritics, 29:811–829, 1994.
- [16] A B Verchovsky, I P Wright, A V Fisenko, L F Semjonova, and C T Pillinger. Ion Implantation into Presolar Diamonds: Experimental Simulation. Journal of Conference Abstracts, 5:1050, 2000.
- [17] Nigel A Marks. Generalizing the environment-dependent interaction potential for carbon. Phys. Rev. B, 63:2879–7, 2000.
- [18] JF Ziegler, JP Biersack, and U Littmark. The Stopping and Range of Ions in Solids., volume 1. Pergamon, New York, 1985.
- [19] Alireza Aghajamali. Atomistic Simulations of Diamond: Implantation, Annealing, Deformation and Relaxation. PhD thesis, Curtin University, 2020.
- [20] Carla de Tomas, Irene Suarez-Martinez, and Nigel A Marks. Graphitization of amorphous carbons: A comparative study of interatomic potentials. Carbon, 109:681–693, 2016.
- [21] Carla de Tomas, Alireza Aghajamali, Jake L. Jones, Daniel J. Lim, Maria J. Lopez, Irene Suarez-Martinez, and Nigel A. Marks. Transferability in interatomic potentials for carbon. Carbon, 155:624–634, 2019.
- [22] Nigel A Marks, M Lattemann, and D R McKenzie. Nonequilibrium Route to Nanodiamond with Astrophysical Implications. Phys. Rev. Lett., 108:343–5, 2012.
- [23] Barbara A Fairchild, Sergey Rubanov, Desmond W M Lau, Marc Robinson, Irene Suarez Martinez, Nigel A Marks, Andrew D Greentree, Dougal McCulloch, and Steven Prawer. Mechanism for the Amorphisation of Diamond. Adv. Mater., 24:2024–2029, 2012.
- [24] J T Buchan, M Robinson, H J Christie, D L Roach, D K Ross, and Nigel A Marks. Molecular dynamics simulation of radiation damage cascades in diamond. J. Appl. Phys., 117:245901–9, 2015.
- [25] Blake Regan, Alireza Aghajamali, Johannes Froech, Toan Trong Tran, John Scott, James Bishop, Irene Suarez-Martinez, Ying Liu, Julie M. Cairney, Nigel A Marks, Milos Toth, and Igor Aharonovich. Plastic deformation of single-crystal diamond nanopillars. Adv. Mater., 32:1906458, 2020.
- [26] Desmond W M Lau, Dougal McCulloch, Nigel A Marks, N R Madsen, and A V Rode. High-temperature formation of concentric fullerene-like structures within foam-like carbon: Experiment and molecular dynamics simulation. Phys. Rev. B, 75:035401–4, 2007.
- [27] Nigel A Marks, N C Cooper, D R McKenzie, Dougal McCulloch, P Bath, and S P Russo. Comparison of density-functional, tight-binding, and empirical methods for the simulation of amorphous carbon. Phys. Rev. B, 65:317–9, 2002.
- [28] Steven Best, Jake B Wasley, Carla de Tomas, Alireza Aghajamali, Irene Suarez-Martinez, and Nigel A Marks. Evidence for glass behavior in amorphous carbon. C—Journal of Carbon Research, 6(3):50, 2020.
- [29] Irene Suarez-Martinez and Nigel A Marks. Amorphous carbon nanorods as a precursor for carbon nanotubes. Carbon, 50:5441–5449, 2012.
- [30] Irene Suarez-Martinez, P J Higginbottom, and Nigel A Marks. Molecular dynamics simulations of the transformation of carbon peapods into double-walled carbon nanotubes. Carbon, 48:3592–3598, 2010.
- [31] Carla de Tomas, Irene Suarez Martinez, Fernando Vallejos-Burgos, María J López, Katsumi Kaneko, and Nigel A Marks. Structural prediction of graphitization and porosity in carbide-derived carbons. Carbon, 119:1–9, 2017.
- [32] Carla de Tomas, Irene Suarez-Martinez, and Nigel A Marks. Carbide-derived carbons for dense and tunable 3D graphene networks. Appl. Phys. Lett., 112:251907–6, 2018.
- [33] H J Christie, M Robinson, D L Roach, D K Ross, Irene Suarez-Martinez, and Nigel A Marks. Simulating radiation damage cascades in graphite. Carbon, 81:105–114, 2015.
- [34] Jason L Fogg, Alireza Aghajamali, Jonathan A Hinks, Stephen E Donnelly, Andrey A Shiryaev, and Nigel A Marks. Modification of nanodiamonds by xenon implantation: A molecular dynamics study. Nucl. Instrum. Methods Phys. Res. B, 453:32–40, 2019.
- [35] Nigel A Marks and Marc Robinson. Variable timestep algorithm for molecular dynamics simulation of non-equilibrium processes. Nucl. Instrum. Methods Phys. Res. B, 352:3–8, 2015.
- [36] Marco De La Pierre, Marco Bruno, Chiara Manfredotti, Fabrizio Nestola, Mauro Prencipe, and Claudio Manfredotti. The (100),(111) and (110) surfaces of diamond: an ab initio b3lyp study. Molecular Physics, 112(7):1030–1039, 2014.
- [37] Amanda S Barnard and P Zapol. A model for the phase stability of arbitrary nanoparticles as a function of size and shape. J. Chem. Phys., 121:4276–4283, 2004.
- [38] KC Pandey. New dimerized-chain model for the reconstruction of the diamond (111)-(2 1) surface. Physical Review B, 25(6):4338, 1982.
- [39] Andrey A Shiryaev, Jonathan A Hinks, Nigel A Marks, Graeme Greaves, Felipe J Valencia, Stephen E Donnelly, Rafael I González, Miguel Kiwi, Alexander L Trigub, Eduardo M Bringa, Jason L Fogg, and Igor I Vlasov. Ion implantation in nanodiamonds: size effect and energy dependence. Sci. Rep., 8:992, 2018.
- [40] J.J Thomson. On the structure of the atom: An investigation of the stability and periods of oscillation of a number of corpuscles arranged at equal intervals around the circumference of a circle; with application of the results to the theory of atomic structure. London, Edinburgh, and Dublin Philosophical Magazine and Journal of Science, 7:237–265, 1904.
- [41] Alexander Stukowski. Visualization and analysis of atomistic simulation data with OVITO - the Open Visualization Tool. Model. Simul. Mater. Sci. Eng., 18:015012, 2010.
- [42] Arthur F. Voter. Hyperdynamics: Accelerated molecular dynamics of infrequent events. Phys. Rev. Lett., 78:3908–3911, 1997.
- [43] Arthur F. Voter. Parallel replica method for dynamics of infrequent events. Phys. Rev. B, 57:R13985–R13988, 1998.
- [44] Mads R. Sørensen and Arthur F. Voter. Temperature-accelerated dynamics for simulation of infrequent events. J. Chem. Phys., 112:9599–9606, 2000.
- [45] V.L. Kuznetsov, A.L. Chuvilin, E.M. Moroz, V.N. Kolomiichuk, Sh.K. Shaikhutdinov, Yu.V. Butenko, and I.Yu. Mal’kov. Effect of explosion conditions on the structure of detonation soots: Ultradisperse diamond and onion carbon. Carbon, 32:873–882, 1994.
- [46] Vladimir L. Kuznetsov, Andrey L. Chuvilin, Yuri V. Butenko, Igor Yu. Mal’kov, and Vladimir M. Titov. Onion-like carbon from ultra-disperse diamond. Chem. Phys. Lett., 222:343–348, 1994.
- [47] Satoshi Tomita, Andrzej Burian, John C Dore, David LeBolloch, Minoru Fujii, and Shinji Hayashi. Diamond nanoparticles to carbon onions transformation: X-ray diffraction studies. Carbon, 40:1469–1474, 2002.
- [48] Zhijun Qiao, Jiajun Li, Naiqin Zhao, Chunsheng Shi, and Philip Nash. Graphitization and microstructure transformation of nanodiamond to onion-like carbon. Scr. Mater., 54:225–229, 2006.
- [49] J Xiao, G Ouyang, P Liu, C X Wang, and G W Yang. Reversible Nanodiamond-Carbon Onion Phase Transformations. Nano Lett., 14:3645–3652, 2014.
- [50] Gary R Huss. Meteoritic Nanodiamonds: Messengers from the Stars. Elements, 1:97–100, 2005.
- [51] J. P. Goss, R. J. Eyre, P. R. Briddon, and Alison Mainwood. Density functional simulations of noble-gas impurities in diamond. Phys. Rev. B, 80:085204, 2009.
- [52] D W Drumm, M C Per, S P Russo, and L C L Hollenberg. Thermodynamic stability of neutral Xe defects in diamond. Phys. Rev. B, 82:054102–6, 2010.
- [53] Gary R Huss, Ulrich Ott, and Alexey P Koscheev. Noble gases in presolar diamonds iii: Implications of ion implantation experiments with synthetic nanodiamonds. Meteoritics & Planetary Science, 43(11):1811–1826, 2008.
- [54] Laurence AJ Garvie and Peter R Buseck. Carbonaceous materials in the acid residue from the orgueil carbonaceous chondrite meteorite. Meteoritics & Planetary Science, 41(4):633–642, 2006.
- [55] AJ Laurence Garvie. Surface electronic states of meteoritic nanodiamonds. Meteoritics & Planetary Science, 41(5):667–672, 2006.
- [56] AA Shiryaev, AV Fisenko, II Vlasov, LF Semjonova, P Nagel, and S Schuppler. Spectroscopic study of impurities and associated defects in nanodiamonds from efremovka (cv3) and orgueil (ci) meteorites. Geochimica et Cosmochimica Acta, 75(11):3155–3165, 2011.
- [57] Stepan Stehlik, Marian Varga, Martin Ledinsky, Daria Miliaieva, Halyna Kozak, Viera Skakalova, Clemens Mangler, Timothy J Pennycook, Jannik C Meyer, Alexander Kromka, et al. High-yield fabrication and properties of 1.4 nm nanodiamonds with narrow size distribution. Scientific reports, 6:38419, 2016.
- [58] Shery L. Y. Chang, Christian Dwyer, Eiji Ōsawa, and Amanda S. Barnard. Size dependent surface reconstruction in detonation nanodiamonds. Nanoscale Horizons, 3(2):213–217, 2018.
- [59] Igor I Vlasov, Andrey A Shiryaev, Torsten Rendler, Steffen Steinert, Sang-Yun Lee, Denis Antonov, Márton Vörös, Fedor Jelezko, Anatolii V Fisenko, Lubov F Semjonova, et al. Molecular-sized fluorescent nanodiamonds. Nature nanotechnology, 9(1):54–58, 2014.
- [60] O. Guillois, G. Ledoux, and C. Reynaud. Diamond infrared emission bands in circumstellar media. The Astrophysical Journal, 521(2):L133–L136, 1999.
- [61] Caroline Van Kerckhoven and C Waelkens. Nanodiamonds around hd 97048 and elias 1. Astronomy & Astrophysics, 384(2):568–584, 2002.
- [62] A Virag, E Zinner, RS Lewis, and M Tang. Isotopic compositions of h, c, and n in c diamonds from the allende and murray carbonaceous chondrites. In Lunar and Planetary Science Conference, volume 20, 1989.
- [63] AA Shiryaev, AV Fisenko, LF Semjonova, AA Khomich, and II Vlasov. Photoluminescence of silicon-vacancy defects in nanodiamonds of different chondrites. Meteoritics & Planetary Science, 50(6):1005–1012, 2015.
- [64] AV Fisenko, LF Semenova, AB Verchovsky, and KT Pillinger. Noble gases in the grain-size fractions of presolar diamond from the boriskino cm2 meteorite. Geochemistry International, 42(81):708–719, 2004.
- [65] AV Fisenko and LF Semjonova. Meteoritic nanodiamonds: Alternative composition of xenon components. Solar System Research, 54(3), 2020.
- [66] JD Gilmour, G Holland, AB Verchovsky, AV Fisenko, SA Crowther, and G Turner. Xenon and iodine reveal multiple distinct exotic xenon components in efremovka “nanodiamonds”. Geochimica et Cosmochimica Acta, 177:78–93, 2016.
- [67] Y Deshko and AA Gorokhovsky. Spectroscopy and micro-luminescence mapping of xe-implanted defects in diamond. Low Temperature Physics, 36(5):465–471, 2010.
- [68] Ulrich Ott. Interstellar grains in meteorites. Nature, 364(6432):25–33, 1993.
- [69] Ulrich Ott. Presolar Grains in Meteorites and Their Compositions. Space Sci. Rev., 130:87–95, 2007.
- [70] Andrew M. Davis. Stardust in meteorites. Proc. Natl. Acad. Sci., 108:19142–19146, 2011.
- [71] Sachiko Amari, Edward Anders, Alois Virag, and Ernst Zinner. Interstellar graphite in meteorites. Nature, 345:238–240, 1990.
- [72] Sachiko Amari, Peter Hoppe, Ernst Zinner, and Roy S Lewis. The isotopic compositions and stellar sources of meteoritic graphite grains. Nature, 365:806–809, 1993.
- [73] AB Verchovsky, IP Wright, and CT Pillinger. Ion implantation into presolar grains: a theoretical model. Publications of the Astronomical Society of Australia, 20(4):329–336, 2003.
- [74] Kazunori Fujisawa, Yu Lei, Carla de Tomas, Irene Suarez Martinez, Chanjing Zhou, Yu-Chuan Lin, Shruti Subramanian, Ana Laura Elías, Masatsugu Fujishige, Kenji Takeuchi, Joshua A Robinson, Nigel Anthony Marks, Morinobu Endo, and Mauricio Terrones. Facile 1D graphene fiber synthesis from an agricultural by-product: A silicon-mediated graphenization route. Carbon, 142:78–88, 2019.
- [75] Thanh X Nguyen, Nathalie Cohaut, Jun-Seok Bae, and Suresh K Bhatia. New Method for Atomistic Modeling of the Microstructure of Activated Carbons Using Hybrid Reverse Monte Carlo Simulation. Langmuir, 24:7912–7922, 2008.
- [76] Vahan V Simonyan, J Karl Johnson, Anya Kuznetsova, and John T Yates Jr. Molecular simulation of xenon adsorption on single-walled carbon nanotubes. J. Chem. Phys., 114:4180–4185, 2001.
- [77] C Z Wang, K M Ho, M D Shirk, and P A Molian. Laser-Induced Graphitization on a Diamond (111) Surface. Phys. Rev. Lett., 85:4092–4095, 2000.
- [78] C Pantea, J Qian, G A Voronin, and T W Zerda. High pressure study of graphitization of diamond crystals. J. Appl. Phys., 91:1957–1962, 2002.
- [79] Amanda S Barnard, S P Russo, and I K Snook. Structural relaxation and relative stability of nanodiamond morphologies. Diam. Relat. Mater., 12:1867–1872, 2003.
- [80] Jan H. Los, Luca M. Ghiringhelli, Evert Jan Meijer, and A. Fasolino. Improved long-range reactive bond-order potential for carbon. i. construction. Phys. Rev. B, 72:214102, 2005.
- [81] A Bródka, T W Zerda, and A Burian. Graphitization of small diamond cluster — Molecular dynamics simulation. Diam. Relat. Mater, 15:1818–1821, 2006.
- [82] A Bródka, Ł Hawełek, A Burian, S Tomita, and V Honkimäki. Molecular dynamics study of structure and graphitization process of nanodiamonds. J. Mol. Struct., 887:34–40, 2008.
- [83] P Ganesh, P R C Kent, and Vadym N Mochalin. Formation, characterization, and dynamics of onion-like carbon structures for electrical energy storage from nanodiamonds using reactive force fields. J. Appl. Phys., 110:073506–9, 2011.