Gaia DR2 colour-temperature relations based on infrared flux method results
1
The ESA/Gaia mission (Gaia Collaboration, Prusti et al., 2016) is providing accurate and precise all-sky photometry in three photometric filters named G, BP and RP (Gaia Collaboration, Evans et al., 2018). The superb quality of this homogeneous photometric database allows a significant improvement in the determination of stellar parameters. Amongst them, the effective temperature ( ) is the most crucial parameter in the chemical abundance derivation because it affects any kind of atomic or molecular line. Photometric are preferred to those derived from excitation and ionisation balances in stellar spectra, in particular at low metallicity (see e.g. Mucciarelli & Bonifacio, 2020), being less affected by the inadequacies of the models of stellar atmospheres.
One of the most widely adopted methods to derive accurate stellar is the infrared flux method (IRFM) that uses the monochromatic flux in the near infrared bands. González Hernández & Bonifacio (2009) derived for a sample of dwarf and giant stars through IRFM and using the 2MASS photometry and provided relations between and different broad-band colours based on Johnson-Cousin and 2MASS magnitudes.
In order to extend these relations to colours including the Gaia magnitudes, we combined derived by González Hernández & Bonifacio (2009) for their sample of dwarf and giant stars, with the photometry available from the second release of the ESA/Gaia mission (Gaia Collaboration, Brown et al., 2018; Gaia Collaboration, Evans et al., 2018) and the K-band magnitudes from the 2MASS database (Skrutskie et al., 2006). We consider the broad-band colours and . We adopted the same colour excess values, E(B-V), provided by González Hernández & Bonifacio (2009). The reddening corrections have been performed following the procedure described in Gaia Collaboration, Babusiaux et al. (2018), for the Gaia filters, and adopting the extinction coefficient by McCall (2004) for the K filter.
To derive our color-Teff relations we used only stars with uncertainties mag in the Gaia magnitudes, but most of the stars in our sample have uncertainties in the individual magnitudes of about 0.005 mag or less. We performed a fit for each colour (considering separately dwarf and giant stars), using the fitting formula usually adopted in other studies based on IRFM
| (1) |
where =5040/ , C is the used colour and ,…, are the coefficients of the fit. We adopted an iterative 2.5-clipping procedure to remove outliers.
Table 1 lists for each colour the colour range, the final number of stars used for the fit, the 1 dispersion of the fit residuals and the coefficients ,…,. For the dwarf stars, the residuals have a standard deviation of about 50-70 K, while it is 50-100 K for the giant stars. These dispersions are comparable with those obtained for Johnson-Cousin-2MASS colours by González Hernández & Bonifacio (2009). We note that the colours including the K-band magnitude provide colour- relations with lower dispersion of the residuals than pure Gaia colours, especially for giant stars, probably due to their large baseline in wavelength.
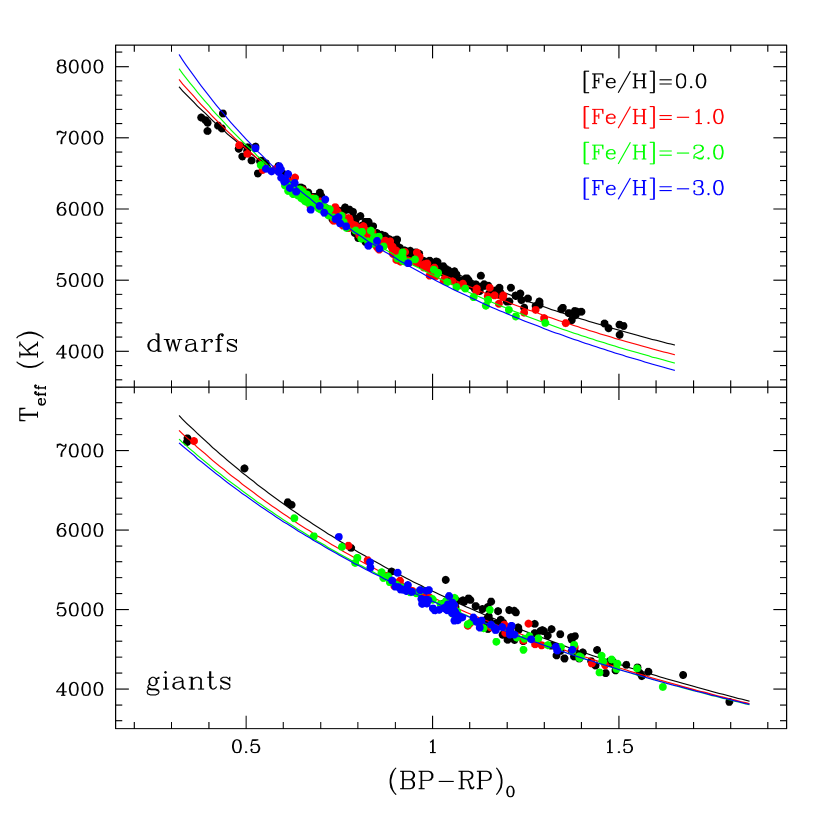
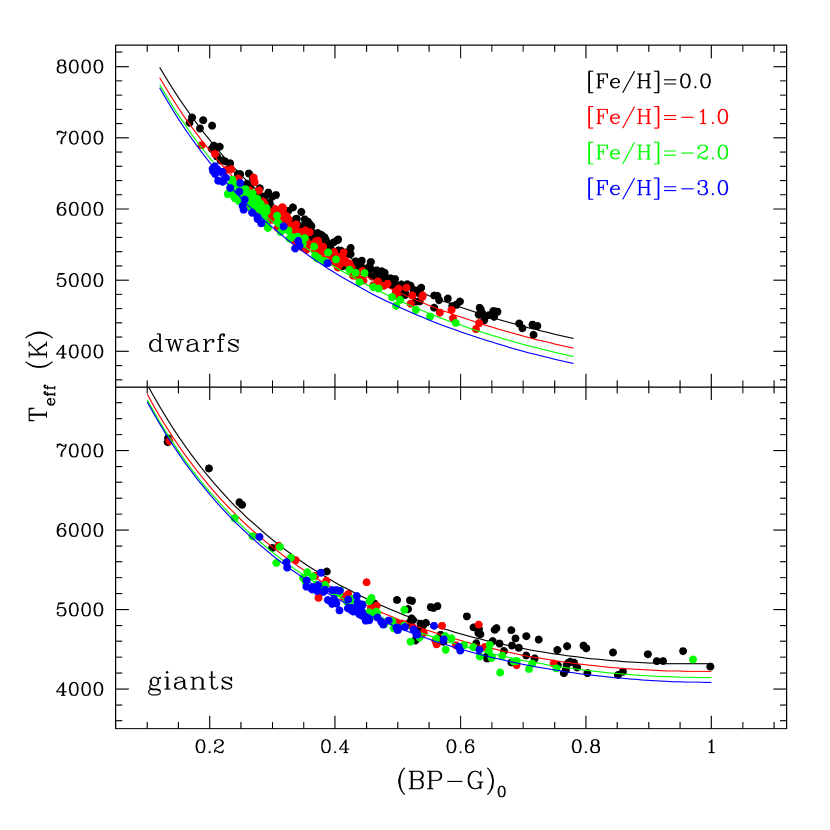
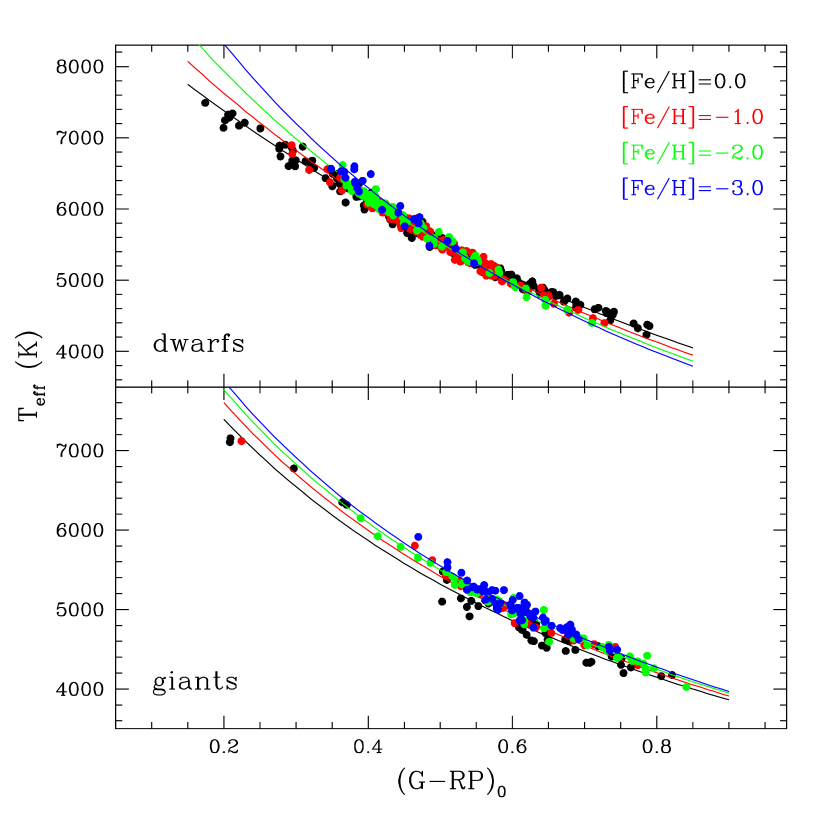
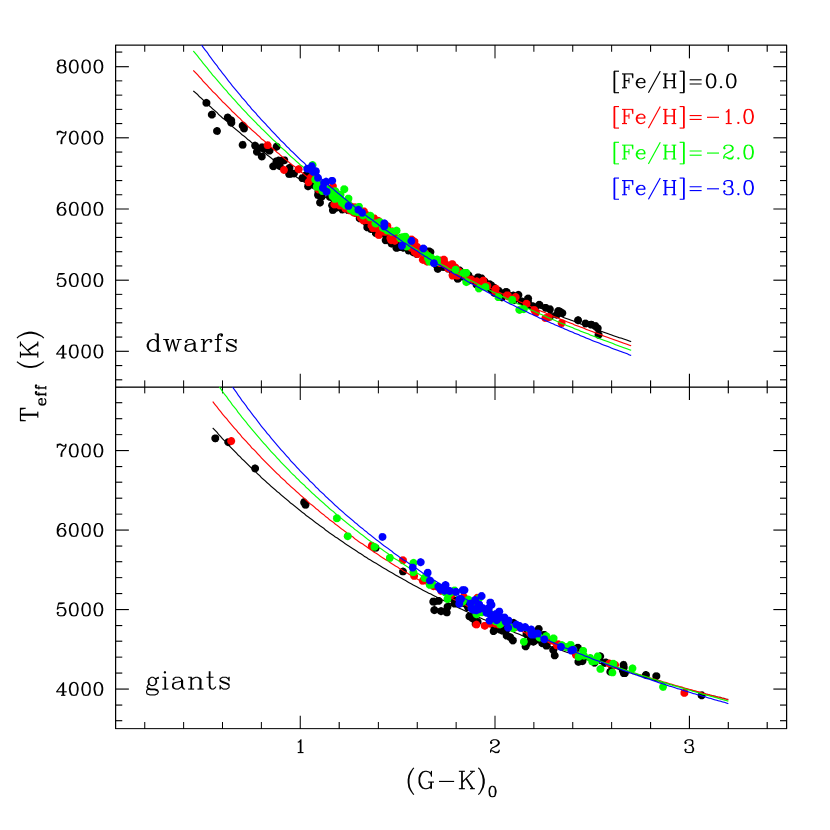
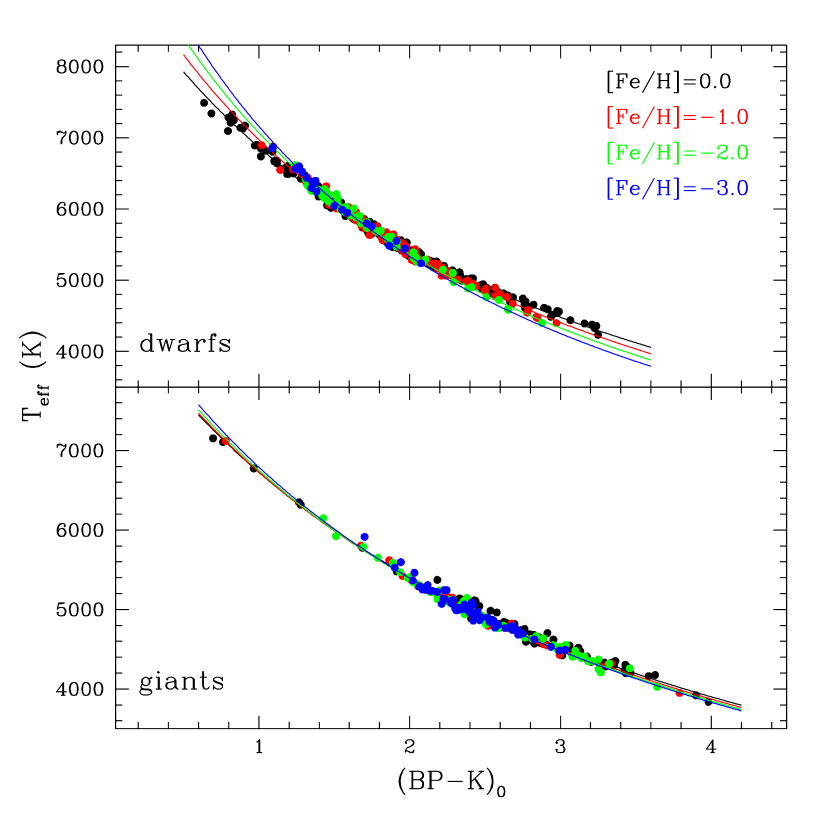
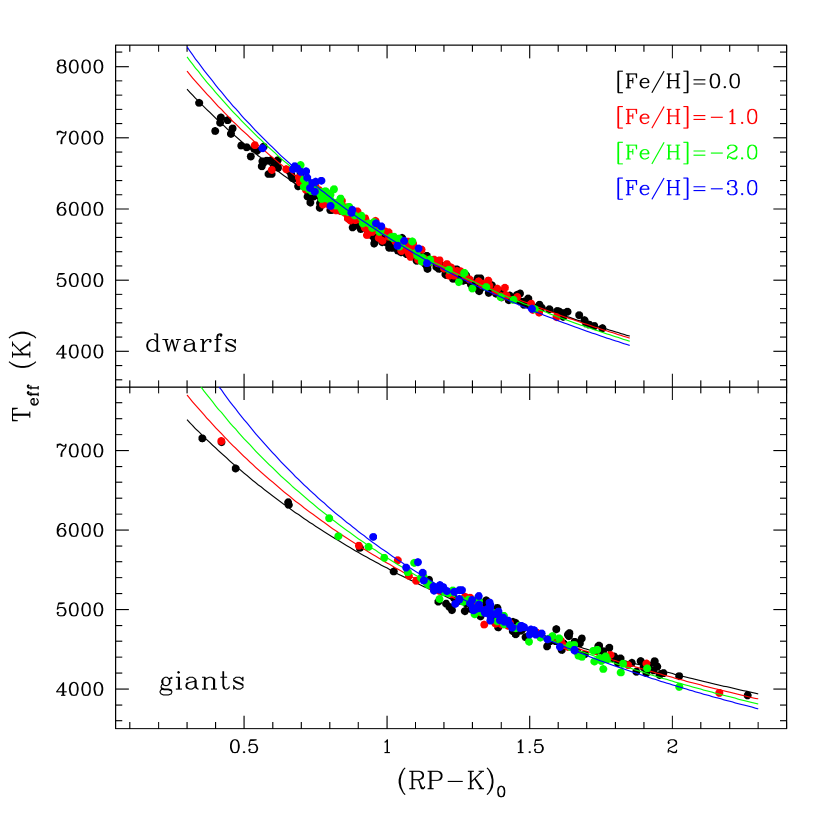
Figures 1-6 show the behaviour of by González Hernández & Bonifacio (2009) as a function of the adopted colours, grouping the stars in four metallicity bins: [Fe/H]–2.5 dex (blue points),–2.5[Fe/H],–1.5 (green points), –1.5[Fe/H],–0.5 (red points), [Fe/H]–0.5 dex (black points). The polynomial fits calculated with four metallicity values are superimposed with the same colour-code used for the stars.
For dwarf stars, the dispersion is similar in all the metallicity bins. On the other hand, for the giant stars the dispersion is dominated by the stars with [Fe/H]–0.5 that have larger uncertainties in the Gaia magnitudes.
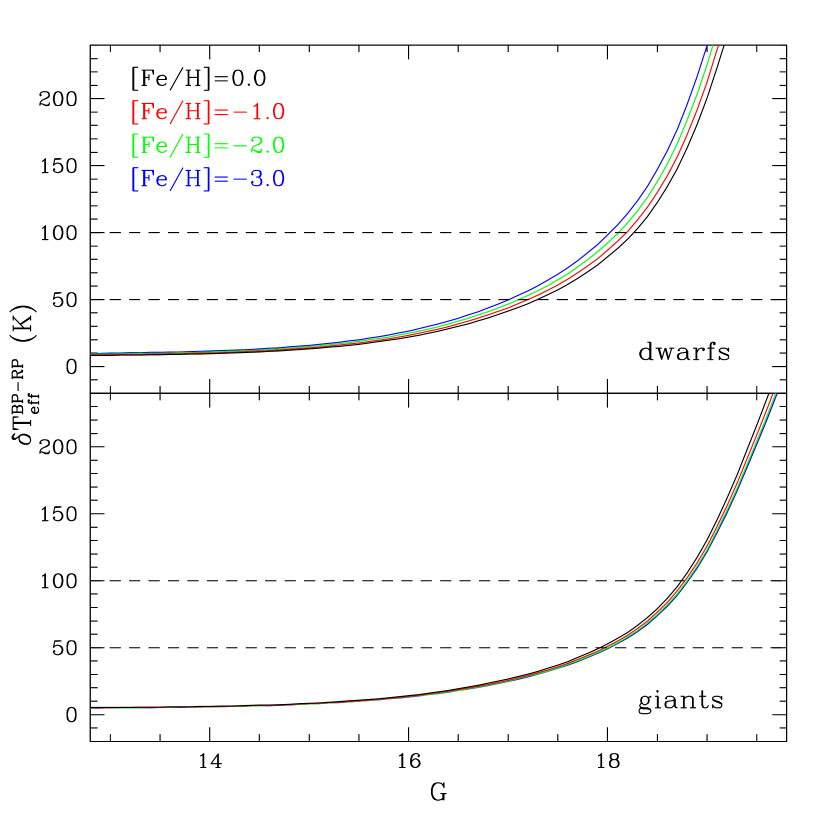
We estimated the typical uncertainties in the derived due to the uncertainties in the adopted photometric colours. We considered the average photometric errors in as quoted by Gaia Collaboration, Evans et al. (2018). The behaviour of the variations as a function of the G-band magnitude for dwarf and giant stars is shown in Fig. 7. For dwarf stars, with uncertainties of about 50 and 100 K can be obtained for stars with G17 and 18, respectively. For giant stars, the same errors in can be obtained at G18 and 18.7. For stars fainter than G18 and 18.7 (for dwarf and giant stars, respectively), the uncertainties in increase significantly. Note that the metallicity has a small impact on the derived errors.
These relations allow the exploitation of the all-sky Gaia DR2 photometry to obtain precise measurements, consistent with those derived from other photometric data via the method described in González Hernández & Bonifacio (2009).
| Colour | Colour range | N | |||||||
| (mag) | (K) | ||||||||
| Dwarf stars | |||||||||
| [0.38–1.51] | 61 | 445 | 0.4988 | 0.4925 | –0.0287 | 0.0193 | –0.0017 | –0.0384 | |
| [0.17–0.72] | 77 | 429 | 0.4800 | 1.3160 | –0.4957 | –0.0086 | –0.0020 | –0.0444 | |
| [0.17–0.79] | 68 | 438 | 0.5623 | 0.5422 | 0.3069 | 0.0367 | –0.0019 | –0.0829 | |
| [0.64–3.24] | 47 | 454 | 0.5375 | 0.1967 | –0.0002 | 0.0268 | 0.0006 | –0.0150 | |
| [0.34–1.75] | 54 | 444 | 0.5451 | 0.3739 | –0.0120 | 0.0289 | 0.0026 | –0.0185 | |
| [0.52–2.53] | 51 | 446 | 0.5576 | 0.2191 | 0.0095 | 0.0334 | 0.0014 | –0.0182 | |
| Giant stars | |||||||||
| [0.34–1.80] | 83 | 229 | 0.5403 | 0.4318 | –0.0085 | –0.0217 | –0.0032 | 0.0040 | |
| [0.13–1.00] | 106 | 218 | 0.5156 | 1.3488 | –0.6976 | –0.0105 | –0.0020 | –0.0181 | |
| [0.21–0.84] | 86 | 190 | 0.5056 | 0.8788 | 0.0107 | 0.0216 | 0.0023 | –0.0030 | |
| [0.69–3.98] | 52 | 233 | 0.5670 | 0.1829 | –0.0004 | 0.0030 | –0.0009 | –0.0034 | |
| [0.35–2.26] | 64 | 235 | 0.5764 | 0.3601 | –0.0237 | 0.0350 | 0.0000 | –0.0245 | |
| [0.56–3.06] | 66 | 230 | 0.5444 | 0.2747 | –0.0118 | 0.0387 | 0.0024 | –0.0117 |
References
- Gaia Collaboration, Prusti et al. (2016) Gaia Collaboration, Prusti, T., de Bruijne, J. H. J., et al. 2016, A&A, 595, A1
- Gaia Collaboration, Babusiaux et al. (2018) Gaia Collaboration, Babusiaux, C., van Leeuwen, F., et al. 2018, A&A, 616, A10
- Gaia Collaboration, Brown et al. (2018) Gaia Collaboration, Evans, D.W., Rielllo, M., et al. 2018, A&A, 616, A4
- Gaia Collaboration, Evans et al. (2018) Gaia Collaboration, Brown, A. G. A., Vallenari, A., et al. 2018, A&A, 616, A1
- González Hernández & Bonifacio (2009) González Hernández, J. I., & Bonifacio, P. 2009, A&A, 497, 497
- McCall (2004) McCall, M. L. 2004, AJ, 128, 2144
- Mucciarelli & Bonifacio (2020) Mucciarelli, A., & Bonifacio, P. 2020, arXiv e-prints, arXiv:2003.07390
- Skrutskie et al. (2006) Skrutskie, M. F., Cutri, R. M., Stiening, R., et al. 2006, AJ, 131, 1163