Giant star-forming clumps?
Abstract
With the spatial resolution of the Atacama Large Millimetre Array (ALMA), dusty galaxies in the distant Universe typically appear as single, compact blobs of dust emission, with a median half-light radius, kpc. Occasionally, strong gravitational lensing by foreground galaxies or galaxy clusters has probed spatial scales 1–2 orders of magnitude smaller, often revealing late-stage mergers, sometimes with tantalising hints of sub-structure. One lensed galaxy in particular, the Cosmic Eyelash at , has been cited extensively as an example of where the interstellar medium exhibits obvious, pronounced clumps, on a spatial scale of pc. Seven orders of magnitude more luminous than giant molecular clouds in the local Universe, these features are presented as circumstantial evidence that the blue clumps observed in many –3 galaxies are important sites of ongoing star formation, with significant masses of gas and stars. Here, we present data from ALMA which reveal that the dust continuum of the Cosmic Eyelash is in fact smooth and can be reproduced using two Sérsic profiles with effective radii, 1.2 and 4.4 kpc, with no evidence of significant star-forming clumps down to a spatial scale of pc and a star-formation rate of M⊙ yr-1.
keywords:
galaxies: high-redshift — galaxies: starburst — submillimetre: galaxies — infrared: galaxies — galaxies: structure1 Introduction
Interferometric submillimetre (submm) observations of distant, dusty, star-forming galaxies (DSFGs, sometimes known as submm-selected galaxies – SMGs) — intense starbursts with star-formation rates (SFRs) in excess of 100 M⊙ yr-1 — have revealed a consistent morphological picture. Ignoring multiplicity and signatures associated with galaxy interactions and mergers, of which there are many examples, the thermal continuum emission from each is usually dominated by a single, compact blob of dust – expected to be largely co-spatial with the molecular gas – with a median half-light radius, 0.2–0.3 arcsec or kpc (Ikarashi et al., 2015, 2017; Simpson et al., 2015; Hodge et al., 2016; Oteo et al., 2016, 2017a; Rujopakarn et al., 2016; Gullberg et al., 2018; Rujopakarn et al., 2019; Ma et al., 2019).
In a handful of cases it has been possible to probe spatial scales nearly an order of magnitude smaller, pc or milliarcsec (mas), using the longest available baselines, aided in one case by a bright, compact, in-beam calibrator (Oteo et al., 2017b). The findings are consistent – compact blobs of dust emission, occasionally multiple blobs suggestive of mid-stage mergers (Iono et al., 2016; Tadaki et al., 2018). There have been glimpses of sub-structure, interpreted by some as potential evidence for spiral arms, bars and rings caused by tidal disturbances (Hodge et al., 2019), though some simulations and alternative analyses suggest we should be cautious of their reality, or that they may instead be evidence of mergers at a later stage (Hodge et al., 2016; Rujopakarn et al., 2019).
Strong gravitational lensing by foreground galaxies or galaxy clusters allows us to probe spatial scales an order of magnitude smaller still, at least in theory. The first of the three most celebrated cases is that of H-ATLAS J090311.6003906, or SDP.81, which lies at and is amplified by a single foreground galaxy (, Dye et al. 2015; Rybak et al. 2015a, possibly with a -M⊙ dark-matter sub-halo – Hezaveh et al. 2016). Dye et al. (2015) and Rybak et al. (2015b) found evidence of a galaxy interaction (as with most bright SMGs — Engel et al., 2010), in this case a late-stage merger between a rotating disk of dusty gas and a neighbouring galaxy seen only in the near-infrared (rest-frame optical). Intriguingly, there is evidence that the disk is fragmenting, since Swinbank et al. (2015) identify up to five submm-emitting dust clumps, several of which can be seen at multiple frequencies, on approximately the scale of the synthesised beam ( mas, or pc), which supports more ambiguous evidence111Due to the possibility of excitation effects, or the patchy destruction of CO by cosmic rays (e.g. Bisbas et al., 2017). from maps of CO(5–4) and CO(8–7) that the gas distribution is clumpy.
Even more robust, though difficult to visualise because of the extreme gravitational amplification that gives rise to its name, are the dozen or more molecular clouds uncovered by recent 0.2-arcsec FWHM imaging in CO(4–3) of the Cosmic Snake, at , by Dessauges-Zavadsky et al. (2019). Each of these clouds is at least an order of magnitude more massive and turbulent than those in the Milky Way today, and there is a substantial spatial disconnect between the gas and the twenty clumps seen in Hubble Space Telescope imaging (Cava et al., 2018) which Dessauges-Zavadsky et al. had expected to detect in CO.
Cited extensively as the definitive example of where the interstellar medium (ISM) exhibits dusty star-forming clumps is the case of SMM J213520102, or the Cosmic Eyelash, named due to its shape and its proximity to the Cosmic Eye (Smail et al., 2007; Swinbank et al., 2010). The Cosmic Eyelash lies behind the galaxy cluster, MACS J213501, which amplifies it gravitationally by a factor, . With its spectral energy distribution (SED) peaking at m at a flux density, mJy (Ivison et al., 2010) — so typical intrinsically of an SMG close to the confusion limit for a 10–15-m single dish — and with an SED that has proved invaluable for FIR/submm photometric redshift estimation (e.g. González-Nuevo et al., 2019), it was the first SMG sufficiently bright to allow a blind redshift to be obtained, . This was determined by Swinbank et al. (2010) via detection of CO –0 using the Green Bank Telescope, a few months ahead of the blind detection of CO –2 and –4 from SMM J14009+0252 by Weiß et al. (2009). The Cosmic Eyelash was also sufficiently bright to allow FIR spectroscopy with the Herschel SPIRE FTS (George et al., 2014; Zhang et al., 2018a). Early interferometric follow-up by Swinbank et al. (2010), using the eight-element Submillimeter Array (SMA) in its most extended (VEX) configuration, provided evidence of at least five and as many as eight bright, compact, dusty clumps. The most tempting lensing configuration suggested four on each side of a caustic, each with an intrinsic spatial scale of pc, where the morphology of the molecular gas seen in later imaging by Swinbank et al. (2011) was described as‘broadly aligned’ with the continuum clumps.
More than any other submm data, the discovery of these dust clumps in the Cosmic Eyelash has been cited (even quite recently – Guo et al., 2018; Meng & Gnedin, 2019) as circumstantial evidence that the giant (–1 kpc) off-centre clumps — typically found in broadband rest-frame ultraviolet (UV)–optical images of –3 galaxies (e.g. Cowie et al., 1995; Conselice et al., 2004; Elmegreen & Elmegreen, 2005; Elmegreen et al., 2008, 2013; Genzel et al., 2011), and especially in IR-luminous galaxies (Calabrò et al., 2019) — are important sites of star formation, albeit perhaps short lived (Genel et al., 2012; Kruijssen et al., 2019; Chevance et al., 2019, cf. Bournaud et al. 2014). Bright in H (Livermore et al., 2012, 2015), these blue clumps are thought to harbour significant star formation222One might ask why, since with adequate spatial resolution we generally find a disconnect between active star formation and blue light, and would anyway expect the dusty gas to be expelled rapidly, post-starburst, such that the ratio of UV to submm clumps may reflect the lifetimes for each phase. (though less than 10 per cent of the galaxy total – Guo et al. 2018) as well as significant quantities of stars ( M⊙ – Guo et al., 2012, 2015, 2018; Dessauges-Zavadsky et al., 2017; Dessauges-Zavadsky & Adamo, 2018, cf. Wuyts et al. 2012; Cava et al. 2018; Zanella et al. 2019; Larson et al. 2020) and any residual molecular gas from which those stars formed. On the other hand, simulations in UV and H light (e.g. Tamburello et al., 2017; Meng & Gnedin, 2019) and some data at longer wavelengths — less susceptible to the pernicious effects of dust — suggest that some of the best-known examples of star-forming clumps may have masses and sizes that have been over-estimated and are likely rather insignificant, plausibly even the result of patchy dust obscuration, e.g. UDF11 in Rujopakarn et al. (2016) and UDF6462 in Cibinel et al. (2017).
In this paper we present new observations obtained using the Atacama Large Millimetre/Submillimetre Array (ALMA) which reveal that around 99 per cent of the dust continuum emission from the Cosmic Eyelash is in fact distributed smoothly. This paper is organised as follows: §2 describes the observations and data reduction, and §3 presents the fundamental result. In §4 we discuss our lens modelling of the observed images. We summarise and draw conclusions in §5. Throughout, we adopt the Chabrier (2003) initial mass function and a standard -CDM cosmology with , and km s-1 Mpc-1, where 1 arcsec at corresponds to 8.2 kpc.
2 Observations and data reduction
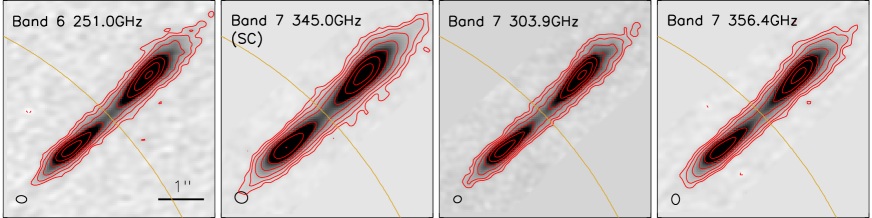
The Cosmic Eyelash has been observed several times with ALMA, predominantly in bands 6 and 7. From these, we have selected a subset with good sensitivity (Jy beam-1) and angular resolution ( arcsec). Although mostly designed to observe various molecular transitions, these data contain a significant fraction of line-free channels that allow sensitive continuum maps to be made. One project used ALMA’s maximum-bandwidth ( GHz) ‘single-continuum’ (SC) mode and — although a little less sensitive than the others, due to less observing time — contains both an extended and compact configuration and is thus particularly sensitive to low-brightness extended emission. All observations were conducted in dual-polarisation mode with low-spectral-resolution time-division mode (TDM) spectral windows, i.e. with 2 GHz of usable bandwidth. See Table 1 for a summary of the band-6 and -7 ALMA observations considered for our study.
Data reduction was carried out using the Common Astronomy Software Application package, with calibration performed using the ALMA Science Pipeline. Contamination from molecular lines was identified by combining all baselines to produce a spectrum, with affected channel ranges then flagged. Imaging was performed subsequently, using tclean with a Briggs weighting scheme (robust ). Self-calibration was used (first in phase, then in amplitude and phase) to produce the final continuum maps. Each configuration of the 2012.1.01029.S data was mapped and self-calibrated separately. Additional self-calibration of the combined datasets was necessary to correct for small errors in the relative astrometry and flux-density scales.
The most sensitive map was obtained from the band-6 data (rest-frame 360 m, where we probe emission from cold dust), published previously as part of a survey of luminous, dusty galaxies in the CH+ line (Falgarone et al., 2017). The r.m.s. noise level was Jy beam-1 and the synthesised beam measured arcsec2 (FWHM), with the major axis at a position angle (PA, measured East of North) of .
In band 7, the map with the best sensitivity and highest angular resolution was that produced from the 2012.1.00175.S data, intended originally to trace OH+ and H2O (average frequency, 303.9 GHz; rest-frame 300 m). A continuum map of these data has already been published by Indriolo et al. (2018) but our map has a significantly higher dynamic range and a sensitivity of Jy beam-1. The synthesised beam was somewhat smaller than that of the band-6 map, arcsec2 at PA = . A second dataset from the same project, targeting H2O at a higher frequency, 356.4 GHz, produced a similar map, though not quite as sensitive. The synthesised beam of the band-7 pure-continuum map was competitive with the other maps, arcsec2, PA = , with a sensitivity of Jy beam-1.
| ALMA | Detected | (b) | /Jy | Beam (d) |
|---|---|---|---|---|
| project | species (a) | /GHz | beam-1 (c) | /mas2 |
| 2012.1.00175.S | OH+, H2O | 303.9 | 27 | |
| 2012.1.00175.S | H2O | 356.4 | 48 | |
| 2012.1.01029.S | SC | 345.0 | 60 | |
| 2016.1.00282.S | CH+ | 251.0 | 21 |
Notes: (a) SC refers to a ‘single-continuum’ set up; (b) average frequency, after flagging of line-contaminated channels; (c) continuum sensitivity; (d) synthesised beam size, FWHM; (e) for the average magnifications across the Cosmic Eyelash, this corresponds to linear scales along the major and minor axes of 130 and 820 pc in the source plane, respectively.
3 Results
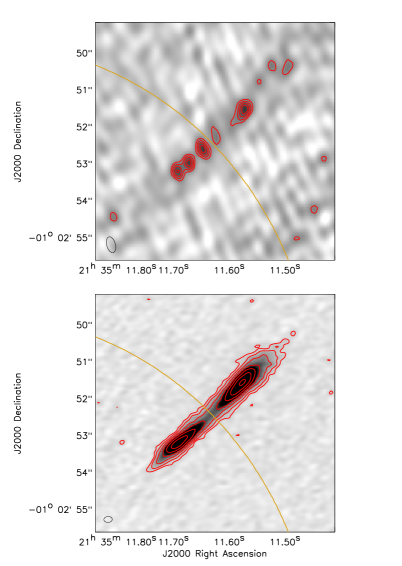
We quickly and simply illustrate the purpose of this paper in Fig. 1, which shows the SMA image333The SMA 345-GHz (rest-frame 260 m) image of Swinbank et al. (2010) had an r.m.s. noise level of 2.1 mJy beam-1 ( arcsec2, PA = ). of Swinbank et al. (2010) alongside our deep ALMA band-6 continuum image. The ALMA image is deeper than the SMA image, even after accounting for the drop in observed dust emission between 345 and 251 GHz. In all important respects the ALMA band-6 image has the same morphological characteristics as our band-7 imaging (see Fig. 2), which is more than deeper than the SMA image, with a smaller and more symmetric synthesised beam. On the scales probed here, roughly 200 mas in the image plane, the dust continuum emission from the Cosmic Eyelash is remarkably smooth, not clumpy.
Spatially resolved analysis performed at the positions of the clumps identified by Swinbank et al. (2010), which we have shown here to be spurious, e.g. the work presented by Swinbank et al. (2011); Danielson et al. (2011, 2013) and Thomson et al. (2015), must be viewed in this context. The clumpy structure presented by Swinbank et al. (2010) is believed to have been generated by applying the clean algorithm to noisy long-baseline SMA data, amplifying features with low signal-to-noise ratios (SNRs), where the remarkable symmetry of the resulting structure about the likely caustic lent credibility to a clumpy morphology that we show here to be spurious. Similarities between the molecular gas morphology presented by Swinbank et al. (2011) and the spurious continuum clumps was the result of low SNR, as illustrated by the simulations of Hodge et al. (2016), which showed that high-resolution low-SNR interferometric observations yield a clumpy distribution when there are no clumps. Faced with such data, the lesson here is that an analysis like that of Hodge et al. should always be undertaken, to gauge the reality of the clumps.
4 Lens modeling
We have produced an updated version of the parametric mass model of the MACS J213501 cluster core described in Swinbank et al. (2010) using lenstool444https://projets.lam.fr/projects/lenstool/wiki (Jullo & Kneib, 2009). We take the centroids of the ALMA image pair in Figs 1–2 as constraints.
We have used this lensing model to derive a parametric model of the source morphology at the origin of the continuum emission. We took a forward-model approach, assuming a Sérsic profile for the source, convolving by the ALMA beam and re-gridding to the same pixel grid in the image plane. The source parameters (centroid, PA, axis ratio and FWHM) were optimised while keeping the mass model fixed. Because of a small mis-match in the lens model,555With our parametric model for the cluster- and galaxy-scale mass components, the two images are reproduced with a small ( arcsec) offset, such that sending both images back to the source plane yields a small mis-match in position. to reproduce both images simultaneously we performed the fit on each image independently, using the variations in the recovered parameters as an estimate of systematic errors due to the lens model.
The best source parameters with a single Sérsic profile reproduced the observed configurations well, with significant () residuals near the core of each image, symmetrical about the critical line. Adopting a more complex parameterised source, as is becoming routine with high-fidelity ALMA data (e.g. Rujopakarn et al., 2019) — this time comprising two independent Sérsic profiles, as might be expected for a merger-induced dusty starburst (Engel et al., 2010) or for a star-forming disk with a central starburst — the resulting best-fit source parameters gave two components lying very close in central position (within 0.01 arcsec or pc in the source plane), but having large differences in Sérsic index and effective radii. The first one was rather extended ( kpc) while the second one was brighter and more compact ( kpc), with a small Sérsic index in both cases (, so at the low end of the range found by Hodge et al., 2016, but consistent, as are the effective radii). Table 2 shows the best-fit parameters for each component.
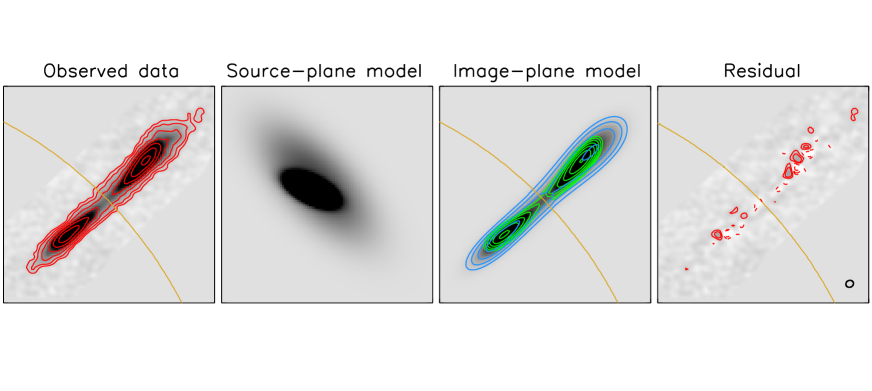
Fig. 3 presents our best ALMA continuum image of the Cosmic Eyelash (Band 7, 303.9 GHz) alongside the respective best-fit source- and image-plane models, and residuals for the two-component Sérsic fit, where the observed map and the model are plotted with the same linear scaling (from zero to the peak observed flux density) as the residuals.
We found no mirrored sub-structure in the residual map and a brightest peak of 260 Jy, roughly above the noise; the deepest negative peaks reach 360 Jy which suggests — along with the lack of mirroring — that the sub-structure we see is not real. We followed the approach of Walter et al. (2016) to assess the fidelity of the residual peaks as a function of SNR, albeit needing to adopt large SNR bins, searching for both positive and negative peaks. We found no reliable candidates, even at : the fidelity of the brightest peaks was never better than 50 per cent. The residual peaks are all approximately consistent with the size of the synthesised beam, i.e. they are unresolved down to pc in the source plane666Magnification varies spatially across the image plane, ranging from 3– along the major axis (mean, ), and along the minor axis. along the major axis. If we scale the maximum positive residual, which is magnified by roughly and along the major and minor axes, to the well-sampled SED of the Cosmic Eyelash, we find that its rest-frame 8–1000-m luminosity cannot exceed L⊙. Adopting the traditional conversion from to SFR (e.g. Kennicutt & Evans, 2012) — noting that recent evidence for a top-heavy stellar initial mass function in starbursts (Zhang et al., 2018b; Schneider et al., 2018; Motte et al., 2018, cf. Romano et al. 2019) would reduce these SFR limits significantly — then corresponds to a maximum ‘clump SFR’ of 2.6 M⊙ yr-1, around 1 per cent of the total for the Cosmic Eyelash, at the low end of the range of SFRs reported for clumps in star-forming galaxies at –3 (e.g. Zanella et al., 2019) and consistent with the values reported via H observations of strongly lensed galaxies at (Livermore et al., 2012, 2015). Adopting the extreme starburst SED of Arp 220, our limit moves higher.
| Axis | PA | Total flux | Sérsicn | |
|---|---|---|---|---|
| /kpc | ratio | /deg | /mJy | |
| 0.46 | ||||
| 0.44 |
5 Summary
We present sensitive, high-spatial-resolution ALMA continuum imaging of the Cosmic Eyelash, at , which has been cited extensively as an example of where the interstellar medium exhibits obvious, pronounced clumps, with spatial scales of pc, and where these clumps are cited regularly as circumstantial evidence that the blue clumps observed in UV–optical images of many –3 galaxies are important sites of ongoing star formation, with significant masses of stars and gas.
Our images reveal that the dust continuum emission from the Cosmic Eyelash is smoothly distributed and can be reproduced using two coincident Sérsic profiles with effective radii, 1.2 and 4.4 kpc, with no evidence of significant star-forming clumps down to a spatial scale of pc, with rest-frame 8–1000-m luminosities below L⊙ and individual SFRs no higher than 1 per cent of the total, so M⊙ yr-1.
Acknowledgements
Sincere thanks to the anonymous referee whose suggestions improved this paper significantly. JR acknowledges support from the ERC Starting Grant 336736-CALENDS. Funded by the Deutsche Forschungsgemeinschaft (DFG, German Research Foundation) under Germany’s Excellence Strategy – EXC-2094 – 390783311.
ALMA is a partnership of ESO (representing its member states),
NSF (USA) and NINS (Japan), together with NRC (Canada), MOST and
ASIAA (Taiwan), and KASI (Republic of Korea), in cooperation with
the Republic of Chile. The Joint ALMA Observatory is operated by
ESO, AUI/NRAO and NAOJ. This paper relies on ALMA data from projects:
ADS/JAO.ALMA#2012.1.00175.S, ADS/JAO.ALMA#2012.1.01029.S,
ADS/JAO.ALMA#2013.1.00164.S, ADS/JAO.ALMA#2016.1.00282.S.
References
- Bisbas et al. (2017) Bisbas T. G., van Dishoeck E. F., Papadopoulos P. P., Szűcs L., Bialy S., Zhang Z.-Y., 2017, ApJ, 839, 90
- Bournaud et al. (2014) Bournaud F., et al., 2014, ApJ, 780, 57
- Calabrò et al. (2019) Calabrò A., et al., 2019, A&A, 632, A98
- Cava et al. (2018) Cava A., Schaerer D., Richard J., Pérez-González P. G., Dessauges-Zavadsky M., Mayer L., Tamburello V., 2018, Nature Astronomy, 2, 76
- Chabrier (2003) Chabrier G., 2003, PASP, 115, 763
- Chevance et al. (2019) Chevance M., et al., 2019, MNRAS, p. 3155
- Cibinel et al. (2017) Cibinel A., et al., 2017, MNRAS, 469, 4683
- Conselice et al. (2004) Conselice C. J., et al., 2004, ApJ, 600, L139
- Cowie et al. (1995) Cowie L. L., Hu E. M., Songaila A., 1995, AJ, 110, 1576
- Danielson et al. (2011) Danielson A. L. R., et al., 2011, MNRAS, 410, 1687
- Danielson et al. (2013) Danielson A. L. R., et al., 2013, MNRAS, 436, 2793
- Dessauges-Zavadsky & Adamo (2018) Dessauges-Zavadsky M., Adamo A., 2018, MNRAS, 479, L118
- Dessauges-Zavadsky et al. (2017) Dessauges-Zavadsky M., Schaerer D., Cava A., Mayer L., Tamburello V., 2017, ApJ, 836, L22
- Dessauges-Zavadsky et al. (2019) Dessauges-Zavadsky M., et al., 2019, Nature Astronomy, p. 436
- Dye et al. (2015) Dye S., et al., 2015, MNRAS, 452, 2258
- Elmegreen & Elmegreen (2005) Elmegreen B. G., Elmegreen D. M., 2005, ApJ, 627, 632
- Elmegreen et al. (2008) Elmegreen B. G., Bournaud F., Elmegreen D. M., 2008, ApJ, 688, 67
- Elmegreen et al. (2013) Elmegreen B. G., Elmegreen D. M., Sánchez Almeida J., Muñoz-Tuñón C., Dewberry J., Putko J., Teich Y., Popinchalk M., 2013, ApJ, 774, 86
- Engel et al. (2010) Engel H., et al., 2010, ApJ, 724, 233
- Falgarone et al. (2017) Falgarone E., et al., 2017, Nature, 548, 430
- Genel et al. (2012) Genel S., et al., 2012, ApJ, 745, 11
- Genzel et al. (2011) Genzel R., et al., 2011, ApJ, 733, 101
- George et al. (2014) George R. D., et al., 2014, MNRAS, 442, 1877
- González-Nuevo et al. (2019) González-Nuevo J., et al., 2019, A&A, 627, A31
- Gullberg et al. (2018) Gullberg B., et al., 2018, ApJ, 859, 12
- Guo et al. (2012) Guo Y., Giavalisco M., Ferguson H. C., Cassata P., Koekemoer A. M., 2012, ApJ, 757, 120
- Guo et al. (2015) Guo Y., et al., 2015, ApJ, 800, 39
- Guo et al. (2018) Guo Y., et al., 2018, ApJ, 853, 108
- Hezaveh et al. (2016) Hezaveh Y. D., et al., 2016, ApJ, 823, 37
- Hodge et al. (2016) Hodge J. A., et al., 2016, ApJ, 833, 103
- Hodge et al. (2019) Hodge J. A., et al., 2019, ApJ, 876, 130
- Ikarashi et al. (2015) Ikarashi S., et al., 2015, ApJ, 810, 133
- Ikarashi et al. (2017) Ikarashi S., et al., 2017, ApJ, 849, L36
- Indriolo et al. (2018) Indriolo N., Bergin E. A., Falgarone E., Godard B., Zwaan M. A., Neufeld D. A., Wolfire M. G., 2018, ApJ, 865, 127
- Iono et al. (2016) Iono D., et al., 2016, ApJ, 829, L10
- Ivison et al. (2010) Ivison R. J., et al., 2010, A&A, 518, L35+
- Jullo & Kneib (2009) Jullo E., Kneib J.-P., 2009, MNRAS, 395, 1319
- Kennicutt & Evans (2012) Kennicutt R. C., Evans N. J., 2012, ARA&A, 50, 531
- Kruijssen et al. (2019) Kruijssen J. M. D., et al., 2019, Nature, 569, 519
- Larson et al. (2020) Larson K. L., et al., 2020, ApJ, 888, 92
- Livermore et al. (2012) Livermore R. C., et al., 2012, MNRAS, 427, 688
- Livermore et al. (2015) Livermore R. C., et al., 2015, MNRAS, 450, 1812
- Ma et al. (2019) Ma J., et al., 2019, ApJS, 244, 30
- Meng & Gnedin (2019) Meng X., Gnedin O. Y., 2019, arXiv e-prints, p. arXiv:1910.03443
- Motte et al. (2018) Motte F., et al., 2018, Nature Astronomy, 2, 478
- Oteo et al. (2016) Oteo I., et al., 2016, ApJ, 827, 34
- Oteo et al. (2017a) Oteo I., et al., 2017a, preprint, (arXiv:1709.04191)
- Oteo et al. (2017b) Oteo I., Zwaan M. A., Ivison R. J., Smail I., Biggs A. D., 2017b, ApJ, 837, 182
- Romano et al. (2019) Romano D., Matteucci F., Zhang Z.-Y., Ivison R. J., Ventura P., 2019, MNRAS, 490, 2838
- Rujopakarn et al. (2016) Rujopakarn W., et al., 2016, ApJ, 833, 12
- Rujopakarn et al. (2019) Rujopakarn W., et al., 2019, ApJ, 882, 107
- Rybak et al. (2015a) Rybak M., McKean J. P., Vegetti S., Andreani P., White S. D. M., 2015a, MNRAS, 451, L40
- Rybak et al. (2015b) Rybak M., Vegetti S., McKean J. P., Andreani P., White S. D. M., 2015b, MNRAS, 453, L26
- Schneider et al. (2018) Schneider F. R. N., et al., 2018, Science, 359, 69
- Simpson et al. (2015) Simpson J. M., et al., 2015, ApJ, 799, 81
- Smail et al. (2007) Smail I., et al., 2007, ApJ, 654, L33
- Swinbank et al. (2010) Swinbank A. M., et al., 2010, Nature, 464, 733
- Swinbank et al. (2011) Swinbank A. M., et al., 2011, ApJ, 742, 11
- Swinbank et al. (2015) Swinbank A. M., et al., 2015, ApJ, 806, L17
- Tadaki et al. (2018) Tadaki K., et al., 2018, Nature, 560, 613
- Tamburello et al. (2017) Tamburello V., Rahmati A., Mayer L., Cava A., Dessauges-Zavadsky M., Schaerer D., 2017, MNRAS, 468, 4792
- Thomson et al. (2015) Thomson A. P., Ivison R. J., Owen F. N., Danielson A. L. R., Swinbank A. M., Smail I., 2015, MNRAS, 448, 1874
- Walter et al. (2016) Walter F., et al., 2016, ApJ, 833, 67
- Weiß et al. (2009) Weiß A., et al., 2009, ApJ, 707, 1201
- Wuyts et al. (2012) Wuyts S., et al., 2012, ApJ, 753, 114
- Zanella et al. (2019) Zanella A., et al., 2019, MNRAS, 489, 2792
- Zhang et al. (2018a) Zhang Z.-Y., et al., 2018a, MNRAS, 481, 59
- Zhang et al. (2018b) Zhang Z.-Y., Romano D., Ivison R. J., Papadopoulos P. P., Matteucci F., 2018b, Nature, 558, 260