EUCLIA. II. On the puzzling large UV to X-ray lags in Seyfert galaxies
Abstract
Recent intense X-ray and UV monitoring campaigns with Swift have detected clear UV lags behind X-ray in several local active galactic nuclei (AGNs). The UV to X-ray lags are often larger (by a factor up to 20) than expected if the UV variation is simply due to the X-ray reprocessing. We previously developed a model in which the UV/optical variations are attributed to disk turbulences, and the effect of large-scale turbulence is considered. Our model, which overcomes many severe challenges to the reprocessing scheme, can well explain the observed variations in NGC 5548, particularly the correlations and lags among the UV/optical bands. In this work, assuming the corona heating is associated with turbulences in the inner accretion disk, we extend our study to model the correlations and lags between the X-ray and UV/optical bands. We find that our model, without the need of light echoing, can well reproduce the observed UV to X-ray lags and the optical to UV lags simultaneously in four local Seyfert galaxies, including NGC 4151, NGC 4395, NGC 4593, and NGC 5548. In our scenario, relatively larger UV to X-ray lag is expected for AGN with smaller innermost disk radius and thus more compact corona. Interestingly, for these Seyfert galaxies studied in this work, sources with relatively larger UV to X-ray lags do have broader Fe K lines, indicative of relativistic broadening due to more compact corona and smaller innermost disk radius. If confirmed with more X-ray and UV monitoring campaigns, this interesting discovery would provide a new probe to the inner disk/corona.
1 Introduction
Since unveiled by Lynden-Bell (1969), the central engine of active galactic nuclei (AGNs) has been understood through an accreting supermassive black hole (BH), surrounded by an optically thick, geometrically thin accretion disk (Shakura & Sunyaev, 1973), threaded by strong magnetic fields to form a hot corona (Galeev et al., 1979; Haardt & Maraschi, 1991). The so-called “big blue bump” in the UV/optical is thought to be the thermal emission from the thin accretion disk, while the X-ray emission comes from the hot corona above inner regions of the thin disk.
If the central X-ray emission illuminates the thin disk, it would be absorbed/reflected by the disk, and the absorbed X-ray emission would then be reprocessed and, speculatively, re-emitted thermally. Furthermore, if the UV/optical variation is dominantly driven by the X-ray variation, as assumed in the conventional lamppost reprocessing model (e.g., Krolik et al., 1991), the implied UV/optical lag–wavelength relation is qualitatively consistent with that observed (e.g., Fausnaugh et al., 2016; Starkey et al., 2017). However, the reprocessing scenario has been challenged in many aspects (cf. Zhu et al., 2018; Cai et al., 2018, and references therein), including the deficit of energy budget (e.g., Edelson et al., 1996; Gaskell et al., 2007) and the timescale-dependent color variation (Sun et al., 2014; Zhu et al., 2016, 2018; Cai et al., 2019).
A new challenge against the reprocessing scenario has recently emerged thanks to the unique capability of the Swift satellite, capable of quasi-simultaneously monitoring the X-ray and the UV/optical. For several local Seyfert galaxies, such as NGC 4151 (Edelson et al., 2017) and NGC 4593 (McHardy et al., 2018), the observed UV to X-ray lags111Throughout, a positive UV to X-ray lag means the UV variation lags behind the X-ray variation. are too large to be afforded by the reprocessing scenario. To account for these large lags, either an additional extreme-UV reprocessor, delaying the X-ray heating onto the outer disk (Gardner & Done, 2017), or a strong contamination by the diffuse large-scale emissions from the broad line region (Korista & Goad, 2001; McHardy et al., 2018; Cackett et al., 2018; Chelouche et al., 2018; Korista & Goad, 2019; Mahmoud & Done, 2019) have been proposed, both demanding significant modification to the standard thin disk scheme.
Persisting in the classic thin disk diagram, we previously developed a model, exploring the UV/optical continuum lag in AGNs (EUCLIA), in which the UV/optical variations are attributed to disk turbulences, but not the light echoing (Cai et al., 2018). Our model, which overcomes many severe challenges to the reprocessing scheme, can well explain the observed variations in NGC 5548, particularly correlations, lags, and the timescale-dependent color variations among the UV/optical bands. Owing to quicker regression capability of local fluctuations at smaller radii when responding to the large-scale turbulence, the emission of longer wavelength coming from the outer disk regions would lag that of the shorter wavelength from the inner disk regions.
Assuming the corona heating is also associated with turbulences in the inner accretion disk (e.g., Kang et al., 2018), in this work, we extend our study to model the variation of coronal X-ray emission as laid out in Section 2. In Section 4, we find that our model, without the need of light echoing, can well reproduce the observed UV to X-ray lags in four local Seyfert galaxies, covering a broad range of BH mass introduced in Section 3. In our scenario, a relatively larger UV to X-ray lag is expected for AGN with a smaller innermost accretion disk radius and thus more compact corona. Interestingly, as discussed in Section 5, for these Seyfert galaxies studied in this work, sources with relatively larger UV to X-ray lags do have more relativistically broadened Fe K lines, indicative of more compact corona and smaller innermost disk radius. Finally, conclusions are presented in Section 6.
2 Model ingredients
Following Cai et al. (2016) we have split the cold thin disk into square-like zones in and directions from an inner edge, , to a large enough outer one, , where is the spin-dependent innermost stable circular orbit (ISCO) radius, is the number of layers, is the radial boundary ratio of each layer, and is the gravitational radius. We assume the Novikov-Thorne relativistic effective temperature profile, , as a function of radius, , for BH mass , accretion rate (or Eddington ratio222Here, and , where and is the bolometric and Eddington luminosities, respectively, and is a spin-dependent efficiency (e.g., for ; for ). ), and BH spin (Novikov & Thorne, 1973).
Stimulated by the independently fluctuating inhomogeneous disk model of Dexter & Agol (2011), Cai et al. (2016) propose that a revised inhomogeneous disk model can well reproduce the timescale-dependent color variation if the characteristic timescale of thermal fluctuation in the disk is radius-dependent. In this upgraded model, the local temperature fluctuates around the mean, , and its fluctuation possibly driven by magnetic turbulence is described by the first-order continuous autoregressive process (Kelly et al., 2009) with a radius-dependent damping timescale of and a radius-independent long-term variance of , or, equivalently, a short-term variance of .
Furthermore, to account for the correlations and lags among the UV/optical continua, Cai et al. (2018) propose that the local temperature fluctuation is coupled with a common large-scale fluctuation as a net effect of many distinct outward/inward propagations. This common large-scale fluctuation is depicted with a short-term variation amplitude, , complementing with a radius-independent smoothing timescale, , where is the relative contribution between large-scale and local fluctuations at (cf. Cai et al. 2018 for details).
In Cai et al. (2018), we have explored those aforementioned parameters, namely day, , dex, , , and day, for NGC 5548 with . In this work, considering four sources with different BH masses, we have assumed in our baseline model that both the damping and smoothing timescales are simply scaling with as day and day, respectively, while the remaining parameters are mass-independent. We have adopted the same parameters as those previously explored for NGC 5548, except and , since we find that the correlations and lags between the X-ray and UV/optical bands for the four sources can be quite well simultaneously modeled using dex and (see Section 4).
To approximate the radiative transfer through the disk atmosphere, the cold thin disk emission is assumed to be a color-temperature corrected blackbody, i.e., , where is the photon frequency, is the blackbody radiation intensity, and is the color-temperature correction following Done et al. (2012).
A major improvement of this work is introducing a classical treatment of X-ray emission for the hot corona, located above the inner cold disk region from to 333 Below , the accretion flow becomes radiatively inefficient since most of the power may be released via winds/jets (Yuan & Narayan, 2014; Hall et al., 2018; Sun et al., 2019).. A radius-independent fraction, , of the released energy is assumed to be dissipated to the corona, and then re-emitted as a power law spectrum of , characterized by a photon index, , and high (low) energy cutoff, . The normalization of is then constrained by the energy conservation of each zone and is given by . In this work, without affecting our conclusions, we simply assume , , keV, and keV (Brandt & Alexander, 2015; Molina et al., 2019).
Therefore, if the disk at redshift is viewed with an inclination angle , the flux density observed at per frequency per area is given by
| (1) |
where fluctuating quantities are indicated with a tilde over them, is the luminosity distance, and . We take as a reference.
As illustrated above, a major assumption in the model extension is that, for any individual inner disk zone within – , the X-ray corona emission it contributes has the same variation pattern with the UV/optical emission, i.e., both modulated by an identical local independent fluctuation and the common large-scale fluctuation. This assumption is generally supported by the discovery of Kang et al. (2018) that the corona heating is closely associated with magnetic turbulence (see also, e.g., Liu et al., 2002, from a theoretical point of view). In fact, the essence of the assumption is that, the fluctuation of X-ray emission is similarly modulated by the common large-scale fluctuation (see Cai et al. 2018 for possible mechanisms responsible for the common large-scale fluctuation). An identical local corona and disk fluctuation in each zone is actually not a necessary condition. For example, in a “patch” scheme, we could allow a certain fraction, say , of the individual inner disk zones within – to dissipate 100% of the energy into the corona while others contribute zero. In this way, the modeled local corona fluctuation is totally independent to that of the disk. Such a modification however does not affect any of the analyses in this work. This is because the X-ray emission region barely overlaps with the disk regions that dominate the observed UV/optical emission production, thus their local fluctuations are already independent to each other. Being numerically confirmed, such a modification for this “patch” scheme only results in slightly smaller correlations and subtly larger scatter of lags between the X-ray and UV/optical bands. To weaken the assumption of an identical local corona and disk fluctuation in each zone, we should present our results within this “patch” scheme in the following.
Another key point of the assumption is that the characteristic timescale of the corona fluctuation is the same as that of the underlying disk, i.e., proportional to . This is expected if the corona and the innermost disk fluctuations are both driven by magnetic turbulences.
The illumination of the X-ray emission onto the underlying disk zone could also play a role in yielding coupled variation between the corona and disk emission. However, in the current model we ignore the illumination process (cf. Section 1 and Cai et al. 2018), and leave the modeling of both disk fluctuation and X-ray reprocessing to a future dedicated work. In this work, we focus on whether the fluctuation model alone can explain the observed lags between the X-ray and UV/optical bands for which the reprocessing model failed to account.
2.1 Simulation approach and basic properties of ideal light curves
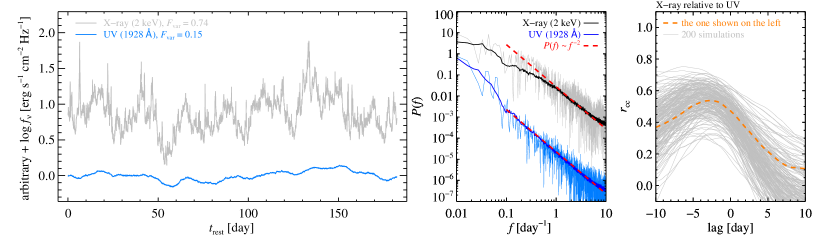
In fine steps of in the rest-frame (see Section 3 and Table 1), we firstly simulate the fluctuating spectral energy distributions (SEDs) from the X-ray to the UV/optical, from which ideal monochromatic light curves are extracted at 40 wavelengths sampled evenly in logarithm from 1 to 1 m, besides two specific wavelengths at 2 keV (a typical X-ray wavelength) and 1928 (the pivot wavelength of the Swift-UVW2 band). Following Equation 2 of Fausnaugh et al. (2016, see also, e.g., ), the fractional root-mean-square variability amplitude is defined by , where is the value of the light curve at epoch , is the mean value of the light curve, and is the total number of epochs. The maximal correlation coefficient, , and the centroid lag averaging correlation coefficients larger than 80% of the maximal one, , are obtained relative to the UV band (1928 ) without detrending, by performing the linearly interpolated cross-correlation analysis (Peterson et al., 1998). Totally, we repeat 200 times of independent simulations.
Figure 1 shows an example of the simulated X-ray and UV light curves, where a clear correlation between them is intuitive. Compared to the UV, larger and more high-frequency power are found in the X-ray, as often seen in AGNs. Averaging 200 simulations, the high-frequency power density spectra for both the UV and the X-ray are similar to that of , but there is a break at low-frequency for the X-ray, qualitatively consistent with that found by Czerny et al. (1999). A more quantitative comparison is deferred to Section 4.2.
The lag of the X-ray relative to the UV is generally negative, indicating the UV variation lags behind the X-ray. Interestingly, the exact amount of the lag may change from one monitoring period to another with the same cadence (see Section 5.2 for further discussion).
2.2 Increasing the UV to X-ray lag with decreasing the inner edge of the cold accretion disk
Comparing the different amount of the UV to X-ray lags between NGC 4151 and NGC 5548, which have similar BH mass, Edelson et al. (2017) propose that an extreme-UV torus could enlarge the UV to X-ray lag for NGC 4151, but speculate that the smaller UV to X-ray lag for NGC 5548 is probably due to the lower single-to-noise ratio of its X-ray data.
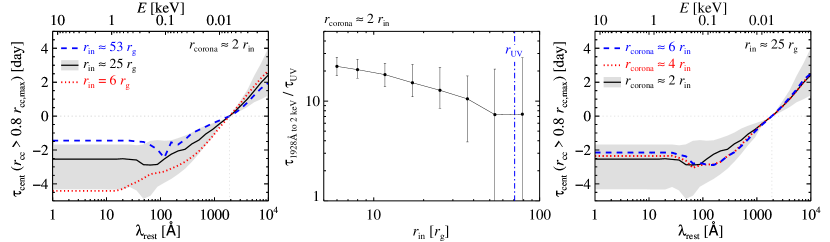
Instead, we physically attribute the amount of the UV to X-ray lag to the different inner edge of the cold accretion disk or the compactness of corona. This point is clearly illustrated in Figure 2. If the inner edge of the cold disk is smaller, the UV to X-ray lag increases. Note that in our model the characteristic timescale of local fluctuation is smaller at smaller radius; the UV to X-ray lag increases with increasing the timescale difference of temperature fluctuations between regions emitting the X-ray and the UV. Therefore, once the disk extends more inward, the more inner disk regions with smaller timescales of temperature fluctuation would be involved in producing the X-ray emission, and then, the UV to X-ray lag would increase with decreasing the inner disk radius.
Conversely, the UV to X-ray lag decreases with increasing the outer edge of the hot corona (cf. the right panel of Figure 2), but the effect is negligible due to weaker X-ray contribution from the outer disk regions. Considering this relative insensitivity of the UV to X-ray lag on , we fix in the following analysis.
Normalized by the UV light-crossing timescale, , where (1928 ) is the flux-weighted UV-emitting radius of the standard thin disk (cf. Equation 10 of Fausnaugh et al., 2016), the middle panel of Figure 2 directly illustrates the UV to X-ray lag in our model could be larger than that of the reprocessing model by a factor of up to , increasing with decreasing . Note that the scatter of the UV to X-ray lag increases with increasing and becomes interestingly large when is comparable to (see Section 5.2 for further discussion).
| Redshift | BH Mass | Eddington | Spin | Inner Most Radius of | Campaign Duration | Median Sampling | Simulated Time | |
|---|---|---|---|---|---|---|---|---|
| Object | Ratio | Cold Disk | [days] | Interval [days] | Step [days] | |||
| (1) | (2) | (3) | (4) | (5) | (6) | (7) | (8) | (9) |
| NGC 4151 | 0.00326 | 40 | 0.02 | 0.98 | 1.61 | 0.22 | 0.02 | |
| NGC 4593 | 0.00834 | 7.5 | 0.08 | 0 | 6 | 0.12 | 0.01 | |
| NGC 5548 | 0.01627 | 50 | 0.05 | 0 | 0.44 | 0.04 | ||
| NGC 4395 | 0.00106 | 0.01 | 0.04 | 0 | 0.0023 | 0.0002 |
Note. — Column 1: The name of object. Column 2: The redshift from the SIMBAD database (http://simbad.u-strasbg.fr/simbad/). Column 3: The BH mass consistent with Bentz & Katz (2015), except NGC 4395 which is from Woo et al. (2019). Column 4: The Eddington ratio consistent with McHardy et al. (2018), except NGC 4395 for which we have re-derived its new Eddington ratio with from McHardy et al. (2018) given the new BH mass. Column 5: Constraint on the BH spin for NGC 4151 is given by Keck et al. (2015), while spins of the other sources without robust constraint are assumed to zero. Column 6: The adopted inner most radius of the cold disk in our baseline model for each source. The value with dagger is the only one parameter subjectively selected according to the observed UV to X-ray lags. Columns 7 and 8: The observed-frame campaign duration and median sampling interval for sources monitored by Swift (NGC 4151: Edelson et al. 2017; NGC 4593: McHardy et al. 2018; NGC 5548: Edelson et al. 2015) and XMM-Newton (NGC 4395: McHardy et al. 2016). Column 9: The rest-frame time step adopted in our simulation, better than the real sampling interval for each source by about a factor of ten.
3 Modeling local Seyfert galaxies
To concisely illustrate that our model is capable of explaining the puzzling large UV to X-ray lags, we focus on four local Seyfert galaxies, discussed by McHardy et al. (2018), i.e., NGC 4151 (Edelson et al., 2017), NGC 4593 (McHardy et al., 2018), NGC 5548 (Edelson et al., 2015; Fausnaugh et al., 2016), and NGC 4395 (Cameron et al., 2012; McHardy et al., 2016), covering a broad range of BH mass and of Eddington ratio. NGC 2617 (Shappee et al., 2014) is currently excluded due to its large error on the derived UV to X-ray lag.
The most relevant quantities for these sources are tabulated in Table 1. The and are consistent with those quoted by McHardy et al. (2018), except NGC 4395 for which we adopt the newest BH mass (Woo et al., 2019) and re-derive the corresponding Eddington ratio.
Measuring the spin of supermassive BH is important but still challenging when using the relativistic X-ray reflection method (e.g., Reynolds, 2014; Kammoun et al., 2018). Although most of these concerned Seyfert galaxies have been extensively studied in X-ray (e.g., Nandra et al., 1997, 2007; Shu et al., 2010; Walton et al., 2013), up to now, only the BH spin of NGC 4151 has been found to be near-maximal (Keck et al., 2015; Beuchert et al., 2017), while ambiguous spins are still assumed in literature for the other sources (e.g., NGC 4593: Ursini et al. 2016b; NGC 5548: Kammoun et al. 2019a; NGC 4395: Kammoun et al. 2019b). Therefore, we assume zero spin for the later three sources. As demonstrated in Section 2.2, the UV to X-ray lag would increase with increasing spin if . However, if is significantly larger than , as respectively discussed for NGC 5548 and NGC 4395 in Sections 4.2 and 4.3, the uncertain spin would have a negligible effect on the UV to X-ray lag.
3.1 Re-estimation of observed cross-correlation properties
We intend to compare our model to observations on both and measured relative to the Swift-UVW2 band, but not all of them were available in literature and values are generally reported without errors. Therefore, we take the observed light curves from literature for these sources (unavailable for NGC 4395) to re-estimate their interband correlations and lags, adopting the linearly interpolated cross-correlation function method444PyCCF: https://ascl.net/code/v/1868 (ICCF; e.g., Gaskell & Peterson, 1987; Peterson et al., 1998, 2004; Sun et al., 2019; Edelson et al., 2019). The Swift-UVW2 band is always taken as reference, relative to which the correlations and lags of the other bands are measured, implemented the “2-way” interpolation (see, e.g., Edelson et al., 2019). Their 1 uncertainties are estimated as the standard deviations of realizations generated using the standard flux randomization/random subset selection method. Note that as discussed in Cai et al. (2018) no detrending has been applied. Our measurements of and are generally consistent with those published when available, and in the following we compare our model with both our own measurements from observations and those found in literature.
3.2 Simulating “real” light curves
In Section 2.1, we have introduced simulating the ideal monochromatic light curves for demonstrating their basic properties implied by our model. Furthermore, to faithfully compare with observations, we convolve our redshifted fluctuating SEDs with the Swift six UVOT transmission curves and the corresponding specific X-ray bandwidths of Swift as reported in the relevant literatures. For NGC 5548, we consider more UV/optical bands following Fausnaugh et al. (2016).
For each source, ideal broad-band light curves are generated with an observed-frame time step of better than, and an appropriate time length of comparable to, those of its real monitoring campaign, respectively (see Table 1). For each band, further taking into account the real sampling and randomly fluctuating fluxes according to the observed photometric error of each epoch, we obtain the mock “real” light curve (cf. Section 3.2 in Cai et al., 2018). Then, the interband cross-correlation properties are similarly derived as described in Section 3.1. Note that the host galaxy contamination has not been added to these “real” light curves, as our analyses of correlation functions are not affect by the constant host emission.
In analog to the simulated ideal monochromatic light curves presented in Section 2.1, we also obtain 200 simulated “real” light curves for each source. To statistically compare with observations on the cross-correlation properties, i.e., and , we present their median, 25-75th, and 10-90th percentile ranges inferred from these simulations.
4 Results
4.1 The puzzling large UV to X-ray lags: NGC 4151 and NGC 4593
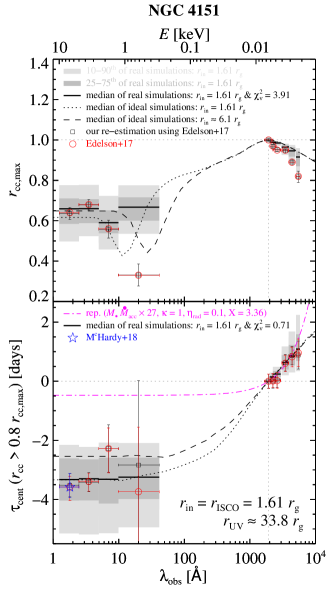
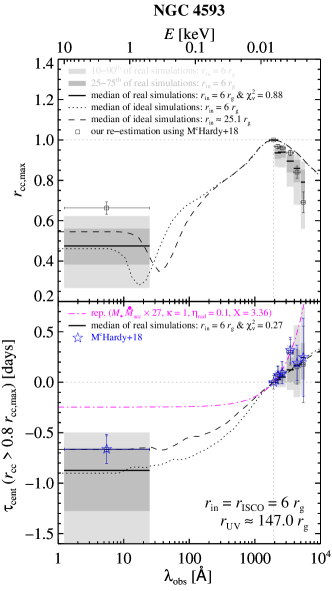
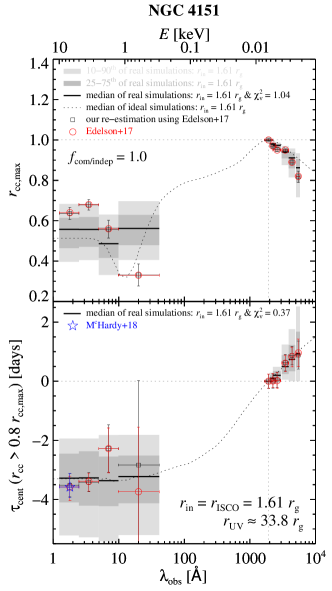
As introduced in Section 3.1, we have re-estimated the correlations, , and lags, , using the observed Swift light curves, and our measurements are generally consistent with those available in literature. Relative to the UV band, i.e., Swift-UVW2, Figure 3 shows our measurements (along with those from literature) of (top panels) and (bottom panels) as a function of the observed wavelength for NGC 4151 (left panels) and NGC 4593 (right panels).
The UV to X-ray lags of these two galaxies have recently reported to be significantly larger than that implied by the reprocessing model (Edelson et al., 2017; McHardy et al., 2018). This new challenge against the reprocessing model is also illustrated in the lower panels of Figure 3, where shown are the lag-wavelength relations implied by the reprocessing model (the magenta dot-dashed lines), using Equation (12) of Fausnaugh et al. (2016) and assuming the radiation efficiency , the ratio of external to internal heating, , the multiplicative scaling factor, (Tie & Kochanek, 2018), and 27 times larger (Zhu et al., 2018). Note here has to be enlarged by a factor of 27 in order to match the observed UV/optical lags (relative to Swift-UVW2). Even though, the UV to X-ray lags implied by the reprocessing model still appear too small and significantly disagree with the observations for NGC 4151 and NGC 4593.
In Figures 3 we also plot our model predictions for NGC 4151 and NGC 4593 with default parameters (here, ), using both simulated ideal light curves introduced in Section 2.1 and “real” light curves considering the monitoring sampling and flux uncertainties introduced in Section 3.2. The black dotted lines are the medians of 200 ideal simulations, while the black thick solid horizontal lines, the gray regions, and the light-gray regions are the median, 25-75th, and 10-90th percentile ranges of 200 “real” light curves, respectively. Note an important prediction of our model is that the interband correlations and lags may change from one simulated light curve to another due to the randomness of the turbulence, and such scatters are clearly visible with the plotted 25-75th, and 10-90th percentile ranges. After having considered the sampling and flux uncertainties, the medians for decreases slightly, comparing with those from the ideal light curves. This is as expected as photometric errors were added to “real” light curves. The medians for are more or less the same, thanks to the high cadence of Swift monitoring and the small flux uncertainty of .
It is remarkable that our simulations, without fine tuning any of the default model parameters, appear nicely consistent with the overall trend of the observations. We quantitatively assess the differences between our model and observations using , where is the observed value (our own measurements) for or in the th band, and are respectively the corresponding median value and 1 scatter implied by simulations, and is the number of bands. Note that to access the Swift-U band (and the SDSS- band of NGC 5548) has been excluded owing to the prominent contamination of emissions from the broad line region (Fausnaugh et al., 2016; Edelson et al., 2019). The derived are presented in Figure 3. Globally, a well consistence between our model and observations is indicated by the small . In the top-left panel of Figure 3, a noticeable stronger correlation predicted by the baseline model for NGC 4151 can be found in the UV/optical bands. Since the correlation strength is strongly dependent on , we find that, a smaller , decreasing from the fiducial value of 1.5 to 1.0, may be possible for NGC 4151 as shown in Figure 4.
As shown in Section 2.2, the model predicted UV to X-ray lag decreases with increasing the inner edge of the cold accretion disk. In Figure 3, we also show the medians of ideal simulations (the dashed lines) implied by a truncated disk (). On the left panels of Figure 3 for NGC 4151 with , the selected is equivalent to the ISCO radius of a Schwarzschild BH. Comparing to data, the smaller UV to X-ray lags implied by may indicate that the cold disk should extend more inwards and so a Kerr BH is more preferred for NGC 4151. On the right panels of Figure 3 for NGC 4593 with , is selected for a significant change of the UV to X-ray lag, while still smaller than the typical radius of the UV emission regions, . Although the cold disk for NGC 4593 is possibly truncated as well, the single measurement of the UV to X-ray lag and its large uncertainty hinder us rejecting the baseline model with for NGC 4593.
On the correlation-wavelength relation predicted by our models in the top panels of Figure 3, there is a prominent dip at . Around these wavelengths, the flux contributions from disk and corona are comparable, and the Wien steep portion of disk emission is supplied by only a few disk zones, thus poorly correlates with variation at other wavelength. Consequently, the scatter of lag is larger. It is surprising to note that on the correlation-wavelength relation our current toy model predicts a quite similar shape to that observed around keV for NGC 4151 with . However, currently we do not count this as an additional plus of our toy model, since our model simply deals with the corona by assuming a single power-law emission and has not considered the soft excess as well as the reflection component, which need to be improved in the future.
All in all, interestingly, considering the scatter, our model predicts the lag-wavelength relation in agreement with data of NGC 4151 and NGC 4593, which seriously challenges the reprocessing model.
4.2 A truncated cold disk: NGC 5548
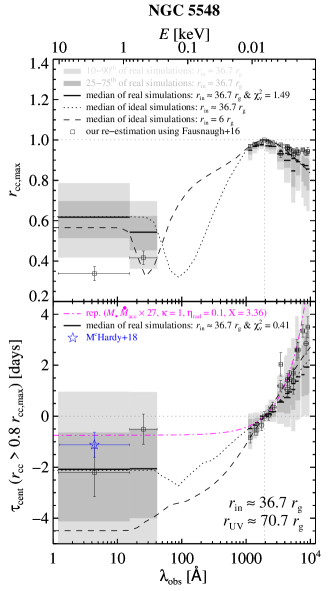

In analog to Figure 3, the correlation- and lag-wavelength relations for NGC 5548 are shown in Figure 5, where the data are from McHardy et al. (2018) and our own measurements using the X-ray/UV/optical light curves of De Rosa et al. (2015), Edelson et al. (2015), and Fausnaugh et al. (2016).
A quite large UV to X-ray lag is predicted by our model if the inner edge of the cold disk can extend downward to the ISCO radius for NGC 5548, as shown by the dashed line for the median lag of 200 ideal simulations in the bottom panel of Figure 5. Instead, the current data of the UV to X-ray lags potentially indicate in our model a truncated cold disk for NGC 5548. To search for the truncation radius, we set up a grid of and assess the differences between our model and observations using . As shown in Figure 6, the thin disk of NGC 5548 is potentially truncated at . By virtual of future more solid estimates on the UV to X-ray lags for NGC 5548, it would be possible to precisely determine its .
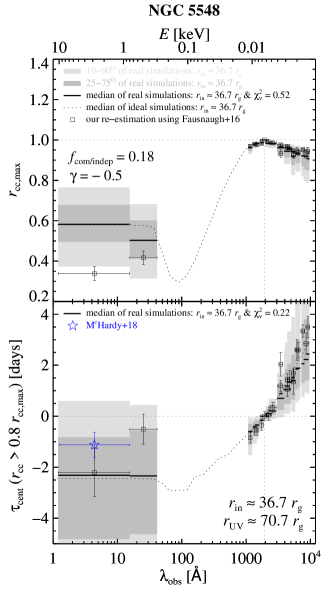
Accordingly, the baseline model for NGC 5548 with is shown in Figure 5, and the baseline model for NGC 5548 is in quite well agreement with observations. Nevertheless, the baseline model for NGC 5548 seemingly implies a slightly stronger correlation in the X-ray while a weaker correlation in the UV/optical. Interestingly, a even better agreement on the inter-band correlations can be expected if the relative contribution of the large-scale common variation over the local independent variation is smaller in the X-ray emitting regions while larger in the optical emitting regions. This scheme is easily achievable, for example, by changing the parameter . As shown in Figure 7, the agreement is indeed improved if increases from -1.0 used in the baseline model to -0.5. Note that accordingly decreases from 1.5 to 0.18 in order to get the same at 70 , which is the typical UV (1928 ) emitting radius for NGC 5548.
Comparing to sources shown in Figure 3, the scatter of lag at for NGC 5548 in Figure 5 is more significant, primarily attributed to its large comparable to (see also the middle panel of Figure 2). Once the truncated radius approaches to the typical UV emitting regions, the timescales of temperature fluctuations inducing both the UV and X-ray variations are similar and therefore may result in zero or even negative UV to X-ray lags, i.e., the UV leading the X-ray, owing to the random turbulence. The negative UV to X-ray lag is an intriguing prediction of our model (see Section 5.2 for further discussion).
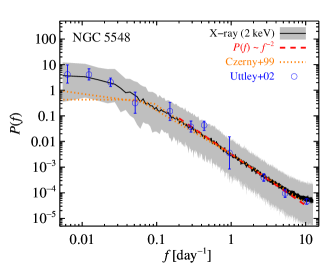
As mentioned in Section 2.1, the median X-ray power density spectrum inferred from our model is qualitatively consistent with that found by Czerny et al. (1999). In Figure 8, we quantitatively compare them using the baseline model for NGC 5548 with . The fact that the agreement at high frequency is excellent is not surprising because we have assumed a power density spectrum of to model the X-ray fluctuations and Czerny et al. (1999) have also assumed almost the same slope to deduce the power density spectrum. Instead, at low frequency, although somewhat higher than that deduced by Czerny et al. (1999), the median power density spectrum implied by our baseline model is well consistent with that directly measured by Uttley et al. (2002).
4.3 The intermediate-mass BH candidate: NGC 4395
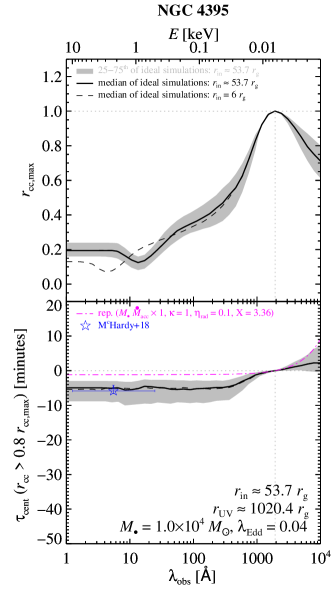
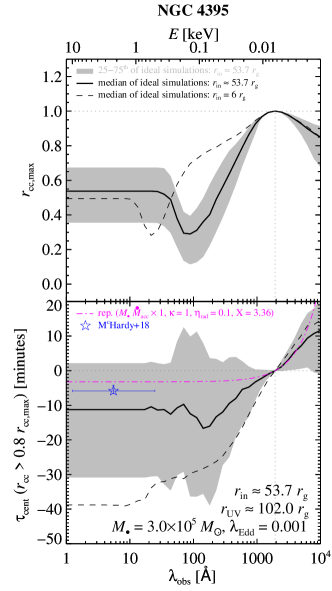
Since its discovery (Filippenko & Sargent, 1989), NGC 4395 is one of the few intermediate-mass BH candidates (Filippenko & Ho, 2003; Dong et al., 2012; Greene et al., 2019). Based on the reverberation mapping of the C IV 1549 line, Peterson et al. (2005) estimate its BH mass as (see also, den Brok et al. 2015, Brum et al. 2019). However, its mass has recently been updated by Woo et al. (2019) to a remarkably lower value of , based on the narrow-band reverberation mapping of the H line.
Thanks to its relatively low-mass BH and therefore expected small characteristic timescales of variations, suitable for intensive monitoring campaigns, NGC 4395 has been observed by XMM-Newton (Vaughan et al., 2005; McHardy et al., 2016), Chandra+HST plus ground optical telescopes (Desroches et al., 2006; O’Neill et al., 2006), and Swift (Cameron et al., 2012). Recently, McHardy et al. (2016) state a to 0.5-10 keV lag of minutes. Since the light curves of NGC 4395 are generally unavailable, we only show this up-to-date UV to X-ray lag (cf. Table 3 of McHardy et al., 2018, for the corrected value relative to the UVW2 band) in the bottom panels of our Figure 9.
Considering the ongoing debate on the BH mass estimate, we show in Figure 9 the correlation- and lag-wavelength relations predicted by our model with a small BH mass of (cf. Woo et al., 2019) and a large BH mass of (cf. Peterson et al., 2005). The Eddington ratio is then adjusted accordingly given the bolometric luminosity from McHardy et al. (2018). In both cases, the baseline models (solid thick lines) have a truncated cold disk with , which is selected to reduce the UV to X-ray lags when the large BH mass is assumed (see the dashed line in the bottom-right panel of Figure 9 for ). Instead, in the bottom-left panel of Figure 9, we find that the lag-wavelength relations are more or less the same for and when the small BH mass is assumed.
Assuming a large BH mass for NGC 4395 (Peterson et al., 2005), McHardy et al. (2018) find that only in NGC 4395 the UV to X-ray lag predicted by the reprocessing model is consistent with that observed (see also the comparison between the magenta dot-dashed line and the blue open star in the bottom-right panel of Figure 9). However, if NGC 4395 holds a BH with mass as low as that reported by Woo et al. (2019), the reprocessing model would be also challenged by the same puzzling large UV to X-ray lag of NGC 4395 (see the bottom-left panel of Figure 9). Based on our predictions shown in Figure 9, future intensive and sensitive X-ray/UV/optical monitoring on NGC 4395 would help discriminating its BH mass as well as the truncated radius of the cold accretion disk.
5 Discussions
5.1 Correlation between the UV to X-ray lag and the broadness of Fe K
| The observed-frame UV (Swift-UVW2) to X-ray lags | The Gaussian width | ||||
|---|---|---|---|---|---|
| X-ray band | Observed | Reprocessing model | Our model | (6.4 keV) | |
| Object | [keV - keV] | [days] | [days] | [days] | [keV] |
| (1) | (2) | (3) | (4) | (5) | (6) |
| NGC 4151 | 5-10 | 0.178 | |||
| NGC 4593 | 0.5-10 | 0.089 | |||
| NGC 5548 | 0.8-10 | 0.281 | |||
| NGC 4395 | 0.5-10 | ||||
Note. — Column 1: Name of object. Column 2: The energy range of the X-ray band, relative to which the UV to X-ray lag is measured. Column 3: The observed-frame UV (Swift-UVW2) to X-ray (the corresponding band in Column 2) lags reported by McHardy et al. (2018, cf. their Table 3). These UV to X-ray lags for NGC 4151, NGC 4593, NGC 4395, and NGC 5548 are from Edelson et al. (2017), McHardy et al. (2018), McHardy et al. (corrected to the Swift-UVW2 band, 2016), and Edelson et al. (2015), respectively. Column 4: The reprocessing model lags reported by McHardy et al. (2018) and rescaled by given our adopted and (see Table 1). Column 5: The observed-frame UV to X-ray lags implied by our baseline model with parameters tabulated in Table 1. The median and 25-75th percentile ranges inferred from 200 simulations are presented. Only ideal simulations are applied for NGC 4395, whose light curves are unavailable in literature, while “real” simulations are applied for the other sources. Column 6: The Gaussian widths with 90% confidence level of the 6.4 keV Fe K line for NGC 4151, NGC 4593, NGC 4395, and NGC 5548 are from Keck et al. (NuSTAR + Suzaku, 2015), Ursini et al. (XMM-Newton + NuSTAR, 2016a), Iwasawa et al. (Suzaku, 2010), and Brenneman et al. (Suzaku, 2012), respectively.
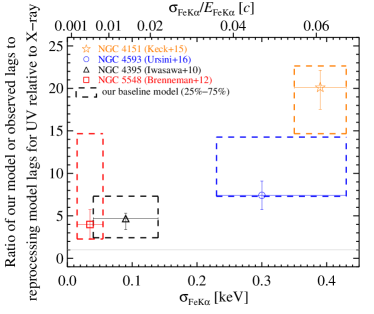
Following McHardy et al. (2018) and tabulated in Table 2, we plot in Figure 10 the ratio of observed to reprocessing model UV to X-ray lags for these Seyfert galaxies. We directly adopt the observed and reprocessing model lags given by McHardy et al. (2018), the latter of which is rescaled according to our assumed BH mass and Eddington ratio tabulated in Table 1. The larger (than unity) the ratio, the reprocessing model is more challenged. Similar to illustrated in Figures 3, 5, and 9, our toy model presented in this work could yield UV to X-ray lags well consistent with observations.
As introduced in Section 2.2, relatively larger UV to X-ray lag is expected for AGN with smaller inner edge of cold disk and thus more compact corona. A smaller inner edge of cold disk would give rise to a broader Fe K line around keV.
We note that a relativistic broadened Fe K line is clearly resolved in NGC 4151 by Keck et al. (2015, keV) using NuSTAR+Suzaku (see also Yaqoob et al. 1995; Wang et al. 1999; Zoghbi et al. 2012; Beuchert et al. 2017; however, see Zoghbi et al. 2019). A broad component of Fe K line is statistically required in NGC 4593 by Ursini et al. (2016a, keV) using XMM-Newton+NuSTAR.
Meanwhile, the lack of a broad Fe K line is reported for NGC 5548 by Brenneman et al. (2012, keV) using Suzaku and is confirmed by Cappi et al. (2016, keV from their Figure 7) using XMM-Newton+NuSTAR. Note that, fitting the X-ray spectral data of NGC 5548, Brenneman et al. (2012) estimate a disk truncation radius of , which is consistent with our chosen to match the observed UV to X-ray lags. For NGC 4395, Iwasawa et al. (2010) only detect a weak Fe K line with keV using Suzaku.
Interestingly, Figure 10 illustrates a feasible correlation between the ratio and the broadness of Fe K line, where sources with relatively larger UV to X-ray lags do have more relativistically broadened Fe K lines, indicative of more compact corona and smaller innermost disk radius.
If confirmed with more X-ray and UV monitoring campaigns, this interesting discovery would provide a new probe to the inner disk/corona, and potentially promote the studies of the broad Fe K line and the measurements of supermassive BH spin.
5.2 Randomness of the UV to X-ray lag and inter-band correlations?
As illustrated in Figure 5, the large scatter of the UV to X-ray lag for NGC 5548 implies that sometimes there could be no lag between UV and X-ray or even X-ray lagging behind UV, akin to those found in Mrk 817 (Morales et al., 2019) and Mrk 509 (Edelson et al., 2019), respectively. This fluctuating property may also account for the failure of recovering lags for the vast majority of AGNs seen in most monitoring seasons by Yu et al. (2018), as well as for the uncorrelated optical and UV flux variations implied by Xin et al. (2020).
A tight correlation between the UV/optical continuum variations and the UV/optical broad emission line variations is the foundation of the reverberation mapping technique (Blandford & McKee, 1982), which assumes (1) the UV/optical broad emission lines arise from large-scale clouds photoionized by the largely unobservable intense ionizing continuum or extreme-UV radiation originating from the very inner regions of accretion disk, and (2) the variation of the UV/optical continuum radiation is a good proxy of that of the largely unobservable extreme-UV continuum radiation. Observationally, this correlation generally holds. However, analyzing the intensive UV/optical monitoring on NGC 5548 with a time baseline of days in 2014, Goad et al. (2016) report a transient anomalous phenomenon lasting days during the campaign. This transient anomalous phenomenon, called the UV anomaly, is indicated by a decorrelation between the UV continuum and emission line variations, characterized by a significant decrease of both flux and variation amplitude of the broad emission lines. Such an anomaly is also found in some emission lines of three high- luminous quasars by Lira et al. (2018). Recently, it has been claimed to be very common and probably in every object by Gaskell et al. (2019).
Current explanations for this anomaly include a falling corona (Sun et al., 2018) or an equatorial obscurer (e.g., a disk wind) with increasing density (Dehghanian et al., 2019a, b), obscuring the X-ray and extreme-UV emissions then inducing the spectral variations as observed by Mathur et al. (2017). Our scenario potentially provides a different explanation for this anomaly. As shown in Figure 5, sometimes the correlation between extreme-UV and UV emissions could be very weak, owing to the randomness of turbulence and, especially, a disk with truncated radius comparable to the typical radius of UV emitting regions. In other words, the aforementioned second assumption in the reverberation mapping technique is sometimes out of reach. Our scenario directly predicts finding this anomaly with higher frequency in AGNs where there are truncated disks. Detailed studies on the frequency and characteristics of the anomaly will be presented in a separate paper of this series (Z. Y. Cai et al. 2020, in preparation).
6 Conclusions
In this work, we have further developed the inhomogeneous turbulence model to account for the puzzling large UV to X-ray lags in local Seyfert galaxies. In our scenario, the UV/optical as well as the X-ray variations are attributed to disk turbulences, so the UV/optical variations are intrinsic to the thermal disk, rather than the reprocessed X-ray irradiation. When the effect of large-scale turbulence is considered, the lag for the variation at longer wavelength behind that at shorter one is a result of the differential regression capability of local fluctuations when responding to the large-scale fluctuation.
Without the need of light echoing, our inhomogeneous turbulence model can well reproduce the lags and correlations between the X-ray and UV/optical bands. Moreover, relatively larger UV to X-ray lag is expected for AGN with smaller innermost disk radius and thus more compact corona. Interestingly, for the four local Seyfert galaxies studied in this work, sources with relatively larger UV to X-ray lags do have more relativistically broadened Fe K lines.
Due to the randomness of the turbulence, our scenario predicts that the measured lag could change from one monitoring campaign to another. Therefore, not only the mean of lags measured in several campaigns but also the scatter contain important information on the central engine of AGNs. Once combined with the measurement of Fe K line, constraints on the physics of the central engine of AGNs as well as the BH spin would be improved.
References
- Bentz & Katz (2015) Bentz, M. C., & Katz, S. 2015, PASP, 127, 67
- Beuchert et al. (2017) Beuchert, T., Markowitz, A. G., Dauser, T., et al. 2017, A&A, 603, A50
- Blandford & McKee (1982) Blandford, R. D., & McKee, C. F. 1982, ApJ, 255, 419
- Brandt & Alexander (2015) Brandt, W. N., & Alexander, D. M. 2015, A&ARv, 23, 161
- Brenneman et al. (2012) Brenneman, L. W., Elvis, M., Krongold, Y., Liu, Y., & Mathur, S. 2012, ApJ, 744, 13
- Brum et al. (2019) Brum, C., Diniz, M. R., Riffel, R. A., et al. 2019, MNRAS, 486, 691
- Cackett et al. (2018) Cackett, E. M., Chiang, C.-Y., McHardy, I., et al. 2018, ApJ, 857, 53
- Cai et al. (2019) Cai, Z., Sun, Y., Wang, J., et al. 2019, SCPMA, 62, 69511
- Cai et al. (2016) Cai, Z.-Y., Wang, J.-X., Gu, W.-M., et al. 2016, ApJ, 826, 7
- Cai et al. (2018) Cai, Z.-Y., Wang, J.-X., Zhu, F.-F., et al. 2018, ApJ, 855, 117
- Cameron et al. (2012) Cameron, D. T., McHardy, I., Dwelly, T., et al. 2012, MNRAS, 422, 902
- Cappi et al. (2016) Cappi, M., De Marco, B., Ponti, G., et al. 2016, A&A, 592, A27
- Chelouche et al. (2018) Chelouche, D., Pozo Nuñez, F., & Kaspi, S. 2018, NatAs, 3, 251
- Czerny et al. (1999) Czerny, B., Schwarzenberg-Czerny, A., & Loska, Z. 1999, MNRAS, 303, 148
- De Rosa et al. (2015) De Rosa, G., Peterson, B. M., Ely, J., et al. 2015, ApJ, 806, 128
- Dehghanian et al. (2019a) Dehghanian, M., Ferland, G. J., Peterson, B. M., et al. 2019a, ApJL, 882, L30
- Dehghanian et al. (2019b) Dehghanian, M., Ferland, G. J., Kriss, G. A., et al. 2019b, ApJ, 877, 119
- den Brok et al. (2015) den Brok, M., Seth, A. C., Barth, A. J., et al. 2015, ApJ, 809, 101
- Desroches et al. (2006) Desroches, L.-B., Filippenko, A. V., Kaspi, S., et al. 2006, ApJ, 650, 88
- Dexter & Agol (2011) Dexter, J., & Agol, E. 2011, ApJL, 727, L24
- Done et al. (2012) Done, C., Davis, S. W., Jin, C., Blaes, O., & Ward, M. 2012, MNRAS, 420, 1848
- Dong et al. (2012) Dong, X.-B., Ho, L. C., Yuan, W., et al. 2012, ApJ, 755, 167
- Edelson et al. (2015) Edelson, R., Gelbord, J. M., Horne, K., et al. 2015, ApJ, 806, 129
- Edelson et al. (2017) Edelson, R., Gelbord, J., Cackett, E., et al. 2017, ApJ, 840, 41
- Edelson et al. (2019) —. 2019, ApJ, 870, 123
- Edelson et al. (1990) Edelson, R. A., Krolik, J. H., & Pike, G. F. 1990, ApJ, 359, 86
- Edelson et al. (1996) Edelson, R. A., Alexander, T., Crenshaw, D. M., et al. 1996, ApJ, 470, 364
- Fausnaugh et al. (2016) Fausnaugh, M. M., Denney, K. D., Barth, A. J., et al. 2016, ApJ, 821, 56
- Filippenko & Ho (2003) Filippenko, A. V., & Ho, L. C. 2003, ApJ, 588, L13
- Filippenko & Sargent (1989) Filippenko, A. V., & Sargent, W. L. W. 1989, ApJL, 342, L11
- Galeev et al. (1979) Galeev, A. A., Rosner, R., & Vaiana, G. S. 1979, ApJ, 229, 318
- Gardner & Done (2017) Gardner, E., & Done, C. 2017, MNRAS, 470, 3591
- Gaskell et al. (2019) Gaskell, C. M., Bartel, K., Deffner, J. N., & Xia, I. 2019, arXiv e-prints, arXiv:1909.06275
- Gaskell et al. (2007) Gaskell, C. M., Klimek, E. S., & Nazarova, L. S. 2007, arXiv, arXiv:0711.1025
- Gaskell & Peterson (1987) Gaskell, C. M., & Peterson, B. M. 1987, ApJS, 65, 1
- Goad et al. (2016) Goad, M. R., Korista, K. T., De Rosa, G., et al. 2016, ApJ, 824, 11
- Greene et al. (2019) Greene, J. E., Strader, J., & Ho, L. C. 2019, arXiv e-prints, arXiv:1911.09678
- Haardt & Maraschi (1991) Haardt, F., & Maraschi, L. 1991, ApJL, 380, L51
- Hall et al. (2018) Hall, P. B., Sarrouh, G. T., & Horne, K. 2018, ApJ, 854, 93
- Iwasawa et al. (2010) Iwasawa, K., Tanaka, Y., & Gallo, L. C. 2010, A&A, 514, A58
- Kammoun et al. (2018) Kammoun, E. S., Nardini, E., & Risaliti, G. 2018, A&A, 614, A44
- Kammoun et al. (2019a) Kammoun, E. S., Papadakis, I. E., & Dovčiak, M. 2019a, ApJL, 879, L24
- Kammoun et al. (2019b) Kammoun, E. S., Nardini, E., Zoghbi, A., et al. 2019b, ApJ, 886, 145
- Kang et al. (2018) Kang, W.-Y., Wang, J.-X., Cai, Z.-Y., et al. 2018, ApJ, 868, 58
- Keck et al. (2015) Keck, M. L., Brenneman, L. W., Ballantyne, D. R., et al. 2015, ApJ, 806, 149
- Kelly et al. (2009) Kelly, B. C., Bechtold, J., & Siemiginowska, A. 2009, ApJ, 698, 895
- Korista & Goad (2001) Korista, K. T., & Goad, M. R. 2001, ApJ, 553, 695
- Korista & Goad (2019) —. 2019, MNRAS, 489, 5284
- Krolik et al. (1991) Krolik, J. H., Horne, K., Kallman, T. R., et al. 1991, ApJ, 371, 541
- Lira et al. (2018) Lira, P., Kaspi, S., Netzer, H., et al. 2018, ApJ, 865, 56
- Liu et al. (2002) Liu, B. F., Mineshige, S., & Shibata, K. 2002, ApJL, 572, L173
- Lynden-Bell (1969) Lynden-Bell, D. 1969, Natur, 223, 690
- Mahmoud & Done (2019) Mahmoud, R. D., & Done, C. 2019, arXiv e-prints, arXiv:1908.05461
- Mathur et al. (2017) Mathur, S., Gupta, A., Page, K., et al. 2017, ApJ, 846, 55
- McHardy et al. (2016) McHardy, I. M., Connolly, S. D., Peterson, B. M., et al. 2016, AN, 337, 500
- McHardy et al. (2018) McHardy, I. M., Connolly, S. D., Horne, K., et al. 2018, MNRAS, 480, 2881
- Molina et al. (2019) Molina, M., Malizia, A., Bassani, L., et al. 2019, MNRAS, 484, 2735
- Morales et al. (2019) Morales, A. M., Miller, J. M., Cackett, E. M., Reynolds, M. T., & Zoghbi, A. 2019, ApJ, 870, 54
- Nandra et al. (1997) Nandra, K., George, I. M., Mushotzky, R. F., Turner, T. J., & Yaqoob, T. 1997, ApJ, 477, 602
- Nandra et al. (2007) Nandra, K., O’Neill, P. M., George, I. M., & Reeves, J. N. 2007, MNRAS, 382, 194
- Novikov & Thorne (1973) Novikov, I. D., & Thorne, K. S. 1973, in Black holes (Les astres occlus), ed. C. DeWitt & B. DeWitt, 343
- O’Neill et al. (2006) O’Neill, P. M., Kaspi, S., Laor, A., et al. 2006, ApJ, 645, 160
- Peterson et al. (1998) Peterson, B. M., Wanders, I., Horne, K., et al. 1998, PASP, 110, 660
- Peterson et al. (2004) Peterson, B. M., Ferrarese, L., Gilbert, K. M., et al. 2004, ApJ, 613, 682
- Peterson et al. (2005) Peterson, B. M., Bentz, M. C., Desroches, L.-B., et al. 2005, ApJ, 632, 799
- Reynolds (2014) Reynolds, C. S. 2014, SSRv, 183, 277
- Rodriguez-Pascual et al. (1997) Rodriguez-Pascual, P. M., Alloin, D., Clavel, J., et al. 1997, ApJS, 110, 9
- Shakura & Sunyaev (1973) Shakura, N. I., & Sunyaev, R. A. 1973, A&A, 24, 337
- Shappee et al. (2014) Shappee, B. J., Prieto, J. L., Grupe, D., et al. 2014, ApJ, 788, 48
- Shu et al. (2010) Shu, X.-W., Yaqoob, T., & Wang, J. X. 2010, ApJS, 187, 581
- Starkey et al. (2017) Starkey, D., Horne, K., Fausnaugh, M. M., et al. 2017, ApJ, 835, 65
- Sun et al. (2018) Sun, M., Grier, C. J., & Peterson, B. M. 2018, PyCCF: Python Cross Correlation Function for reverberation mapping studies, Astrophysics Source Code Library, ascl:1805.032
- Sun et al. (2018) Sun, M., Xue, Y., Cai, Z., & Guo, H. 2018, ApJ, 857, 86
- Sun et al. (2019) Sun, M., Xue, Y., Trump, J. R., & Gu, W.-M. 2019, MNRAS, 482, 2788
- Sun et al. (2014) Sun, Y.-H., Wang, J.-X., Chen, X.-Y., & Zheng, Z.-Y. 2014, ApJ, 792, 54
- Tie & Kochanek (2018) Tie, S. S., & Kochanek, C. S. 2018, MNRAS, 473, 80
- Ursini et al. (2016a) Ursini, F., Petrucci, P. O., Matt, G., et al. 2016a, MNRAS, 463, 382
- Ursini et al. (2016b) —. 2016b, AN, 337, 552
- Uttley et al. (2002) Uttley, P., McHardy, I. M., & Papadakis, I. E. 2002, MNRAS, 332, 231
- Vaughan et al. (2003) Vaughan, S., Edelson, R., Warwick, R. S., & Uttley, P. 2003, MNRAS, 345, 1271
- Vaughan et al. (2005) Vaughan, S., Iwasawa, K., Fabian, A. C., & Hayashida, K. 2005, MNRAS, 356, 524
- Walton et al. (2013) Walton, D. J., Nardini, E., Fabian, A. C., Gallo, L. C., & Reis, R. C. 2013, MNRAS, 428, 2901
- Wang et al. (1999) Wang, J.-X., Zhou, Y.-Y., & Wang, T.-G. 1999, ApJ, 523, L129
- Woo et al. (2019) Woo, J.-H., Cho, H., Gallo, E., et al. 2019, NatAs, 3, 755
- Xin et al. (2020) Xin, C., Charisi, M., Haiman, Z., & Schiminovich, D. 2020, arXiv e-prints, arXiv:2001.03154
- Yaqoob et al. (1995) Yaqoob, T., Edelson, R., Weaver, K. A., et al. 1995, ApJL, 453, L81
- Yu et al. (2018) Yu, Z., Martini, P., Davis, T. M., et al. 2018, arXiv e-prints, arXiv:1811.03638
- Yuan & Narayan (2014) Yuan, F., & Narayan, R. 2014, ARA&A, 52, 529
- Zhu et al. (2016) Zhu, F.-F., Wang, J.-X., Cai, Z.-Y., & Sun, Y.-H. 2016, ApJ, 832, 75
- Zhu et al. (2018) Zhu, F.-F., Wang, J.-X., Cai, Z.-Y., et al. 2018, ApJ, 860, 29
- Zoghbi et al. (2012) Zoghbi, A., Fabian, A. C., Reynolds, C. S., & Cackett, E. M. 2012, MNRAS, 422, 129
- Zoghbi et al. (2019) Zoghbi, A., Miller, J. M., & Cackett, E. 2019, ApJ, 884, 26