Dynamic Phase Transition in the Contact Process with Spatial Disorder: Griffiths Phase and Complex Persistence Exponents
Abstract
We present a model which displays Griffiths phase i.e. algebraic decay of density with continuously varying exponent in the absorbing phase. In active phase, the memory of initial conditions is lost with continuously varying complex exponent in this model. This is 1-D model where fraction of sites obey rules leading to directed percolation (DP) class and the rest evolve according to rules leading to compact directed percolation (CDP) class. For infection probability , the fraction of active sites asymptotically. For , . At , , the survival probability from single seed and the average number of active sites starting from single seed decay logarithmically. The local persistence for and for . For , local persistence decays as a power law with continuously varying exponents. The persistence exponent is clearly complex as . The complex exponent implies logarithmic periodic oscillations in persistence. The wavelength and the amplitude of the logarithmic periodic oscillations increases with . We note that underlying lattice or disorder does not have self-similar structure.
pacs:
64.60.Ht, 05.70.Fh, 02.70.-cI Introduction
Understanding of phase transition in equilibrium statistical physics is a major success in theoretical physics in the ’70s. The concepts of scaling and renormalization group were introduced to explain the divergence of characteristic length-scales near continuous phase transitions. Extension of these ideas to the nonequilibrium systems is an active area of research with applications ranging from granular matter to epidemics Marro and Dickman (2005); Domb et al. (1995); Hinrichsen (2000a). The power-laws associated with the continuous transitions are observed in very close vicinity of the critical point. They are found precisely in theoretical models and are a signature of the universality class of associated phase transition. Very few experimental verifications of such power-laws are obtained. It requires extremely fine-tuning of experimental parameters. Nonetheless, the power-laws in space and time are ubiquitous. This has led to the paradigm of self-organized criticality which often requires adiabatic drive Bak et al. (1987); Pruessner (2012); Carlson et al. (1993). Another reason for power-laws can be disorder and inhomogeneities Noest (1986, 1988); Webman et al. (1998).
Usually, the power-laws have real exponents. A complex exponent will lead to log-periodic oscillatory corrections to the power-law. Such oscillations have been obtained or predicted in a few situations Sornette (1998); Akkermans et al. (2012); Saadatfar and Sahimi (2002). For example, observation of log-periodic oscillations in the stock market has been associated with the possibility of a crash. Some understanding of such oscillations at the critical point when underlying lattice or disorder has self-similar characteristics is obtained Johansen et al. (1999); Sornette (1998); Barghathi et al. (2014). In this work, we observe log-periodic oscillations in the memory of initial conditions even when there is no self-similar structure in the lattice or disorder and the system is far away from the critical point. This can be interpreted as an outcome of quenched disorder alone.
Most theoretical studies in the equilibrium and the nonequilibrium phase transitions involve idealized homogeneous systems. It is a useful approximation (like equilibrium). But the real-life systems involve inhomogeneities invariably. They play an important role in several experiments. For example, in the catalytic reactions, the catalytic surface is not homogeneous. The inhomogeneities can change or destroy critical behavior Webman et al. (1998). The theory of spin-glasses in equilibrium systems has given useful insights in disordered systems. It has found applications in fields ranging from evolution to computer science Fischer and Hertz (1993).
In this work, we focus on the absorbing phase transitions in nonequilibrium processes in the presence of spatial disorder. We take prototypical and widely studied class of directed percolation (DP). It is characterized by one component order parameter, short-range dynamical rule, no additional symmetries and no quenched disorder Janssen (1981); Grassberger (1982). The experimental verification of DP is rare, although it is very well studied in theory and simulations. The experimental verifications are related to the spatiotemporal intermittency Hinrichsen (2000b). There are some more universality classes for the transition to an absorbing phase. One of them is compact directed percolation (CDP). In this class, if all the neighbors of a given site are active, it becomes active with probability one Henkel et al. (2008).
Certain justifications have been proposed for difficulties in observing DP behavior in experiments Hinrichsen (2000b). Intrinsic fluctuations may smear out the transition to the truly absorbing phase. DP does not take into account possible intermediate phases in the reaction sequence. The nature of the update, (parallel or random sequential), can change the nature of the transition. Finally, realistic systems cannot avoid random inhomogeneity of some kind. Not only the experimental values of the exponents may vary from their theoretical prediction, but the critical behavior may be destroyed due to the inhomogeneity Vojta (2006).
We study the impact of spatially quenched disorder on DP universality class. We consider a very strong disorder in which the universality class of the underlying system changes completely. Several studies have been carried out to study the effect of spatially quenched disorder in the past. However, a clear picture is still eluding. The studies on the effect of quenched disorder on the DP model show that even very weak randomness can drastically modify the phase diagram and critical behavior Webman et al. (1998). According to Harris criteria, the quenched disorder are relevant perturbations if where d, is the dimensionality and is the correlation length exponent in the spatial direction of the pure system Harris (1974). In particular, we consider disorder in which half the sites obey DP and the other half obey CDP rules. This is a very strong perturbation. For , for DP and for CDP. Since, in either case, we can expect quenched disorder to be a relevant perturbation.
In CDP universality class, we observe compact percolation clusters. It is characterized by an additional symmetry. Here, an active site with all active neighbors cannot become inactive. The transition is governed by random walks at the end of the string Henkel et al. (2008).
We find that the presence of random spatial inhomogeneity leads to change in the critical behavior and ultra-slow dynamics in the 1-D model. The system undergoes algebraic decay with changing exponents in a part of the absorbing phase, followed by stretched exponential and exponential decay. The region with generic power-laws is known as Griffiths phase. It is known to emerge from rare region effects due to the presence of quenched defects Griffiths (1969). The rare regions locally favour one phase over the other i.e. although the bulk is globally in the absorbing phase, the rare regions are locally in the fluctuating phase with over average percolation probability. The dynamics of rare regions are extremely slow which leads to stretched exponential decay or algebraic decay Vojta (2003).
Of late, there has also been interest in the possibility of determining the nature of phase transition from short-time dynamics. The short-time dynamics of the spin-glass model and the Baxter-Wu model were studied. Novel critical exponents unrelated to known exponents were obtained Arashiro and De Felício (2003); Huse (1989). Other quantifiers such as persistence exponents have also been studied. We studied local persistence for this study which quantifies the loss of memory of the initial conditions. In general, power-law decay of the persistence and well-defined persistence exponents (if any) are obtained only at the critical point. However, for our model, we observe well-defined persistence exponents over the entire fluctuating phase. These exponents are complex and we observe logarithmic periodic oscillations over and above the usual power-laws. The oscillations do not average out (by the cancellation of phase) by averaging over disorder and initial conditions. Such exponents have not been reported before to the best of our knowledge.
II Model
We consider the cellular automata model of contact process (CP) originally proposed by Domany and Kinzel Domany and Kinzel (1984); Kinzel (1985). This model shows the transition in DP or CDP class. We consider a 1-D lattice of length . Each site is associated with variable which is 0 or 1 depending whether they are ’inactive’ or ’active’. Each site at any time t+1 becomes active with certain probability depending on its neighbors’ state at the previous time t. The conditional probabilities are defined as follows: P(10,0)=0, P(11,1)=q, P(11,0)=P(10,1)=. DP transition can be obtained for . Let us consider for simplicity. The order parameter, the fraction of active sites, is given by . Below the critical probability , the cluster goes to an absorbing phase from which it cannot escape. Above , . In this case for after a brief transient and asymptotically for . At , decays as a power law with in 1-D. For the above model, .
For CDP and . Thus, no inactive sites can be created in a continguous region of active sites. By symmetry, and jumps from 0 to 1 at . The exponent for CDP.
Now, we consider a model in which a fraction of sites marked as type A evolve according to CDP rules and the remaining fraction of sites marked as type B evolve according to DP rules. For the contact process modelling diseases, the type A particles can be interpreted as children, elderly or sick people who are extremely vulnerable and will catch a disease if everyone around them is sick. The rules are symmetric and our update is synchronous. The conditional probabilities of the update are mentioned above. For the particles of type A, , and for type B, . We consider the model for .
We compute two quantities (a) the fraction of active sites , and (b) the local persistence . is the fraction of sites such that for . These sites have not changed their state even once from their initial conditions till time . This is a non-Markovian quantity. Interestingly, it has been found that this quantity displays a power-law decay at the critical point of dynamic phase transition in some cases. In these cases, at the critical point where is known as the local persistence exponent. This is a new exponent independent from other critical exponents related to the transition. It is not universal. However, it has been found useful in finding other exponents such as and Fuchs et al. (2008); Menon et al. (2003).
The quantity is an order parameter for the absorbing state transitions while is an order parameter for the spreading transition. implies that there are no active sites in the lattice asymptotically and evolution has effectively stopped. suggests that some sites do not deviate from their initial conditions even once ever. The persistent sites partition lattice in various clusters such that there is no spread of information from one cluster to another. Both as well as can give us information about the phase transition. We average over initial conditions as well as disorder realizations.
The order parameter for . We find that for , and a finite density of active sites is obtained for . Normally, all inactive sites become active at some point of time in the active phase and asymptotically approaches zero for . On the other hand, for . However, it will be shown in next section that at , the active sites decay logarithmically and dynamics is extremely slow and we do not obtain power-law decay of persistence. The persistence decays as power law for . For , the decay is slower than power law. The persistence exponent is the largest at and reduces as
III Simulation and Results
We simulate the system for sites and average more than configurations.
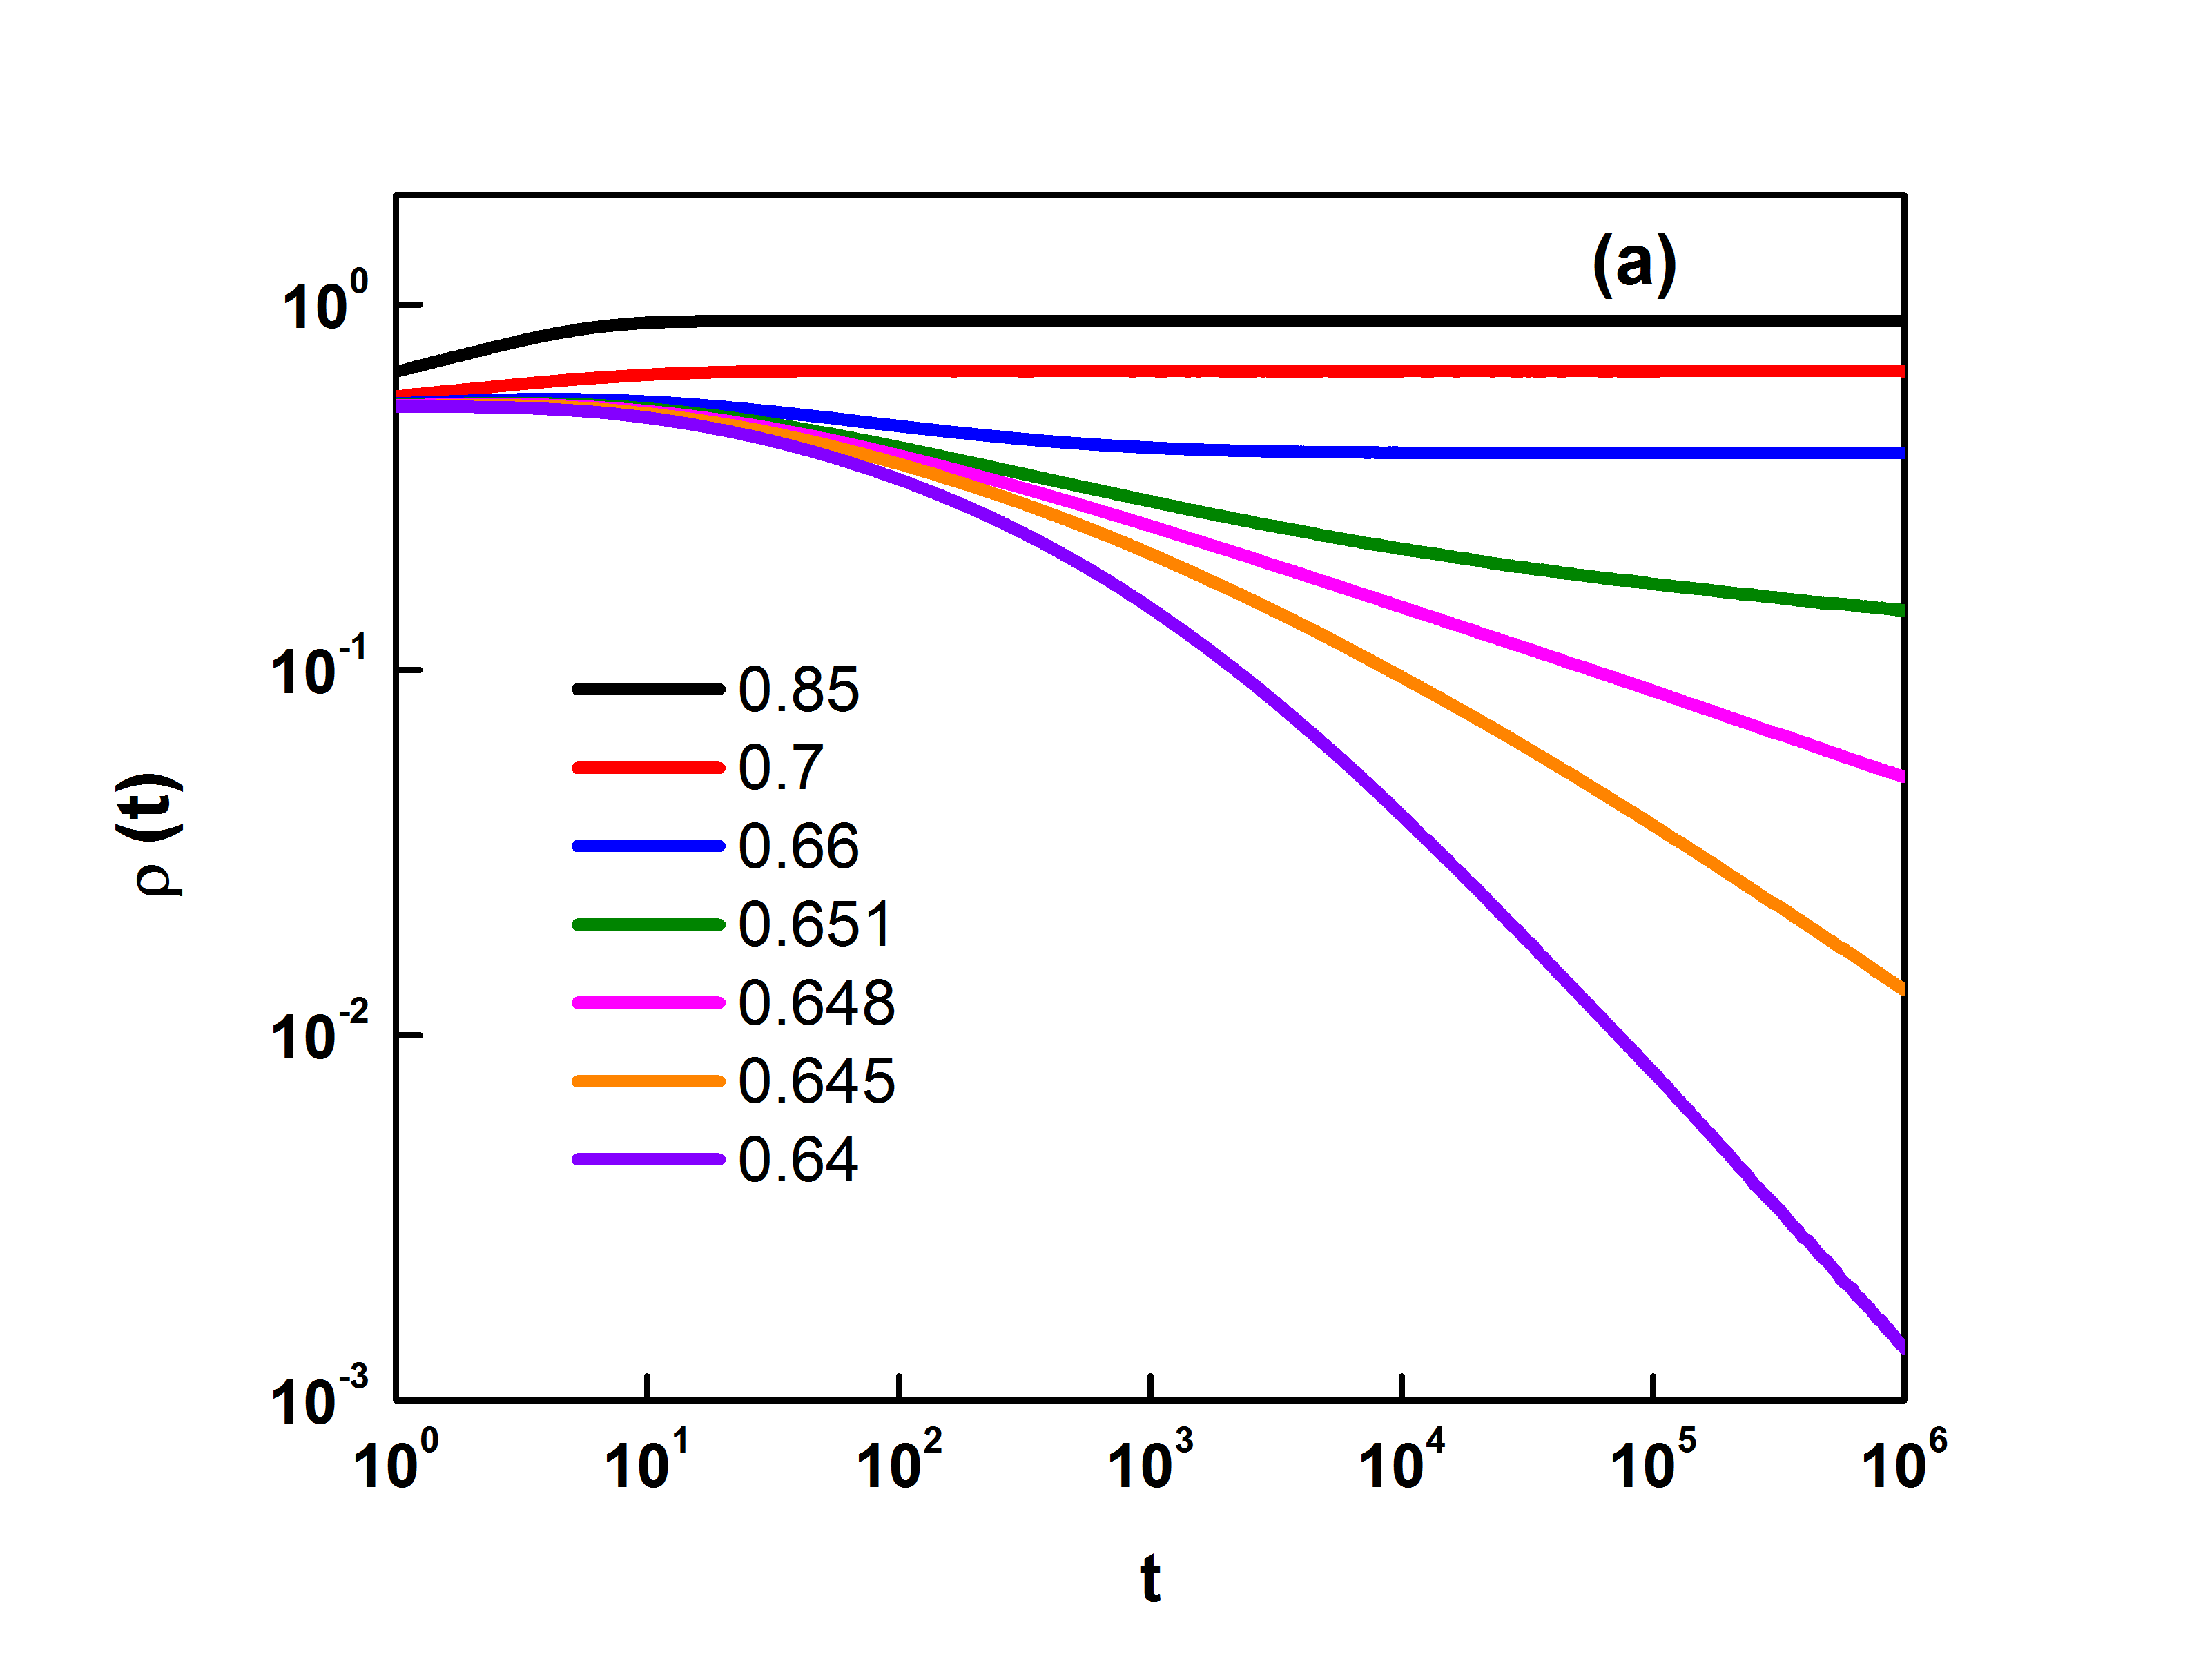
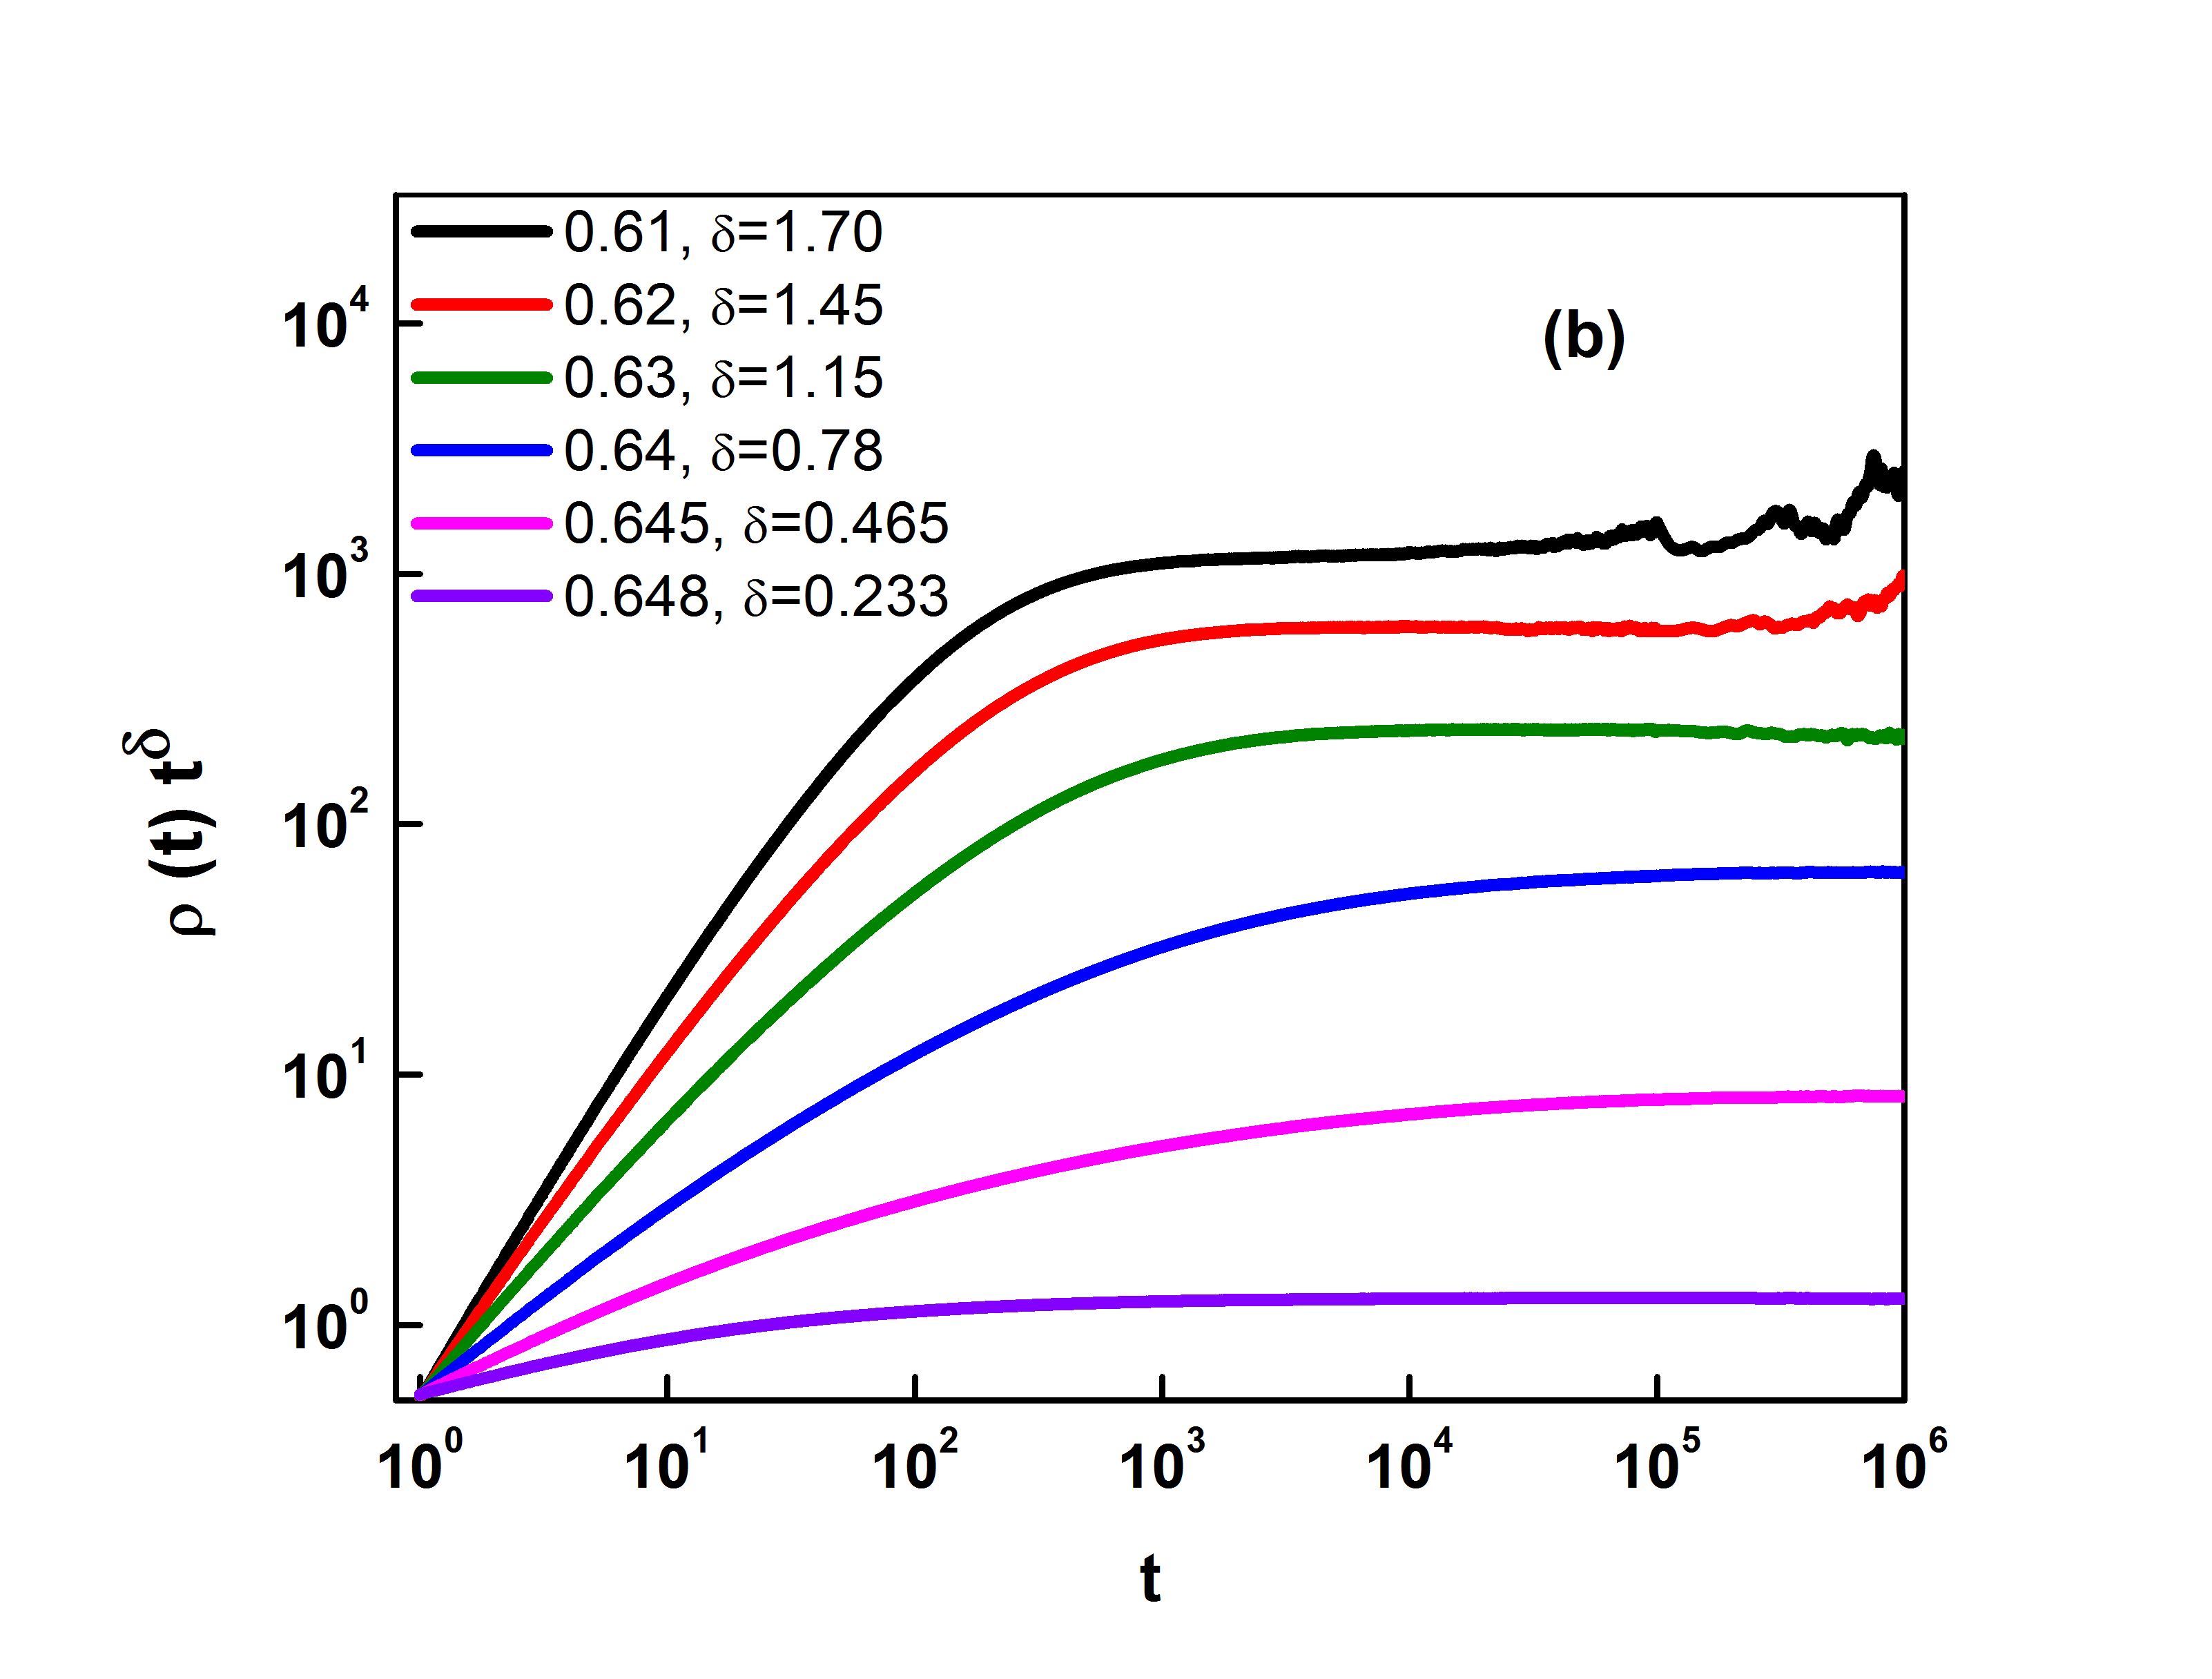
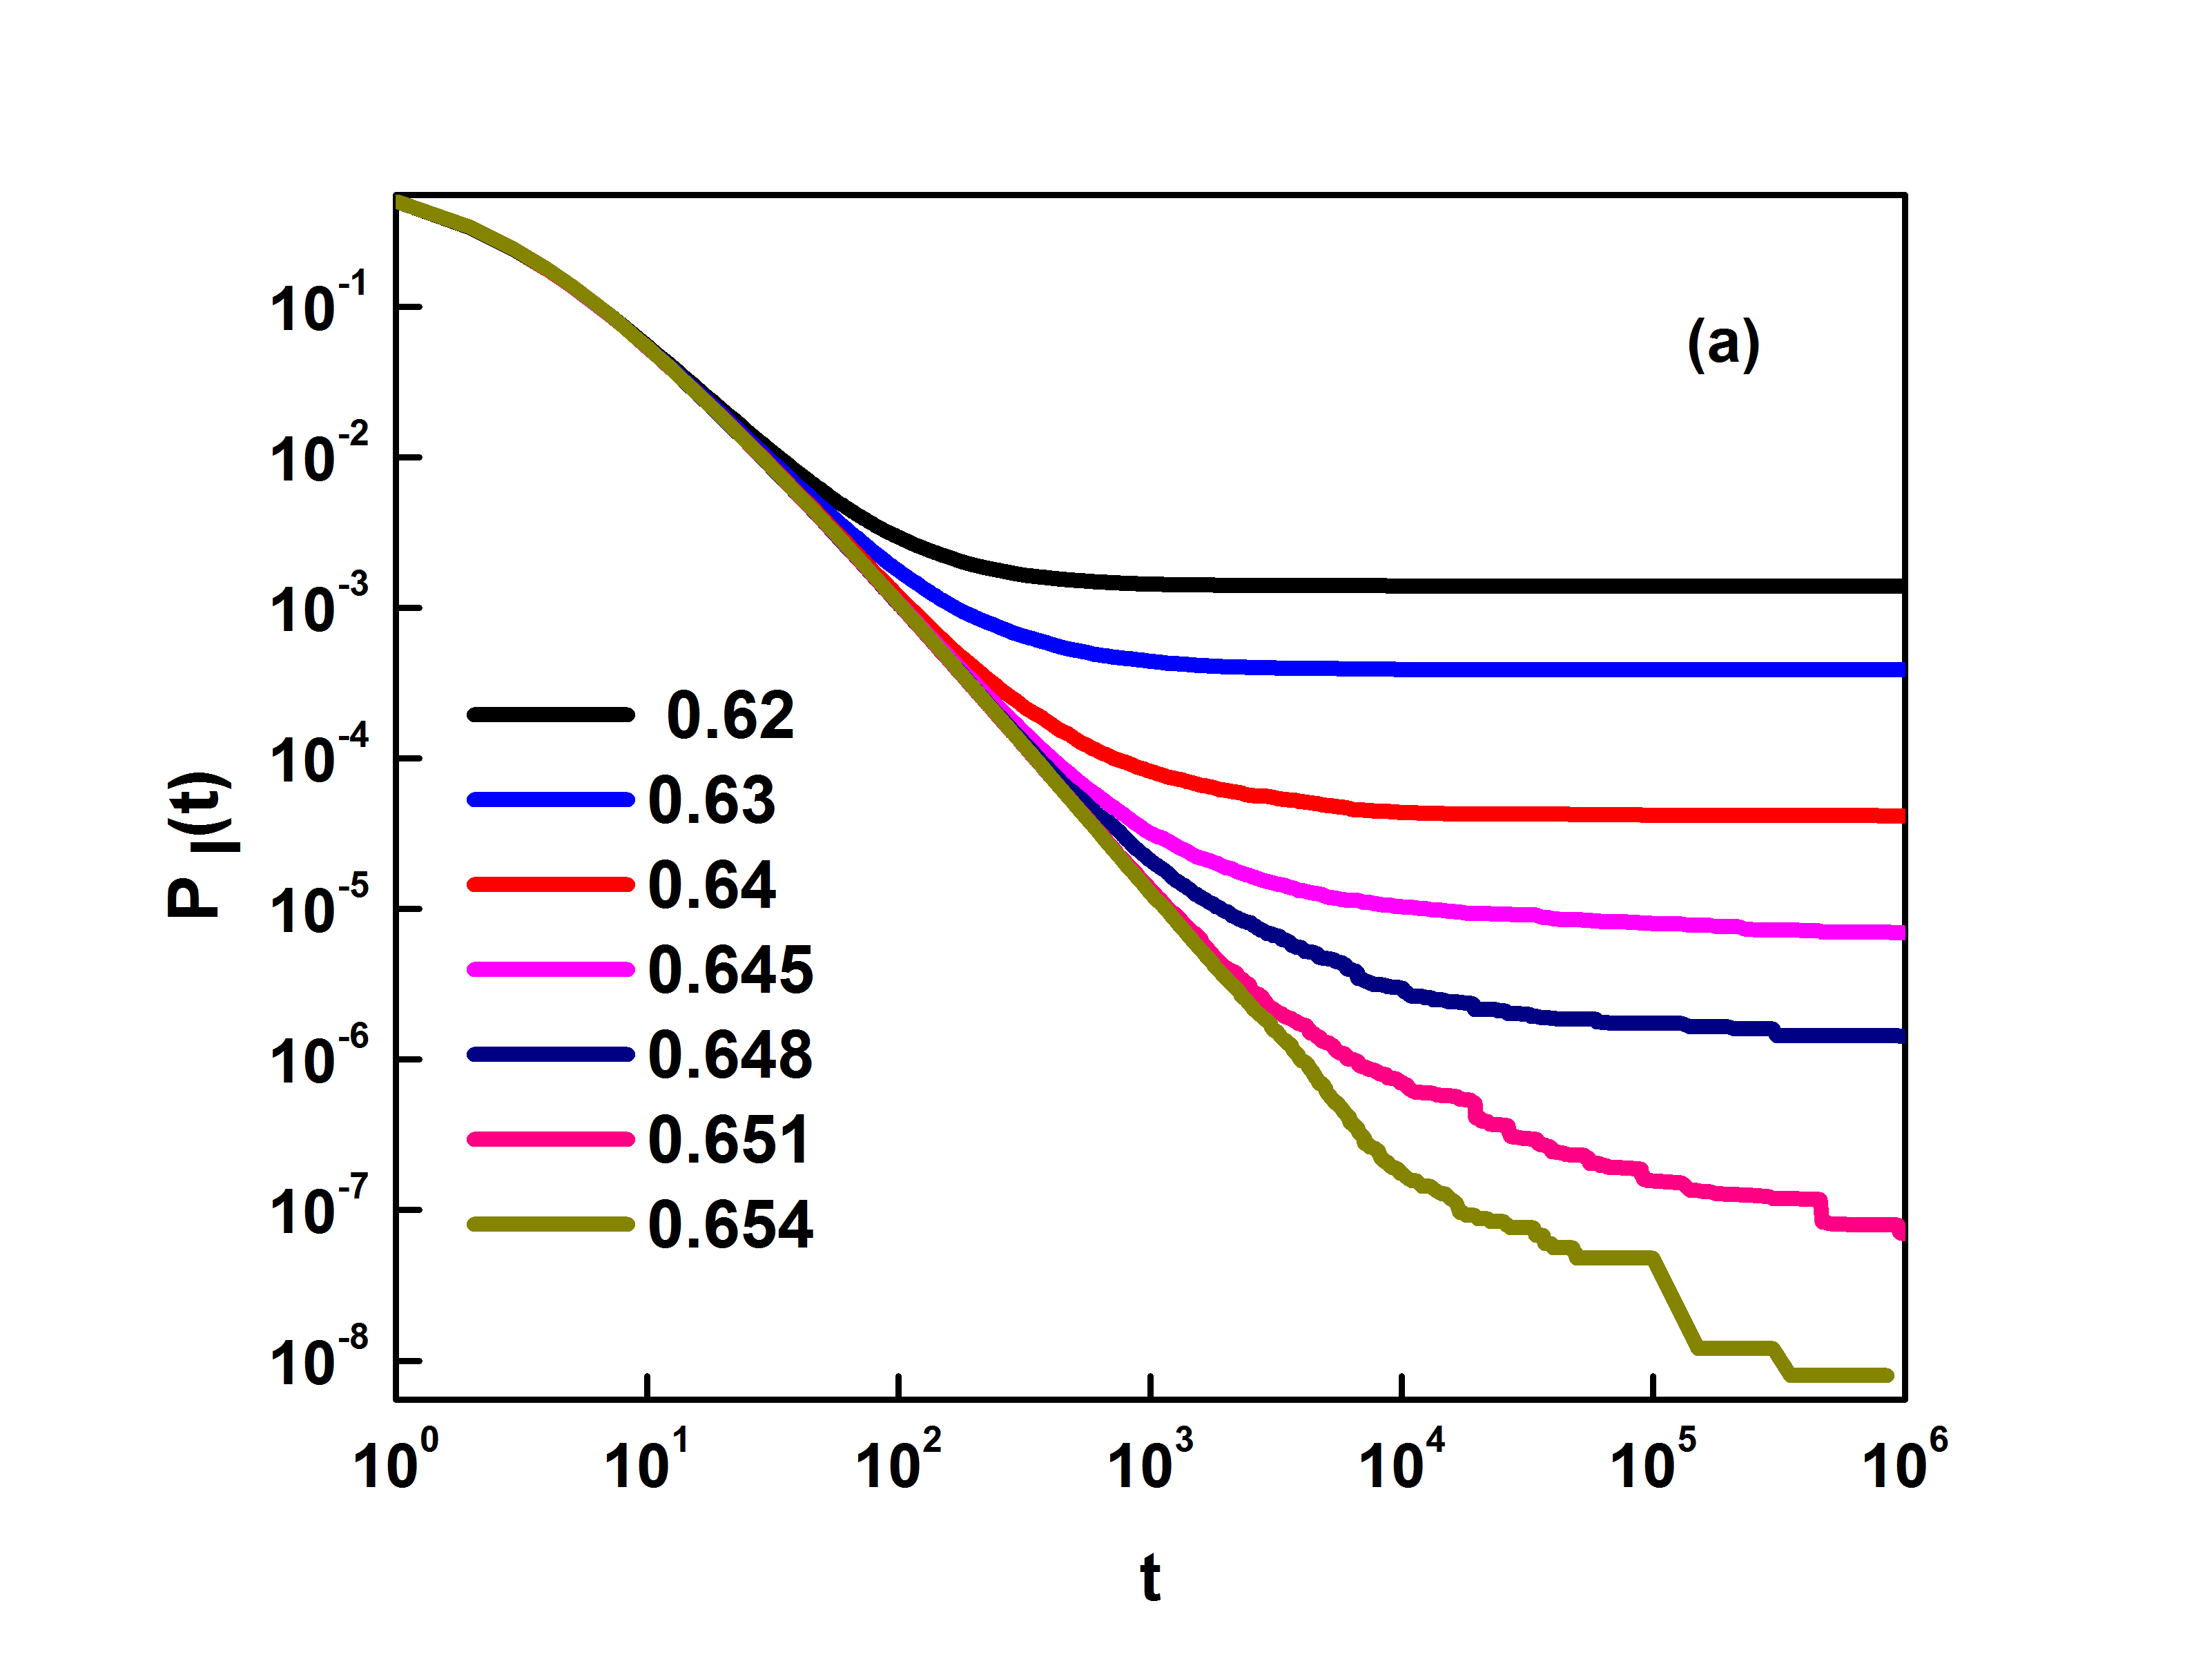
(a) The absorbing state transition: For , all sites become eventually inactive and the evolution stops. Normally, we observe an exponential decay of for and a power-law decay is observed at . However, in our case, a power-law decay of is observed over a range of parameters below the critical point but not at the critical point, i.e. with decreasing , as . The regime in which the power-law decay of with changing exponents is observed is known as the Griffiths phase. The relaxation behavior changes to stretched exponential and eventually to exponential for very small values of . Fig.1(a) shows the density of active sites vs time on logarithmic scale for various values of . Relaxation is slower as and . The power-law decay implies that approaches a constant value asymptotically. This expectation is indeed fulfilled. Fig.1(b) shows with on logarithmic scale for , close to . As , decreases.
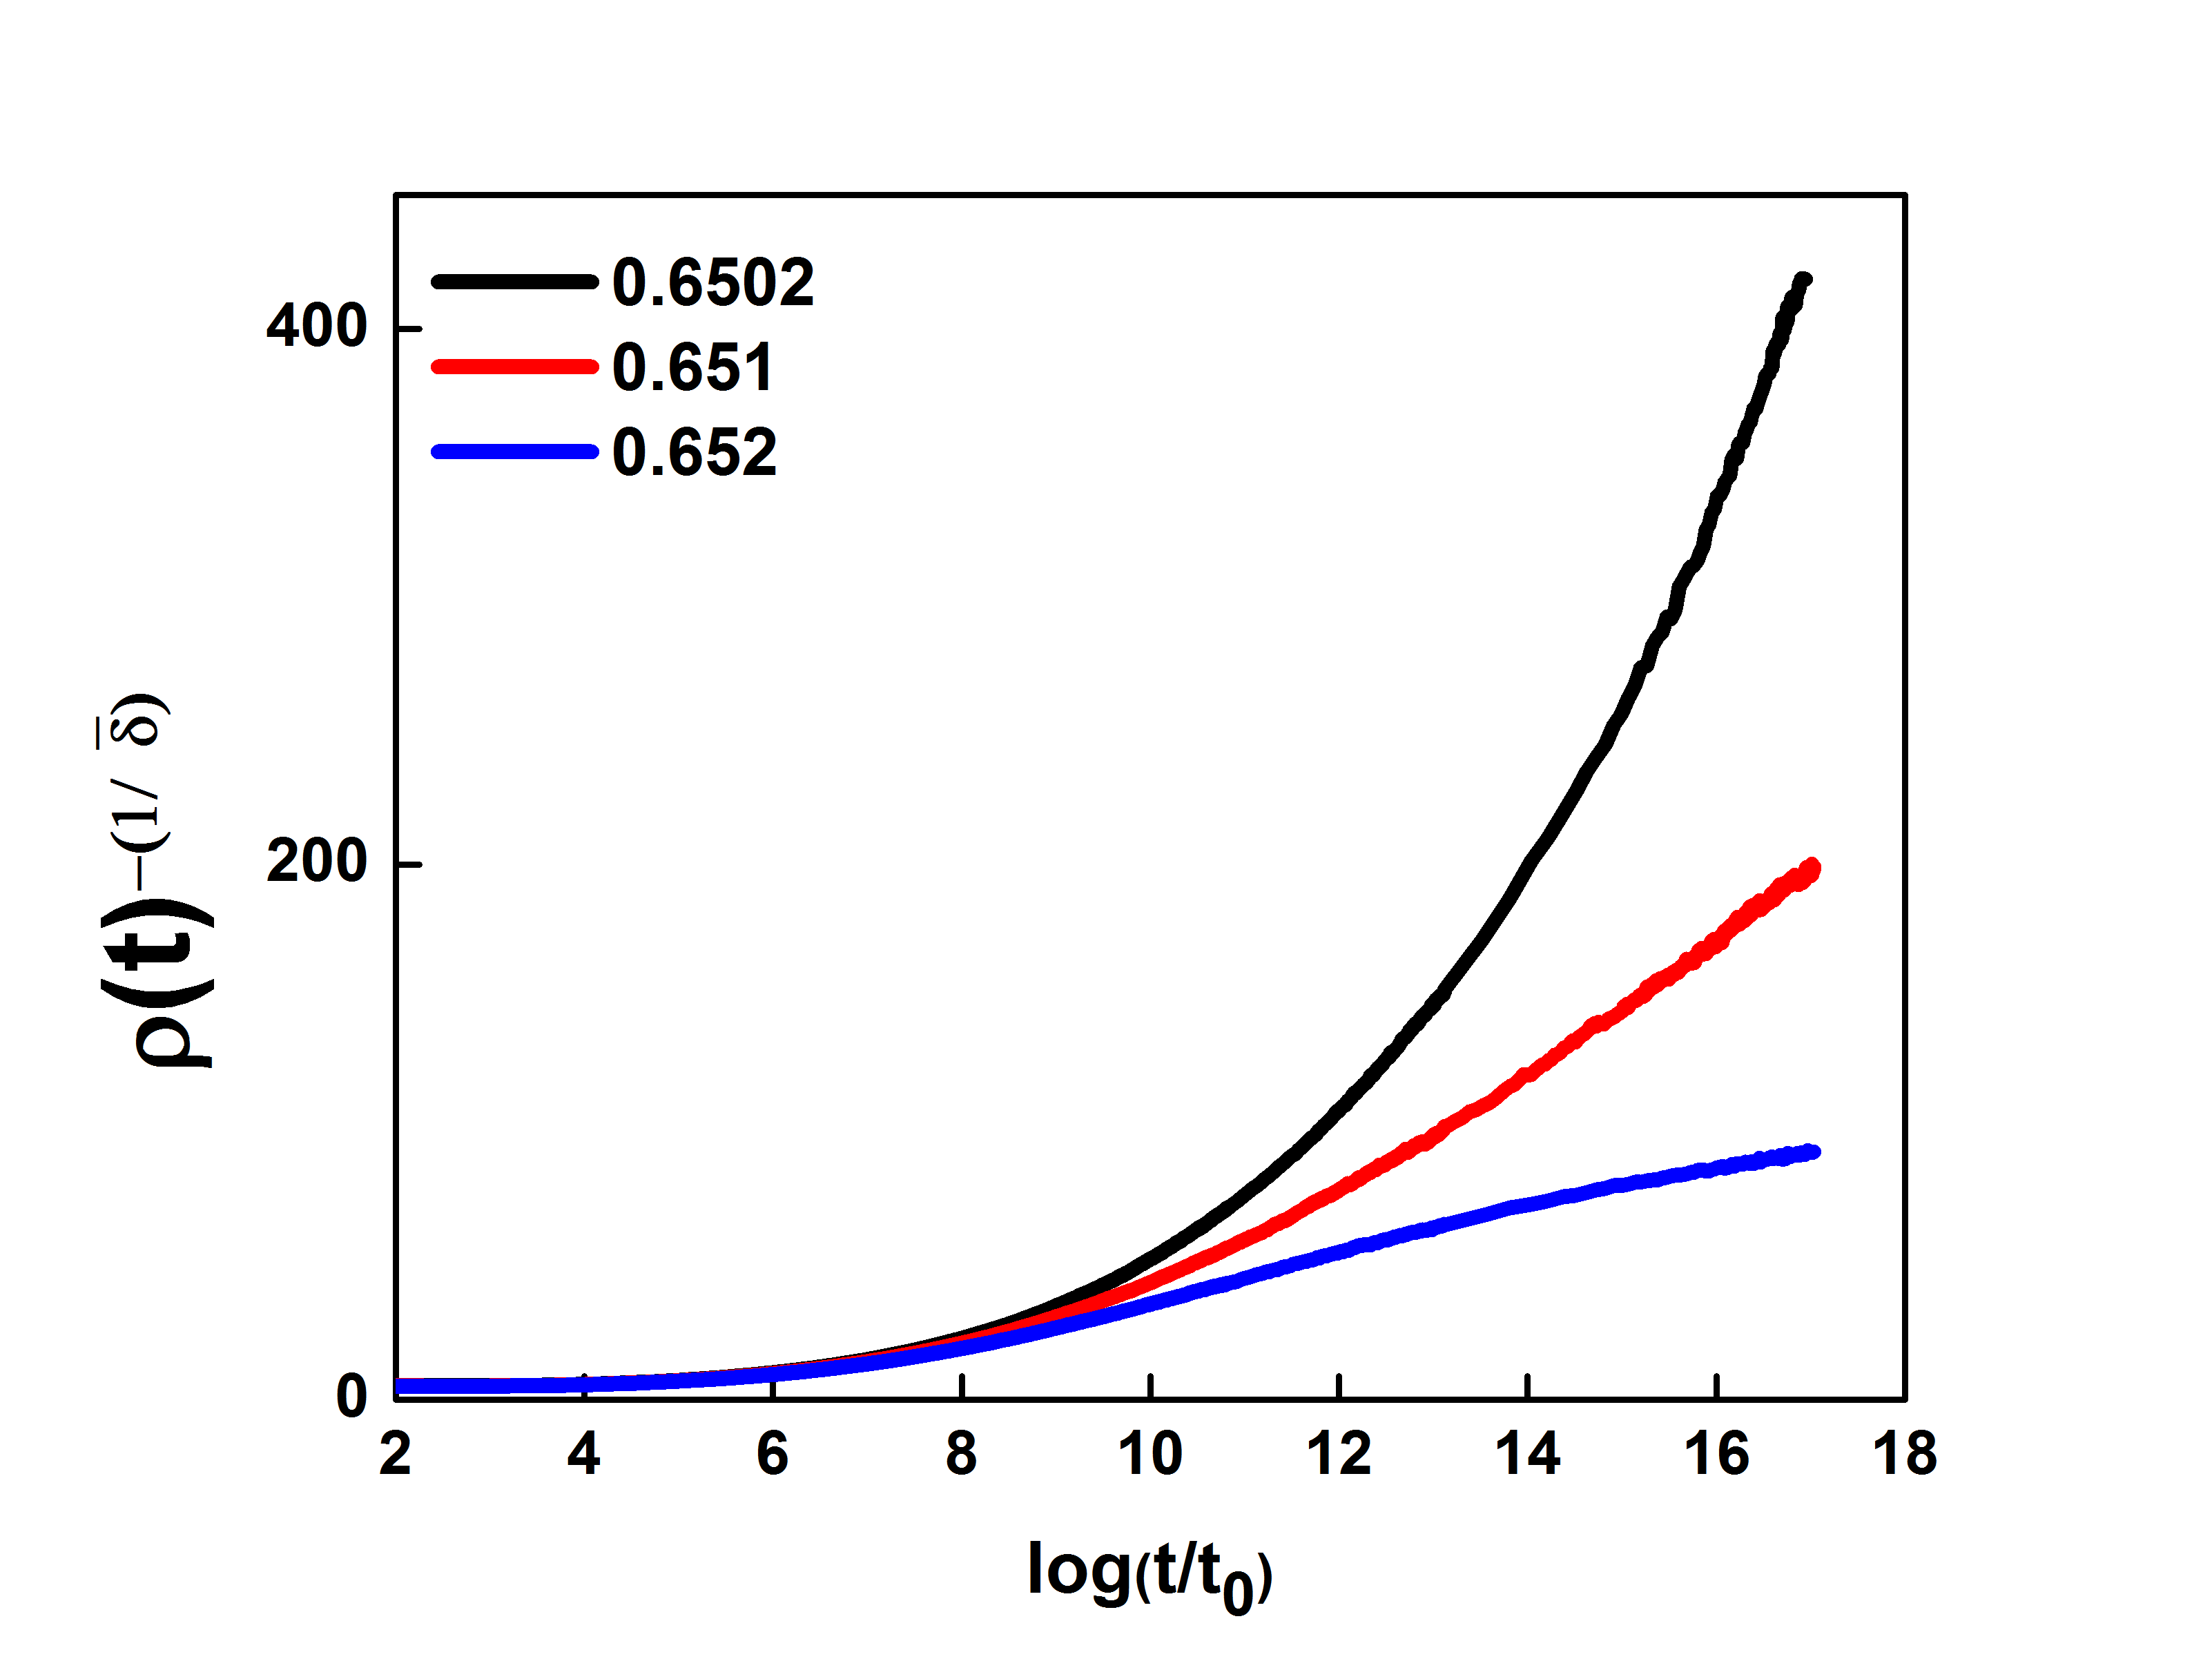
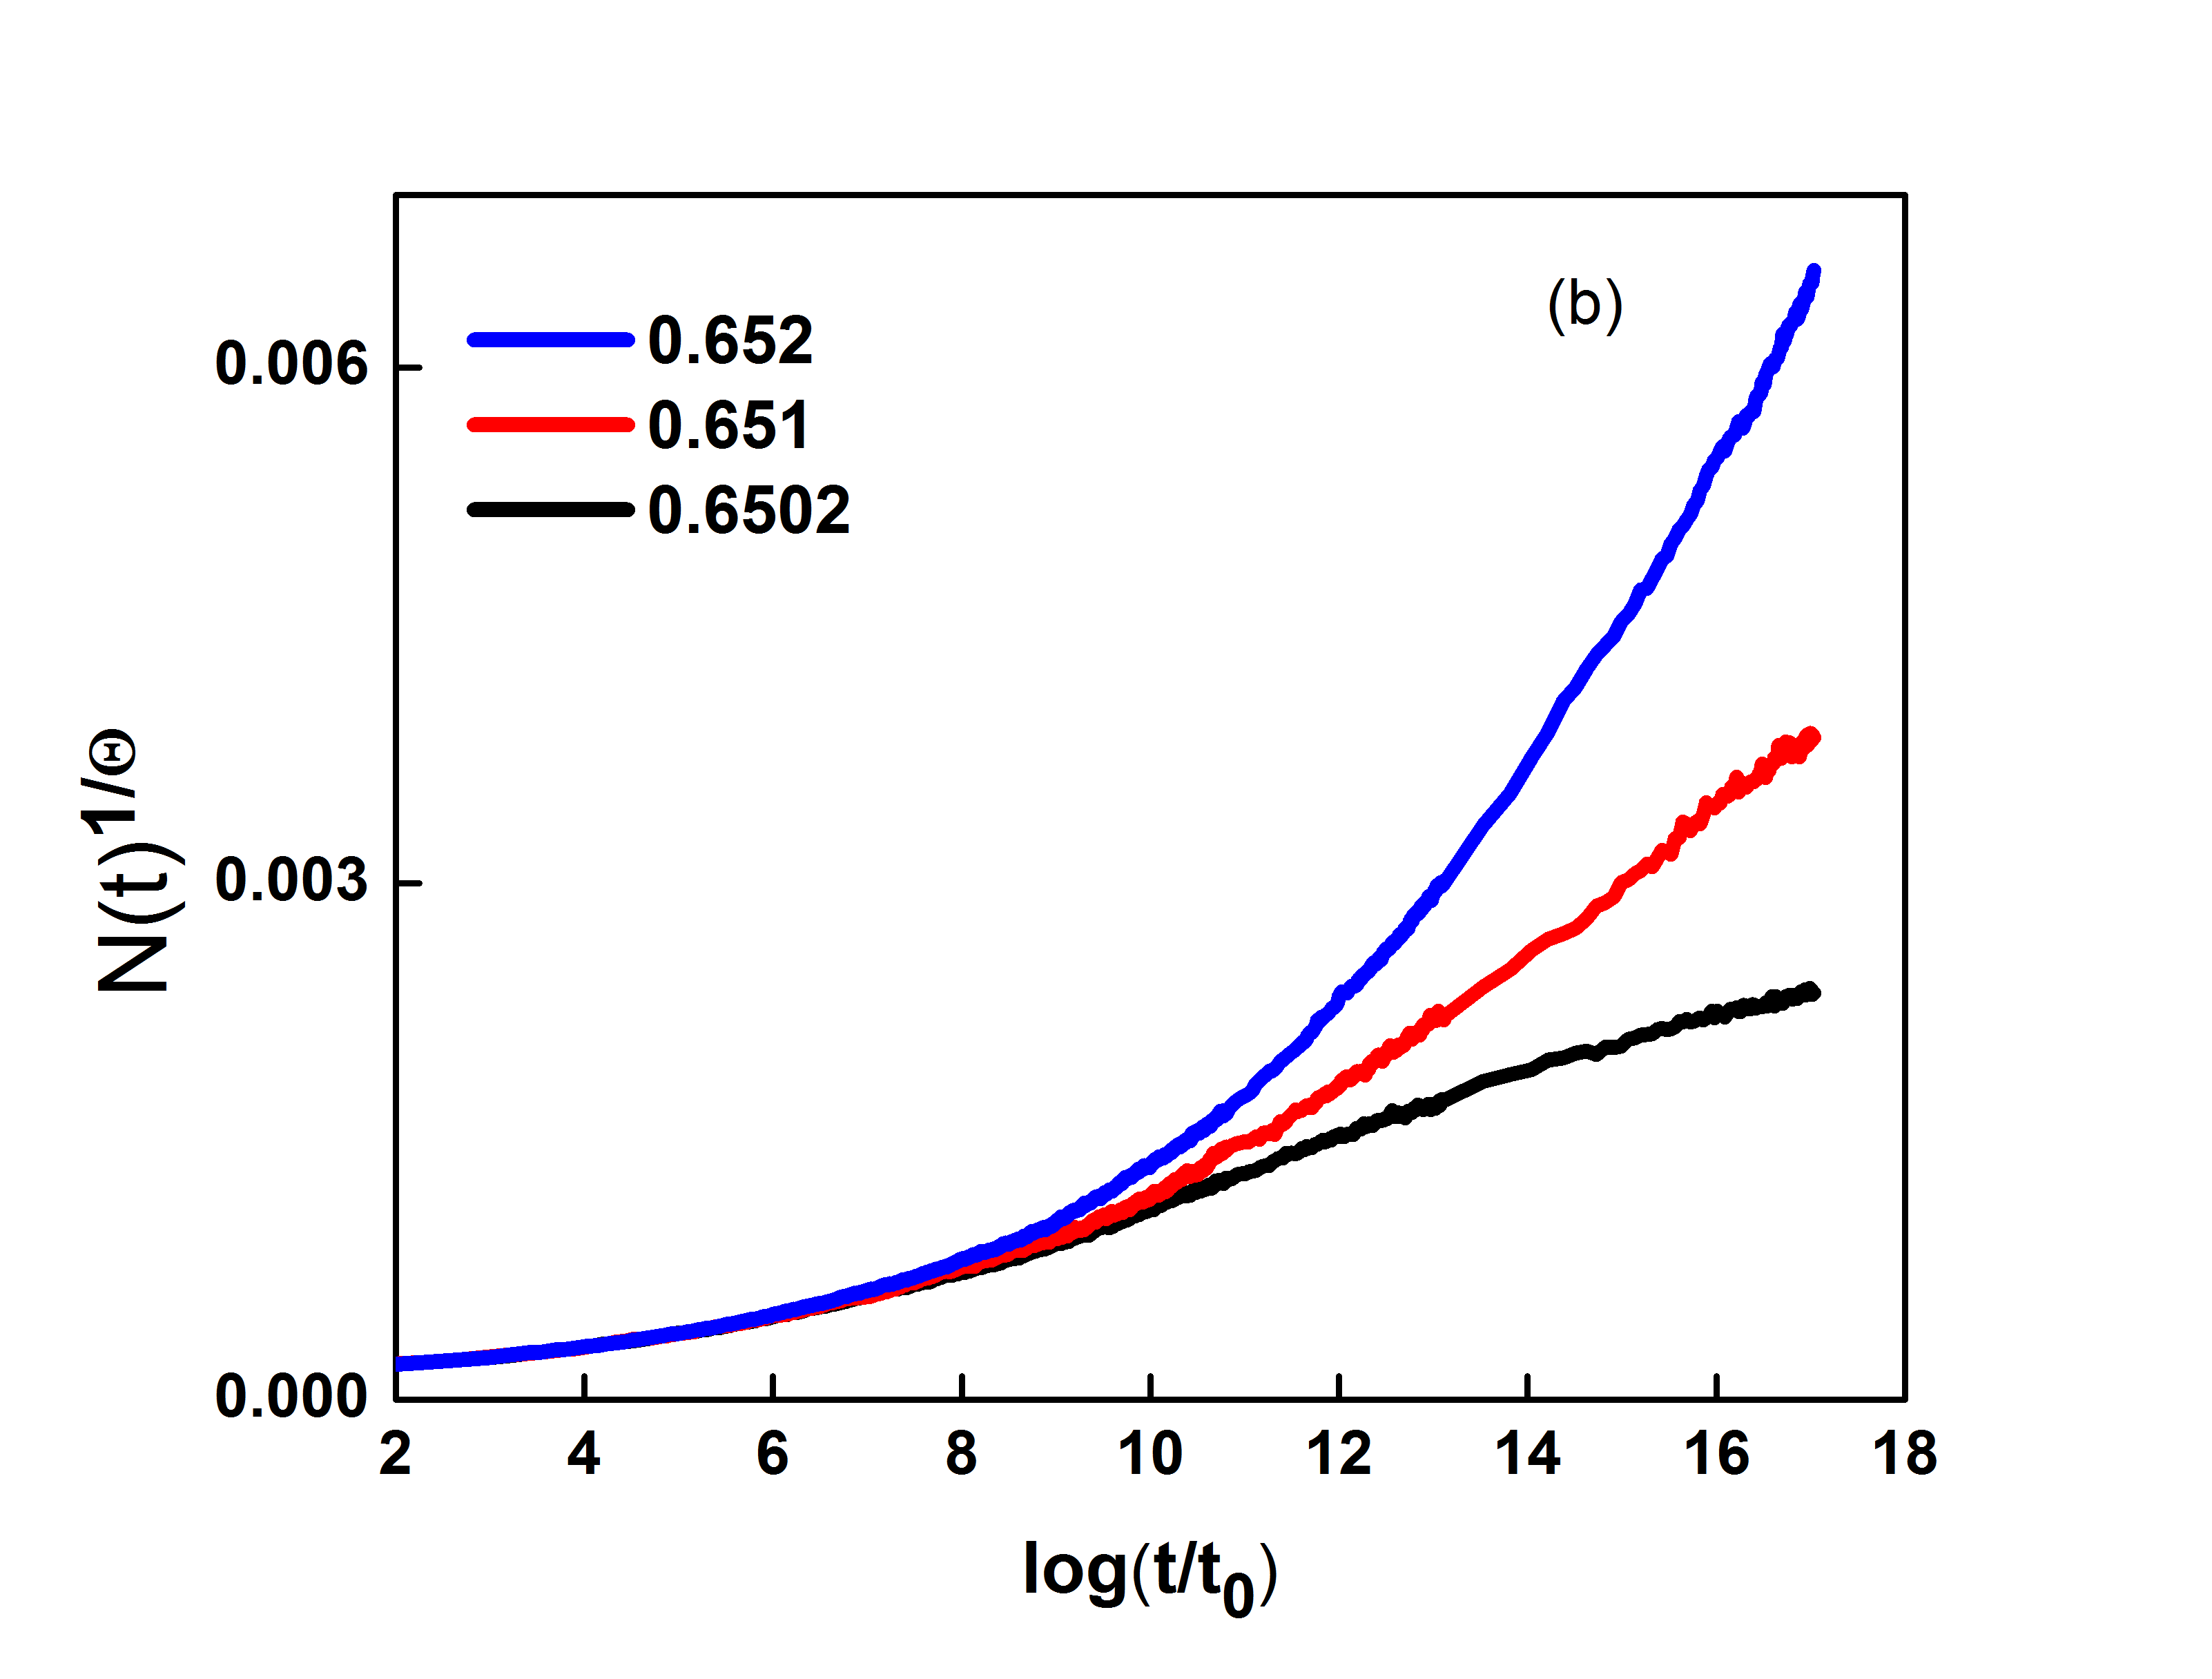
This transition has been confirmed by large lattice simulation mentioned above as well as by simulations starting with a single seed. At the relaxation is ultra-slow. For a large lattice of size , we observe logarithmic decay of at . The transition is expected to be in the universality class of activated scaling Vojta and Dickison (2005); Vojta et al. (2009); Hooyberghs et al. (2004, 2003). For this class, the the proposed behavior is . Thus, if we plot as a function of we observe linear behavior only at the critical point. In Fig.2, we have plotted as a function of Fig with at , and . The value is close to previously obtained value .
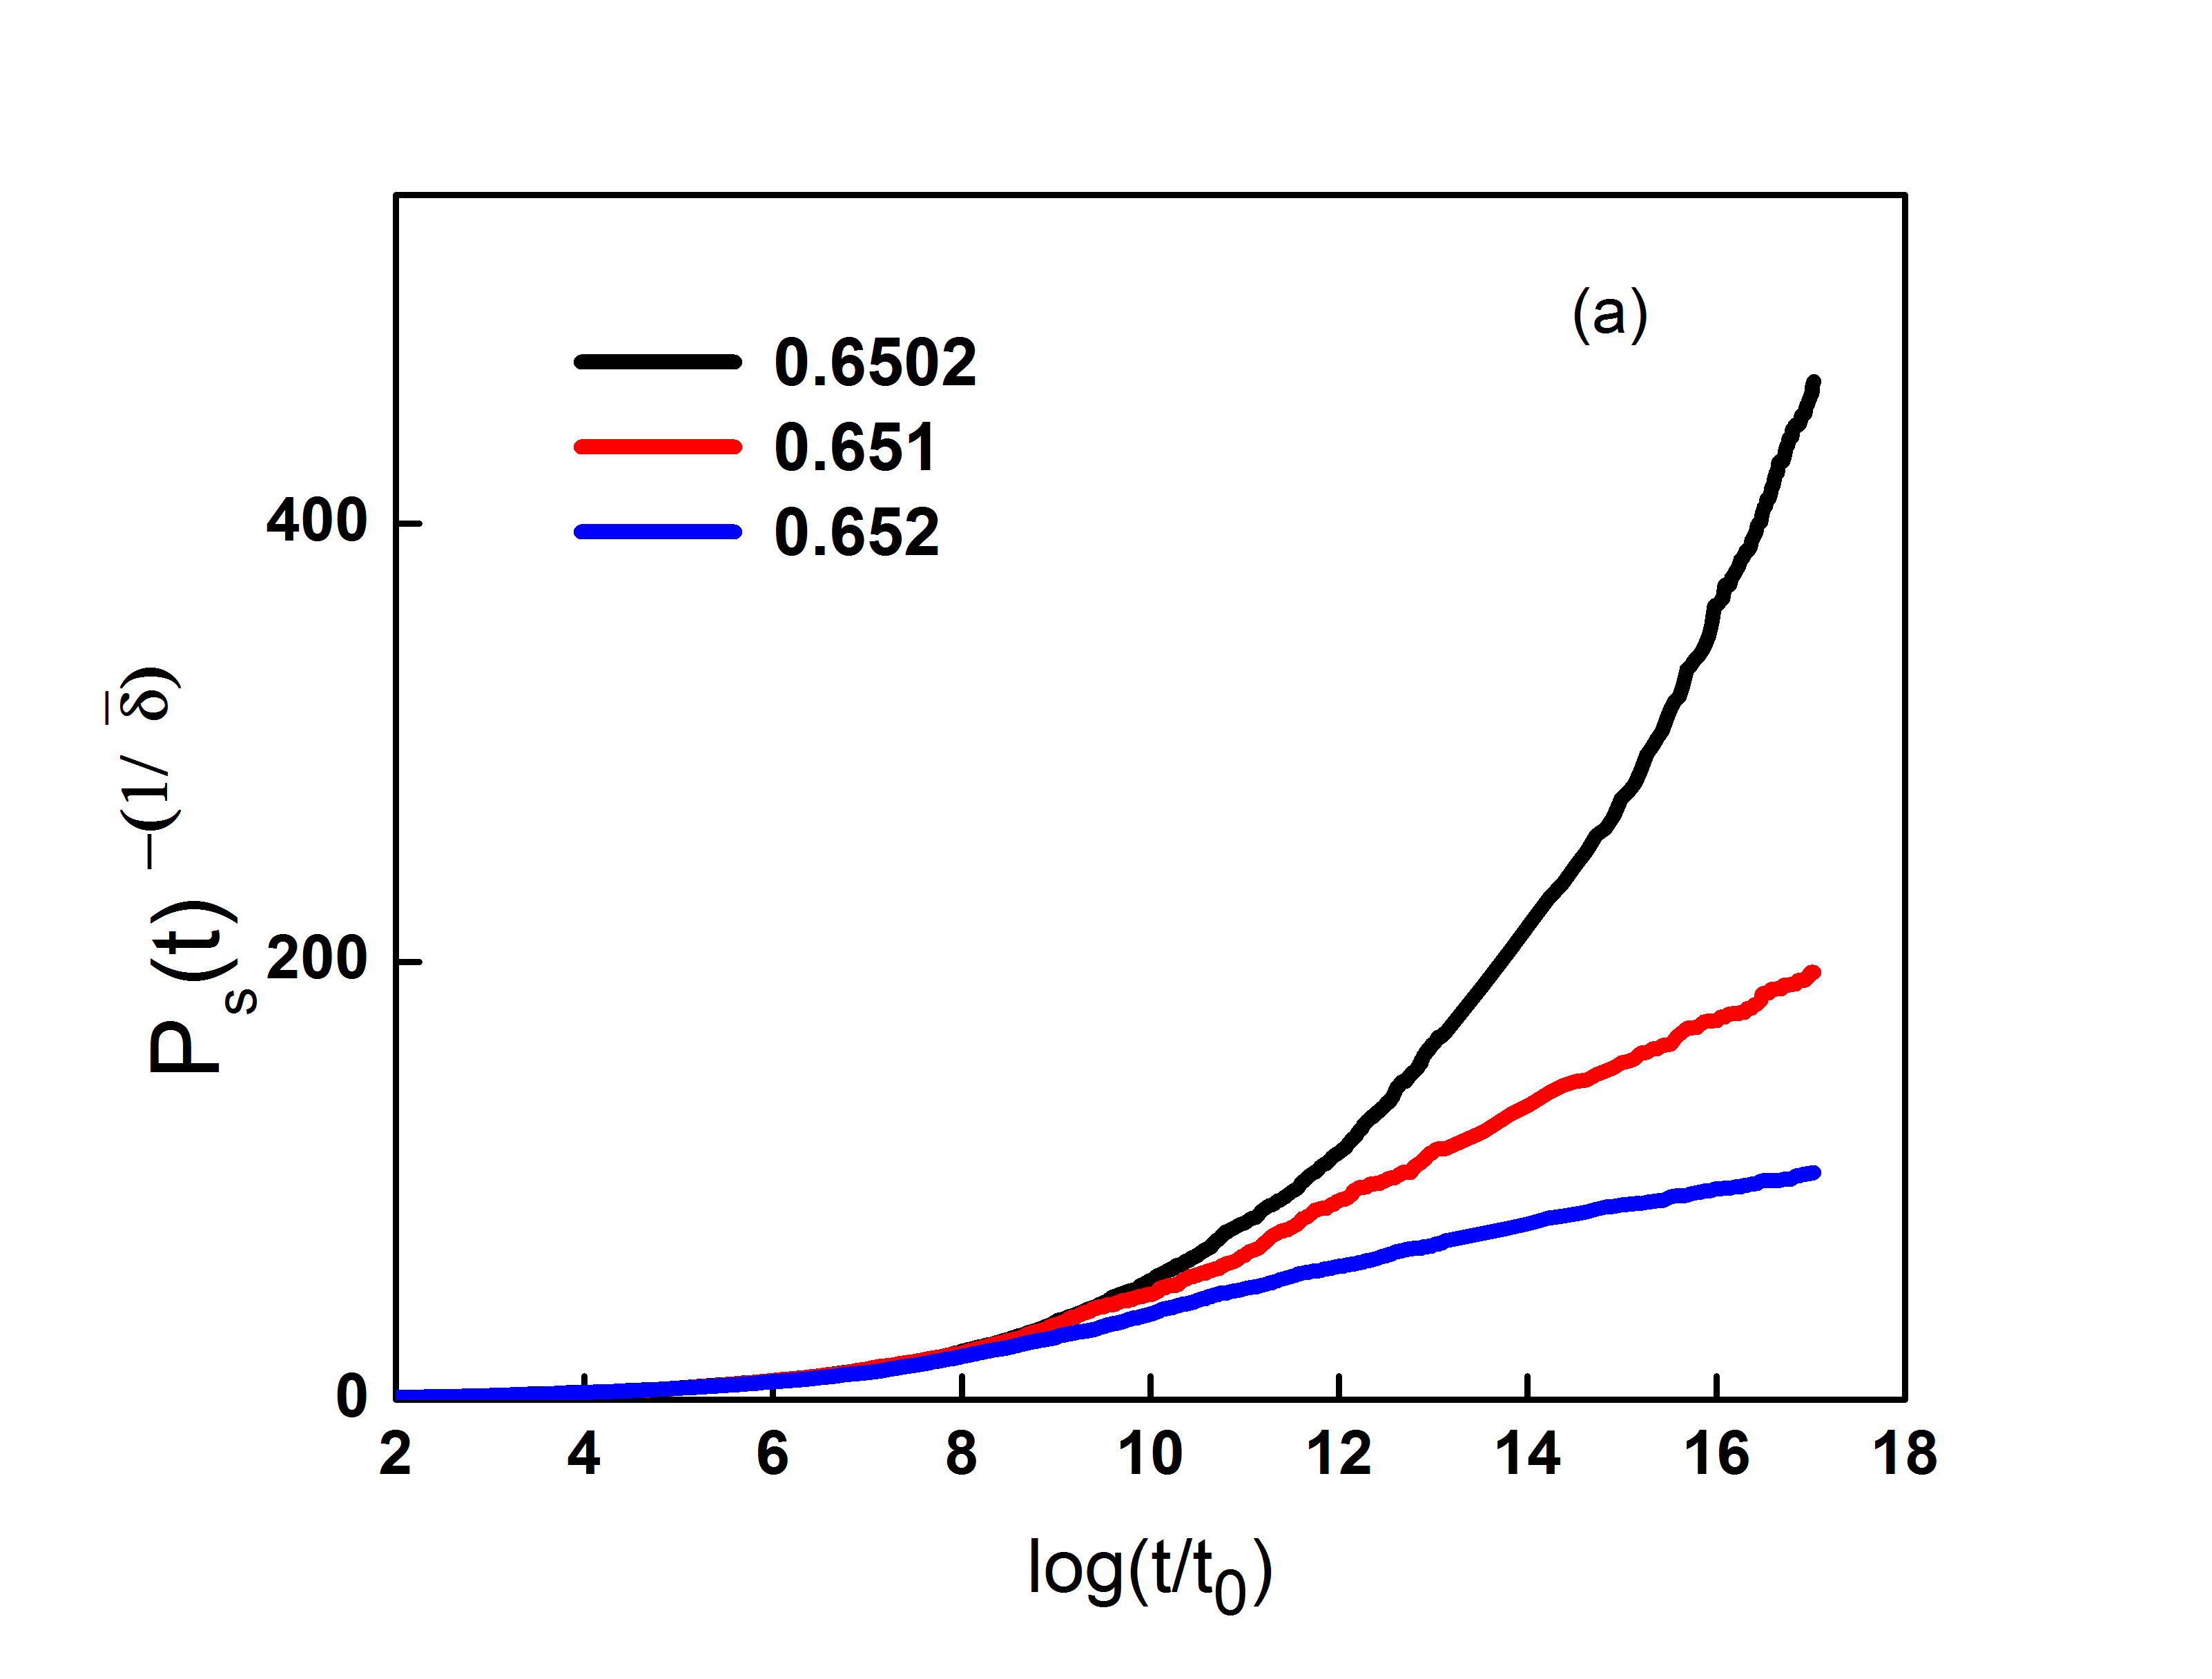
Due to logarithmic decay, it is extremely difficult to locate the critical point precisely and further tests are required to locate it. We confirm the above value with single seed simulations. We compute (a)the survival probability (fraction of clusters surviving till time ) and (b) the average number of particle in a cluster starting from single seed . At , (a) the quantity is expected to decay asymptotically as and (b) decays as . Again we plot as a function of and obtain linear behavior only for (See Fig.3(a)). Similarly, if we plot as a function of , a linear behavior is expected only at . We observe that for , and , linear behavior is obtained only at . (See Fig.3(b)). The values of and match with those expected in the class of activated scaling Hooyberghs et al. (2004, 2003). Thus, we confirm in three different ways using both large lattice simulations as well as single seed simulations.
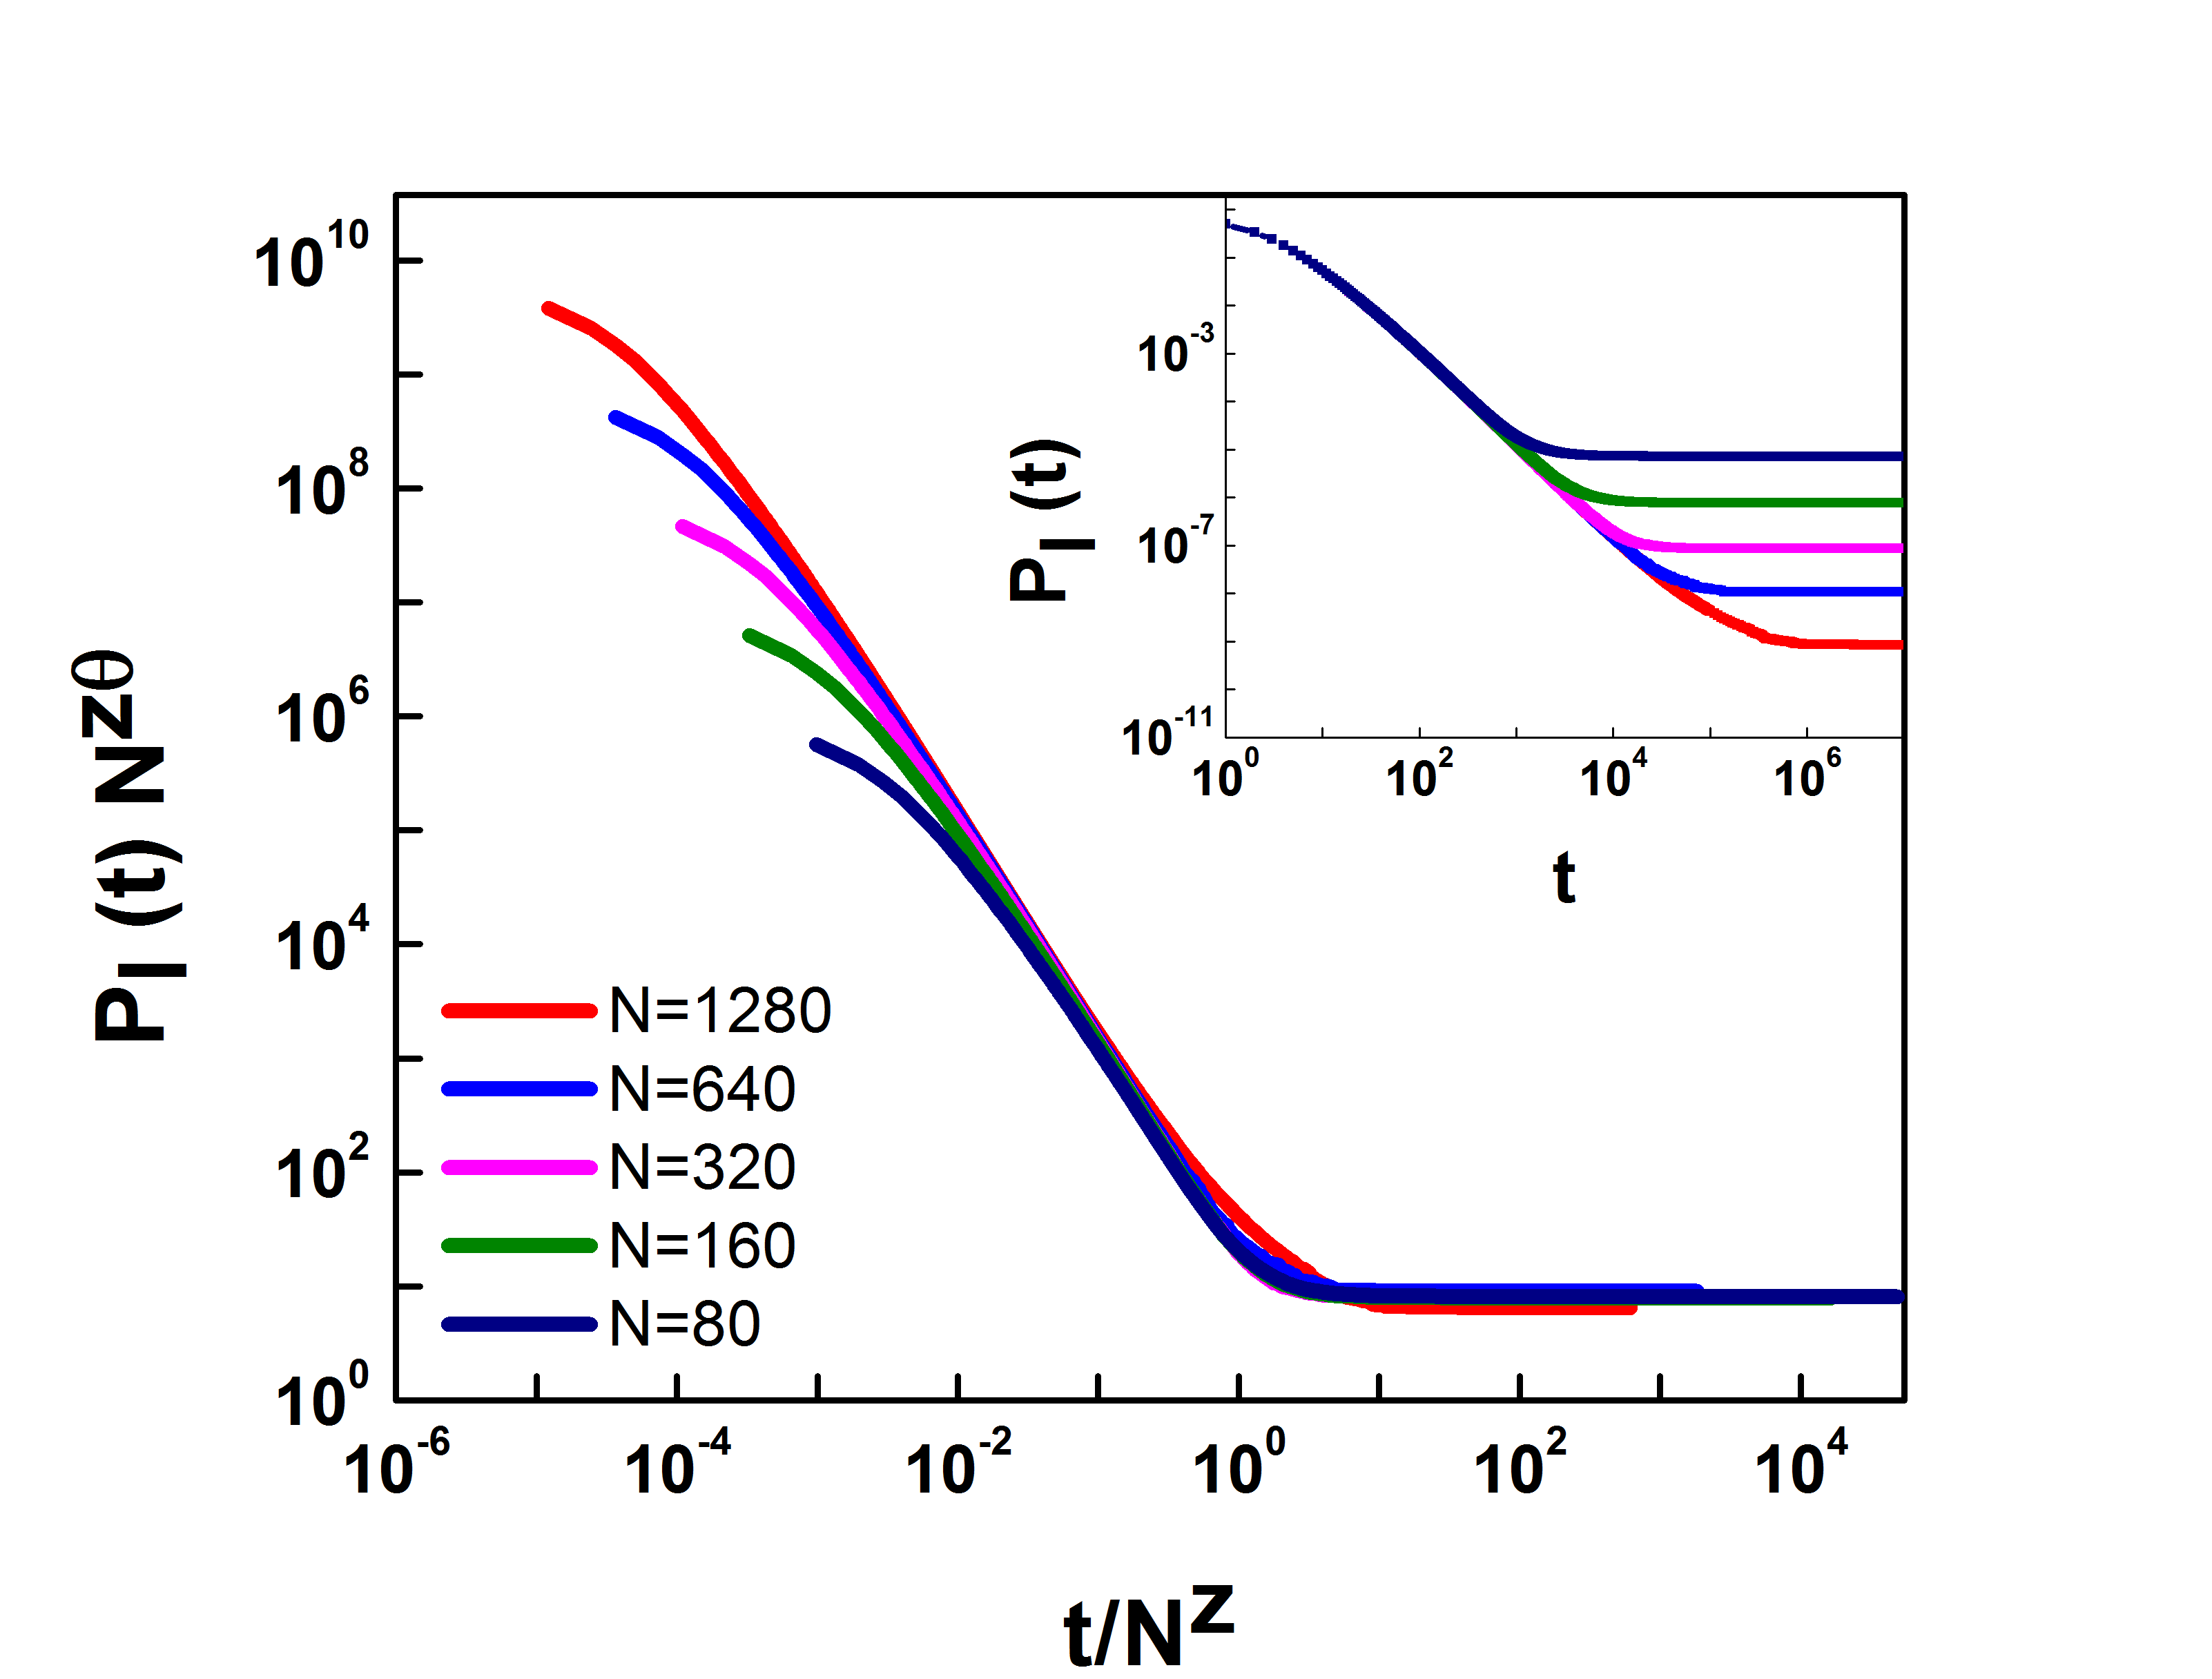
(b) Persistence: We compute as a function of time for a large system of size . Usually, the absorbing state transition is accompanied by the spreading transition. (In the active phase, we expect the inactive sites can be expected to become active at some time and the active sites will become inactive due to fluctuation.) Since the active sites decay logarithmically at , the persistence decays very slowly at the critical point and cannot be fitted by a power law. However,we observe a clear power law decay of persistence for . We can even observe finite size scaling of persistence at , For , we show the asymptotic value of persistence at various system sizes N. We observe a power-law decay of as a function of and it saturates for in the thermodynamic limit (See inset of Fig.4). If we expect finite size scaling, we can postulate that . We find that and implying that . ( indicating superdiffusive behavior. For 1-D DP, .) Fig.4 show the scaling plot of with . Such scaling is not obtained for other values of .
In general, persistence shows exponential decay in the active phase. The power-law decay is observed only at the critical point. But our case is different. Near , the persistence decay is slower than logarithmic in active state. This is because active sites spread logarithmically in time and and it takes very long for inactive sites to become active. Thus persistence is dominated by inactive sites which did nit become active till that time. We denote persistence of type A (CDP) sites with initial state 1 and 0 by and respectively. We define and in an analogous manner for DP sites of type B. is the sum of these four quantities. The total persistence is found to be dictated by . The quantity deviate from the initial condition very slowly for . For , the evolution effectively stops as soon the system reaches absorbing state and a finite value of persistence is expected. For the persistence is expected to go to zero asymptotically. For it shows power law decay.
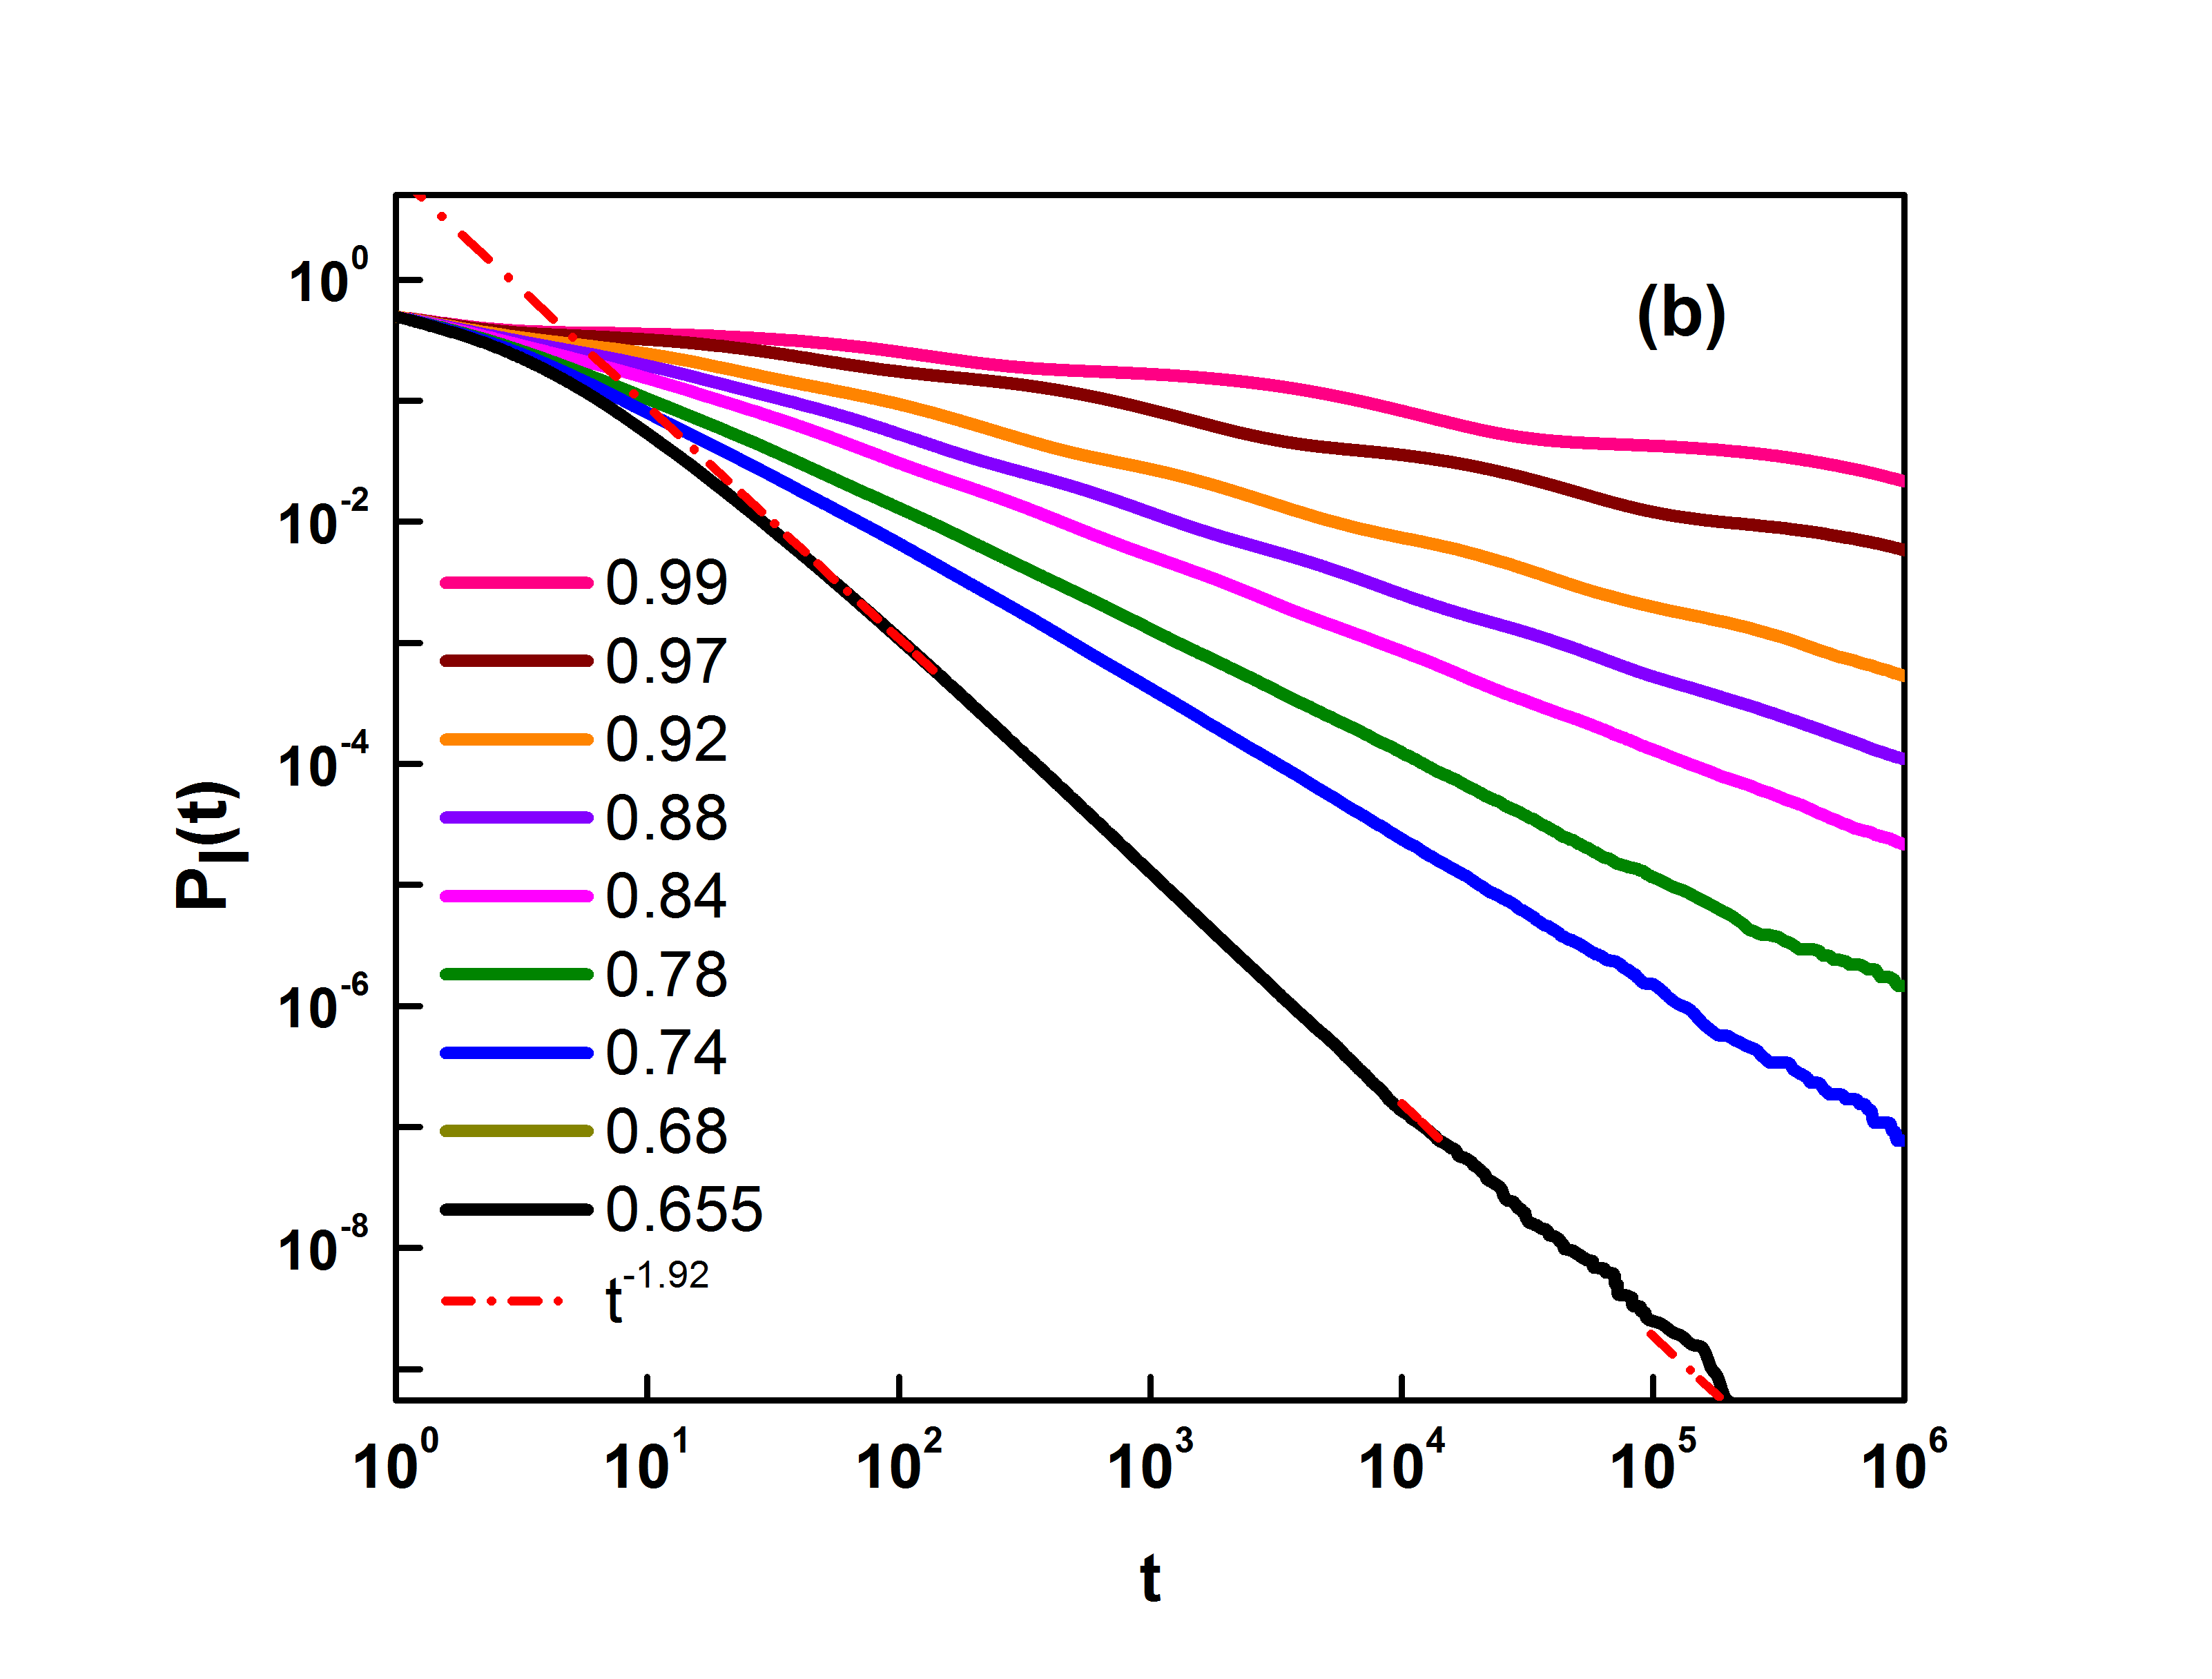
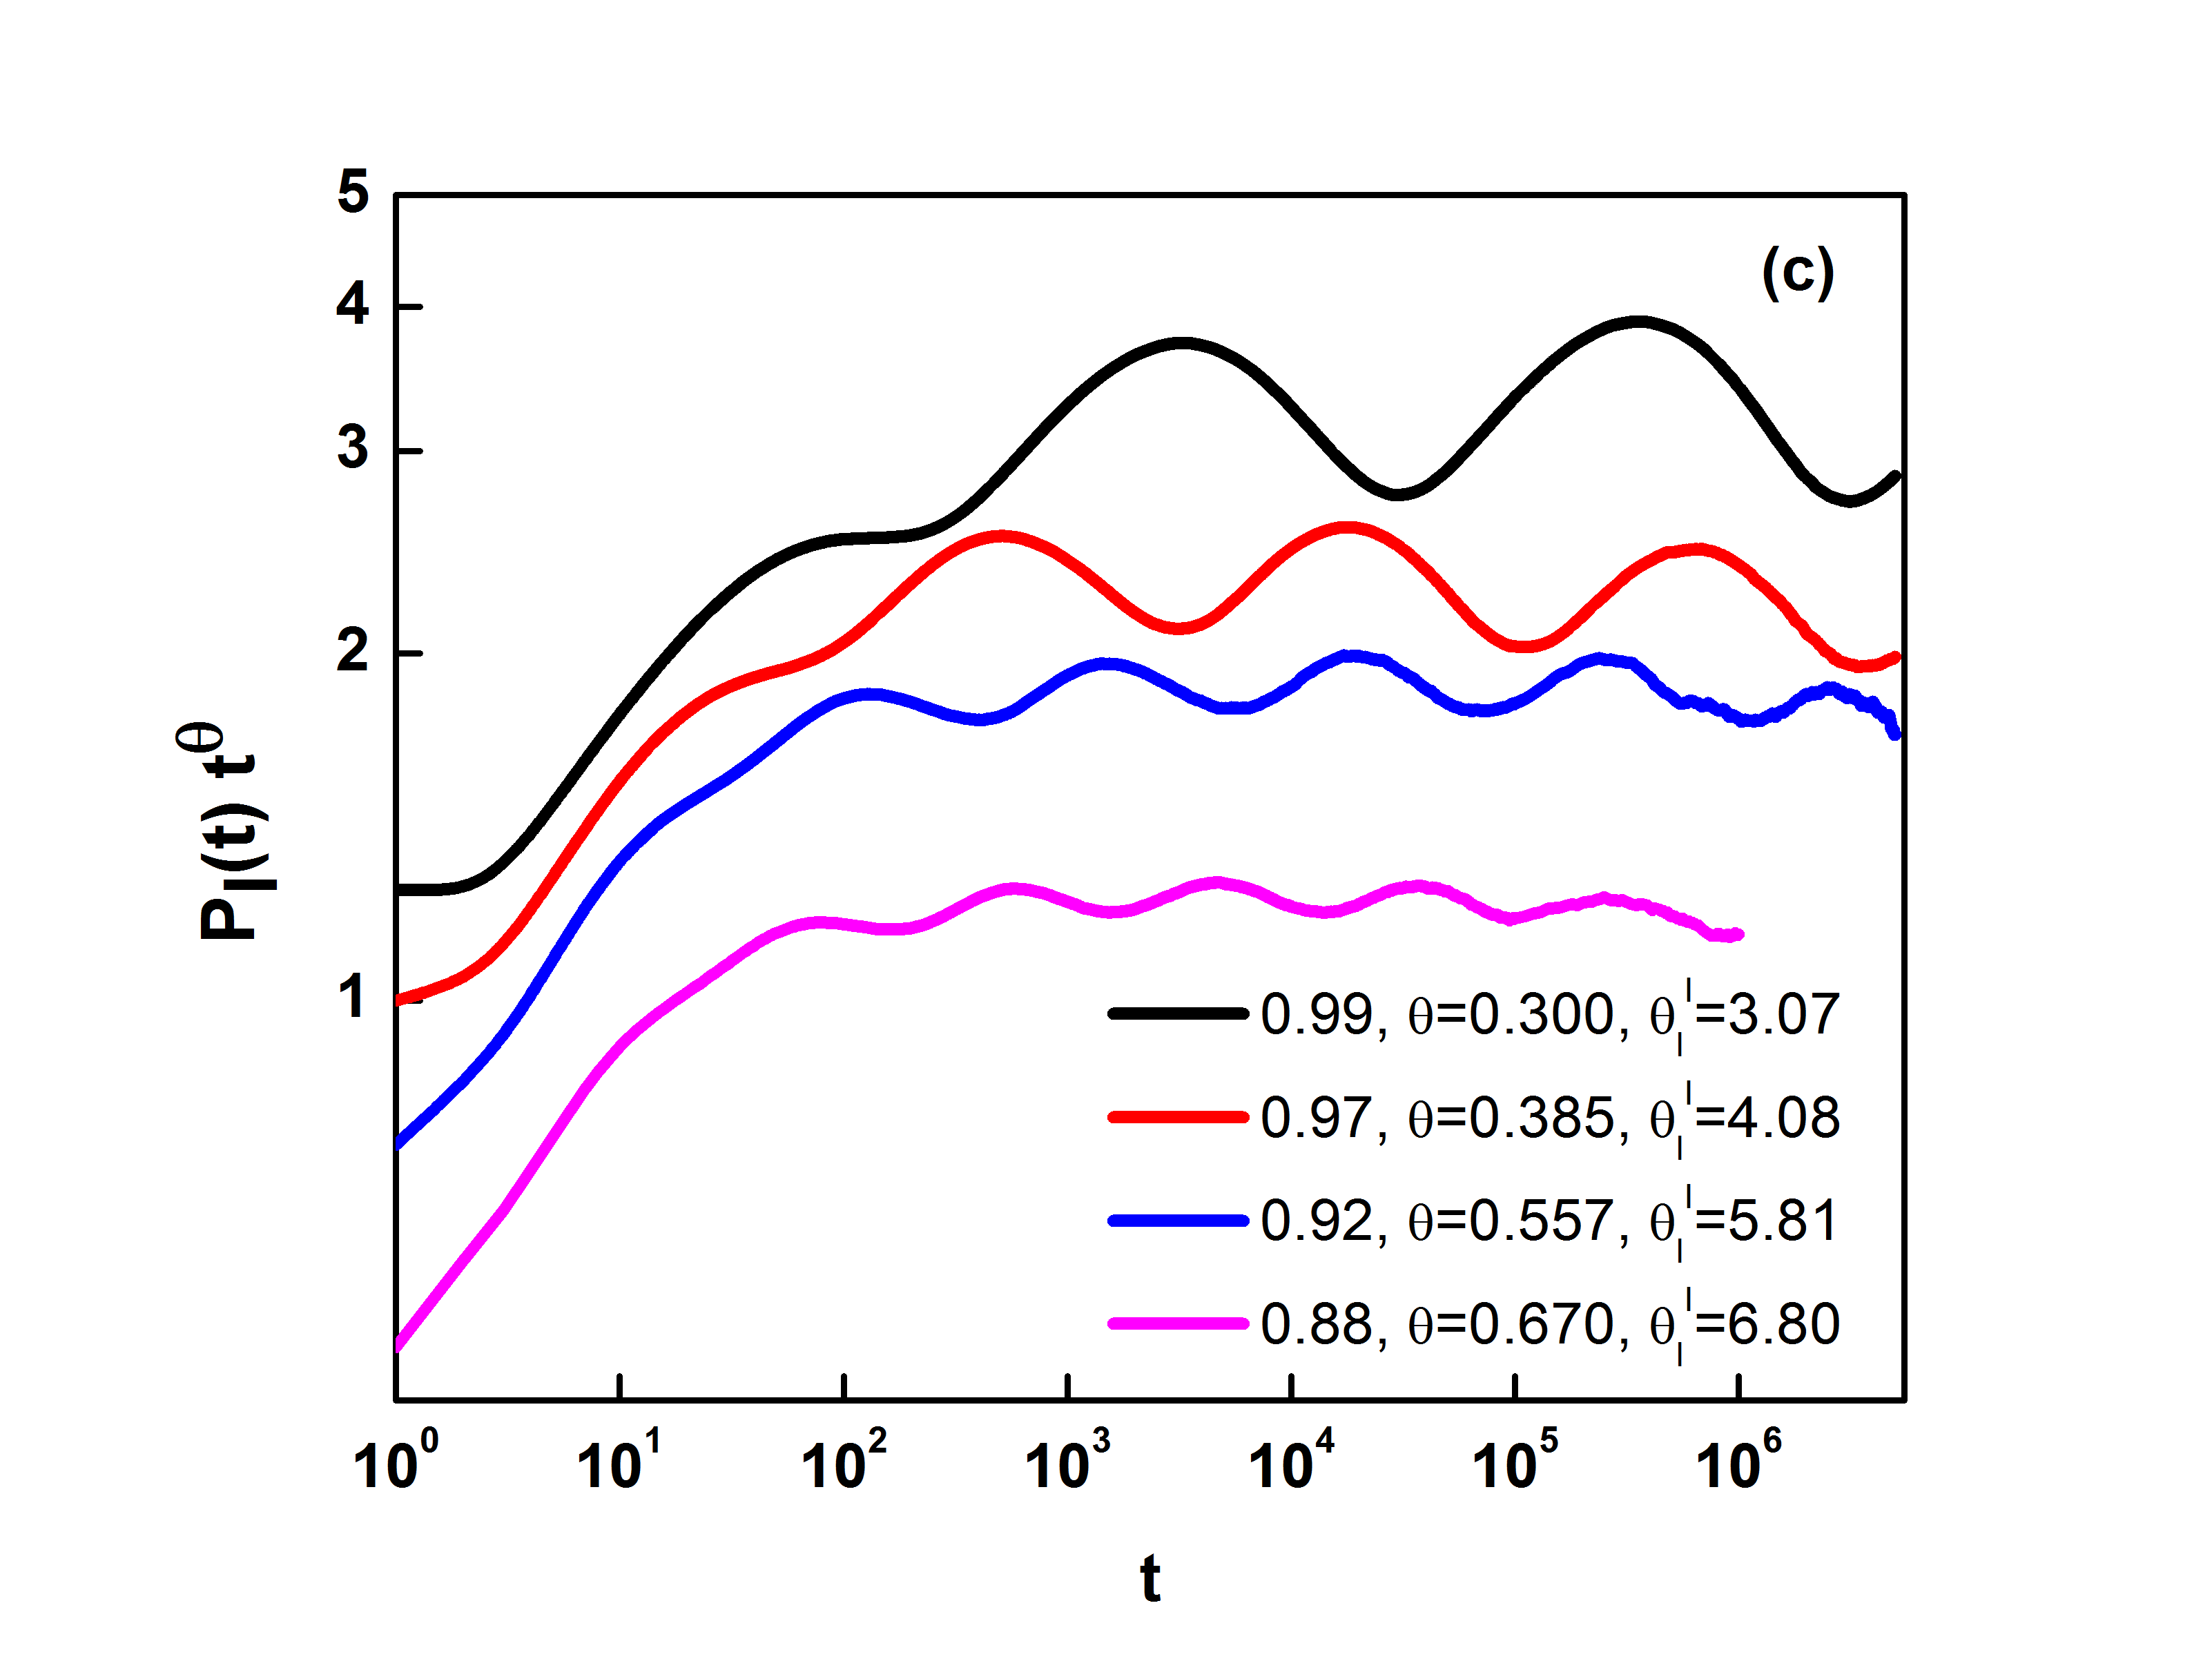
For we observe a clear power-law decay of persistence in time with exponent 1.92. For , the quantity continues to decay as power-law as shown in Fig.6(a). In fact, it decays with a smaller exponent. Thus the rate at which system loses the memory of initial conditions is fastest at this point! Unlike other cases where we observe exponential decay of persistence in the active phase, the memory of initial conditions decay very slowly even in the active phase. The behavior can be described by for where is known as the persistence exponent. Thus is a constant.For larger values of close to 1, there are systematic oscillations over and above the power-law decay and they can be best described by complex persistence exponent. The amplitude of oscillations increases as .
This oscillatory nature of persistence is not reflected in any other quantity. The number of active sites saturates quickly in few time-steps. Similarly, rate at which active sites become inactive and vice-versa reaches a constant value quickly. The number of domain walls where active and inactive sites are next to each other do not show any oscillations. If we discriminate between different initial conditions and compute four different quantities, depending on initial condition and whether site is of DP character or CDP character, we observe that the persistence is essentially dictated by sites of CDP type which are active initially. All other persistence goes to zero exponentially fast and logarithmic oscillations are due to CDP sites which are active in the beginning. Obviously, the CDP sites form clusters of different sizes, the probability of size decreases exponentially with . However, larger the size it is difficult for 0’s to invade the centre of CDP cluster.
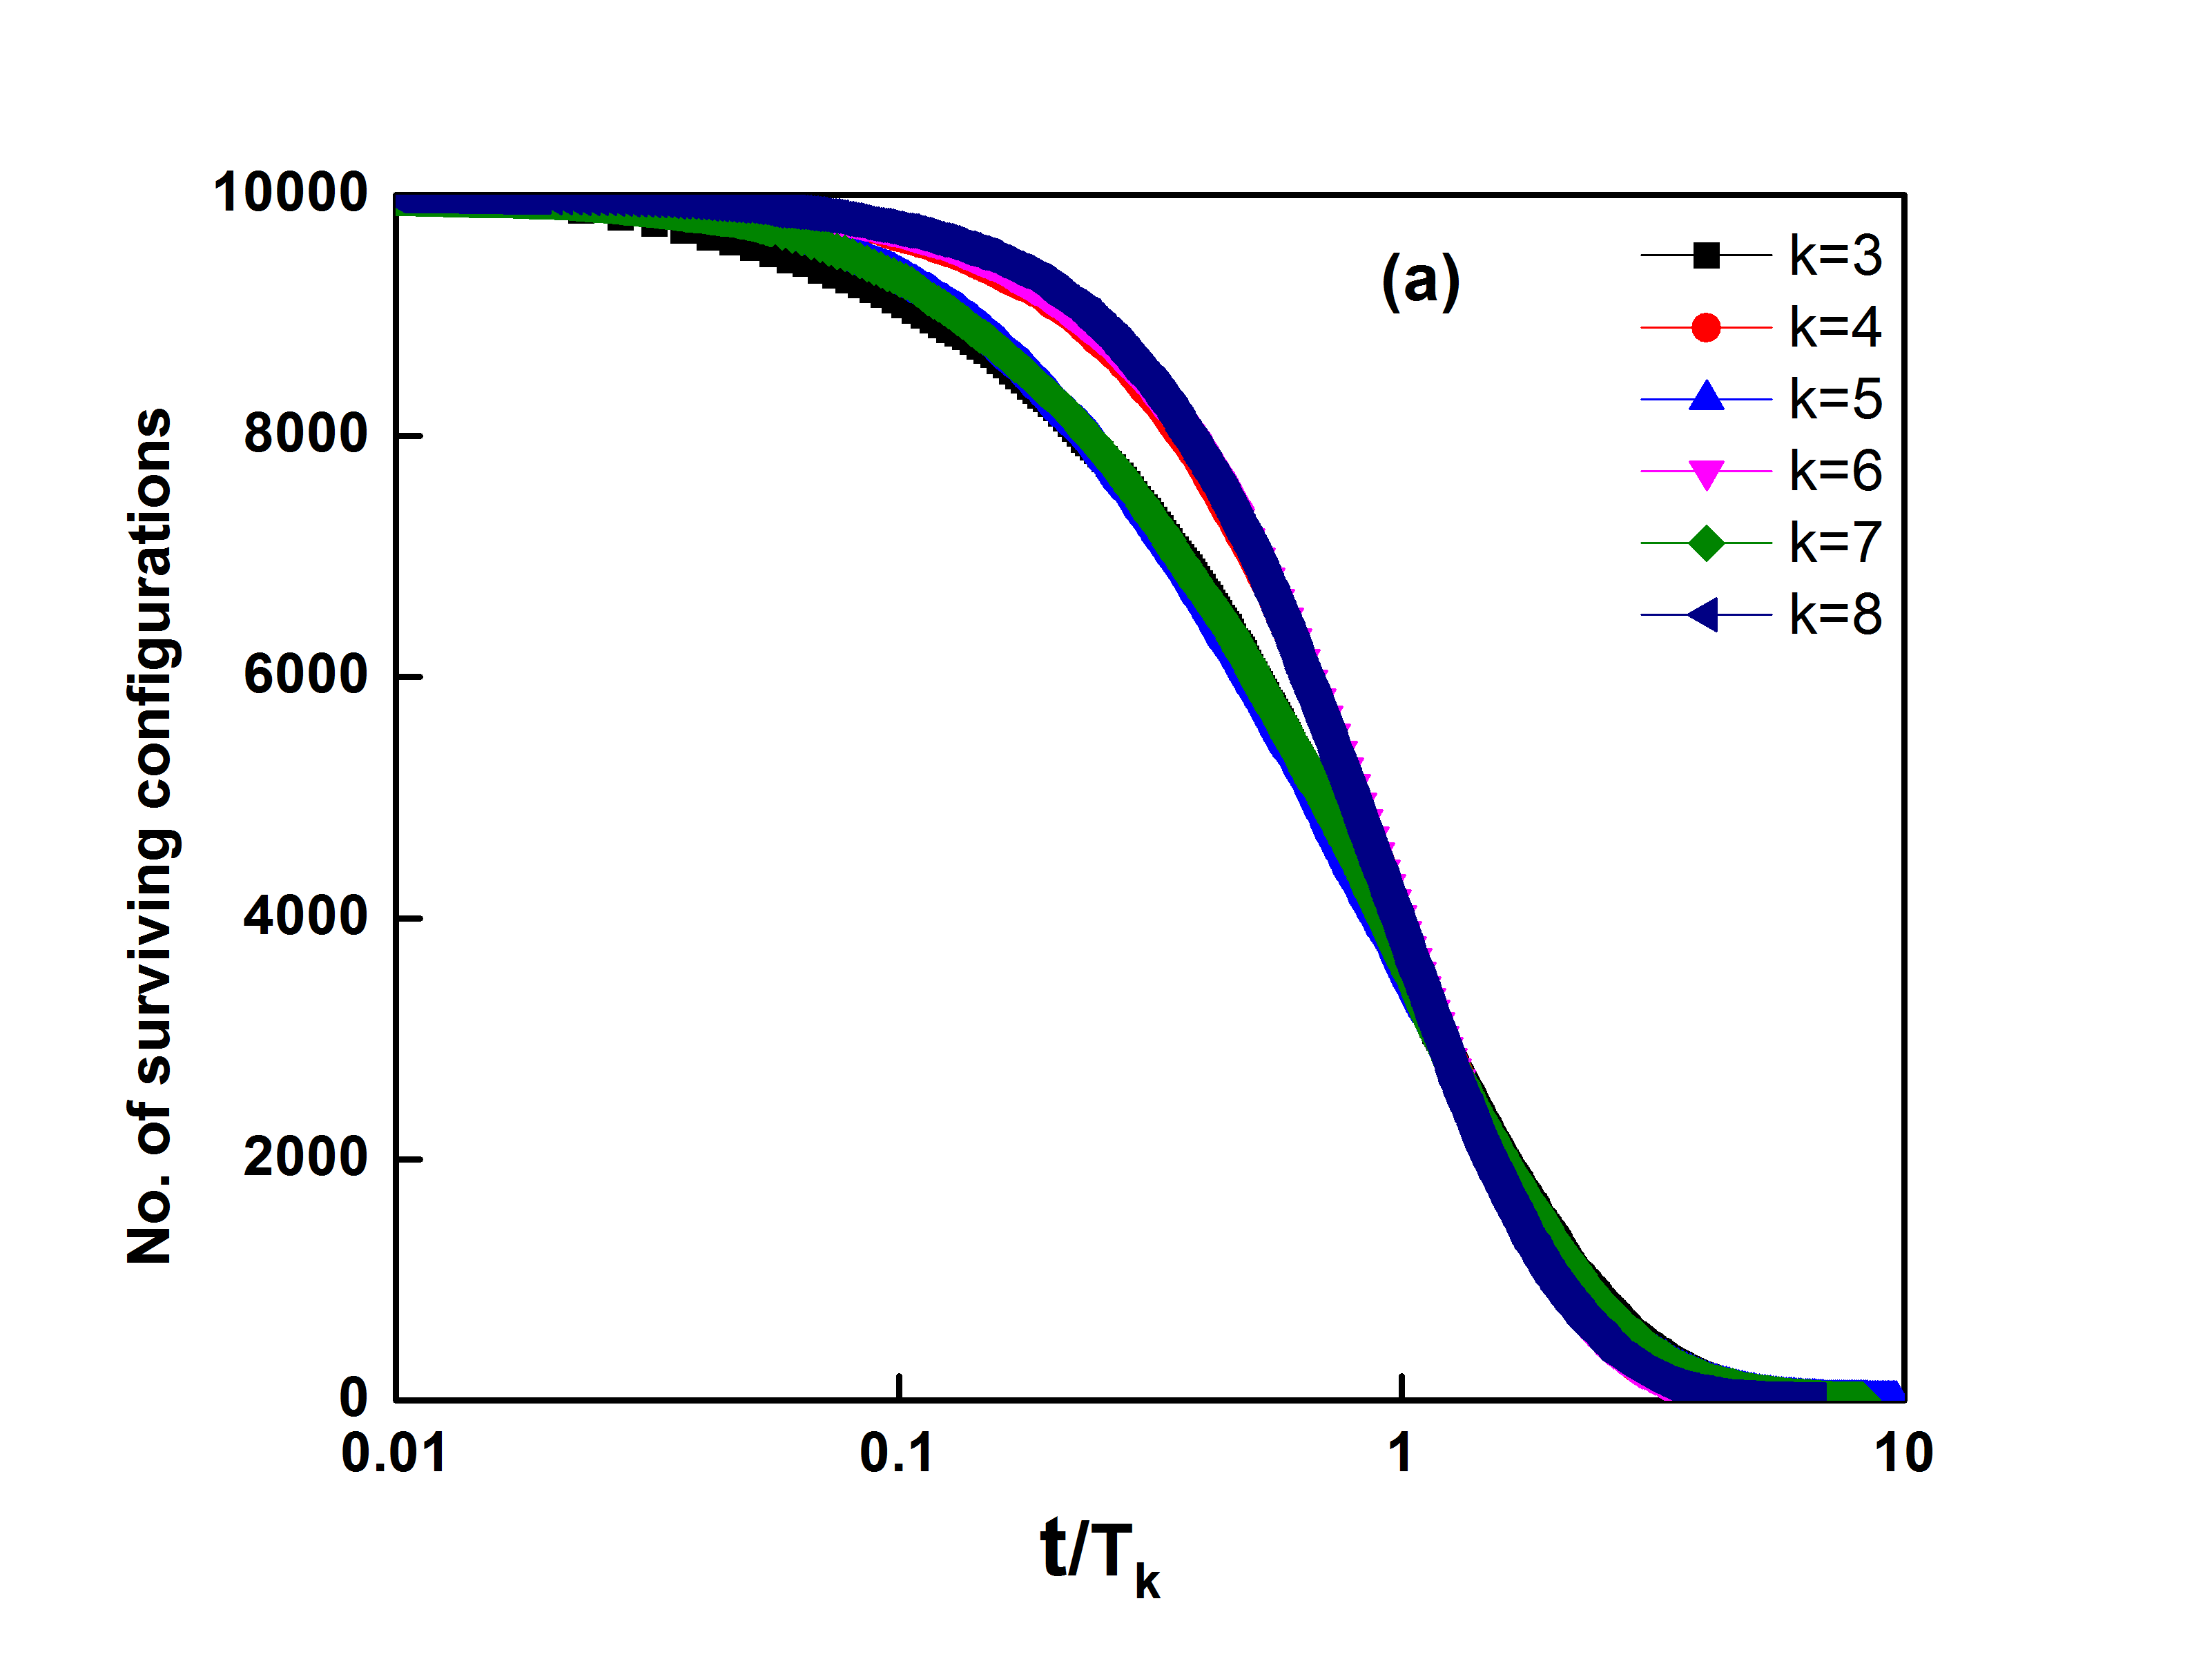
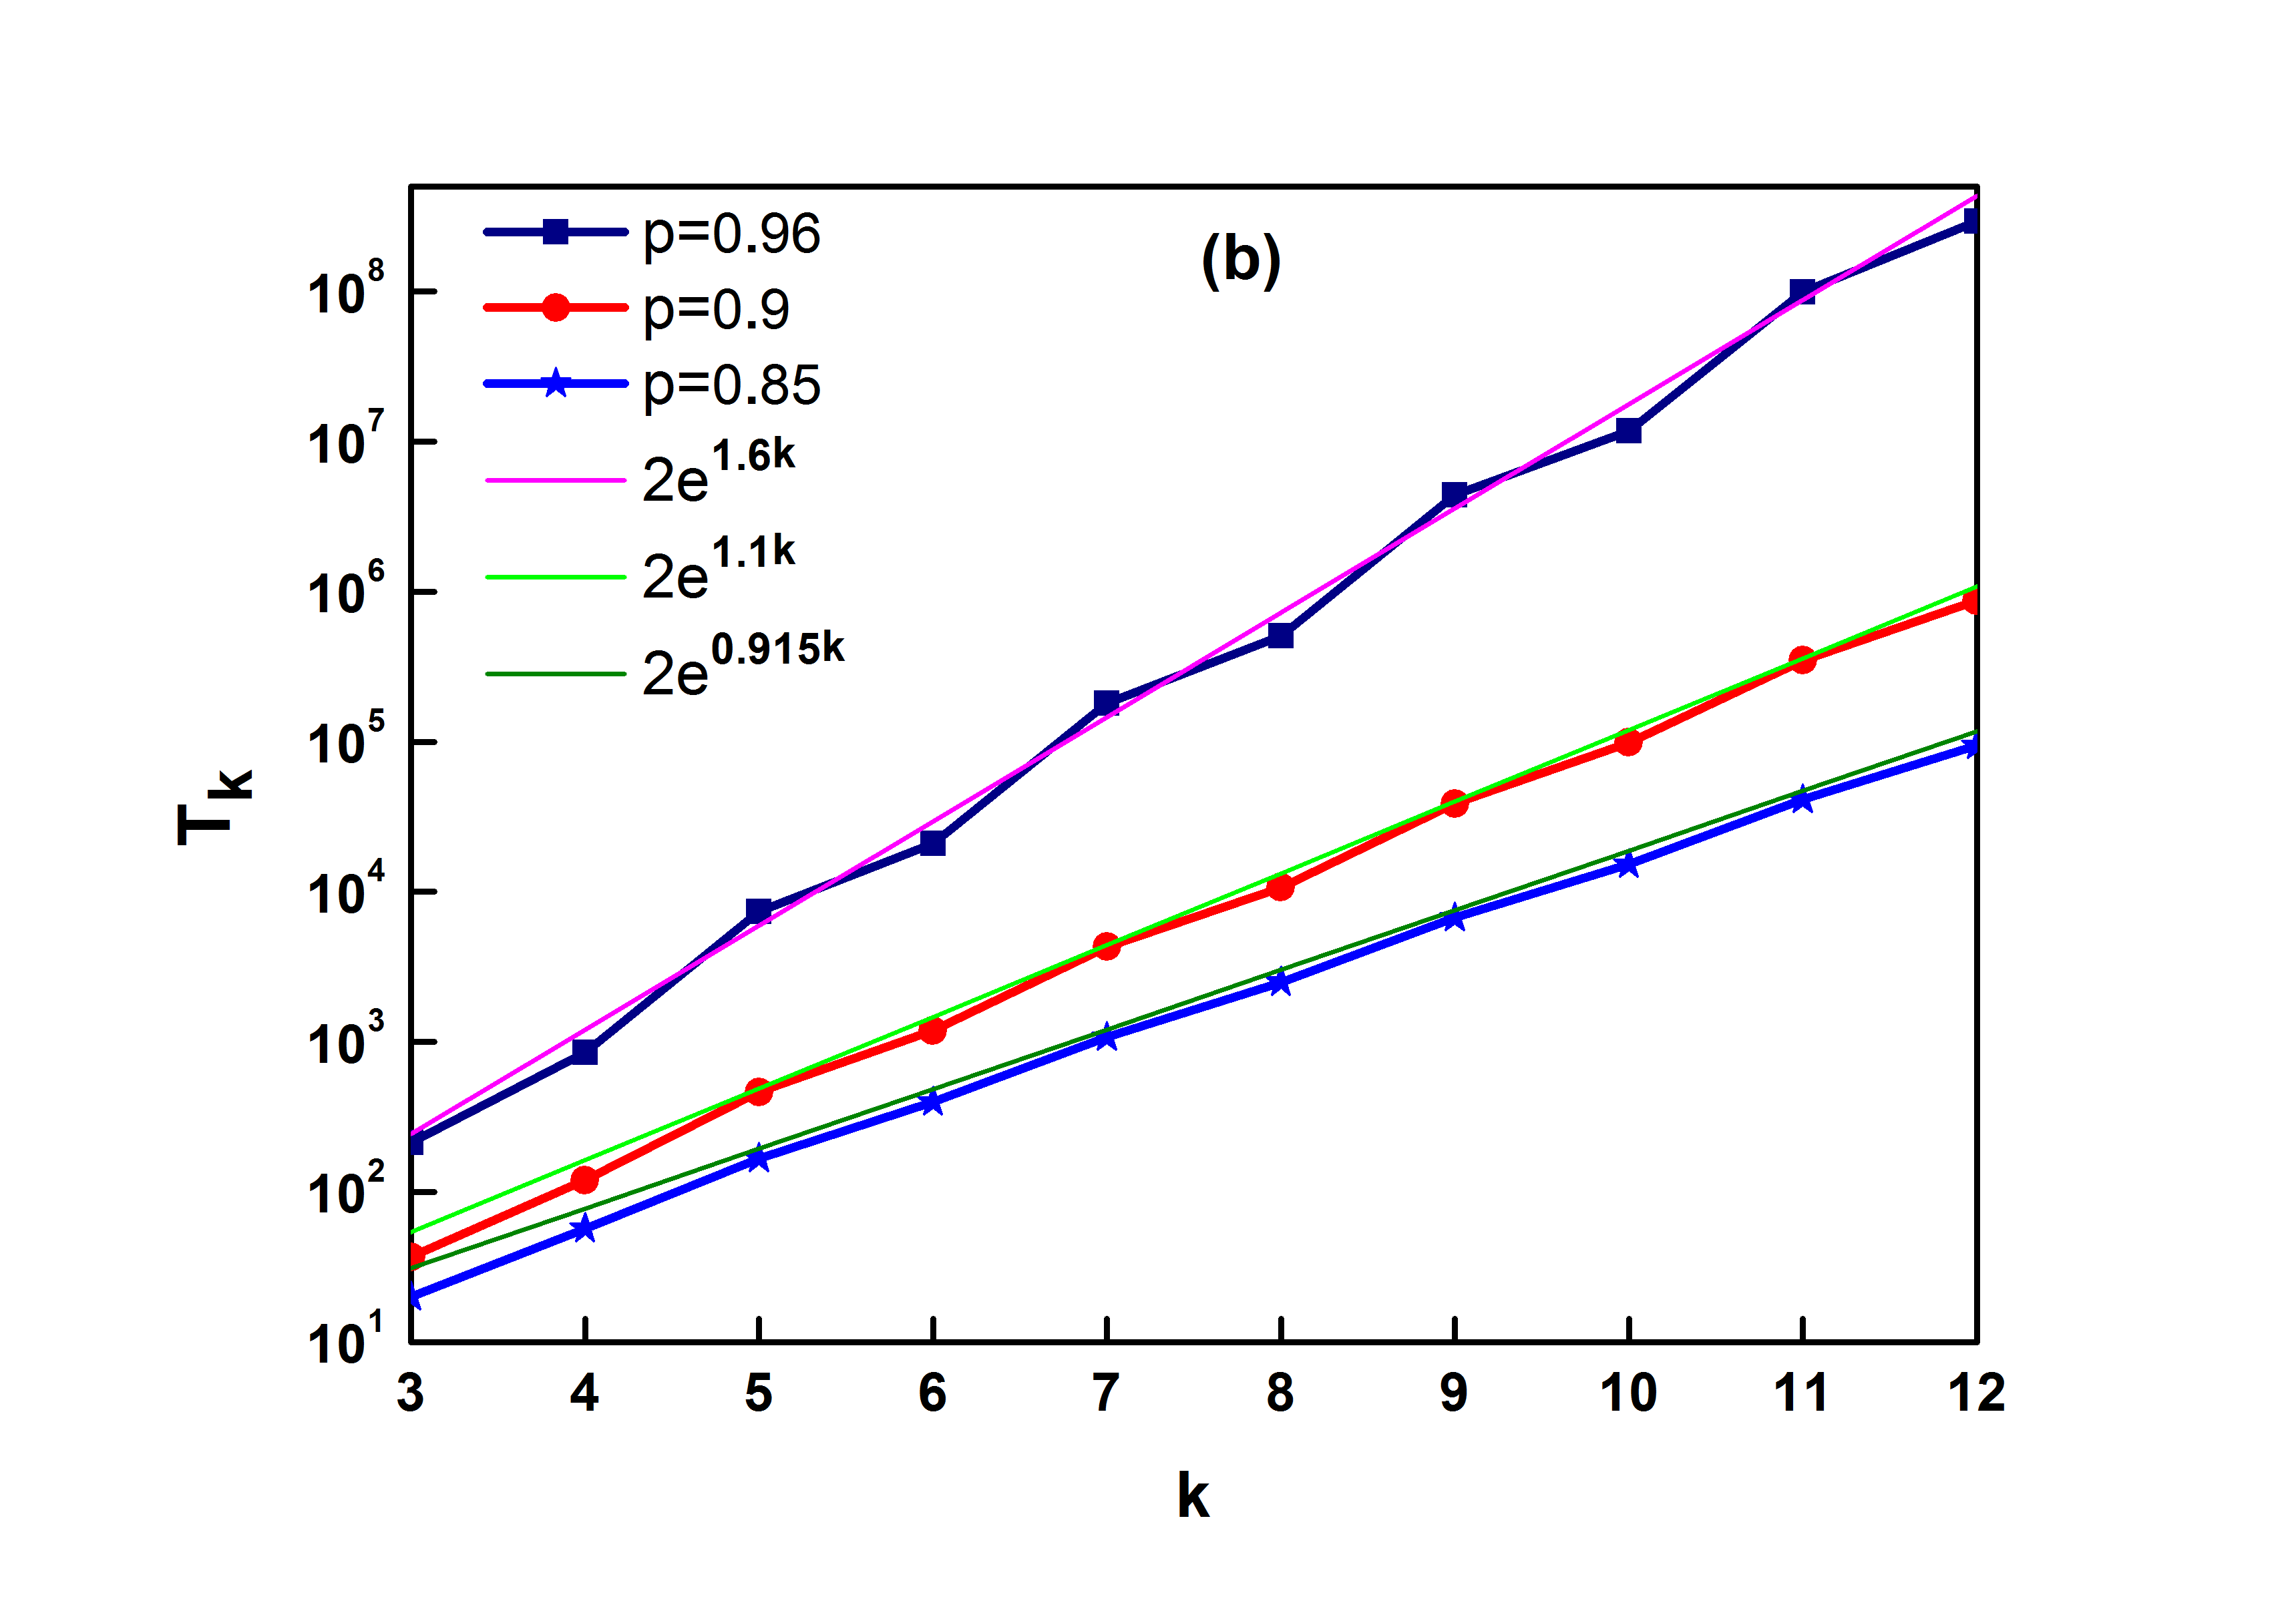
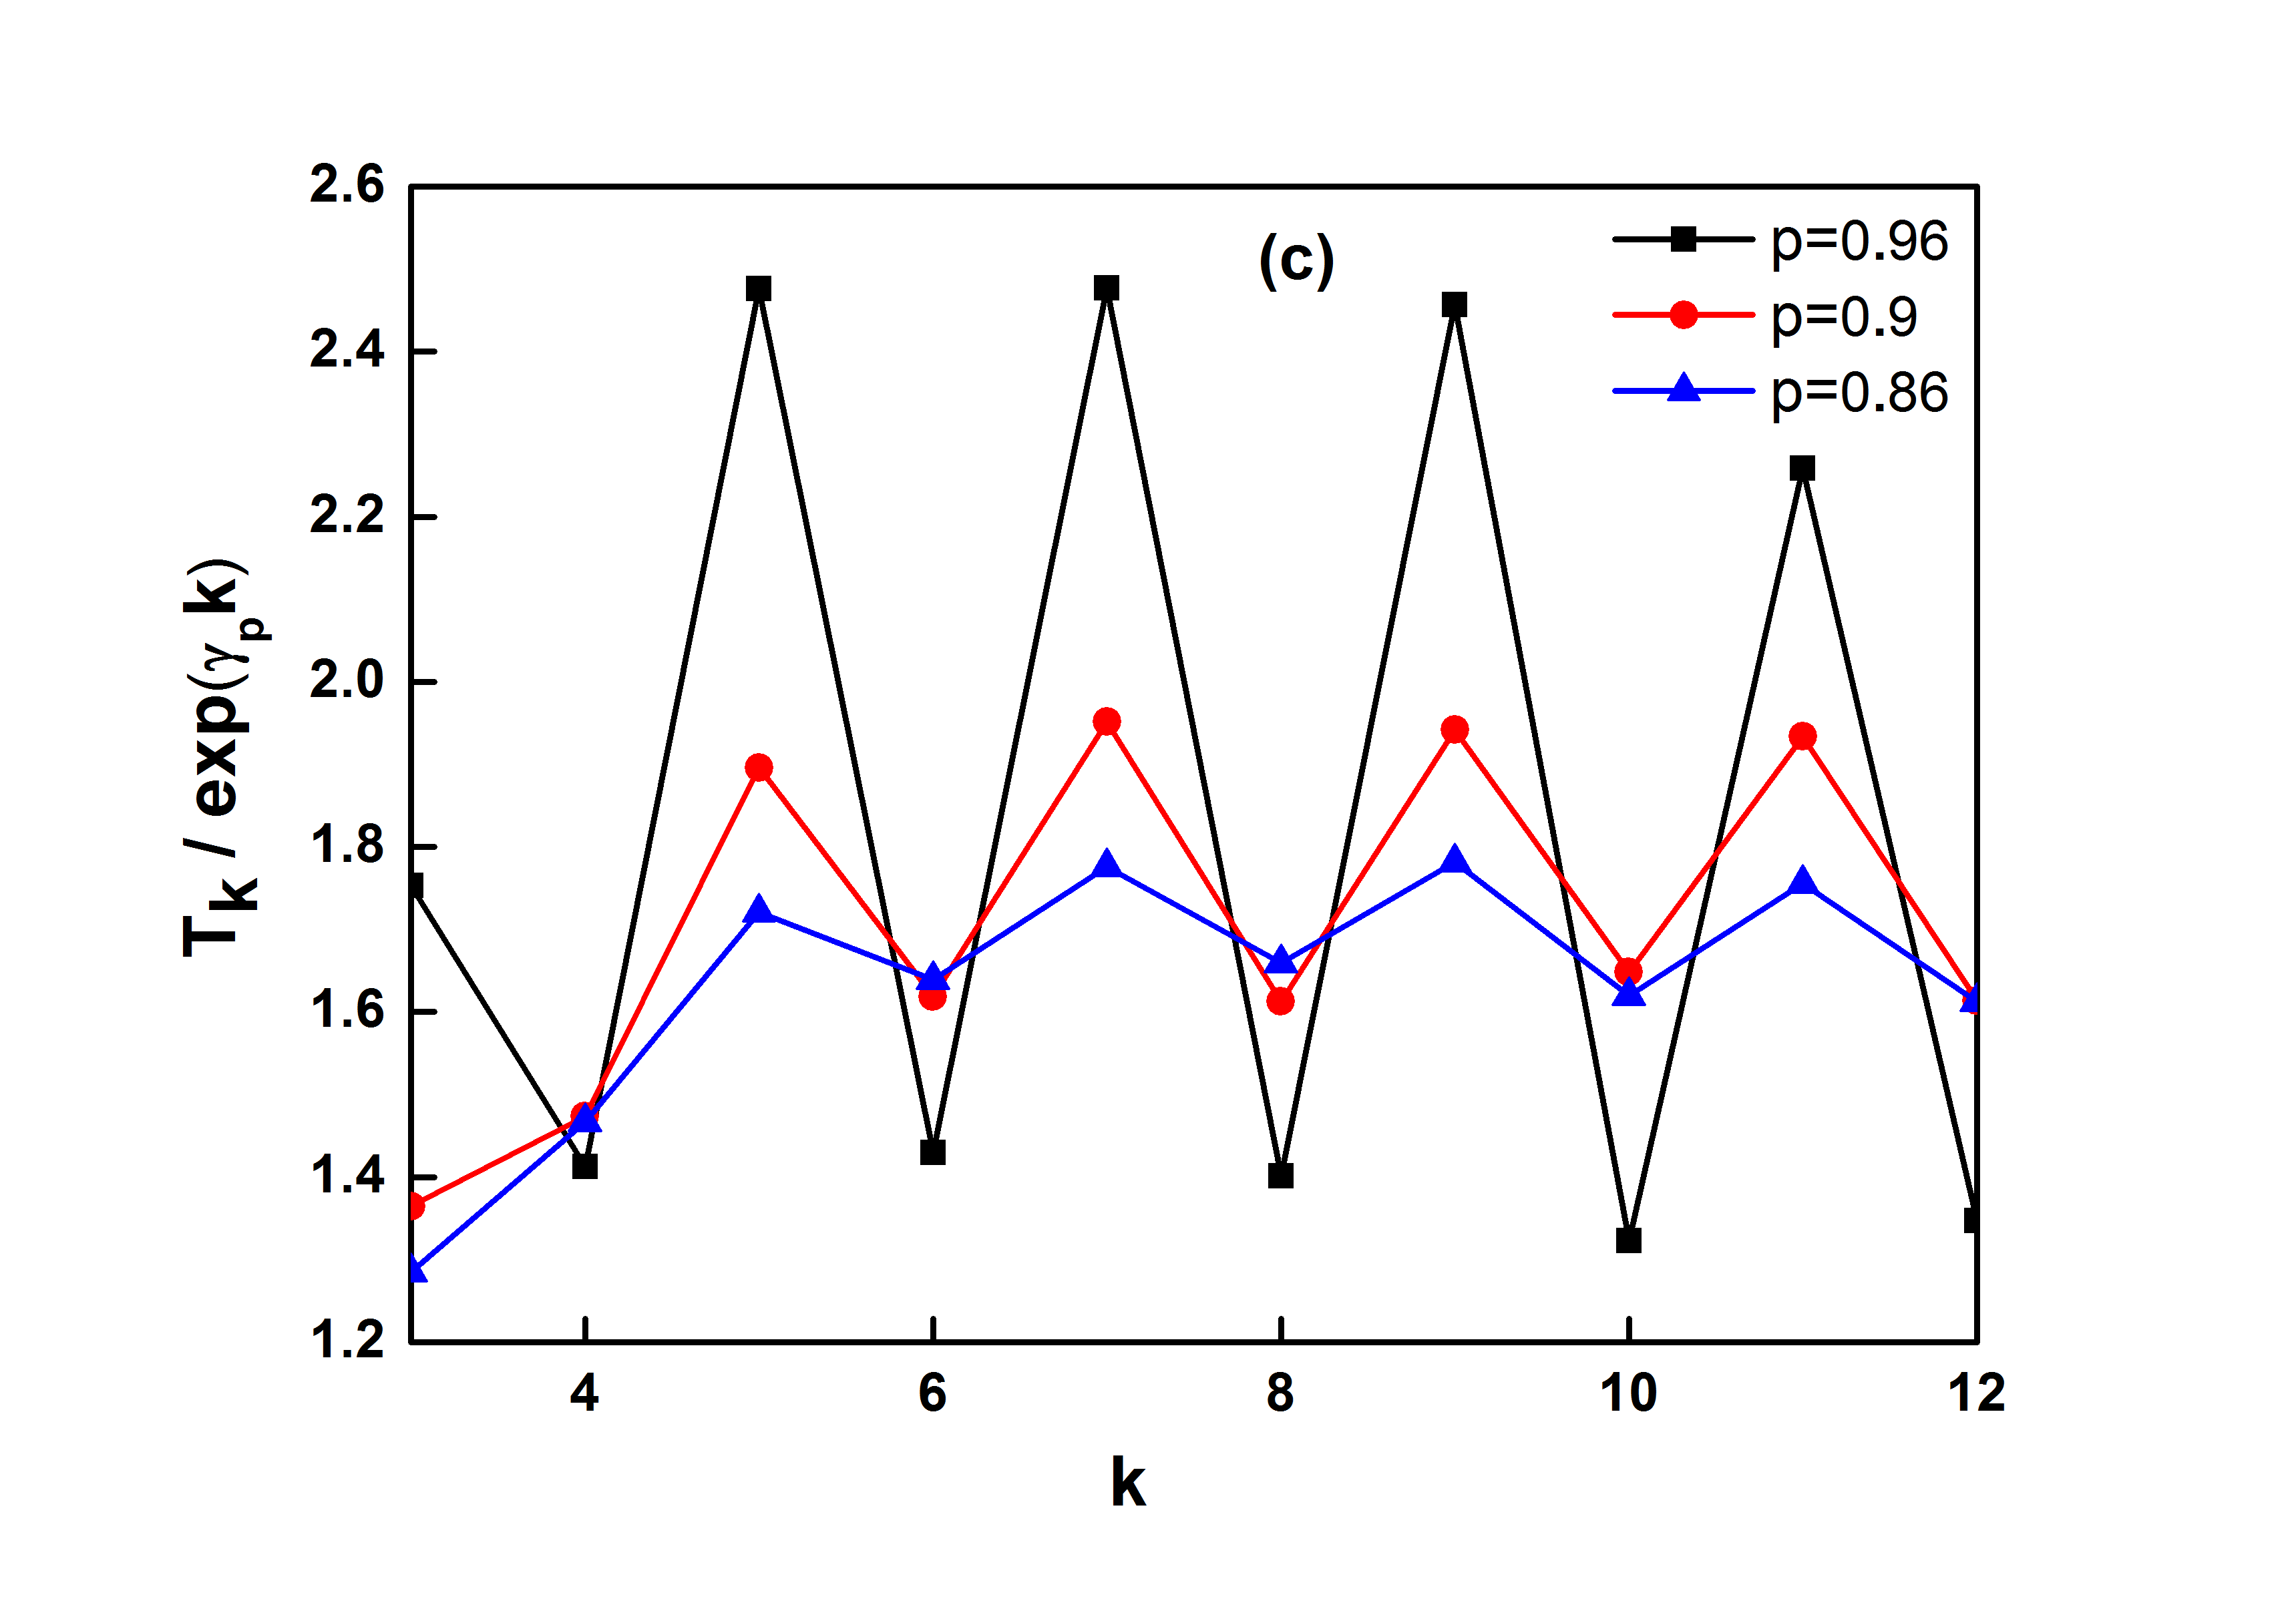
We simulate the systems of sites such that first and site is fixed at 0 and we have a cluster of sites evolving according to CDP rules. These sites are active at the beginning. If all active sites have become inactive at least once, we consider it as a configuration which has not survived. In Fig.7(a), we have plotted the fraction of surviving configurations as a function of time. We also compute average time by which all these sites have become inactive at least once. This time increases exponentially. But there are oscillations over and above the exponential. In Fig.7(b) we plot the average time taken by k+2 sites to become inactive as a function of number of sites k in cluster. Fig.7(c) shows the plot of the relation with varying k. The probability of CDP cluster of size decreases exponentially. However, the lifetime of such a cluster increases exponentially. The combination of exponentially rare regions which survive for exponentially long times leads to a power-law and the oscillations over and above this exponential lead to log-periodicity.
At longer times, bigger and bigger clusters of CDP sites are invaded fully and the sites become inactive at least once. There is certain time-scale at which say, cluster of four sites is invaded and after a certain time cluster of size five is fully invaded. However, apart from exponential increase in time-scales, there is a odd-even oscillation which could be a reason for logarithmic oscillations in persistence.
A complex exponent would imply that . Now the behavior is given by and . If we plot as a function of , we should observe log-periodic oscillations over and above the constant. This is precisely the behavior for large values of as shown in Fig.6(b). Since the function is log-periodic, it is very difficult to find exact time-periodicity. The period of these oscillations decreases and amplitude increases as . For close to , the amplitude (if any) is very small. and it is difficult to determine if close to . Log-periodic oscillations emerge due to the inherent self-similar structure in a variety of studies Newman et al. (1995); Akkermans et al. (2012). In our model the self-similarity is absent. The value of decreases as we approach . For , .
For CDP, for any . For DP, will decay exponentially for . When both types of evolution are possible, naively one may expect that the decay will be slower than exponential due to clusters of CDP sites. One could expect a stretched exponential, power-law or even logarithmic decay. The dynamics will further slow down with an increase of , leading to a decrease in the real part of the exponent. Fig.8 shows that the real part of persistence exponent varies as log(). Therefore, as . However, the imaginary part of persistence exponent decreases only slightly with increase in defects .
IV Summary
We studied contact process when a fraction of sites on 1-D lattice follows CDP rules, rest evolve according to rules leading to DP universality class. For , we observe a transition to the fluctuating phase at critical probability for . In the absorbing phase, we observe the Griffiths phase over a range of parameters, where the order parameter decays as a power-law with continuously varying exponent. For , decays in stretched exponential manner and eventually shows exponential behavior. For , . The slow dynamics in the absorbing phase is due to the rare region effect. The rare region effect decomposes lattice into several disconnected finite-size clusters. These clusters are active while the bulk is in the inactive phase. Thus the overall activity is the sum of activities of clusters of various sizes. At , the decay is extremely slow and we observe a logarithmic decay. We confirmed the critical point by large lattice as well as single seed simulation. We also obtained the survival probability and the average number of active sites in a cluster starting with single seed .
We also study the local persistence in this system. In DP, critical point at which coincides with in general. For CDP, the persistence does not goes to zero in either phase. In our case, decay of persistence is slower than power law at . For , decays as power-law with continuously varying complex exponent. The real and imaginary part of the exponent decrease as , but amplitude increases. This system does not have a self-similar or fractal disorder and the underlying lattice is not fractal. Interestingly, log-periodic oscillations can be observed due to uncorrelated quenched disorder alone. We have mainly presented results for . However, changing leads to similar results. The above observations may be applicable to other dynamical rules and topologies.
V Acknowledgement
PMG thanks DST-SERB for financial assistance and Prof. P. Sen and Prof. M. Burma for discussions.
References
- Marro and Dickman (2005) J. Marro and R. Dickman, Nonequilibrium phase transitions in lattice models (Cambridge University Press, 2005).
- Domb et al. (1995) C. Domb, R. K. Zia, B. Schmittmann, and J. L. Lebowitz, Statistical mechanics of driven diffusive systems, Vol. 17 (Elsevier, 1995).
- Hinrichsen (2000a) H. Hinrichsen, Advances in physics 49, 815 (2000a).
- Bak et al. (1987) P. Bak, C. Tang, and K. Wiesenfeld, Physical review letters 59, 381 (1987).
- Pruessner (2012) G. Pruessner, Self-organised criticality: theory, models and characterisation (CUP, 2012).
- Carlson et al. (1993) J. M. Carlson, E. R. Grannan, and G. H. Swindle, Phys. Rev. E 47, 93 (1993).
- Noest (1986) A. J. Noest, Physical review letters 57, 90 (1986).
- Noest (1988) A. J. Noest, Physical Review B 38, 2715 (1988).
- Webman et al. (1998) I. Webman, D. Ben Avraham, A. Cohen, and S. Havlin, Philosophical Magazine B 77, 1401 (1998).
- Sornette (1998) D. Sornette, Phys. Rep. 297, 239 (1998).
- Akkermans et al. (2012) E. Akkermans, O. Benichou, G. V. Dunne, A. Teplyaev, and R. Voituriez, Physical Review E 86, 061125 (2012).
- Saadatfar and Sahimi (2002) M. Saadatfar and M. Sahimi, Physical Review E 65, 036116 (2002).
- Johansen et al. (1999) A. Johansen, D. Sornette, and O. Ledoit, arXiv preprint cond-mat/9903321 (1999).
- Barghathi et al. (2014) H. Barghathi, D. Nozadze, and T. Vojta, Physical Review E 89, 012112 (2014).
- Fischer and Hertz (1993) K. H. Fischer and J. A. Hertz, Spin glasses, Vol. 1 (Cambridge university press, 1993).
- Janssen (1981) H.-K. Janssen, Z. Phys. B Con. Mat. 42, 151 (1981).
- Grassberger (1982) P. Grassberger, Z. Phys. B Con. Mat. 47, 365 (1982).
- Hinrichsen (2000b) H. Hinrichsen, Brazilian Journal of Physics 30, 69 (2000b).
- Henkel et al. (2008) M. Henkel, H. Hinrichsen, S. Lübeck, and M. Pleimling, Non-equilibrium phase transitions, Vol. 1 (Springer, 2008).
- Vojta (2006) T. Vojta, J Phys. A 39, R143 (2006).
- Harris (1974) A. B. Harris, J. Phys. Condens. Matter 7, 1671 (1974).
- Griffiths (1969) R. B. Griffiths, Physical Review Letters 23, 17 (1969).
- Vojta (2003) T. Vojta, Phys. Rev. Lett. 90, 107202 (2003).
- Arashiro and De Felício (2003) E. Arashiro and J. R. D. De Felício, Physical Review E 67, 046123 (2003).
- Huse (1989) D. A. Huse, Physical Review B 40, 304 (1989).
- Domany and Kinzel (1984) E. Domany and W. Kinzel, Physical review letters 53, 311 (1984).
- Kinzel (1985) W. Kinzel, Zeitschrift für Physik B Condensed Matter 58, 229 (1985).
- Fuchs et al. (2008) J. Fuchs, J. Schelter, F. Ginelli, and H. Hinrichsen, Journal of Statistical Mechanics: Theory and Experiment 2008, P04015 (2008).
- Menon et al. (2003) G. I. Menon, S. Sinha, and P. Ray, EPL (Europhysics Letters) 61, 27 (2003).
- Vojta and Dickison (2005) T. Vojta and M. Dickison, Physical Review E 72, 036126 (2005).
- Vojta et al. (2009) T. Vojta, A. Farquhar, and J. Mast, Physical Review E 79, 011111 (2009).
- Hooyberghs et al. (2004) J. Hooyberghs, F. Iglói, and C. Vanderzande, Physical Review E 69, 066140 (2004).
- Hooyberghs et al. (2003) J. Hooyberghs, F. Iglói, and C. Vanderzande, Physical review letters 90, 100601 (2003).
- Newman et al. (1995) W. I. Newman, D. L. Turcotte, and A. M. Gabrielov, Physical Review E 52, 4827 (1995).