Candidate Population III stellar complex at z=6.629 in the MUSE Deep Lensed Field
Abstract
We discovered a strongly lensed () Ly emission at z=6.629 (S/N ) in the MUSE Deep Lensed Field (MDLF) targeting the Hubble Frontier Field galaxy cluster MACS J0416. Dedicated lensing simulations imply that the Ly emitting region necessarily crosses the caustic. The arc-like shape of the Ly extends 3′′ on the observed plane and is the result of two merged multiple images, each one with a de-lensed Ly luminosity L erg s-1 arising from a confined region ( pc effective radius). A spatially unresolved HST counterpart is barely detected at S/N after stacking the near-infrared bands, corresponding to an observed(intrinsic) magnitude . The inferred rest-frame Ly equivalent width is EW0 > 1120Å if the IGM transmission is T. The low luminosities and the extremely large Ly EW0 match the case of a Population III star complex made of several dozens stars ( M⊙) which irradiate a Hii region crossing the caustic. While the Ly and stellar continuum are among the faintest ever observed at this redshift, the continuum and the Ly emissions could be affected by differential magnification, possibly biasing the EW0 estimate. The aforementioned tentative HST detection tend to favour a large EW0, making such a faint Pop III candidate a key target for the James Webb Space Telescope and Extremely Large Telescopes.
keywords:
galaxies: formation – galaxies: starburst – gravitational lensing: strong1 Introduction
Finding and characterising the first galaxies is the next frontier in observational astronomy. It is thought that the Universe was initially metal-enriched by the first generation of Population III (Pop III) stars, that could also have played a key role in cosmic reionisation before the formation of primeval galaxies (e.g., Zackrisson, & Vikaeus, 2019; Wise, 2019; Dayal, & Ferrara, 2018, and references therein). Late () Pop III star formation might also have occurred in pristine regions due to inhomogeneous metal enrichment of the first galaxies (Tornatore, Ferrara & Schneider, 2007; Visbal et al., 2016; Salvaterra et al., 2011). Given the exceptionally high effective temperatures of Pop III stars in the zero-age main sequence, they emit a large fraction of their luminosity in the Lyman continuum and have a much harder ionising spectrum than stars with higher metallicity. The main characteristics of their predicted spectral energy distribution (SED) are the presence of a prominent rest-fame Ly (Lyman-alpha) emission line due to the strong ionising flux up to Å rest-frame equivalent width (denoted as EW0, hereafter) and significant He recombination line (especially Heii, with EW0 up to 15-40Å) due to spectral hardness, while a clear deficit of all the metal lines is expected. In particular, Inoue (2011) suggested the following criteria for the identification of extremely metal poor or Pop III galaxies: EW0(Ly) Å, EW0([OIII]5007) Å and EW0(Heii) Å, and prominent Balmer lines like EW0(H)Å, while showing an extremely blue ultraviolet spectral slope (, F).
Observations have yielded candidates for Pop III stellar populations at high redshift (e.g., Kashikawa et al., 2012; Sobral et al., 2015, and references therein), yet without any definitive detection. These include a controversial galaxy dubbed CR7 that displays Heii emission (Sobral et al., 2019; Shibuya et al., 2018). Thus, to date, there has not been a confirmed observation of a galaxy dominated by the flux of Pop III stars. The possibility of observing signatures from very metal poor or Pop III star clusters through gravitational lensing has also been discussed, e.g., Zackrisson et al. (2015) (see also Hernán-Caballero et al. 2017), including the detection of single Pop III stars with fluxes temporarily magnified to extreme values (with the magnification parameter ) during their transit across the caustic of a galaxy cluster. Such singlestartransit events can boost the flux of the star by mag (Windhorst et al., 2018), making such objects visible for a limited amount of time even down to intrinsic magnitudes of . Examples of such events detecting single normal stars at have been reported recently by Rodney et al. (2018).
Very low-luminosity emission line galaxies have been identified in Hubble Ultra Deep Field, down to magnitude (M1500 = -15) and S/N (Maseda et al., 2018). Strong gravitational lensing allowed us to shed further light on similar low-luminosity objects, providing higher S/N for individual cases (e.g., Vanzella et al., 2017, 2019). In this letter we present an object at z=6.629 showing (1) the faintest Ly emission ever detected at crossing the caustic of the Hubble Frontier Field (HFF) galaxy cluster MACS J0416 (Lotz et al., 2017) and (2) a large Ly EW0, potentially implying that extreme stellar populations are present. We assume a flat cosmology with = 0.3, = 0.7 and km s-1 Mpc-1.
2 The MUSE Deep Lensed Field: MDLF
VLT/MUSE (Bacon et al., 2010) deep spectroscopic observations of 17.1 hours of integration time in a single pointing have been obtained on the HFF galaxy cluster MACS J0416 (Prog. 0100.A-0763(A), PI Vanzella). The data reduction follows the technique described in Caminha et al. (2017), eventually achieving a PSF with FWHM of in the final datacube. A more detailed description of the observational campaign of the MDLF and of the data reduction will be presented elsewhere. A refined lens model of HFF J0416 using a new set of confirmed multiple images from the MDLF, will also be presented in a forthcoming paper.
2.1 A Ly arc at z=6.629 and the faint HST counterpart
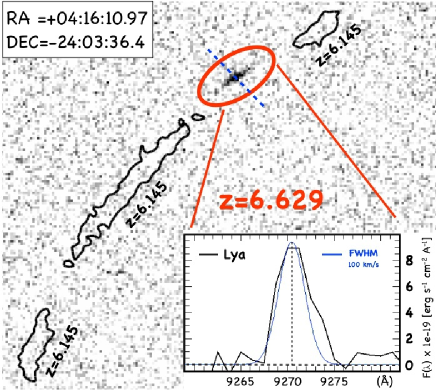
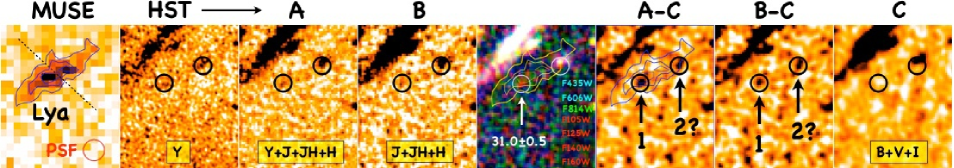
Figure 1 shows the extended () arc from the continuum subtracted narrow band image extracted from the MUSE data cube and the one-dimensional profile of the emission line at Å, in a region free from OH sky emission lines. The arc is detected at S/N=18 with flux erg s-1 cm-2 calculated within an elliptical aperture with major and minor axes of and , respectively, and shows an asymmetric profile having an instrumental corrected FWHM of km s-1. We identify this line as Ly at for the following reasons: (1) the weighted skewness (as defined by Shimasaku et al., 2006) is , in line with the typical values observed for asymmetric Ly emissions at high-z (it is zero for symmetric shapes, Figure 1); (2) if it is identified to other typical lines like [Oii], [Oiii], [Oiii], H, or H, each of them would imply the presence and detection of additional lines in the same spectrum; (3) the MUSE spectral resolution at Å is , high enough to resolve the single components of the doublets like Civ, Oiii], Ciii], [Oii] further excluding these lines for identification. As Figure 2 shows, there is no clear detection in the F105W (Y), F125W (J), F140W (JH), and F160W (H) bands in the HFF images, probing the ultraviolet stellar continuum down to the nominal depth of the HFFs (mag , at 5 limit Lotz et al., 2017). We therefore computed the Y+J+JH+H weighted-mean stacked images (probing Å), reaching a 1 limit of 31.6 within circular apertures of diameter . Such a limit has been derived by inserting 30 apertures in free regions surrounding the source position and computing the standard deviation among them (the A-PHOT tool has be used for this task, Merlin et al. 2019). As discussed in the next section, there is a configuration in which we expect the presence of two very close multiple images near the Ly arc. Indeed, there is a possible detection at S/N lying within the arclet indicated as 1 in Figure 2, with and showing a photometric drop in the F435W+F606W+F814W image. The same test has been performed adopting an elliptical aperture oriented along the arc, with semi-axis and , and no signal has been detected down to at . We expect a second nearby image with similar magnification that, however, is contaminated by a foreground object clearly detected in the blue bands. While image 1 could be the HST counterpart, a tentative second image detection marked as 2 is shown in Figure 2.
3 The Ly emission is on the caustic
The Ly arc lies in a well known region of the galaxy cluster where Vanzella et al. (2017, 2019) already discussed another star-forming complex system at z=6.145 showing several multiple images identified in deep HST data, producing three clear Ly arcs in the MUSE observations (Figure 1). The presence of such a system adds valuable constraints for the case studied in this work. In fact, any detection at in the region where the z=6.629 arc lies, would produce multiple images as in the case observed at z=6.145, unless such images are so close to merge into a single spatially unresolved mildly elongated arc. It is exactly the case for the z=6.629 arclet discussed here: the absence of two distinct images (Figure 1 and 2) implies that the Ly arc straddles the critical line and is indeed the result of two spatially unresolved Ly images, generated by a Ly emitting region lying on the corresponding caustic.
3.1 Simulating the caustic crossing
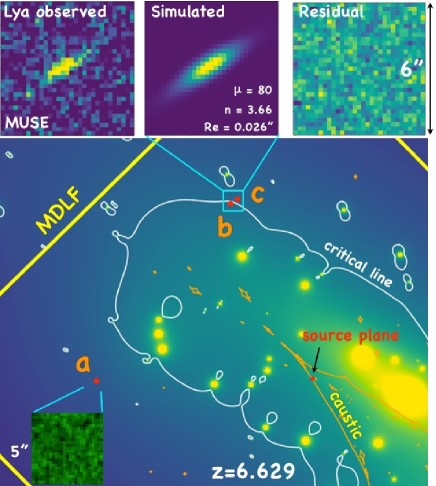
In order to perform a quantitative estimate of the magnification of the Ly emission, we use dedicated simulations with a customised version of the software SkyLens (e.g. Meneghetti et al., 2010; Plazas et al., 2019). The method will be extensively described in a future paper. In short, we perform the following steps. We start from the assumption that the source of the Ly emission can be described by a single, circularly symmetric Sérsic surface brightness profile. The profile is characterised by the Sérsic index and by the effective radius . We ray-trace light rays through a squared region containing the Ly emission (cyan square in Figure. 3, whose size is ) and propagate them towards the source plane at redshift , accounting for the deflections induced by the lensing cluster. In this work, we use the strong lensing model described in Caminha et al. (2017)111The LensTool model is published in the HFF lens model format at http://www.fe.infn.it/astro/lensing/. On the source plane, the arrival positions of the light rays are used to sample the brightness distribution of the source, which is then mapped onto the image plane. By performing this operation, we reconstruct the lensed image, which is subsequently convolved with a Gaussian PSF with a FWHM of . The resulting convolved image is first rebinned at the same resolution of the MUSE image (/pixel) and then compared to the observed Ly arclet. We use the python package LMfit to perform a Non-linear Least Square Minimisation of a cost function defined as the squared difference between the simulated and the observed images. As shown in the upper panels of Figure. 3, the source model, despite its simplicity, reproduces very well the observed arclet morphology. The two parameters and are quite degenerate. For a Sérsic index in the range , the best fit effectitve radius varies between . The best fit solution corresponds to and . The latest is equivalent to 140 pc on the source plane. In all cases, the model suggests that the Ly emitting region partially overlaps with the caustic, meaning that only part of the source is reproduced twice in the arclet.
Having obtained a model for the Ly source, we can estimate the magnification of the arclet by comparing the lensed and the intrinsic fluxes of the source after integrating the surface brightness over the region used for ray-tracing. We estimate that the total magnification of the Ly arclet (images b and c) is , implying that the de-lensed Ly flux of the arclet is erg s-1 cm-2. Keeping (exponential profile) in our fitting procedure the magnification increases to .
It is well known that such magnification estimate is prone to systematic errors due to the uncertainties of the lens model in regions where the magnification gradients are very strong (e.g., Meneghetti et al., 2017). In order to circumvent this limitation, we can make use of the counter image a, which is predicted to form much farther from the critical lines (Figure. 3). Using our best fit source determined above, we estimate that with an uncertainty smaller than . We also find that, because of the much shallower magnification gradient in this region, the estimate is quite insensitive to the properties of the source. Indeed, would change by () by adopting a point source approximation. The image is not detected at the depth of the MDLF down to Ly flux limit ( erg s-1 cm-2, for a point-like source, consistently to Inami et al. 2017). This sets a lower limit , where the observed ratio is . Therefore, we can conclude that , in keeping with the fitting procedure ().
3.2 A large Ly EW
The computation of the EW of the Ly line (L) requires an estimate of the underlying stellar continuum (S), taking into account that magnifications associated to S () and L () might differ. A general expression for EW0 is:
| (1) |
where (Ly) is the Ly flux ( erg s-1 cm-2), (UV) is the ultraviolet continuum at the Ly wavelength for which we assume a value erg s-1 cm-2Å-1, corresponding to ( 31+2.5Log, ). Given the large uncertainties on the HST detection (S/N , ), any assumption on the ultraviolet slope would not be significant. Indeed, a slope () would imply a magnitude difference of . (Ly) is the transmission of the intergalactic medium for Ly photons (see below, and Table 1). We identify two scenarios:
if we assume that L and S have the same intrinsic size and brightness profile, then and the is independent on the lens model. Thus, under this assumption, a lower limit on can be found by using the very low significance detection (if not the non-detection) of the UV continuum, . Combined with the de-lensed Ly flux of erg s-1 cm-2 leads to the result that Å, in the case TIGM(Ly)=1.0. The low significance of the HST detection prevents us from verifying whether S is extended as the arclet.
if, in contrast, we assume that the size of S is smaller than that of L, as it might be the case when S is embedded and generates the Hii region (e.g., Steidel et al., 2011), then we expect that and consequently EW0 would be even larger than in the previous case.
There is still the possibility that is located outside the lens caustic. In this scenario no continuum flux is expected near the Ly arclet. We could only use the non-detection in the HST data of image ( at ), where is certainly present, to set an upper limit of (UV). Using the fact that , the de-lensed magnitude limit is . Combined with the lower limit of the magnification of (), we obtain that Å in the case TIGM(Ly)=1.0. Note, however, that the marginal detection of image 1 in the stacked HST images (see Figure 2), which could be the image of , seems to disfavour this scenario.
It is now worth discussing the IGM transmission TIGM(Ly) which depends on both the “intrinsic” (pre-IGM) Ly spectrum emerging and the IGM properties. Due to the resonant absorption of the neutral or partially neutral IGM combined with cosmological inflow, the Ly spectrum blueward of km s-1 is absorbed (Dijkstra, & Wyithe, 2007). Thus, the more asymmetric the intrinsic Ly is towards the blue or the lower the red peak offset from systemic, the lower TIGM. All this implies that TIGM is highly uncertain and estimates reach from tens of percent (e.g., T at , Laursen et al. 2011) to values approaching unity for an intrinsic single read peak with offset km s-1. However, since the Ly spectrum presented here is very narrow and asymmetric (cf. Sect. 2.1) it is likely that either a significant part of the red peak has been removed from the IGM (in case of an intrinsic spectrum with a large offset, and thus, large width), or an intrinsic blue component existed (in the case of a small intrinsic offset). Both cases would imply a significant absorption of the IGM, and hence, T. Knowledge of the systemic redshift, through, e.g., H information would be helpful in reconstructing the intrinsic Ly line, and thus, to constrain TIGM more qualitatively. This could, furthermore, rule out the radiative transfer effects as an origin of the large EW – which we already deem unlikely due to the asymmetry of the observed line.
We conclude that, even assuming TIGM(Ly)=1, a still quite extreme EW0(Ly) Å emerges from a region crossing the caustic, that can easily approach (or exceed) 1000Å assuming a more plausible TIGM(Ly) . Though not totally excluded, we do not consider in this work the possibilities that the large EW(Ly) originates from a very faint AGN (e.g., with BH mass of M⊙, Fan 2012) or a multiphase scattering medium (e.g., Neufeld, 1991).
4 Candidate Pop III stars
The predicted EW for metal free stellar populations exceeds 400Å and it goes up to a few thousands rest-frame (Inoue, 2011; Schaerer, 2013), and is observable if neighbouring sources (either Pop III or Pop II stars) have already contributed toward ionising a local bubble (Sobral et al., 2015). The large EW value reported in this work opens for a possible dominant contribution by extremely metal poor stars. It is interesting to calculate how many Pop III stars are needed to reproduce both the observed M1500 and L(Ly):
UV continuum: the apparent magnitudes at 1500Å rest-frame at for Pop III star at ZAMS with masses M⊙ are reported by Windhorst et al. (2018). In particular, stars with masses of 100, 300, and 1000M⊙ have magnitudes , , and , respectively, neglecting dust attenuation. Adopting (M, Sect. 3.2) and assuming for simplicity the same masses for all stars, the number of Pop III stars required to reproduce the intrinsic UV flux corresponding to MUV amounts to N(MUV) = 10, 30, and 110 for stellar masses of 1000, 300 and 100M⊙.
Ly emission: Mas-Ribas et al. (2016) provide the photon flux Q(Hi)[s-1] for different Pop III ZAMS stars and the conversion to L(Ly) luminosity considering case-B departure, stochastic sampling of the Salpeter and Top-Heavy IMFs and zero escape fraction of the Lyman continuum radiation (note, however, that if a fraction of the ionising radiation escapes, the emerging Ly would be dimmed linearly by the same factor, e.g., Schaerer 2013). We perform the calculation as above, assuming again the same mass for all stars (no boosting from the stochastic sampling of the IMF is considered). The Ly luminosity emerging from Pop-III stars of mass 1000, 300, and 100 M⊙ are , , and erg s-1. Under the assumption that N(Ly) = N(M (being Ly and MUV referring to the same star complex), the resulting TIGM(Ly) are 0.09, 0.11, and 0.16, respectively. These values double if the case-B is assumed, i.e., the predicted L(Ly) is about a factor two fainter (Mas-Ribas et al., 2016). With such values of TIGM(Ly) the resulting EW0(Ly) ranges between 4000-1500Å, for the three classes of Pop III stellar masses.
| Ly [erg s-1 cm-2] | |
|---|---|
| Ly [erg s-1] | |
| EW0(Ly) [Å] (T) | |
| M () | |
| Ly region [pc] | |
| Magnification [] | ; |
Future facilities are necessary to make a significant step forward. First, only the James Webb Space Telescope will access the optical rest-frame looking for the possible deficit of metals and the expected enormous Balmer emissions (e.g., Inoue, 2011), eventually gaining in depth with respect HST imaging. The next generation of Extremely Large Telescopes will also investigate the currently vague stellar component S by performing very deep imaging, while spectroscopy will address the deficiency of high-ionisation metal lines and the possible key Heii emission. The intrinsic Heii/Ly line ratio predicted for Pop III spans the range 0.01-0.10 (e.g., Schaerer, 2013; Mas-Ribas et al., 2016), implying the expected flux of Heii would be /TIGM(Ly) erg s-1 cm-2, clearly requiring an ELT-like telescope or an 8-10m class telescope in the most optimistic cases (TIGM(Ly) ).
Acknowledgments
We thank the anonymous referee for a constructive report. We thank Ll. Mas-Ribas and D. Schaerer for very stimulating discussions. This work is supported by PRIN-MIUR 2017 WSCC32. We acknowledge funding from the INAF main-stream (1.05.01.86.31). KC and GBC acknowledge funding from the ERC through the award of the Consolidator Grant ID 681627-BUILDUP. This work was supported in part by the NSF grant: COLLABORATIVE RESEARCH: The Final Frontier: Spectroscopic Probes of Galaxies at the Epoch of Reionization (AST-1815458, AST-1810822). MG acknowledges funding through HST-HF2- 51409.
References
- Bacon et al. (2010) Bacon, R., Accardo, M., Adjali, L., et al. 2010, Proc. SPIE, 7735, 773508
- Caminha et al. (2017) Caminha, G. B., Grillo, C., Rosati, P., et al. 2017, A&A, 600, A90
- Dayal, & Ferrara (2018) Dayal, P., & Ferrara, A. 2018, Phys. Rep., 780, 1
- Dijkstra, & Wyithe (2007) Dijkstra, M., & Wyithe, J. S. B. 2007, MNRAS, 379, 1589
- Dijkstra (2016) Dijkstra, M. 2016, Understanding the Epoch of Cosmic Reionization: Challenges and Progress, 145
- Fan (2012) Fan, X. 2012, Research in Astronomy and Astrophysics, 12, 865
- Hernán-Caballero et al. (2017) Hernán-Caballero, A., Pérez-González, P. G., Diego, J. M., et al. 2017, ApJ, 849, 82
- Inami et al. (2017) Inami, H., Bacon, R., Brinchmann, J., et al. 2017, A&A, 608, A2
- Inoue (2011) Inoue, A. K. 2011, MNRAS, 415, 2920
- Laursen et al. (2011) Laursen, P., Sommer-Larsen, J., & Razoumov, A. O. 2011, ApJ, 728, 52
- Kashikawa et al. (2012) Kashikawa, N., et al. 2012, ApJ, 761, 85
- Lotz et al. (2017) Lotz, J. M., et al. 2017, ApJ, 837, 97
- Maseda et al. (2018) Maseda, M. V., Bacon, R., Franx, M., et al. 2018, ApJ, 865, L1
- Mas-Ribas et al. (2016) Mas-Ribas, L., Dijkstra, M., & Forero-Romero, J. E. 2016, ApJ, 833, 65
- Meneghetti et al. (2010) Meneghetti, M., Rasia, E., Merten, J., et al. 2010, A&A, 514, A93
- Meneghetti et al. (2017) Meneghetti, M., Natarajan, P., Coe, D., et al. 2017, MNRAS, 472, 3177
- Merlin et al. (2019) Merlin, E., Pilo, S., Fontana, A., et al. 2019, A&A, 622, A169
- Neufeld (1991) Neufeld, D. A. 1991, ApJ, 370, L85
- Plazas et al. (2019) Plazas, A. A., Meneghetti, M., Maturi, M., et al. 2019, MNRAS, 482, 2823
- Rodney et al. (2018) Rodney, S. A., et al. 2018, Nature Astronomy, 2, 324
- Salvaterra et al. (2011) Salvaterra, R., Ferrara, A., & Dayal, P. 2011, MNRAS, 414, 847
- Schaerer (2013) Schaerer, D. 2013, The First Galaxies, Astrophysics and Space Science Library, Volume 396, 345
- Shibuya et al. (2018) Shibuya, T., Ouchi, M., Harikane, Y., et al. 2018, PASJ, 70, S15
- Shimasaku et al. (2006) Shimasaku, K., Kashikawa, N., Doi, M., et al. 2006, PASJ, 58, 313
- Sobral et al. (2015) Sobral, D., Matthee, J., Darvish, B., et al. 2015, ApJ, 808, 139
- Sobral et al. (2019) Sobral, D., Matthee, J., Brammer, G., et al. 2019, MNRAS, 482, 2422
- Steidel et al. (2011) Steidel, C. C., Bogosavljević, M., Shapley, A. E., et al. 2011, ApJ, 736, 160
- Tornatore, Ferrara & Schneider (2007) Tornatore, L., Ferrara, A., & Schneider, R. 2007, MNRAS, 382, 945
- Vanzella et al. (2017) Vanzella, E., et al. 2017, MNRAS, 467, 4304
- Vanzella et al. (2019) Vanzella, E., et al. 2019, MNRAS, 483, 3618
- Visbal et al. (2016) Visbal, E., Haiman, Z., & Bryan, G. L. 2016, MNRAS, 460, L59
- Wise (2019) Wise, J. H. 2019, arXiv e-prints, arXiv:1907.06653
- Windhorst et al. (2018) Windhorst, R. A., et al. 2018, ApJS, 234, 41
- Zackrisson et al. (2015) Zackrisson, E., González, J., Eriksson, S., et al. 2015, MNRAS, 449, 3057
- Zackrisson, & Vikaeus (2019) Zackrisson, E., & Vikaeus, A. 2019, arXiv e-prints, arXiv:1903.12555