The properties of the interstellar medium of galaxies across time as traced by the neutral atomic carbon [C I]
Abstract
We report ALMA observations of the neutral atomic carbon transitions [C I] and multiple CO lines in a sample of main sequence galaxies at , including novel information on [C I] and CO for of such normal objects. We complement our observations with a collection of galaxies with coverage of similar transitions, spanning the redshift interval and a variety of ambient conditions from local to high-redshift starbursts. We find systematic variations in the [C I]/IR and [C I]/high- () CO luminosity ratios among the various samples. We interpret these differences as increased dense molecular gas fractions and star formation efficiencies in the strongest high-redshift starbursts with respect to normal main sequence galaxies. We further report constant / ratios across the galaxy populations and redshifts, suggesting that gas temperatures traced by [C I] do not strongly vary. We find only a mild correlation with and that, generally, . We fit the line ratios with classical photodissociation region models, retrieving consistently larger densities and intensities of the UV radiation fields in sub-mm galaxies than in main sequence and local objects. However, these simple models fall short in representing the complexity of a multi-phase interstellar medium and should be treated with caution. Finally, we compare our observations with the Santa Cruz semi-analytical model of galaxy evolution, recently extended to simulate sub-mm emission. While we confirm the success in reproducing the CO lines, we find systematically larger [C I] luminosities at fixed IR luminosity than predicted theoretically. This highlights the necessity of improving our understanding of the mechanisms regulating the [C I] emission on galactic scales. We release our data compilation to the community.
1 Introduction
An accurate description of the physical mechanisms regulating gas in
galaxies is paramount to reach a complete understanding of how these
systems evolve with cosmic time. The recent advent of powerful
interferometers such as the NOrthern Extended Millimeter Array (NOEMA)
and, especially, the Atacama Large Millimeter Array (ALMA) have played
a major role in this regard, opening a window not only on traditional
molecular gas tracers, such as 12CO and dust
(e.g., Magdis et al., 2012a; Carilli & Walter, 2013; Bolatto et al., 2013; Scoville et al., 2014) in large samples of distant galaxies, but also
on lines previously inaccessible because of their intrinsic
faintness. These facilities have also allowed the study of galaxies at
unprecedented redshifts and
those representative of the bulk of the population, in addition to the
extremely bright starbursts and
sub-mm galaxies (SMGs). Particular attention has been given to
alternative proxies for the total molecular gas mass in galaxies,
highly desirable to complement CO and dust and to break the known
degeneracies hampering these tracers (Zanella et al., 2018; Cortzen et al., 2019). However, multiple elements and molecules have now been
detected in distant systems, allowing us to study their ionization conditions,
chemistry, metallicity, densities and temperatures.
In a previous work (Valentino et al., 2018, V18 hereafter), we
presented results on the lowest neutral carbon transition [C I] ( GHz) in normal galaxies at that lie on
the so called “main sequence” in the
stellar mass - star formation rate plane
(-SFR, Noeske et al. 2007; Elbaz et al. 2007; Daddi et al. 2007; Magdis et al. 2010; see also
Bourne et al. 2019; Brisbin et al. 2019; Lamarche et al. 2019). The use of
[C I] has theoretical and observational roots that have been
deepened over the years, revealing potential advantages over
alternative tracers (e.g., Papadopoulos et al., 2004, Madden et al. in
prep.). In V18 we showed that [C I] and low-
CO line emissions correlate on global scales irrespectively of the
redshift and galaxy type, bridging previous observations of local
infrared (IR) luminous objects (e.g., Gerin & Phillips, 2000; Papadopoulos et al., 2004; Liu et al., 2015; Israel et al., 2015; Kamenetzky et al., 2016; Jiao et al., 2017, 2019a) and
high-redshift SMGs (Walter et al., 2011; Alaghband-Zadeh et al., 2013; Yang et al., 2017; Bothwell et al., 2017; Andreani et al., 2018; Cañameras et al., 2018; Nesvadba et al., 2018, to mention some recent
efforts). Moreover, we reported
systematic variations of the / luminosity ratio of normal
main sequence galaxies from the starbursting SMG population,
consistently with results based on CO (e.g., Daddi et al., 2010; Magdis et al., 2012b; Genzel et al., 2015; Tacconi et al., 2018), supporting the existence of
different star formation regimes characterized by varying star
formation efficiencies (). This also
resulted in different [C I] abundances in main sequence, starburst
and SMG galaxies, naturally following the standard assumptions on the
and dust-to-gas conversion factors.
Here we move from the ground we laid in our previous work (i) expanding
our analysis to larger samples that became available during the last year,
and (ii) simultaneously studying multiple line transitions, allowing
us to study the properties of the interstellar medium across redshift
and galaxy types. In particular, we introduce new ALMA observations of the
excited [C I] line ( GHz) in % of the
main sequence galaxies that we presented in V18, giving simultaneous
access to the CO transition. These observations open a view both on the
excited [C I] gas, allowing for a direct estimate of the gas temperature
via the [C I]/[C I] ratio (Stutzki et al., 1997; Schneider et al., 2003; Weiß et al., 2003; Papadopoulos et al., 2004), and on the dense and warm gas phases so far
explored only in the brightest galaxies at high redshift
(e.g., Yang et al., 2017; Cañameras et al., 2018; Apostolovski et al., 2019). The availability of multiple
line ratios for sizable and controlled samples of high-redshift
galaxies is also the basis for modeling the [C I], CO, and dust
emission, a historically complicated endeavor especially for what
concerns [C I]. Classical monodimensional photodissociation region models predict
the [C I] emission to arise only from a thin layer in between [C II] and
CO (Tielens & Hollenbach, 1985; Kaufman et al., 1999), struggling to reproduce fully
concomitant [C I] and CO emission in local giant molecular clouds
(Keene et al., 1996; Ojha et al., 2001; Ikeda et al., 2002). More recent refinement,
including non-equilibrium chemistry (Stoerzer et al., 1997), turbulent
mixing (Xie et al., 1995; Glover et al., 2015), clumpy geometries (Stutzki et al., 1998), and
the effect of cosmic rays (Papadopoulos et al., 2004, 2018; Bisbas et al., 2015, 2017) and 3D geometry (Bisbas et al., 2012) have
been more successful in this sense. The addition of extra
heating mechanisms (e.g., shocks, Lee et al., 2019), or
radically different approaches (e.g., large velocity gradients,
LVG, Young & Scoville, 1991) have been recently successful in reproducing the
interstellar medium (ISM) conditions in local resolved star forming regions or CO+[C I] emission in nuclear starbursts (Israel et al., 2015), detecting
multiple phases traced by different line transitions. However, such
modeling requires large amount of data tracing the various ISM
components, which become progressively hard to collect at increasing redshifts
or for faint galaxies. A tradeoff between model complexity and its
applicability is what we aim at in this work.
Finally, the availability of a large compilation of galaxies with [C I] detections allows one to insert this emission line
in the cosmological context of galaxy evolution. Recent works have been
focusing on the modeling of the CO and [C II] emission, given
their intrinsic brightness and coverage up to extremely high redshift
(see Olsen et al., 2018, and references therein for a recent review),
reaping the first rewards of such effort. Less attention has been dedicated
to [C I], but models are quickly filling the gap. Here we focus on a
recent implementation of the sub-mm lines emission modeling onto the
Santa Cruz semi-analytical model described in Popping et al. (2019a). We
will show how the fiducial model compares with the observed [C I],
CO, and IR luminosities and how these observables can be
inserted in the empirical frame of known scaling relations across
redshifts.
This paper is organized as follows. In Section 2, we present the new ALMA data targeting [C I]+CO in main sequence galaxies at , along with the description of the data compilation we assembled from the literature. Section 3 includes the main observational results of our work and their interpretation in the frame of the empirical scaling relations. In Section 4, we apply a simple photodissociation region model to interpret the observed trends, we discuss its limitations, and we introduce the comparison with the semi-analytical modeling mentioned above. Section 5 summarizes the results of our work. The whole data compilation we assembled for this work is made publicly available in an electronic format in the online version or by requesting it to the contact author. Unless stated otherwise, we assume a CDM cosmology with , , and km s-1 Mpc-1 and a Chabrier initial mass function (IMF, Chabrier, 2003). All magnitudes are expressed in the AB system. All the literature data have been homogenized with our conventions.
2 Sample and observations
The galaxies we study here largely overlap with the sample of main sequence galaxies presented in Valentino et al. (2018). In this work, we also present new observations of the [C I] and CO transitions for 7 objects from V18 observed during ALMA Cycle 6. We further add the recent observations of main sequence galaxies by Bourne et al. (2019) and Popping et al. (2017), and the sub-mm galaxies listed in Yang et al. (2017); Andreani et al. (2018); Cañameras et al. (2018); Nesvadba et al. (2018); Dannerbauer et al. (2019); Jin et al. (2019). In total we retrieve information about [C I] emission in 217 galaxies111Our collection refers to published material prior to May 2019, to the best of our knowledge. Other works have been brought to our attention after we conducted our analysis (e.g., Gullberg et al., 2016; Strandet et al., 2017; Lelli et al., 2018; Man et al., 2019). These and further results will be included in future versions of this database.. A certain degree of inhomogeneity is inherent in the nature of such a large literature compilation (e.g., different selections, single dish vs interferometric observations, flux extraction, modeling). Whenever possible, we homogenized the measurements adopting a single approach, for example when fitting the far-IR SED (see below, Appendix A, and the supplementary material). Here we briefly summarize the salient properties of each sample, referring the reader to Valentino et al. (2018) and the original papers for further details. Statistics of the data collection are reported in Table 1.
| Reference | [C I] | [C I] | |||
|---|---|---|---|---|---|
| High-redshift main sequence galaxies | |||||
| This work, Valentino et al. (2018) | 20 (3) | 7 (0) | 11 (0) | 19 (0) | 7 (0) |
| Bourne et al. (2019) | 6 (4) | 4 (5) | |||
| Popping et al. (2017); Talia et al. (2018) | 1 (0) | 1 (0) | |||
| Total | 27 (7) | 7 (0) | 11 (0) | 24 (5) | 7 (0) |
| Local IR-luminous galaxies | |||||
| Liu et al. (2015); Kamenetzky et al. (2016)† | 32 (114) | 126 (20) | 29 (0) | 56 (90) | 104 (42) |
| High-redshift SMGs and QSOs | |||||
| Walter et al. (2011); Alaghband-Zadeh et al. (2013); | 17 (4) | 11 (7) | 22 (0) | 12 (1) | |
| Cortzen et al. (submitted) | |||||
| Bothwell et al. (2017) | 9 (4) | 9 (0) | 13 (0) | ||
| Cañameras et al. (2018); Nesvadba et al. (2018); | 7 (0) | 8 (0) | 5 (0) | 11 (0) | 10 (0) |
| Harrington et al. (2018) | |||||
| Yang et al. (2017); Andreani et al. (2018) | 7 (4) | 11 (0) | 10 (1) | ||
| Dannerbauer et al. (2019) | 1 (0) | 1 (0) | 1 (0) | ||
| Jin et al. (2019) | 1 (0) | 1 (0) | |||
| Total | 35 (8) | 26 (11) | 15 (0) | 59 (0) | 32 (1) |
Note. — Line coverage: detections (upper limits).
†: The mid- and high- CO measurements refer only to the CO and CO that we investigated here. See Liu et al. (2015) for results concerning the remaining CO transitions.
2.1 Main sequence galaxies
This sample is composed of two main sets of observations described in Valentino et al. (2018) and Bourne et al. (2019), plus a single object from Popping et al. (2017).
2.1.1 The [C I] transition
Valentino et al. (2018, V18): In our previous work, we selected targets mainly lying on the upper main sequence at in the COSMOS field (Scoville et al., 2007), while including a subsample of starburst galaxies (i.e., above the main sequence, Figure 1 in V18). The targets had available stellar mass estimates (Muzzin et al., 2013; Laigle et al., 2016), a spectroscopic confirmation from the COSMOS master catalog (M. Salvato et al. in preparation.), and a Herschel/PACS m and/or 160 m detection in the PEP catalog (Lutz et al., 2011). These galaxies were followed up in ALMA Band 6 during Cycle 4 (Project ID: 2016.1.01040.S, PI: F. Valentino), covering [C I] and, for part of the sample, CO . The ALMA campaign resulted in a secure determination of detections and upper limits on [C I] down to an average rms per beam of Jy km s-1 for a line width of km s-1. We computed the upper limits as , where is the average noise per channel over the velocity range of other securely detected lines for each individual source, and is the velocity bin size in km s-1 (see, e.g., Eq. 7 of Bothwell et al., 2013). Here we add two extra sources from that sample with secure [C I] detections, but excluded from V18 because of the absence of a second sub-mm transition to confirm the redshift, now granted by [C I] and CO (Section 2.1.2). Furthermore, all galaxies with CO coverage have been detected during the same runs. Moreover, and galaxies have CO and CO detections as part of independent ALMA programs (Project IDs: 2015.1.00260.S, 2016.1.00171.S, PI: Daddi; E. Daddi et al. 2019, in preparation). A large fraction of this sample (19/23) is also detected in the 1.1 and/or 3 mm continuum emission. We modeled the latter together with the whole far-IR SEDs listed in the “super-deblended” COSMOS catalog (Jin et al., 2018) following the prescriptions of Magdis et al. (2012b). We adopted the expanded Draine & Li (2007) models and incorporated the AGN templates by Mullaney et al. (2011) to derive and subtract the contribution of dusty tori to the integrated 8-1000 m IR luminosity, , for every source in the sample. Moreover, we flag as “AGN” objects with at least a 1/3 contribution to the total from an active nucleus, whose is detected with . We cross-checked this selection against the IRAC color criterion by Donley et al. (2012), retrieving consistent results. We note that our decomposition is sensitive to the coverage of the mid-IR wavelength regime and that it is effective to retrieve relatively bright AGN. We further remark that the detection of a millimeter continuum in the Rayleigh-Jeans tail of the dust emission is critical for a secure determination of the dust mass (e.g., Magdis et al., 2012b; Scoville et al., 2014). Finally, we estimated a luminosity-weighted dust temperature, , by fitting a modified black body model (MBB) to the SED. We report the line measurements for this sample in Table 2.
| ID | Type | ||||||||||||
|---|---|---|---|---|---|---|---|---|---|---|---|---|---|
| K | Units | Units | Units | Units | Jy km s-1 | Jy km s-1 | Jy km s-1 | Jy km s-1 | |||||
| (1) | (2) | (3) | (4) | (5) | (6) | (7) | (8) | (9) | (10) | (11) | (12) | (13) | (14) |
| 4233 | MS | ||||||||||||
| 7540 | MS | ||||||||||||
| 13205 | MS | ||||||||||||
| 13250 | MS | ||||||||||||
| 18538 | MS | ||||||||||||
| 18911 | MS | ||||||||||||
| 19021 | AGN | ||||||||||||
| 26925 | MS | ||||||||||||
| 30694 | MS | ||||||||||||
| 32394 | SB | ||||||||||||
| 35349 | MS | ||||||||||||
| 36053 | MS | ||||||||||||
| 36945 | AGN | ||||||||||||
| 37250 | MS | ||||||||||||
| 37508 | MS | ||||||||||||
| 38053 | SB | ||||||||||||
| 44641 | MS | ||||||||||||
| 121546 | MS | ||||||||||||
| 188090 | SB | ||||||||||||
| 192337 | MS | ||||||||||||
| 208273 | MS | ||||||||||||
| 218445 | MS | ||||||||||||
| 256703 | MS |
Note. — Column 1: ID. Column 2: spectroscopic redshift. Column 3: total IR luminosity integrated within m. Column 4: dust temperature. Column 5: dust mass-weighted mean intensity of the radiation field for the Draine & Li (2007) models. Columns 6 to 9: galaxy-integrated , , , and . Units: K km s-1 pc2. Columns 10 to 13: velocity integrated [C I], CO , CO , and CO fluxes. Column 14: galaxy type: MS = main-sequence; SB = starburst ( above the main-sequence); AGN = SED contaminated by torus emission.
Upper limits at .
See Valentino et al. (2018) and Section 2.1.1 for details.
(The data are available in the .fits files described in Table 6.)
Bourne et al. (2019) presented a set of 10 main sequence galaxies,
selected from the Ultra Deep Survey (UDS) and in the COSMOS
fields based on a SCUBA2 m detection in the SCUBA2 Cosmology
Legacy Survey (S2CLS; Geach et al., 2017). The sample covers the
redshift range as determined by the available
Hubble Space Telescope/WFC3 G141 grism spectroscopy
(Momcheva et al., 2016). All galaxies have a stellar mass determination
(Skelton et al., 2014) and they have been followed up in ALMA band
6 during Cycle 4 and 5 (Project IDs: 2016.1.01184.S and 2017.A.00013.S
PI: N. Bourne). The observations resulted in the
detection of [C I] at in 6/10 galaxies, a marginal
measurement at in 3/10 and an upper limit on 1/10
sources. CO measurements at
are reported for 4/9 galaxies with proper physical
coverage, along with 2/9 marginal detections at , and 3
upper limits.
Continuum emission at mm is detected for 7/10
galaxies. In order to avoid systematics on and the dust mass, , purely
due to modeling, we refitted the deblended far-IR SED
(Bourne et al., 2017, 2019) using the same prescriptions reported
in the previous paragraph. This resulted in dex larger
and dex larger than originally listed in
Bourne et al. (2019), consistently with well known systematics
(Magdis et al., 2012b, V18).
Popping et al. (2017); Talia et al. (2018): Finally, we included the compact main sequence
galaxy GS30274 at
reported in Popping et al. (2017) and subsequently followed up by Talia et al. (2018). This object has been selected in
GOODS-South following criteria comparable with the ones in V18
(spectroscopic confirmation, detection in Herschel/PACS and
SPIRE), but further requiring “compactness”
(van Dokkum et al., 2015). This extra criterion results in starburst-like
behavior of some properties (Popping et al., 2017; Gómez-Guijarro et al., 2019), which put this object in a likely transitioning
phase. GS30274 has been followed up in ALMA Bands 3 and 4 in Cycle 3 (Project
ID: 2015.1.00228.S, PI: G. Popping), resulting in
detections of [C I] CO , and CO , along with a
continuum emission at mm. Talia et al. (2018) further reported Band
3 and 6 observations (Project ID: 2015.1.01379.S, PI: P. Cassata) and
a detection of CO(6-5) and the underlying 1.4 mm continuum
at significance.
Also in this case, we refit the SED following
Magdis et al. (2012b), retrieving a % AGN contribution to ,
consistent with the observed red IRAC colors
(Donley et al., 2012) and the results in Talia et al. (2018). Correcting for the effect of the dusty torus, we
find a % lower and a larger than in Popping et al. (2017).
Altogether, we compiled 27 main sequence galaxies at detected at in [C I], plus 7 marginal detections or upper limits. Moreover, 24/34 sources have at least one detection of a mid- CO transition (), the rest of the sample having marginal measurements or upper limit on CO (5/34), CO (5/34) or not being covered at the relevant frequency ranges (1/34).
| ID | |||||
|---|---|---|---|---|---|
| K km s-1 pc2 | K km s-1 pc2 | Jy km s-1 | Jy km s-1 | mJy | |
| (1) | (2) | (3) | (4) | (5) | (6) |
| 18538 | |||||
| 19021 | |||||
| 35349 | |||||
| 188090 | |||||
| 192337 | |||||
| 208273 | |||||
| 256703 |
2.1.2 The [C I] transition
During ALMA Cycle 6, we collected Band 7 observations for a set of 7
galaxies extracted from the sample in V18 (Project ID:
2018.1.00635.S, PI: F. Valentino). We selected the targets based on
a secure [C I] detection, the simultaneous observability of [C I] and CO , the availability of alternative line
emissions (CO +CO for 2/7 objects, CO only for 1/7), and a well
constrained IR SED, allowing us to derive dust masses and total
(Section 2.1.1). We selected
5 typical main sequence galaxies, 1 starburst, and 1
AGN. We targeted the [C I] and
CO lines within contiguous spectral windows of 1.875 GHz and
with a spectral resolution of 7.8 MHz ( km s-1), enough to
spectrally resolve the emission lines. Five out of targets were
observed for the full proposed integration, the remaining being imaged
for 75% of the initial request, resulting in a higher rms (# 35349
and 208273 in Table 3). Data were
collected in the C43-1 configuration for a final synthesized beam of
”. We resolved the emission of every source, ensuring
minimal flux losses with Gaussian extractions
(Appendix B, Coogan et al. 2018; Puglisi et al. 2019). The data were reduced with a
combination of the standard pipeline with CASA (McMullin et al., 2007)
and a series of customized scripts with GILDAS222http://www.iram.fr/IRAMFR/GILDAS
(Guilloteau & Lucas, 2000), following the procedure described in V18 and
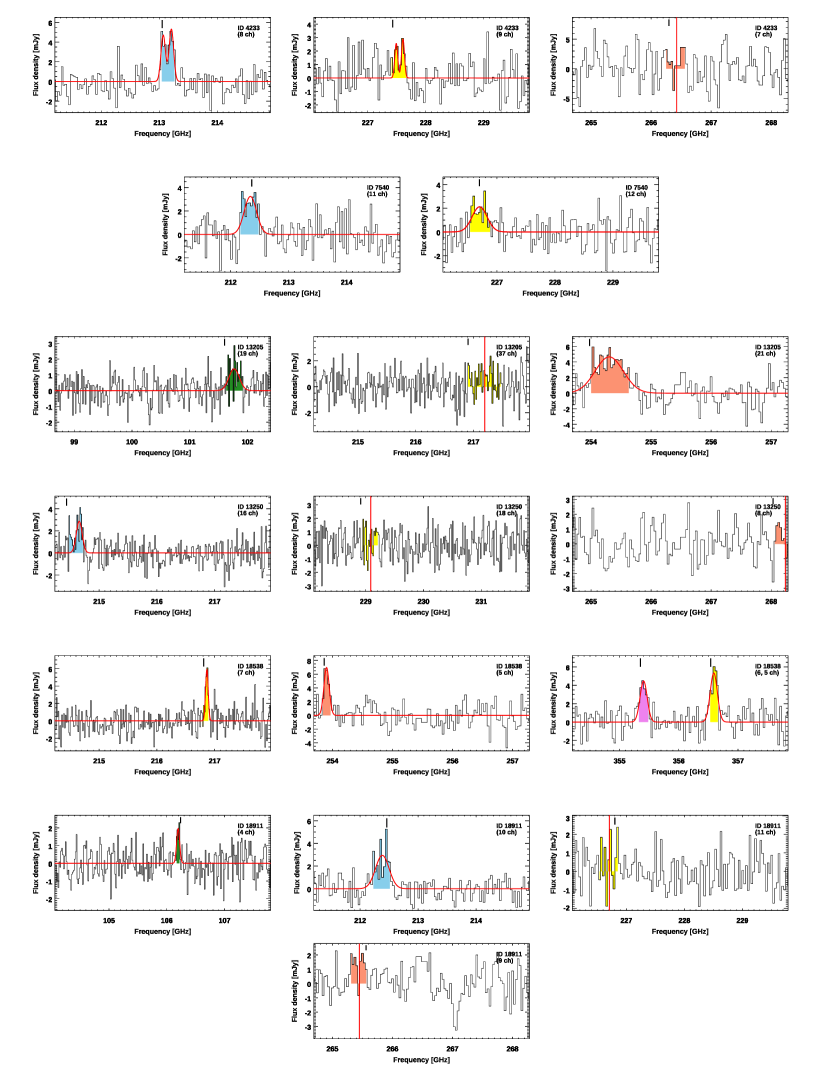
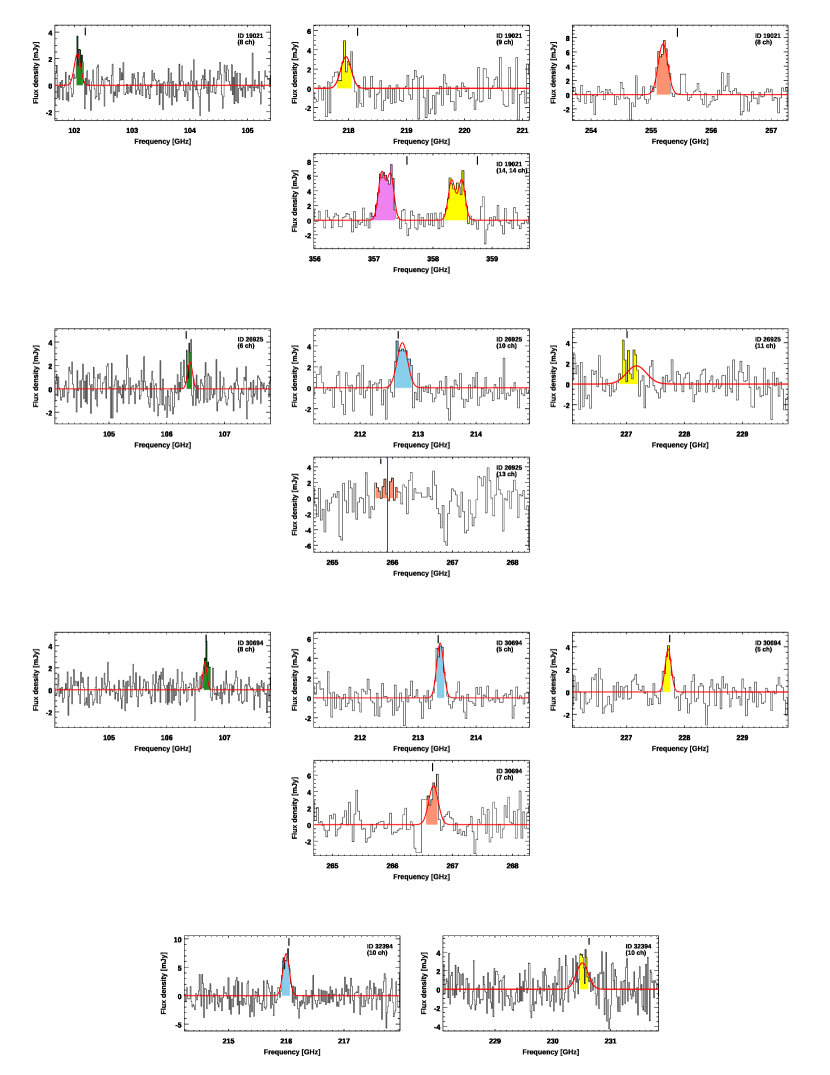
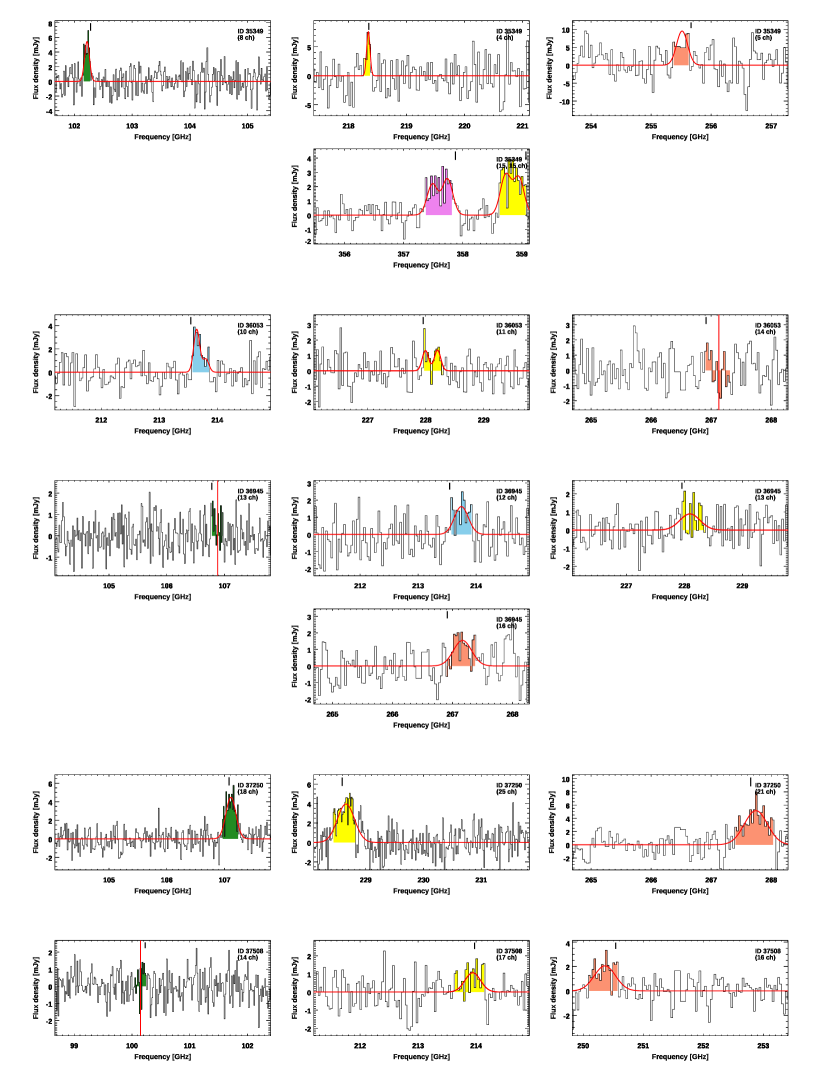
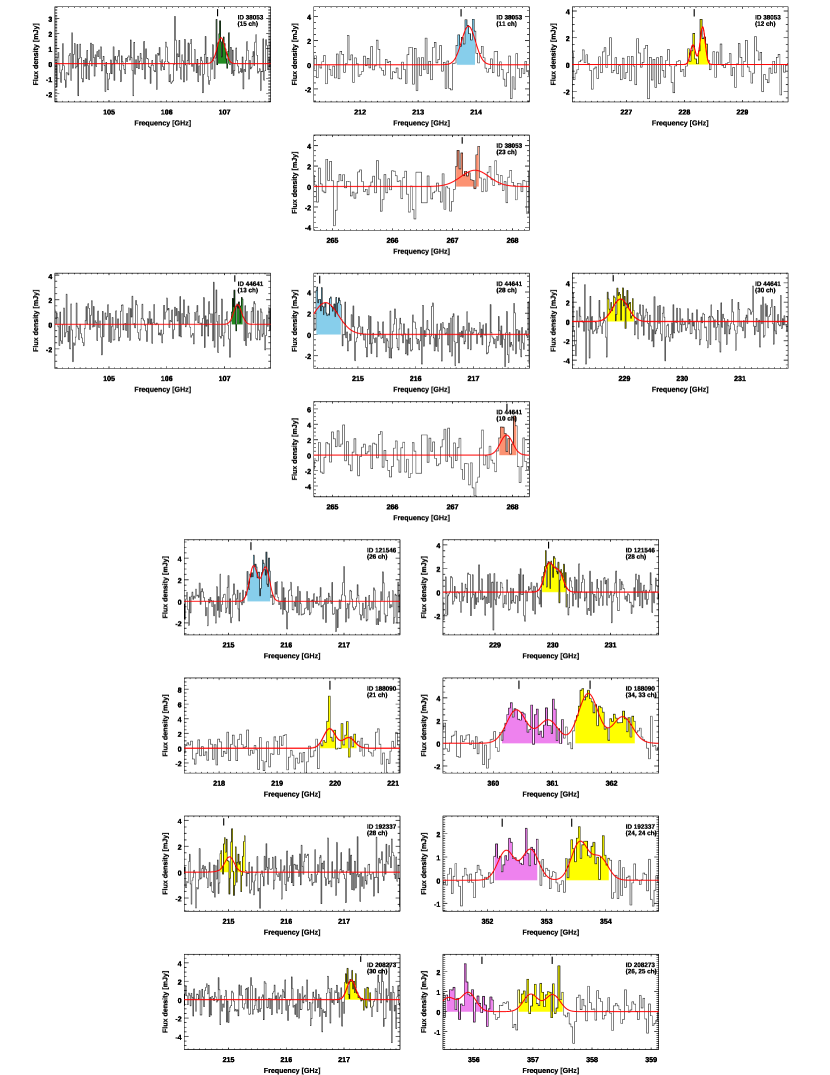
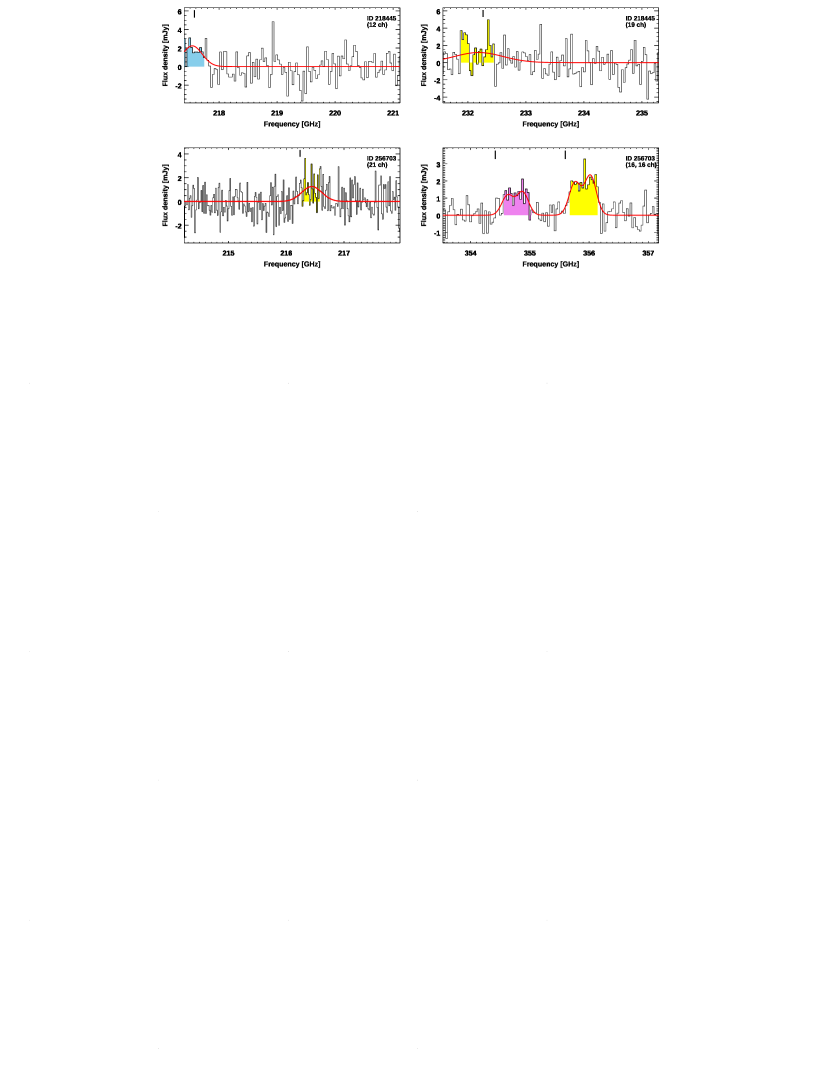
Daddi et al. (2015). We consistently extracted 1D spectra for all the
available lines, centering on the
brightest peaks among all the transitions available. We scanned the 1D
spectra and integrated the line fluxes over the number of channels
maximizing the S/N ratio of each candidate line emission. These line fluxes
were then increased by 10% to account for emission in
extended wings as found by modeling the spectra with single or double
Gaussian peaks. We performed such modeling using the
-minimization algorithm MPFIT (Markwardt, 2009) and using
both single and double Gaussians with constant velocity widths. In 6/7
cases the line emission are well fitted by double-peaked [C I] and CO profiles. This resulted in a 100% detection rate of both
transitions at . We measured line ratios by fixing the
redshifts and line widths to the
values for the highest S/N transitions among the ones available for
each source, with the exception of #35349, for which the [C I] and
CO lines are wider than [C I] and CO . For the vast majority of our sources, the estimates are
fully consistent with the ones reported in V18. In a few cases
(notably #188090 and #35349) the results significantly varied based on the new
[C I] and CO broad line detections.
We concurrently measured the continuum emission at observed
m over 7.5 GHz assuming an intrinsic slope of
(), excluding the channels covered by the
emission lines. We detected significant continuum emission at
in 7/7 sources.
All the line measurements and the underlying m continuum emission are reported in Table 3.
2.2 Local galaxies
Liu et al. (2015): This sample is composed of galaxies from a compilation of Herschel/Fourier Transform Spectrometer (FTS) observations in the Herschel Science Archive of local galaxies. We retrieve 32 (126) objects with a [C I] ([C I]) detection at . All 32 sources with a [C I] measurement are detected in [C I]. Multiple CO lines are generally available (Liu et al., 2015). In particular, 31/32 sources with [C I] and 105/126 objects with [C I] have coverage of the CO line (55 detections). All sources have coverage of CO (104 detections). For consistency, we checked our beam flux measurements against the independent analysis of Kamenetzky et al. (2016) and Israel et al. (2015), recovering consistent results for the sources in common among these samples. We corrected the luminosities from IRAS Sanders et al. (2003) to by multiplying by a factor of . This average correction was checked against full SED modeling for a subset of galaxies from the Great Observatories All-Sky LIRGs Survey (GOALS; Armus et al., 2009). For such subsample, we further estimated the dust temperature by fitting an MBB model as for the main sequence galaxies. As described in V18, we beam-matched the line luminosities to based on Herschel/PACS photometry. Therefore, the values adopted in our analysis refer to the total, galaxy-integrated quantities. We further include and beam-match the observations of low- CO transitions from Kamenetzky et al. (2016). We finally checked for signatures of galaxy nuclear activity by cross-matching our sample with the catalog by Véron-Cetty & Véron (2010), retrieving 12/32 and 43/126 galaxies that we therefore flag as “active”. Given the observed luminosities and properties, the local galaxy sample is representative of the starbursting population, rather than typical low-redshift spirals (V18).
2.3 High-redshift Submillimeter Galaxies and Quasars
We collected information about recent observations of the [C I] and/or [C I] transitions in high-redshift SMGs and QSOs. For these
objects, we retrieved the original far-IR to
sub-mm SED and refitted it following the same procedure and adopting
the identical models as for the main sequence galaxies in V18
described in the previous section. As noted in
that paper, this general results in larger 8-1000
m and up to larger than the widely
adopted MBB law (e.g., Blain et al., 2003; Magdis et al., 2012b; Dale et al., 2012; Bianchi, 2013). The
difference is larger for sources particularly bright in the
mid-IR (e.g., AGN/QSOs), where the difference between the MBB
and the Draine & Li (2007) models is maximal. For the same reason,
the more divergent the integration limits of the
“far-IR” luminosities (, 40-120 or 40-400 m,
depending on the convention) from the total (8-1000 m), the
greater the correction to apply. These differences are well known and
entirely due to the adopted models and their parameters (effective dust emissivity
index , dust mass absorption coefficient , peak temperature;
Magdis et al. 2012b). Only by correcting for these systematic
deviations, we can safely compare the relative behavior of the various
galaxy populations. We also notice that the vast majority of
galaxies in this sample does not have an estimate of the stellar mass
and we cannot canonically define them as main sequence or starburst
galaxies. However, their observed ISM conditions, gas and SFR
densities, and SFEs generally distinguish SMGs from main galaxies, and
we will thus consider them as starbursts as in our previous
analysis (V18).
Altogether we collected information about 60 SMGs at ,
35/60 detected in [C I] (8/60 upper limits) and
26/60 detected in [C I] (11/60 upper limits, Table 1). Moreover, 59/60
sources have at least one detection of a
mid- CO transition () and 21/60 are detected in
CO (4/60 upper limits).
Walter et al. (2011), Alaghband-Zadeh et al. (2013):
These authors targeted or collected information on typical
m selected SMGs at , including a high-redshift tail
of widely known and studied QSOs. Half of the sample is gravitationally
magnified up to and 30% is contaminated or dominated
by the emission of dusty tori surrounding the central supermassive
black hole.
Out of 23 galaxies, 17 are detected in [C I] and 11 in
[C I] (10 galaxies have both lines available). Moreover, 4/23 and
7/23 objects have upper limits on [C I] and [C I], respectively. We notably
substituted the old upper limits on the [C I] transitions in GN20 at
(Daddi et al., 2009; Casey et al., 2009) with the recent detections
with the NOEMA interferometer (Cortzen et al., submitted). The vast
majority of the sample (22/23) has a secure detection of CO or CO (5/23 galaxies have both line fluxes
available). Moreover, 12/23 objects have a detection of CO (1/23 upper limits). Sixty-five percent of these galaxies have
interferometric observations.
Bothwell et al. (2017): This sample comprises 13
strongly lensed systems () found in the
1.4 mm blank-field survey with the South Pole Telescope
(SPT; Vieira et al., 2010; Weiß et al., 2013), spectroscopically confirmed
to lie at by multiple line transitions, including both
high- and low- CO transitions (Weiß et al., 2013; Aravena et al., 2016) and ionized carbon emission [C II] (Gullberg et al., 2015). Bothwell et al. (2017) reports [C I] ALMA detections at
significance for 9/13 galaxies. No coverage of the [C I] line is available. Our SED modeling identifies only 1/13 source with a
significant contribution (%) of the central AGN to
the total .
Cañameras et al. (2018); Nesvadba et al. (2018): These authors
report IRAM/EMIR single-dish
observations of [C I] and/or [C I] in a subsample
of 11 galaxies from the Planck’s dusty Gravitationally
Enhanced subMillimetre Sources (GEMS; Cañameras et al., 2015). These
objects have been initially selected as the brightest among the isolated,
compact sources with the reddest m and m
Planck colors and subsequently followed up with multiple
facilities that sampled their far-IR / sub-mm SED and confirmed
their redshift with several line transitions
(, including CO from Harrington et al. 2018). The
magnification factor is generally well constrained
both for the continuum and the line emission, spanning a range of
. When necessary, in the analysis we
adopted separate and to correct the
continuum emission and its derived properties (e.g., , ) and
the line luminosities (from Table 1 of Cañameras et al., 2018). All 7/11 and 8/11
galaxies with [C I] and [C I] coverage, respectively, are securely detected
(Nesvadba et al., 2018). Four out of 11 sources have both
transitions available. Our SED modeling confirms the lesser AGN contribution to
the total reported in Cañameras et al. (2015)
(% for 3/11 galaxies, negligible for
the rest of the sample).
Dannerbauer et al. (2019): Dubbed the “Cosmic
Eyebrow” in analogy with the prototypical strongly lensed SMG
“Cosmic Eyelash” (Ivison et al., 2010; Danielson et al., 2011), this source
has been selected by cross-matching the
AllWISE and the Planck full-sky compact source
catalogs (Díaz-Sánchez et al., 2017). The red WISE colors and
ultrabright emission detected by Planck and SCUBA2
(Jones, 2015) have been recently confirmed to arise from two
lensed galaxies at by Dannerbauer et al. (2019), who report
[C I], CO , CO , and CO fluxes measured with NOEMA,
IRAM/EMIR and GBT, respectively. The NOEMA observations
spatially resolve the CO emission from the A and B components
and allow for the deblending of the far-IR emission, assuming an
average observed (i.e., magnified) luminosity ratio of
between the two galaxies. We have assumed this value in order to split the global
properties that we derived from the SED modeling (e.g., , with and ). Here we consider only the component A, to
which the [C I] and CO line emissions are associated.
Yang et al. (2017); Andreani et al. (2018): These authors
report [C I] measurements for 11 galaxies drawn from a
subsample of SMGs from the Herschel-Astrophysical Terahertz
Large Area Survey (H-ATLAS; Eales et al., 2010). The sources
have been selected based on their bright Herschel/SPIRE
m fluxes ( mJy), a suitable threshold to identify
strongly lensed dusty systems (e.g., Negrello et al., 2010). The
redshift confirmation at mainly came
from CO (Harris et al., 2012), followed by NOEMA, ALMA, and
APEX/SEPIA 5 campaigns detecting several sub-mm transitions, including
both molecular and atomic species (CO, H2O, and
[C I] Yang et al., 2017; Andreani et al., 2018). For our analysis, when available we adopted the
photometry in Zhang et al. (2018) and the magnification factors mainly
derived from m observations (Bussmann et al., 2013). When not
available, we used the photometry in Yang et al. (2017).
In total, we retrieve 7 detections at , 2 marginal
detections and 2 upper limits on [C I]. No
coverage of the [C I] line is available for these sources. All 11
galaxies have at least one detection in CO , CO , or CO .
Jin et al. (2019): We include the SMG at (ID:85001674) with [C I] and CO detections in ALMA Band 3 (Project ID: 2017.1.00373.S, PI: S. Jin). This and a handful of other sources were selected as residuals in the COSMOS/SCUBA2 m map, after the subtraction of known bright sources (Geach et al., 2017). Here we adopted their “intrinsic” quantities obtained including the effect of the CMB. Notice that the authors rely on a MBB law, since the CMB effect cannot currently be included in Draine & Li (2007) models. However, the final quantities have been corrected to total values to match the same conventions we adopt here. The results do not change using the “observed” values (see Table 3 in Jin et al. 2019).
3 Analysis and results
3.1 [C I] and mid-/high- CO line ratios
In V18 we showed that the [C I]/low- CO luminosity ratio () is constant
over and irrespectively of the galaxy type, suggesting that [C I] and CO are
well correlated on global scales. This extended previous findings for local
nuclear starbursts (e.g., Gerin & Phillips, 2000; Jiao et al., 2017, now
confirmed on sub-galactic scales, Jiao et al. 2019a) and
high-redshift SMGs (Yang et al., 2017) to the bulk of main sequence galaxies. Here
we focus on the comparison between [C I] and mid-/high- CO emission (), the latter expected to arise from warmer and denser
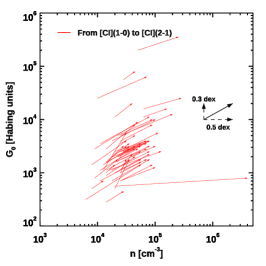
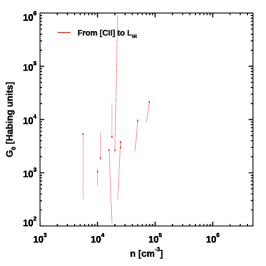
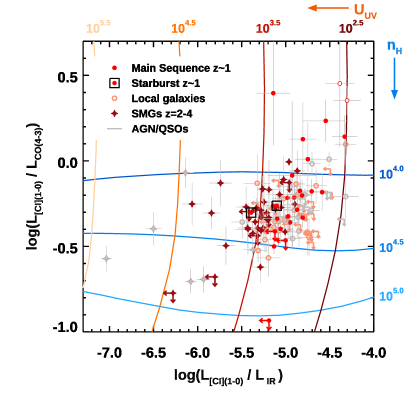
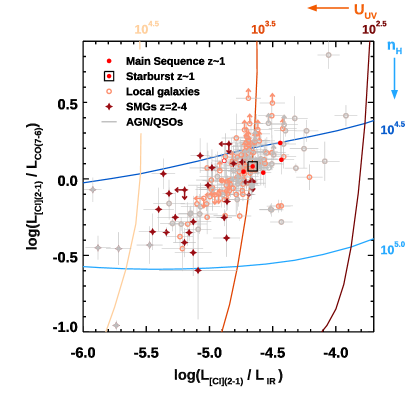
molecular phases. Figure 1 shows / as a
function of / and / against
/. The luminosities are all expressed in .
The choice of these line ratios is dictated by the close rest-frame
frequencies of these [C I]-CO couples, which make them often
observed simultaneously.
The use of line ratios mitigate the consequences of lensing, but
a differential effect can still affect the
emission arising from distinct ISM phases. We refer the
reader to the original works for a detailed description of
differential lensing on high-redshift sub-mm galaxies. On the
contrary, this is not a
concern for local and main sequence galaxies.
Since some galaxies do not have
direct observations of the CO line available, but were observed in a
adjacent transition, we used the following line ratios to correct to
CO : / and
/ for a total of 9 high-redshift SMGs
and / for 5 main sequence galaxies.
These factors are the observed average values for galaxies in
each sample with both CO lines available. The results
do not change adopting median corrections. The slight difference in
/ for SMGs and main sequence galaxies
might suggest a
different slope of the CO SLED (e.g., Daddi et al., 2015),
but it is not significant at this stage. No
correction was applied to /.
In both panels we find a gradient of observables across the
populations. High-redshift SMGs appear to have lower / and / ratios than the main sequence and local
LIRGs. A similar trend is appreciable for / and
/, as commented in V18. We quantify the differences in the
luminosity ratio parent distributions by running the set of non-parametric two-sample tests
from the twosampt task in the IRAF/STSDAS package (Feigelson & Nelson, 1985),
including the censored data, generally in the form of upper limits on
the [C I] luminosities. A notable exception is a substantial number
of lower limits ( galaxies) on the / ratios for the sample of local
LIRGs without AGN signatures. Since doubly censored data are not
allowed by the two sample tests, we separately ran the latter on the
population of lower and upper limits. This suite of tests includes the
logrank, the Gehan, Peto & Peto, and Peto & Prentice Generalized Wilcoxon tests.
Moreover, Table 4 reports the mean and its uncertainties
for each sample using the Kaplan & Meier (1958) estimator. We
exclude galaxies with a substantial contribution to the IR emission and,
potentially, to the line excitation from AGN/QSOs, since we cannot
securely disentangle the contribution to the dust emission heated by
star formation from the SED modeling. We show the position of such
galaxies in the plots, but their properties are driven by the
large ensuing the emission from dusty tori in the mid-IR (V18).
The probability that the observed distributions of / ratios are drawn
from the same parent distributions is for all the tests
when comparing the high-redshift SMGs and the main sequence
galaxies at . Similarly we retrieve
when considering
the SMGs and the local galaxies, with the exception of the Peto &
Prentice generalized Wilcoxon test returning a -value of
. We obtain marginally consistent distributions when
comparing local and main sequence galaxies at
(). Turning to /, we find evidence for
different parent distributions when comparing local and main sequence
galaxies () , but not for main sequence objects and SMGs
(), nor local galaxies and
SMGs (, except
for the Peto & Prentice test returning ). For what concerns
the distributions of the / ratios, we
find for all the tests
when comparing the high-redshift SMGs and the local
galaxies. Similarly, we find when comparing main sequence
objects at and SMGs, with the exception of the Peto &
Prentice test (). On the contrary, the local and main sequence
galaxies are consistent with being drawn from the same parent
distributions (), the -values spanning a different
range when considering separately upper and lower limits in the local
sample, but still safely larger than meaningful thresholds to reject
the null hypothesis. An identical conclusion is reached when comparing
the / ratios ( when comparing local and
main sequence galaxies at ; for main sequence
and high-redshift SMGs; for local galaxies and SMGs). We
stress that only a handful of main sequence galaxies with [C I] and CO measurements are currently available and, thus, these results will have to
be validated with larger samples.
The results of the tests on the [C I]/IR luminosity ratios confirm what
we found in the less numerous sample of V18: the local starbursts and
main
sequence galaxies share similar
properties, while significantly differing from the high-redshift
SMGs. Here we reach similar conclusions also for the
/ ratios, pointing towards an intrinsic difference
of the physical properties of the dense and diffuse gas in these
populations. The conclusions based on / are less
clear: our samples appear more homogeneous, as noted for [C I]/CO in V18. This might be due to the CO SLEDs
of the different samples being more similar at low and mid-
transitions, while clearly diverging at higher , where
the distributions keep rising for strongly starbursting systems,
while declining for “normal” disks (e.g., Liu et al., 2015; Daddi et al., 2015; Yang et al., 2017; Cañameras et al., 2018).
Since [C I], mid-/high- CO, and trace the low density, high density gas, and the SFR, respectively, we interpret these trends as evidence for increased dense molecular gas fractions and higher star formation efficiencies () in high-redshift SMGs than main sequence galaxies and local LIRGs. Assuming that the SMG population is dominated by starbursting galaxies (i.e., several times above the main sequence at their redshifts), this is consistent with the picture derived from classical CO-based studies (e.g., Solomon et al., 1997; Gao & Solomon, 1999, 2004; Daddi et al., 2010; Genzel et al., 2015; Yamashita et al., 2017; Tacconi et al., 2018) and dense molecular gas tracers (e.g., HCN, Gao et al., 2007). CO is arguably a better tracer of the dense molecular gas than mid- () and, thus, the separation of the various populations in the right panel of Figure 1 is more evident (despite the general caveat of possible contributions of XDR, Meijerink et al. 2007, or shocks, Lee et al. 2019, to the high- CO emission). Alternatively, these panels might be understood as manifestations of the (integrated) Schmidt-Kennicutt relation (Schmidt, 1959; Kennicutt, 1998a). Again, the better separation of the various populations in the right panel of Figure 1 derives from the tighter correlation with of CO than CO (Greve et al., 2014; Liu et al., 2015; Kamenetzky et al., 2016; Lu et al., 2015, 2017). CO shows in fact the tightest correlation with among the CO transitions, at least in the local universe (e.g., Lu et al., 2015; Liu et al., 2015).
| log(/) | log(/) | Detections/Censored | |
|---|---|---|---|
| Local galaxies | |||
| Main sequence | |||
| SMGs | |||
| log(/) | log(/) | ||
| Local galaxies (upper) | |||
| Local galaxies (lower) | |||
| Main sequence | |||
| SMGs | |||
| / | |||
| Local galaxies | |||
| Main sequence | |||
| SMGs | |||
Note. — †: The mean value is formally biased, since the lowest value is an upper limit.
3.2 [C I] line ratios and gas temperature
Given its simple three-level structure, the [C I]/[C I] line ratio
can serve as a measurement of the gas kinetic temperature (see
Papadopoulos et al. 2004 for a full derivation). Under the
assumption of local thermal equilibrium, the kinetic temperature
equals the excitation temperature , where , which further requires the lines to be optically thin
(Schneider et al., 2003; Weiß et al., 2003; Walter et al., 2011).
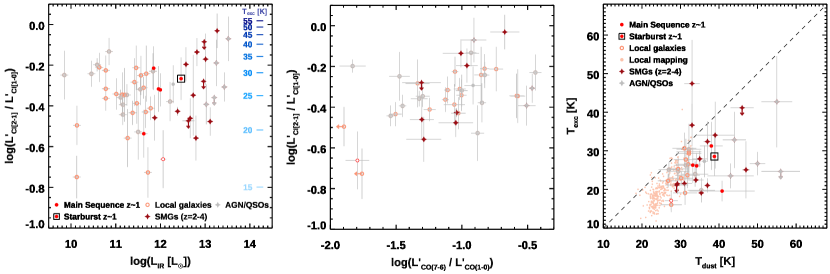
We show in Figure 2 the available galaxies
with both [C I] lines. The observed / ratios
of the local, main sequence at and
high-redshift SMG samples are fully consistent (Table
4) and we do not find any significant correlation
with . Notice that we considered only the detections
of both [C I] lines for the local sample, since the large number of
upper limits on [C I] does not affect the mean value reported
here. We further excluded # 35349 from the sample of main sequence
galaxies, given the mismatch of the two [C I] line profiles.
Converting the line ratios into temperatures, we find a mean temperature
of K for the whole compilation, including
upper limits. Nevertheless, the scatter of the measurements is
substantial: we find an interquartile range of K centered on a median value of K.
These values are consistent with our estimates in V18 and with
previous measurements reported for individual subsamples ( K, Walter et al. 2011; K, Nesvadba et al. 2018). Note that we excluded
the objects contaminated by AGN/QSOs from this calculation. The mean
temperature value is slightly lower than the commonly adopted K (e.g., Alaghband-Zadeh et al., 2013; Bothwell et al., 2017). While this has a minor impact on the calculation of
[C I] masses from [C I], lower temperatures affect such estimates
using [C I] as a tracer (e.g., Figure 2 in Weiß et al., 2005).
We further compared the excitation temperature
( /) with the luminosity-weighted dust temperature
from the modeling of
the SED with a single-component, optically thin modified black body curve
(Figure 2). We chose this
simple parametrization to facilitate the comparison with literature
data. However, similar conclusions can be drawn when
comparing with the mean
intensity of the radiation field from the
multi-component
Draine & Li (2007) models, an alternative tracer of the dust heating
correlated with a mass-weighted (, Magdis et al. 2017; Schreiber et al. 2018).
The dust temperature is frequently assumed
as a proxy for and the gas temperature, absent a direct
estimate, and under perfect
LTE, owing to the efficient dust and gas coupling (Carilli & Walter, 2013; da Cunha et al., 2013).
Here we identify a mild correlation between and only for the galaxy-integrated emission
from local objetcs with secure [C I] line detections
(, , and Kendall, Spearman, and Pearson’s
correlation coefficients, respectively), in agreement with previous
results, holding down to sub-galactic scales
(Jiao et al., 2017, 2019a). However, applying a
generalized Kendall’s tau correlation coefficient to include the lower
limits on with the task bhkmethod in IRAF
(Feigelson & Nelson, 1985), we find significant probabilities that and are not correlated (). Similarly,
at this stage there are no hints of a strong correlation
between and for the high-redshift
galaxies taken alone, nor for the
compilation as a whole, with similar probabilities from the
generalized Kendall’s tau test or even considering detections
only. However, as clear from Figure
2, this result might stem from the relatively
sparse high-redshift sample and its low number statistics. Notice
that in the vast majority of the cases, we find .
On the contrary, a mild correlation is present when comparing / and / ( probability that the two ratios do not correlate from the generalized Kendall’s tau test; , , and Kendall, Pearson, and Spearman’s correlation coefficients, respectively, considering only the detections, Figure 2). When not directly measured, for a handful of SMGs we estimated by converting luminosities following Bothwell et al. (2013). No usable low- CO transitions are available for our sample of main sequence galaxies at with coverage of both [C I] lines, excluded the aforementioned #35349. The observed correlation suggests that the CO and [C I] excitation conditions are related and, by extension, that the temperature traced by [C I] increases for steeper CO SLEDs.
4 Discussion
4.1 A view on the ISM: modeling of the photodissociation regions
We now attempt to provide further insight into the physical conditions of the ISM in galaxies by modeling the [C I], CO, and IR emission following the classical recipes for photodissociation regions (PDRs). Here we adopt the one-dimensional models by Kaufman et al. (1999) in the updated version released with the PhotoDissociation Region Toolbox333http://dustem.astro.umd.edu/pdrt (PDRT; Kaufman et al., 2006; Pound & Wolfire, 2008). The models solve simultaneously for the chemistry, thermal balance and radiative transfer, assuming metal, dust, and polycyclic aromatic hydrocarbons (PAHs) abundances, and a gas microturbulent velocity dispersion. For each combination of properties, a model is described in terms of the (number) density of H nuclei and the intensity of the incident far-ultraviolet radiation (FUV, ) in units of the local Galactic interstellar field ( erg cm-2 s-1, Habing, 1968). The original models cover the cm-3 and ranges in step of 0.25 dex. However, we rebinned the templates to a finer grid before fitting the data: this did not affect the final best-fit estimate of the density and intensity of the radiation field, but it allowed us to assess the statistical uncertainties of the fit. We computed the latter by applying the criterion by Avni (1976), fixing corresponding to a 90% confidence interval. We also adopted a purely numerical approach by bootstrapping 1000 times the observed flux ratios within their errors and using the 68%, 90%, and 95% inter-percentile ranges as the corresponding confidence intervals. The best-fit model results from the minimization of the line and continuum emission ratios.
To the standard ratios available from PDRT, we added the [C I]/IR
ratios. The latter mainly depend on through the IR emission due
to the dust clouds absorbing the UV incident emission and reprocessing
it at longer wavelength. On the other hand, in standard one-dimensional
PDR models, [C I] arises from the
C+/C/CO transition layer, which can be pushed deeper into the cloud
when the FUV field increases, but remaining substantially unchanged,
so that the column density of C does not depend on
(e.g. Tielens & Hollenbach, 1985; Kaufman et al., 1999; Gerin & Phillips, 2000).
We computed the IR intensity map as
erg cm-2 s-1 sr-1,
including the contribution to the
global dust heating from of photons outside the FUV regime and
considering the finite slab
geometry (Kaufman et al., 1999). An extra factor of should be
included when considering the case of multiple clouds filling the
beam – as for our unresolved measurements –, being illuminated from
every side. In this case, the optically thin IR emission from both the
near and far side of clouds would be visible
(Kaufman et al., 1999). However, a similar factor applies to
the optically thin [C I] emission, canceling out this effect.
We adopted the total IR luminosity (8-1000 m) due to
star-formation (i.e., removing the AGN contribution) from the
SED modeling as the estimate for IR. The only exceptions are
high-redshift QSOs, where the AGN emission dominates the far-IR
SED and we could not distinguish the contribution from star
formation. We therefore used the total and we highlighted their
location in the relevant plots. As noted above, systematic deviations in the [C I]/IR
ratios are largely due to this effect (V18).
Notice also that the Draine & Li (2007) suite of templates accounts for the independent
contributions to the total emission from the diffuse ISM and the PDRs,
but the available data does not allow us to discriminate between these
two components. We therefore used the combined, total IR
emission for the modeling.
While is constrained by [C I]/IR, a [C I]/mid- or high- CO ratio is an effective tracer of the gas density,
being almost insensitive to . Therefore, the
combination of [C I]/IR and [C I]/mid- or high- CO allows for a full
determination of the PDR properties. This is clear from the nearly
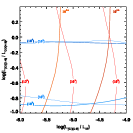
perpendicular tracks in Figure 1444The
intensity ratio maps from the Kaufman et al. (1999) models are
available in .fits format in the original PDRT
website.. Notice that our grid of models is different from the one
in Alaghband-Zadeh et al. (2013) due to the diverse approaches to
map into (Figure 8 in Appendix).
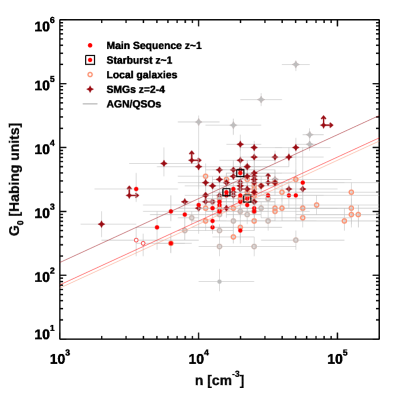
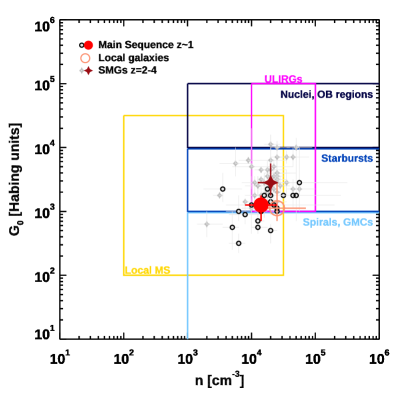
These models were applied to the available combinations of observed
ratios. We show the values from the modeling of ,
, and in Figure 3. The
median location of the local LIRGs, main sequence galaxies, and
high-redshift SMGs are also shown in comparison with regions occupied
by local main sequence galaxies (Malhotra et al., 2001), spirals and giant molecular clouds,
starbursts, nuclei and OB regions (Stacey et al., 1991), and ULIRGs
(Davies et al., 2003). The conclusions about the observed line ratios are
naturally reflected on the similar ratios for main sequence
galaxies at and local LIRGs, both lower than for SMGs. The
trend is driven by the increasing
(/). The median location and the
distribution of the values for main sequence galaxies at
is also consistent with the approximate boundaries for local
similar samples and spiral and GMCs, areas completely devoided of
SMGs.
Therefore, interpreting the gas and dust emission according to photodissociation region modeling further suggests similar ISM conditions in main sequence galaxies and local LIRGs, both less extreme that in high-redshift SMGs.
4.1.1 Caveats and shortcomings of PDR modeling
The modeling presented above allows only for a simple interpretation of basic combinations of line ratios, especially considering the lack of spatial resolution. However, the trends identified in the previous Section should be treated as an order of magnitude indication, since the modeling suffers from multiple limitations, as previously noted by several authors who attempted a similar analysis on part of the samples collected here (Appendix E, Alaghband-Zadeh et al., 2013; Bothwell et al., 2017; Cañameras et al., 2018, and references therein). Here we report further evidence that the view on the ISM offered by simple one-dimensional modeling is likely not sufficient to capture the physical complexity of this medium. As shown in Figure 1, galaxies in the [C I]/CO /IR and [C I]/CO /IR planes are mapped into different regions of the parameter space, the former line combination returning lower densities and intensities of the FUV radiation fields than the latter. This likely reflects gas in different phases, warmer and denser in the [C I]/CO /IR diagram than in [C I]/CO /IR. The adopted models struggle to reproduce the densest molecular gas, given the assumption of a moderate constant attenuation mag. We quantified the effect of modeling [C I] or [C I] keeping CO+IR fixed for the galaxies with both [C I] lines available. Figure 8 in Appendix shows that using [C I] results in and dex larger and than when adopting [C I] respectively, explaining most of the shift observed in Figure 1. We similarly tested the impact of using [C II] in lieu of for a sub-sample of the SPT-SMGs at . Both these quantities are primarily dependent on , so is not affected by this choice. Figure 8 shows that, despite the large scatter, modeling [C II] or gives consistent results. These tests show that the larger spread of reported when fitting simultaneously all the available luminosity ratios (Danielson et al., 2011; Alaghband-Zadeh et al., 2013) likely results from the inability of a single PDR model to capture a multi-component ISM.
4.2 Gas and dust temperatures
In Section 3.2 we reported the presence of a mild correlation between the gas excitation temperature derived from the [C I] line ratio and the luminosity-weighted dust temperature (or the mean intensity of the radiation field , Figure 2) for local galaxies, but also the lack of indications that a similarly significant correlation is in place for the high-redshift objects, possibly because of the sparsity of such sample. We further found that, generally, in our compilation, with a rather constant across the different populations and redshifts. If confirmed, this can be explained considering that, in first approximation, [C I] arises from a thin transitioning layer between CO and [C II], being insensitive to the ambient UV radiation field. Moreover, the fact that is consistent with what is reported for a subsample of high-redshift SMGs collected here (Nesvadba et al., 2018). This might suggest that gas and dust are not in thermal equilibrium (Cañameras et al., 2015; Nesvadba et al., 2018). Alternatively, considering a more realistic multi-phase ISM, might be determined by a hot component dominating the far-IR emission close to the peak and physically closer to the starbursting regions, while [C I] and the cold dust extend further out, tracing the bulk of the mass of the molecular gas (V18, Nesvadba et al., 2018). Our findings agree with recent findings by Jiao et al. (2019a), who retrieve a moderate - correlation in resolved maps of local galaxies (Section 3.2). We do find for the high-redshift sample as for the local resolved objects (Jiao et al., 2019b) and compatibly with the results by Bothwell et al. (2017) based on a line modeling approach. Here we note that, while is derived in a consistent way across different papers, is highly susceptible of strong variations due to the available photometry and the adopted parametrization of the IR SED. In particular, the lack of coverage of the peak of the emission strongly affects the estimate while classical single-temperature modified black body curves cannot reproduce the observed mid-IR emission, suggesting the existence of multi-component dust along with the ISM (Draine & Li, 2007; Galliano et al., 2011; Magdis et al., 2012b; Casey et al., 2014; Schreiber et al., 2018; Liang et al., 2019). Jiao et al. (2019a) estimate by assuming a gray body with modeling the rest-frame m ratio, a color that we cannot directly measure at high redshift. On the other hand, we fit the whole available far-IR SED with a single-temperature MBB leaving free to vary and assuming an optically thin emission, a common choice allowing for a direct comparison with data in the literature. This latter condition might have to be reconsidered, especially for strongly starbursting objects and SMGs. As shown by Cortzen et al. (submitted), removing this constraint in the SED modeling allows them to derive K for GN20, the strongest outlier in Figure 2. This is more consistent with K from [C I] than in the optically thin case shown in Figure 2 ( K). At the current stage, when removing the outliers, the correlation between these two quantities in the high-redshift sample remains weak. The possible future extension of the results on the optical depth of GN20 to the general population of strongly starbursting systems at high redshift (including the role of the cosmic microwave background da Cunha et al. 2013; Zhang et al. 2016), might change this conclusion (e.g., Jin et al., 2019). Finally, we note that we consistently modeled the dust emission for all galaxies at different redshifts. If a significant evolution with time were present, e.g., due to a metallicity change, this could affect the current results. However, given the large stellar masses and SFRs of the objects collected in this work, metallicity is unlikely to play a major role.
4.3 Neutral atomic carbon in a cosmological galaxy evolution context
The access to a large statistical sample of galaxies covering wide
ranges of redshifts and physical conditions allows us to start exploring the role
played by neutral atomic carbon in a broader cosmological context of galaxy
evolution, an operation so far accessible for a few CO transitions, dust, and increasingly for the bright [C II] emission thanks to
similarly numerous samples coming online (e.g., Carilli & Walter, 2013; Tacconi et al., 2018; Zanella et al., 2018; Liu et al., 2019, to mention a
few recent efforts). Here we compared the [C I] and CO line
luminosities from our compilation with the semi-analytical model
from Popping et al. (2019a). Briefly, the authors adopted the latest version of
the ‘Santa Cruz’ galaxy formation model (Somerville & Primack, 1999; Somerville et al., 2001; Popping et al., 2014; Somerville et al., 2015) as the input to
shape the emission of sub-mm CO,
[C II], and [C I] lines (Krumholz, 2014; Narayanan & Krumholz, 2017). They
applied various subgrid recipes to describe the dense and diffuse gas
distribution, the density profile within molecular clouds, the
clumping of the medium, the UV and cosmic ray fluxes regulating the
ionization and chemistry of the clouds. By combining chemical
equilibrium networks and radiative transfer models with sub-grid
models, Popping et al. (2019a) finally obtained different sets of CO, [C II],
and [C I] luminosities emerging from galaxies and readily comparable
with observations. We refer the reader to the original paper for
further details.
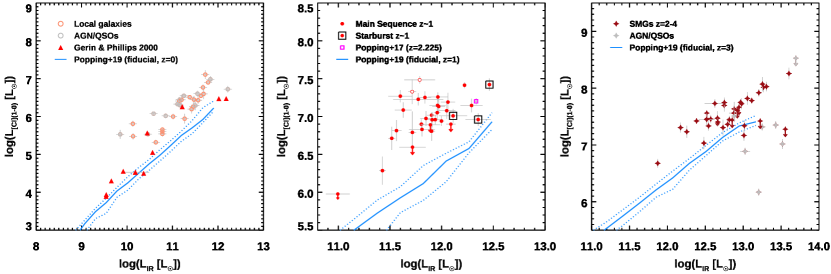
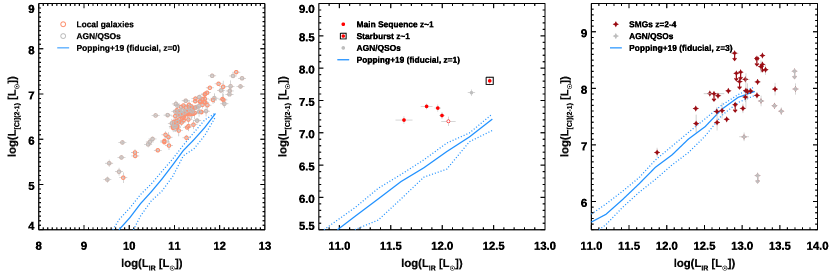
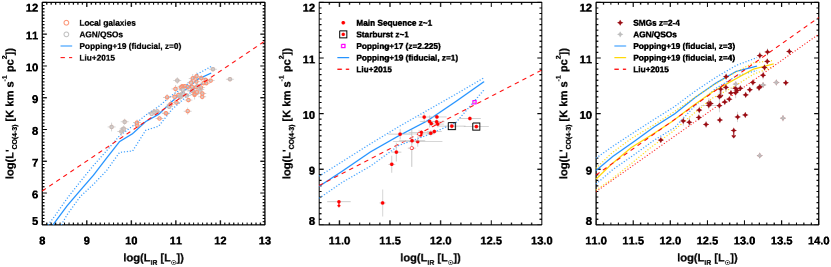
Figures 4, 5, and
6 show the [C I] [C I] and CO luminosities of our samples of galaxies compared with the predictions
from the fiducial model by Popping et al. (2019a). We show the samples
divided in redshifts bins and galaxy type (local LIRGs, main sequence
galaxies at , and SMGs at , Section
2). As in previous plots, we also show the position of
galaxies with contamination from AGN/QSOs. For reference, in Figure
4 we display the local galaxies from
Gerin & Phillips (2000) originally reported in Popping et al. (2019a). We
further remind the reader that we corrected both the measurements of
the dust and line emission of the local galaxies for the aperture
correction (V18, Liu et al., 2015). Such correction is identical for
and the line luminosity, therefore moving the galaxies
diagonally in the panels. Moreover, we converted the tracks originally
expressed as a function of SFR into by applying the
Kennicutt (1998b) conversion for a Chabrier (2003) initial
mass function. Popping et al. (2019a) originally
carried out the comparison with the observations by converting the
to SFR following the relation in Murphy et al. (2011). Using the
latter results in 0.16 dex lower for a fixed SFR than adopting
Kennicutt (1998b), not changing the substance of our results.
In every panel of Figures
4 and 5 the observed
[C I] luminosities appear brighter than the predictions of the fiducial
model at fixed . The observations seem to follow a steeper
(shallower) trend than the model in the - () plane
at , while the slope is similar at higher redshifts.
Notice that this tension would increase if a
substantial fraction of the total SFR is unobscured, reducing and moving the points towards the left. We register
the minimal discrepancy between [C I] observations and models for
the high-redshift SMGs in the - panel (Figure
5).
On the contrary, the model successfully
reproduces the CO emission from local and main sequence galaxies
at (Figure 6). For reference,
we also show the best fit - relation from
Liu et al. (2015). This is not surprising, considering the
performances of the fiducial model for low- and mid- CO transitions already reported by Popping et al. (2019a) for similar
datasets. We draw similar conclusions for CO . On the contrary,
the model overpredicts the luminosity of high-redshift
SMGs, which we find consistent with the -0.3 dex offset to the local
relation (Liu et al., 2015; Yang et al., 2017).
The offset between the [C I] observations and the fiducial model, not
corresponding to a displacement of the CO and [C II] measurements (Popping et al., 2019a, and references therein), suggests
that the emission of neutral atomic carbon is not fully captured by
the current recipes. We note that the
sSFRs predicted by the Santa Cruz model do match the observed values for the massive star-forming
population at , but the normalization of the main sequence falls below the
empirical estimates at . This is a well known issue, as shown in Figure 11
from Somerville et al. (2015). Our sample of main sequence galaxies at
makes no exception: the observed median
is larger than what is predicted by the
model. However, the results of the comparison do not change even
when limiting the model predictions to the star-forming population
matching the observed sSFR threshold.
On the other hand, the depletion timescales
or SFEs are reasonably well described by the Santa
Cruz model
(Somerville et al., 2015; Popping et al., 2019b).
Systematic differences in SFEs are unlikely to drive the
discrepancy with the observations in Figures
4-6, since both
[C I] and CO should have been similarly impacted. While
further work on the model is necessary to
remove the systematics on the sSFR, the relative comparison of
CO and [C I] emission as a function of still holds.
Therefore, the problem likely arises from the modeling of the
emission itself.
Interestingly, the [C I] emission appears to be
largely unaffected by several parameters, including the
the density of the diffuse atomic ISM, the choice of rescaling the
strength of the UV- and cosmic
ray fields to the local or the global SFR, the slope of the molecular
clouds distribution, the clumping of the ISM, and the radial density
profile within the clouds at a fixed external pressure. On the
contrary, the choice of the density profile within the molecular clouds
might increase the at fixed SFR (Figure 9 in
Popping et al. 2019a), also modifying the slope
of the relation, as the observations suggest (Figures
4 and 5).
Nevertheless, modifying only this parameter would generate tensions
with the CO and [C II] observations that are currently indiscernible. We
underline the fact that the model is meant to reproduce the bulk of
the galaxy population. Therefore, strongly deviating outliers, such as
starbursts and SMGs in the standard definitions
and shown here for the sake of completeness, would likely require
a specific treatment.
Further developments of these and alternative models appear necessary in
order to reproduce the observations. The compilation we publicly
release here will serve as a useful tool for calibration.
5 Conclusions
We presented new observations of [C I] and CO in a sample of main sequence galaxies at , along with a compilation of objects with detected [C I] and/or [C I], and one or multiple low to high- CO transitions. This compilation spans the redshift interval and a wide range of ambient conditions. We leveraged such a large sample to derive the following results.
-
•
The / and / ratios in local LIRGs and main sequence galaxies at are consistent, but systematically and significantly higher than the values measured in SMGs at . We draw a similar conclusion for the / ratio, while / appears more consistent among the different redshifts and populations, resembling the case of CO previously reported in V18.
-
•
The previous point can be interpreted considering that [C I], mid-/high- CO (), and trace the low density, high density molecular gas, and the SFR, respectively. The observed trends would thus suggest increased dense molecular gas fractions and higher SFEs in high-redshift SMGs than main sequence galaxies and local LIRGs, in agreement with CO-based studies. This is further consistent with the (integrated) Schmidt-Kennicutt relation and serves as supporting evidence of the potential of [C I] as an alternative molecular gas tracer.
-
•
The observed / ratios of the local, main sequence at and high-redshift SMG samples are fully consistent. This suggests a similar gas temperature traced by [C I] across redshift and galaxy type.
-
•
Moreover, the / ratio () mildly correlates with /, a proxy for the shape of the CO SLED. More extreme excitation for [C I] corresponds to similar conditions of CO, supporting the coexistence of these molecular gas tracers.
-
•
We find on global scales for the galaxies in our compilation and a mild correlation between these two quantities for local galaxies, but no apparent strong connection in the high-redshift sample. This might be due to the presence of multi-phased ISM and dust, with [C I] tracing a cold and extended component and the (luminosity-weighted) from the SED modeling being mainly driven by hot dust, not accounting for the bulk of the dust mass in the cold phase. However, this result critically depends on the modeling and parametrization of the far-IR SED and on relatively small number statistics of galaxies with both [C I] lines available, especially at high redshift.
-
•
We fitted the observed line ratios using classical one-dimensional photodissociation region models (Kaufman et al., 1999), retrieving similar for local LIRGs and main sequence galaxies at , but larger values for high-redshift SMGs, consistent with the conclusions reported above.
-
•
While valuable for a simple interpretation and relative comparisons among spatially unresolved observations, classical 1D PDR modeling is hampered by several shortcomings. Here we explored the impact of using different combinations of line ratios, finding the necessity of a more comprehensive approach in order to reproduce a likely complex and multi-phased ISM at any redshifts. This adds to other well known issues previously reported.
-
•
We compared our compilation with available semi-analytical models (Popping et al., 2019a) in order to place [C I] in a context of cosmological galaxy evolution. While we confirm a good agreement with fiducial model for the CO emission, we find systematically larger [C I] luminosities at fixed for any sample at any redshifts than the theoretical predictions. This suggests the necessity of a revision of some of the subgrid recipes assumed in the model.
-
•
We release the data compilation in an electronic format to the community as a benchmark for future testing and comparison.
Acknowledgements
We acknowledge the constructive comments from the anonymous referee, which helped improving this work. We thank Mark Sargent and Anna Cibinel for providing the initial catalogs for the selection of main sequence galaxies. We thank Nathan Bourne, Fabian Walter and Axel Weiß for providing the photometry and line emission for their samples. FV thanks Qian Jiao for clarifying details of her work and sharing her data; Diane Cormier for discussions about the PDR modeling. FV and GEM acknowledge the Villum Fonden research grant 13160 “Gas to stars, stars to dust: tracing star formation across cosmic time” and the Cosmic Dawn Center of Excellence funded by the Danish National Research Foundation under then grant No. 140. FV acknowledges support from the Carlsberg Foundation research grant CF18-0388 “Galaxies: Rise And Death”. GEM acknowledges support from the European Research Council (ERC) Consolidator Grant funding scheme (project ConTExt, grant number 648179). SJ acknowledges financial support from the Spanish Ministry of Science, Innovation and Universities (MICIU) under grant AYA2017-84061-P, co-financed by FEDER (European Regional Development Funds). DL acknowledges funding from the European Research Council (ERC) under the European Union’s Horizon 2020 research and innovation programme (grant agreement No. 694343). YG’s research is supported by National Key Basic Research and Development Program of China (grant No. 2017YFA0402704), National Natural Science Foundation of China (grant Nos. 11861131007, 11420101002), and Chinese Academy of Sciences Key Research Program of Frontier Sciences (grant No. QYZDJSSW-SLH008). In this work we made use of STSDAS. STSDAS is a product of the Space Telescope Science Institute, which is operated by AURA for NASA. This paper makes use of the following ALMA data: ADS/JAO.ALMA, #2018.1.00635.S, #2016.1.01040.S, #2016.1.00171.S, #2015.1.00260.S. ALMA is a partnership of ESO (representing its member states), NSF (USA) and NINS (Japan), together with NRC (Canada), MOST and ASIAA (Taiwan), and KASI (Republic of Korea), in cooperation with the Republic of Chile. The Joint ALMA Observatory is operated by ESO, AUI/NRAO and NAOJ. In this work we made use of the COSMOS master spectroscopic catalog, available within the collaboration and kept updated by Mara Salvato.
References
- Alaghband-Zadeh et al. (2013) Alaghband-Zadeh, S., Chapman, S. C., Swinbank, A. M., et al. 2013, MNRAS, 435, 1493, doi: 10.1093/mnras/stt1390
- Andreani et al. (2018) Andreani, P., Retana-Montenegro, E., Zhang, Z.-Y., et al. 2018, A&A, 615, A142, doi: 10.1051/0004-6361/201732560
- Apostolovski et al. (2019) Apostolovski, Y., Aravena, M., Anguita, T., et al. 2019, A&A, 628, A23, doi: 10.1051/0004-6361/201935308
- Aravena et al. (2016) Aravena, M., Spilker, J. S., Bethermin, M., et al. 2016, MNRAS, 457, 4406, doi: 10.1093/mnras/stw275
- Armus et al. (2009) Armus, L., Mazzarella, J. M., Evans, A. S., et al. 2009, PASP, 121, 559, doi: 10.1086/600092
- Avni (1976) Avni, Y. 1976, ApJ, 210, 642, doi: 10.1086/154870
- Bianchi (2013) Bianchi, S. 2013, A&A, 552, A89, doi: 10.1051/0004-6361/201220866
- Bisbas et al. (2012) Bisbas, T. G., Bell, T. A., Viti, S., Yates, J., & Barlow, M. J. 2012, MNRAS, 427, 2100, doi: 10.1111/j.1365-2966.2012.22077.x
- Bisbas et al. (2015) Bisbas, T. G., Papadopoulos, P. P., & Viti, S. 2015, ApJ, 803, 37, doi: 10.1088/0004-637X/803/1/37
- Bisbas et al. (2017) Bisbas, T. G., van Dishoeck, E. F., Papadopoulos, P. P., et al. 2017, ApJ, 839, 90, doi: 10.3847/1538-4357/aa696d
- Blain et al. (2003) Blain, A. W., Barnard, V. E., & Chapman, S. C. 2003, MNRAS, 338, 733, doi: 10.1046/j.1365-8711.2003.06086.x
- Bolatto et al. (2013) Bolatto, A. D., Wolfire, M., & Leroy, A. K. 2013, ARA&A, 51, 207, doi: 10.1146/annurev-astro-082812-140944
- Bothwell et al. (2013) Bothwell, M. S., Smail, I., Chapman, S. C., et al. 2013, MNRAS, 429, 3047, doi: 10.1093/mnras/sts562
- Bothwell et al. (2017) Bothwell, M. S., Aguirre, J. E., Aravena, M., et al. 2017, MNRAS, 466, 2825, doi: 10.1093/mnras/stw3270
- Bourne et al. (2019) Bourne, N., Dunlop, J. S., Simpson, J. M., et al. 2019, MNRAS, 482, 3135, doi: 10.1093/mnras/sty2773
- Bourne et al. (2017) Bourne, N., Dunlop, J. S., Merlin, E., et al. 2017, MNRAS, 467, 1360, doi: 10.1093/mnras/stx031
- Brisbin et al. (2019) Brisbin, D., Aravena, M., Daddi, E., et al. 2019, arXiv e-prints, arXiv:1907.04936. https://arxiv.org/abs/1907.04936
- Bussmann et al. (2013) Bussmann, R. S., Pérez-Fournon, I., Amber, S., et al. 2013, ApJ, 779, 25, doi: 10.1088/0004-637X/779/1/25
- Cañameras et al. (2015) Cañameras, R., Nesvadba, N. P. H., Guery, D., et al. 2015, A&A, 581, A105, doi: 10.1051/0004-6361/201425128
- Cañameras et al. (2018) Cañameras, R., Yang, C., Nesvadba, N. P. H., et al. 2018, A&A, 620, A61, doi: 10.1051/0004-6361/201833625
- Carilli & Walter (2013) Carilli, C. L., & Walter, F. 2013, ARA&A, 51, 105, doi: 10.1146/annurev-astro-082812-140953
- Casey et al. (2014) Casey, C. M., Narayanan, D., & Cooray, A. 2014, Phys. Rep., 541, 45, doi: 10.1016/j.physrep.2014.02.009
- Casey et al. (2009) Casey, C. M., Chapman, S. C., Daddi, E., et al. 2009, MNRAS, 400, 670, doi: 10.1111/j.1365-2966.2009.15517.x
- Chabrier (2003) Chabrier, G. 2003, PASP, 115, 763, doi: 10.1086/376392
- Coogan et al. (2018) Coogan, R. T., Daddi, E., Sargent, M. T., et al. 2018, MNRAS, 479, 703, doi: 10.1093/mnras/sty1446
- Cortzen et al. (2019) Cortzen, I., Garrett, J., Magdis, G., et al. 2019, MNRAS, 482, 1618, doi: 10.1093/mnras/sty2777
- da Cunha et al. (2013) da Cunha, E., Groves, B., Walter, F., et al. 2013, ApJ, 766, 13, doi: 10.1088/0004-637X/766/1/13
- Daddi et al. (2007) Daddi, E., Dickinson, M., Morrison, G., et al. 2007, ApJ, 670, 156, doi: 10.1086/521818
- Daddi et al. (2009) Daddi, E., Dannerbauer, H., Stern, D., et al. 2009, ApJ, 694, 1517, doi: 10.1088/0004-637X/694/2/1517
- Daddi et al. (2010) Daddi, E., Elbaz, D., Walter, F., et al. 2010, ApJ, 714, L118, doi: 10.1088/2041-8205/714/1/L118
- Daddi et al. (2015) Daddi, E., Dannerbauer, H., Liu, D., et al. 2015, A&A, 577, A46, doi: 10.1051/0004-6361/201425043
- Dale et al. (2012) Dale, D. A., Aniano, G., Engelbracht, C. W., et al. 2012, ApJ, 745, 95, doi: 10.1088/0004-637X/745/1/95
- Danielson et al. (2011) Danielson, A. L. R., Swinbank, A. M., Smail, I., et al. 2011, MNRAS, 410, 1687, doi: 10.1111/j.1365-2966.2010.17549.x
- Dannerbauer et al. (2019) Dannerbauer, H., Harrington, K., Díaz-Sánchez, A., et al. 2019, AJ, 158, 34, doi: 10.3847/1538-3881/aaf50b
- Davies et al. (2003) Davies, R. I., Sternberg, A., Lehnert, M., & Tacconi-Garman, L. E. 2003, ApJ, 597, 907, doi: 10.1086/378634
- Díaz-Sánchez et al. (2017) Díaz-Sánchez, A., Iglesias-Groth, S., Rebolo, R., & Dannerbauer, H. 2017, ApJ, 843, L22, doi: 10.3847/2041-8213/aa79ef
- Donley et al. (2012) Donley, J. L., Koekemoer, A. M., Brusa, M., et al. 2012, ApJ, 748, 142, doi: 10.1088/0004-637X/748/2/142
- Draine & Li (2007) Draine, B. T., & Li, A. 2007, ApJ, 657, 810, doi: 10.1086/511055
- Eales et al. (2010) Eales, S., Dunne, L., Clements, D., et al. 2010, PASP, 122, 499, doi: 10.1086/653086
- Elbaz et al. (2007) Elbaz, D., Daddi, E., Le Borgne, D., et al. 2007, A&A, 468, 33, doi: 10.1051/0004-6361:20077525
- Feigelson & Nelson (1985) Feigelson, E. D., & Nelson, P. I. 1985, ApJ, 293, 192, doi: 10.1086/163225
- Galliano et al. (2011) Galliano, F., Hony, S., Bernard, J. P., et al. 2011, A&A, 536, A88, doi: 10.1051/0004-6361/201117952
- Gao et al. (2007) Gao, Y., Carilli, C. L., Solomon, P. M., & Vand en Bout, P. A. 2007, ApJ, 660, L93, doi: 10.1086/518244
- Gao & Solomon (1999) Gao, Y., & Solomon, P. M. 1999, ApJ, 512, L99, doi: 10.1086/311878
- Gao & Solomon (2004) —. 2004, ApJ, 606, 271, doi: 10.1086/382999
- Geach et al. (2017) Geach, J. E., Dunlop, J. S., Halpern, M., et al. 2017, MNRAS, 465, 1789, doi: 10.1093/mnras/stw2721
- Genzel et al. (2015) Genzel, R., Tacconi, L. J., Lutz, D., et al. 2015, ApJ, 800, 20, doi: 10.1088/0004-637X/800/1/20
- Gerin & Phillips (2000) Gerin, M., & Phillips, T. G. 2000, ApJ, 537, 644, doi: 10.1086/309072
- Glover et al. (2015) Glover, S. C. O., Clark, P. C., Micic, M., & Molina, F. 2015, MNRAS, 448, 1607, doi: 10.1093/mnras/stu2699
- Gómez-Guijarro et al. (2019) Gómez-Guijarro, C., Magdis, G. E., Valentino, F., et al. 2019, arXiv e-prints, arXiv:1909.02572. https://arxiv.org/abs/1909.02572
- Greve et al. (2014) Greve, T. R., Leonidaki, I., Xilouris, E. M., et al. 2014, ApJ, 794, 142, doi: 10.1088/0004-637X/794/2/142
- Guilloteau & Lucas (2000) Guilloteau, S., & Lucas, R. 2000, in Astronomical Society of the Pacific Conference Series, Vol. 217, Imaging at Radio through Submillimeter Wavelengths, ed. J. G. Mangum & S. J. E. Radford, 299
- Gullberg et al. (2015) Gullberg, B., De Breuck, C., Vieira, J. D., et al. 2015, MNRAS, 449, 2883, doi: 10.1093/mnras/stv372
- Gullberg et al. (2016) Gullberg, B., Lehnert, M. D., De Breuck, C., et al. 2016, A&A, 591, A73, doi: 10.1051/0004-6361/201527647
- Habing (1968) Habing, H. J. 1968, Bull. Astron. Inst. Netherlands, 19, 421
- Harrington et al. (2018) Harrington, K. C., Yun, M. S., Magnelli, B., et al. 2018, MNRAS, 474, 3866, doi: 10.1093/mnras/stx3043
- Harris et al. (2012) Harris, A. I., Baker, A. J., Frayer, D. T., et al. 2012, ApJ, 752, 152, doi: 10.1088/0004-637X/752/2/152
- Ikeda et al. (2002) Ikeda, M., Oka, T., Tatematsu, K., Sekimoto, Y., & Yamamoto, S. 2002, ApJS, 139, 467, doi: 10.1086/338761
- Israel et al. (2015) Israel, F. P., Rosenberg, M. J. F., & van der Werf, P. 2015, A&A, 578, A95, doi: 10.1051/0004-6361/201425175
- Ivison et al. (2010) Ivison, R. J., Swinbank, A. M., Swinyard, B., et al. 2010, A&A, 518, L35, doi: 10.1051/0004-6361/201014548
- Jiao et al. (2017) Jiao, Q., Zhao, Y., Zhu, M., et al. 2017, ApJ, 840, L18, doi: 10.3847/2041-8213/aa6f0f
- Jiao et al. (2019a) Jiao, Q., Zhao, Y., Lu, N., et al. 2019a, arXiv e-prints, arXiv:1906.05671. https://arxiv.org/abs/1906.05671
- Jiao et al. (2019b) —. 2019b, ApJ, 883, 207, doi: 10.3847/1538-4357/ab44cc
- Jin et al. (2018) Jin, S., Daddi, E., Liu, D., et al. 2018, ApJ, 864, 56, doi: 10.3847/1538-4357/aad4af
- Jin et al. (2019) Jin, S., Daddi, E., Magdis, G. E., et al. 2019, arXiv e-prints, arXiv:1906.00040. https://arxiv.org/abs/1906.00040
- Jones (2015) Jones, S. F., 2015, PhD thesis, Univ. Leicester, doi: https://core.ac.uk/download/ pdf/42018134.pdf
- Kamenetzky et al. (2016) Kamenetzky, J., Rangwala, N., Glenn, J., Maloney, P. R., & Conley, A. 2016, ApJ, 829, 93, doi: 10.3847/0004-637X/829/2/93
- Kaplan & Meier (1958) Kaplan, E. L., & Meier, P. 1958, J. Am. Stat. Assoc., 53, 282, doi: 10.2307/2281868
- Kaufman et al. (2006) Kaufman, M. J., Wolfire, M. G., & Hollenbach, D. J. 2006, ApJ, 644, 283, doi: 10.1086/503596
- Kaufman et al. (1999) Kaufman, M. J., Wolfire, M. G., Hollenbach, D. J., & Luhman, M. L. 1999, ApJ, 527, 795, doi: 10.1086/308102
- Keene et al. (1996) Keene, J., Lis, D. C., Phillips, T. G., & Schilke, P. 1996, in IAU Symposium, Vol. 178, Molecules in Astrophysics: Probes & Processes, ed. E. F. van Dishoeck, 129
- Kennicutt (1998a) Kennicutt, Jr., R. C. 1998a, ApJ, 498, 541
- Kennicutt (1998b) —. 1998b, ARA&A, 36, 189, doi: 10.1146/annurev.astro.36.1.189
- Krumholz (2014) Krumholz, M. R. 2014, MNRAS, 437, 1662, doi: 10.1093/mnras/stt2000
- Laigle et al. (2016) Laigle, C., McCracken, H. J., Ilbert, O., et al. 2016, ApJS, 224, 24, doi: 10.3847/0067-0049/224/2/24
- Lamarche et al. (2019) Lamarche, C., Stacey, G. J., Vishwas, A., et al. 2019, ApJ, 882, 1, doi: 10.3847/1538-4357/ab3389
- Lee et al. (2019) Lee, M.-Y., Madden, S., Le Petit, F., et al. 2019, arXiv e-prints, arXiv:1905.10051. https://arxiv.org/abs/1905.10051
- Lelli et al. (2018) Lelli, F., De Breuck, C., Falkendal, T., et al. 2018, MNRAS, 479, 5440, doi: 10.1093/mnras/sty1795
- Liang et al. (2019) Liang, L., Feldmann, R., Kereš, D., et al. 2019, arXiv e-prints, arXiv:1902.10727. https://arxiv.org/abs/1902.10727
- Liu et al. (2015) Liu, D., Gao, Y., Isaak, K., et al. 2015, ApJ, 810, L14, doi: 10.1088/2041-8205/810/2/L14
- Liu et al. (2019) Liu, D., Lang, P., Magnelli, B., et al. 2019, ApJS, 244, 40, doi: 10.3847/1538-4365/ab42da
- Lu et al. (2015) Lu, N., Zhao, Y., Xu, C. K., et al. 2015, ApJ, 802, L11, doi: 10.1088/2041-8205/802/1/L11
- Lu et al. (2017) Lu, N., Zhao, Y., Díaz-Santos, T., et al. 2017, ApJS, 230, 1, doi: 10.3847/1538-4365/aa6476
- Lutz et al. (2011) Lutz, D., Poglitsch, A., Altieri, B., et al. 2011, A&A, 532, A90, doi: 10.1051/0004-6361/201117107
- Magdis et al. (2010) Magdis, G. E., Rigopoulou, D., Huang, J. S., & Fazio, G. G. 2010, MNRAS, 401, 1521, doi: 10.1111/j.1365-2966.2009.15779.x
- Magdis et al. (2012a) Magdis, G. E., Daddi, E., Béthermin, M., et al. 2012a, ApJ, 760, 6, doi: 10.1088/0004-637X/760/1/6
- Magdis et al. (2012b) —. 2012b, ApJ, 760, 6, doi: 10.1088/0004-637X/760/1/6
- Magdis et al. (2017) Magdis, G. E., Rigopoulou, D., Daddi, E., et al. 2017, A&A, 603, A93, doi: 10.1051/0004-6361/201731037
- Malhotra et al. (2001) Malhotra, S., Kaufman, M. J., Hollenbach, D., et al. 2001, ApJ, 561, 766, doi: 10.1086/323046
- Man et al. (2019) Man, A. W. S., Lehnert, M. D., Vernet, J. D. R., De Breuck, C., & Falkendal, T. 2019, A&A, 624, A81, doi: 10.1051/0004-6361/201834542
- Markwardt (2009) Markwardt, C. B. 2009, in Astronomical Society of the Pacific Conference Series, Vol. 411, Astronomical Data Analysis Software and Systems XVIII, ed. D. A. Bohlender, D. Durand, & P. Dowler, 251. https://arxiv.org/abs/0902.2850
- McMullin et al. (2007) McMullin, J. P., Waters, B., Schiebel, D., Young, W., & Golap, K. 2007, in Astronomical Society of the Pacific Conference Series, Vol. 376, Astronomical Data Analysis Software and Systems XVI, ed. R. A. Shaw, F. Hill, & D. J. Bell, 127
- Meijerink et al. (2007) Meijerink, R., Spaans, M., & Israel, F. P. 2007, A&A, 461, 793, doi: 10.1051/0004-6361:20066130
- Momcheva et al. (2016) Momcheva, I. G., Brammer, G. B., van Dokkum, P. G., et al. 2016, ApJS, 225, 27, doi: 10.3847/0067-0049/225/2/27
- Mullaney et al. (2011) Mullaney, J. R., Alexander, D. M., Goulding, A. D., & Hickox, R. C. 2011, MNRAS, 414, 1082, doi: 10.1111/j.1365-2966.2011.18448.x
- Murphy et al. (2011) Murphy, E. J., Condon, J. J., Schinnerer, E., et al. 2011, ApJ, 737, 67, doi: 10.1088/0004-637X/737/2/67
- Muzzin et al. (2013) Muzzin, A., Wilson, G., Demarco, R., et al. 2013, ApJ, 767, 39, doi: 10.1088/0004-637X/767/1/39
- Narayanan & Krumholz (2017) Narayanan, D., & Krumholz, M. R. 2017, MNRAS, 467, 50, doi: 10.1093/mnras/stw3218
- Negrello et al. (2010) Negrello, M., Hopwood, R., De Zotti, G., et al. 2010, Science, 330, 800, doi: 10.1126/science.1193420
- Nesvadba et al. (2018) Nesvadba, N., Canameras, R., Kneissl, R., et al. 2018, arXiv e-prints. https://arxiv.org/abs/1812.04653
- Noeske et al. (2007) Noeske, K. G., Weiner, B. J., Faber, S. M., et al. 2007, ApJ, 660, L43, doi: 10.1086/517926
- Ojha et al. (2001) Ojha, R., Stark, A. A., Hsieh, H. H., et al. 2001, ApJ, 548, 253, doi: 10.1086/318693
- Olsen et al. (2018) Olsen, K., Pallottini, A., Wofford, A., et al. 2018, Galaxies, 6, 100, doi: 10.3390/galaxies6040100
- Papadopoulos et al. (2018) Papadopoulos, P. P., Bisbas, T. G., & Zhang, Z.-Y. 2018, MNRAS, 478, 1716, doi: 10.1093/mnras/sty1077
- Papadopoulos et al. (2004) Papadopoulos, P. P., Thi, W.-F., & Viti, S. 2004, MNRAS, 351, 147, doi: 10.1111/j.1365-2966.2004.07762.x
- Popping et al. (2019a) Popping, G., Narayanan, D., Somerville, R. S., Faisst, A. L., & Krumholz, M. R. 2019a, MNRAS, 482, 4906, doi: 10.1093/mnras/sty2969
- Popping et al. (2014) Popping, G., Somerville, R. S., & Trager, S. C. 2014, MNRAS, 442, 2398, doi: 10.1093/mnras/stu991
- Popping et al. (2017) Popping, G., Decarli, R., Man, A. W. S., et al. 2017, A&A, 602, A11, doi: 10.1051/0004-6361/201730391
- Popping et al. (2019b) Popping, G., Pillepich, A., Somerville, R. S., et al. 2019b, ApJ, 882, 137, doi: 10.3847/1538-4357/ab30f2
- Pound & Wolfire (2008) Pound, M. W., & Wolfire, M. G. 2008, in Astronomical Society of the Pacific Conference Series, Vol. 394, Astronomical Data Analysis Software and Systems XVII, ed. R. W. Argyle, P. S. Bunclark, & J. R. Lewis, 654
- Puglisi et al. (2019) Puglisi, A., Daddi, E., Liu, D., et al. 2019, ApJ, 877, L23, doi: 10.3847/2041-8213/ab1f92
- Sanders et al. (2003) Sanders, D. B., Mazzarella, J. M., Kim, D.-C., Surace, J. A., & Soifer, B. T. 2003, AJ, 126, 1607, doi: 10.1086/376841
- Schmidt (1959) Schmidt, M. 1959, ApJ, 129, 243
- Schneider et al. (2003) Schneider, N., Simon, R., Kramer, C., et al. 2003, A&A, 406, 915, doi: 10.1051/0004-6361:20030726
- Schreiber et al. (2018) Schreiber, C., Elbaz, D., Pannella, M., et al. 2018, A&A, 609, A30, doi: 10.1051/0004-6361/201731506
- Scoville et al. (2007) Scoville, N., Aussel, H., Brusa, M., et al. 2007, ApJS, 172, 1, doi: 10.1086/516585
- Scoville et al. (2014) Scoville, N., Aussel, H., Sheth, K., et al. 2014, ApJ, 783, 84, doi: 10.1088/0004-637X/783/2/84
- Skelton et al. (2014) Skelton, R. E., Whitaker, K. E., Momcheva, I. G., et al. 2014, ApJS, 214, 24, doi: 10.1088/0067-0049/214/2/24
- Solomon et al. (1997) Solomon, P. M., Downes, D., Radford, S. J. E., & Barrett, J. W. 1997, ApJ, 478, 144, doi: 10.1086/303765
- Somerville et al. (2015) Somerville, R. S., Popping, G., & Trager, S. C. 2015, MNRAS, 453, 4337, doi: 10.1093/mnras/stv1877
- Somerville & Primack (1999) Somerville, R. S., & Primack, J. R. 1999, MNRAS, 310, 1087, doi: 10.1046/j.1365-8711.1999.03032.x
- Somerville et al. (2001) Somerville, R. S., Primack, J. R., & Faber, S. M. 2001, MNRAS, 320, 504, doi: 10.1046/j.1365-8711.2001.03975.x
- Stacey et al. (1991) Stacey, G. J., Geis, N., Genzel, R., et al. 1991, ApJ, 373, 423, doi: 10.1086/170062
- Stoerzer et al. (1997) Stoerzer, H., Stutzki, J., & Sternberg, A. 1997, A&A, 323, L13
- Strandet et al. (2017) Strandet, M. L., Weiss, A., De Breuck, C., et al. 2017, ApJ, 842, L15, doi: 10.3847/2041-8213/aa74b0
- Stutzki et al. (1998) Stutzki, J., Bensch, F., Heithausen, A., Ossenkopf, V., & Zielinsky, M. 1998, A&A, 336, 697
- Stutzki et al. (1997) Stutzki, J., Graf, U. U., Haas, S., et al. 1997, ApJ, 477, L33, doi: 10.1086/310514
- Tacconi et al. (2018) Tacconi, L. J., Genzel, R., Saintonge, A., et al. 2018, ApJ, 853, 179, doi: 10.3847/1538-4357/aaa4b4
- Talia et al. (2018) Talia, M., Pozzi, F., Vallini, L., et al. 2018, MNRAS, 476, 3956, doi: 10.1093/mnras/sty481
- Tielens & Hollenbach (1985) Tielens, A. G. G. M., & Hollenbach, D. 1985, ApJ, 291, 722, doi: 10.1086/163111
- Valentino et al. (2018) Valentino, F., Magdis, G. E., Daddi, E., et al. 2018, ApJ, 869, 27, doi: 10.3847/1538-4357/aaeb88
- van Dokkum et al. (2015) van Dokkum, P. G., Nelson, E. J., Franx, M., et al. 2015, ApJ, 813, 23, doi: 10.1088/0004-637X/813/1/23
- Véron-Cetty & Véron (2010) Véron-Cetty, M.-P., & Véron, P. 2010, A&A, 518, A10, doi: 10.1051/0004-6361/201014188
- Vieira et al. (2010) Vieira, J. D., Crawford, T. M., Switzer, E. R., et al. 2010, ApJ, 719, 763, doi: 10.1088/0004-637X/719/1/763
- Walter et al. (2011) Walter, F., Weiß, A., Downes, D., Decarli, R., & Henkel, C. 2011, ApJ, 730, 18, doi: 10.1088/0004-637X/730/1/18
- Weiß et al. (2005) Weiß, A., Downes, D., Henkel, C., & Walter, F. 2005, A&A, 429, L25, doi: 10.1051/0004-6361:200400085
- Weiß et al. (2003) Weiß, A., Henkel, C., Downes, D., & Walter, F. 2003, A&A, 409, L41, doi: 10.1051/0004-6361:20031337
- Weiß et al. (2013) Weiß, A., De Breuck, C., Marrone, D. P., et al. 2013, ApJ, 767, 88, doi: 10.1088/0004-637X/767/1/88
- Xie et al. (1995) Xie, T., Allen, M., & Langer, W. D. 1995, ApJ, 440, 674, doi: 10.1086/175305
- Yamashita et al. (2017) Yamashita, T., Komugi, S., Matsuhara, H., et al. 2017, ApJ, 844, 96, doi: 10.3847/1538-4357/aa7af1
- Yang et al. (2017) Yang, C., Omont, A., Beelen, A., et al. 2017, A&A, 608, A144, doi: 10.1051/0004-6361/201731391
- Young & Scoville (1991) Young, J. S., & Scoville, N. Z. 1991, ARA&A, 29, 581, doi: 10.1146/annurev.aa.29.090191.003053
- Zanella et al. (2018) Zanella, A., Daddi, E., Magdis, G., et al. 2018, MNRAS, 481, 1976, doi: 10.1093/mnras/sty2394
- Zhang et al. (2016) Zhang, Z.-Y., Papadopoulos, P. P., Ivison, R. J., et al. 2016, Royal Society Open Science, 3, 160025, doi: 10.1098/rsos.160025
- Zhang et al. (2018) Zhang, Z.-Y., Ivison, R. J., George, R. D., et al. 2018, MNRAS, 481, 59, doi: 10.1093/mnras/sty2082
Appendix A Spectral energy distribution of the high-redshift sample
As part of the supplementary online material, we show the re-modeling of the SED we performed for all the high-redshift galaxies from the literature samples that we collected (Figure 7). The SEDs of our own sample of main sequence galaxies are reported with an identical format in V18, excluding sources #208273 and 256703 included in this release. We do not show the SMG from Jin et al. (2019), being the modeling identical to the original work. In each panel, we show in red the photometric points we fitted and their uncertainties. Downpointing arrows indicate upper limits. Open red symbols mark photometry from Spitzer/IRAC and radio when available, which we did not use to constrain the fit. The black line shows the best composite SED (Draine & Li (2007) and AGN templates from Mullaney et al. (2011), the latter highlighted in blue).
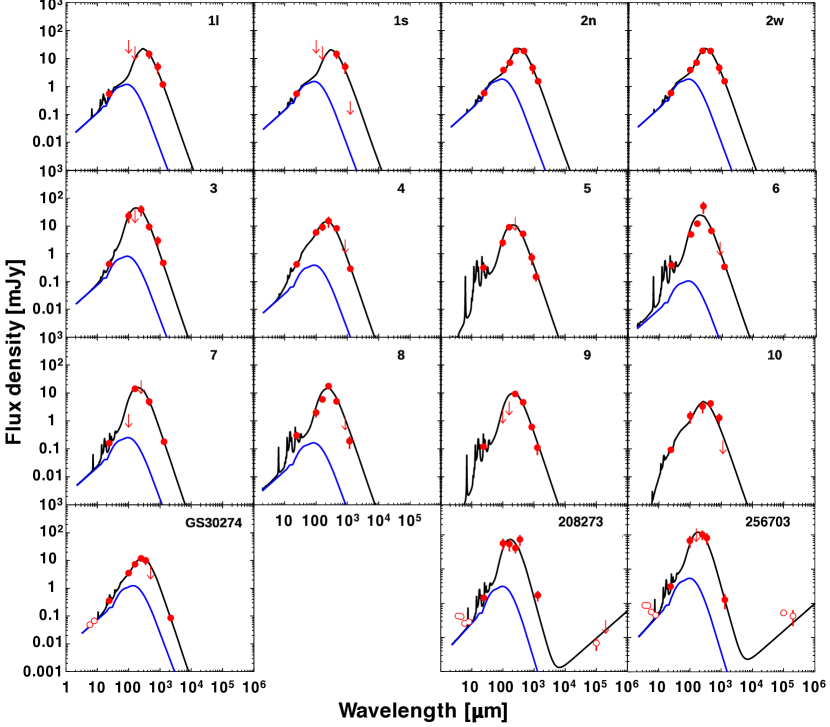
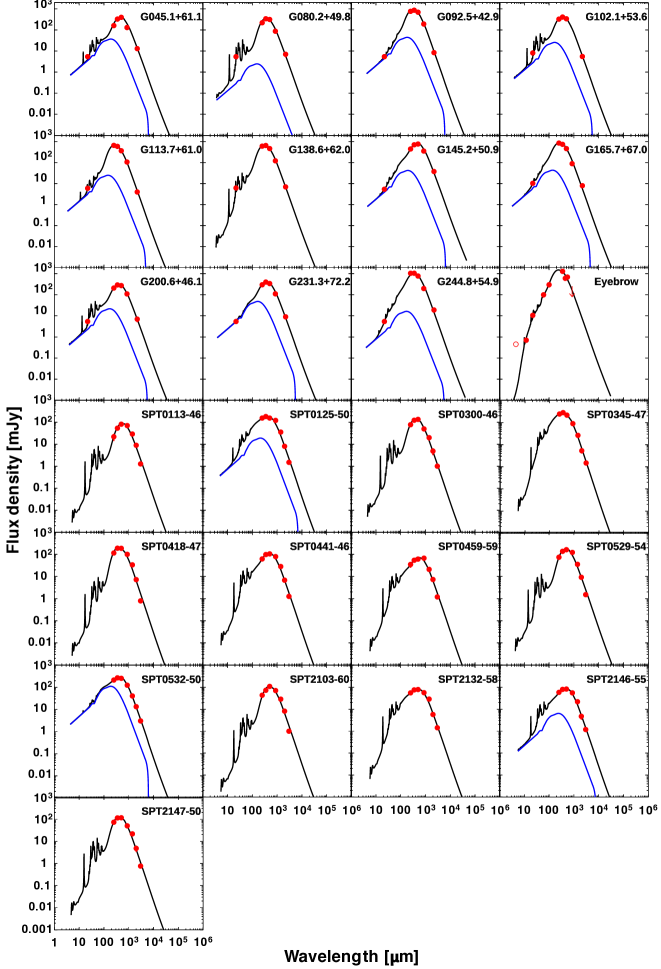
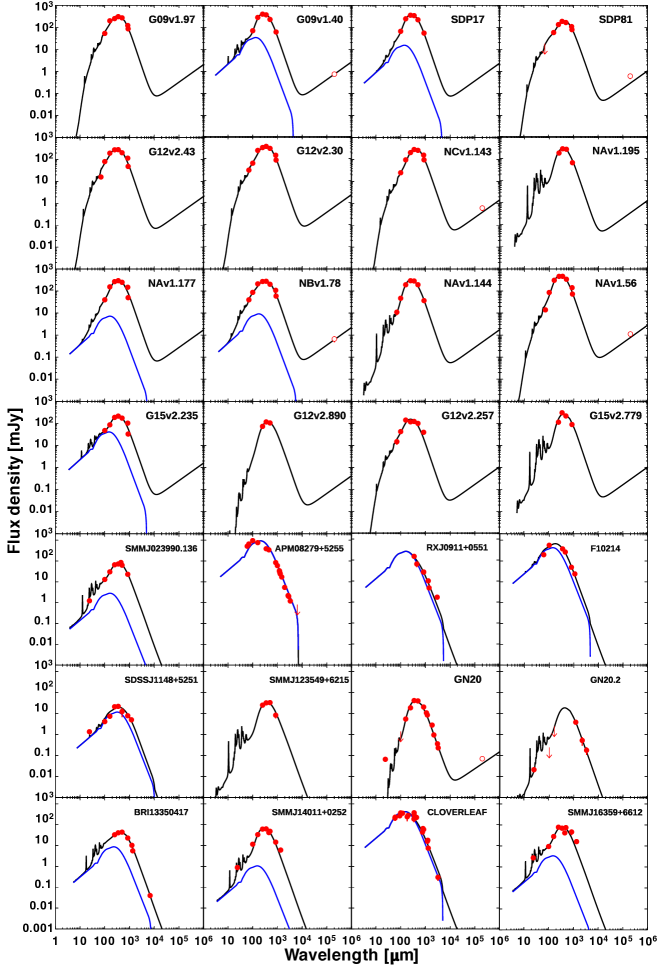
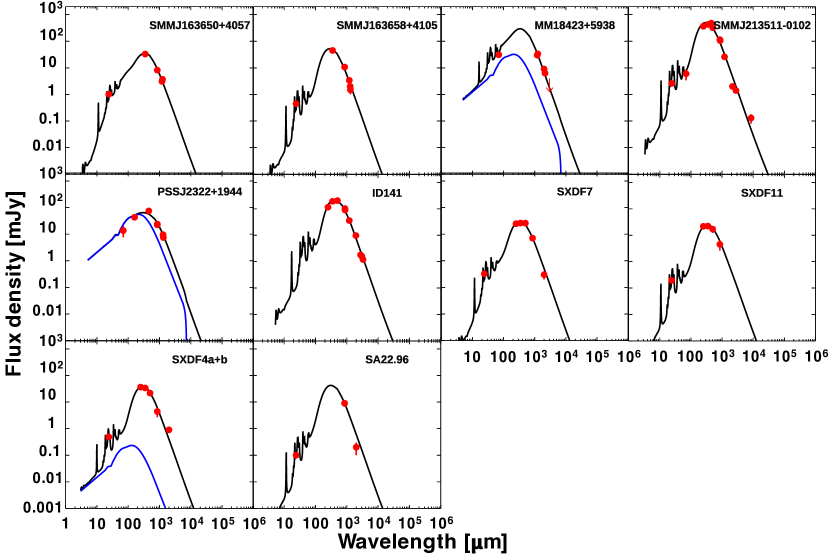
| ID | Size | Flux increase | ||
|---|---|---|---|---|
| arcsec |
[C I],
CO |
CO | CO | |
| (1) | (2) | (3) | (4) | (5) |
| 4233 | – | – | – | |
| 7540 | – | – | – | |
| 13205 | % | % | % | |
| 13250 | – | – | – | |
| 18538 | – | – | – | |
| 18911 | % | % | % | |
| 19021 | – | – | – | |
| 26925 | – | – | – | |
| 30694 | – | – | – | |
| 32394 | – | – | – | |
| 35349 | – | – | – | |
| 36053 | % | % | – | |
| 36945 | % | % | % | |
| 37250 | – | – | – | |
| 37508 | % | % | % | |
| 38053 | – | – | – | |
| 44641 | – | – | – | |
| 121546 | % | – | – | |
| 188090 | – | – | – | |
| 192337 | – | – | – | |
| 208273 | – | – | – | |
| 218445 | – | – | – | |
| 256703 | – | – | – | |
Note. — Column 1: ID. Column 2: Size in arcsec. Upper limits are at . Column 3-5: Flux increase when extracting the source with a circular Gaussian (gildas/uv_fit/c_gauss) with fixed upper limit on the size, compared with the extraction with a point source profile (gildas/uv_fit/point): . Corrections below % are not applied.
Appendix B Total recovered fluxes from ALMA observations
We extracted the flux of each line of our sample of main sequence galaxies using the iterative procedure described in detail in our previous work (Daddi et al., 2015; Coogan et al., 2018; Valentino et al., 2018; Puglisi et al., 2019) and recalled in Section 2.1.2. The signal is extracted with gildas/uv_fit at fixed spatial position and extension, obtained by combining measurements for each tracer in the uv space (Section 2 of Puglisi et al., 2019). Such combination includes both cold ([C I], CO , dust continuum) and warm (CO , CO , CO ) molecular gas proxies. Therefore, the measured size is representative of the average extension of the molecular gas in the galaxy. Further comparisons between the various tracers is part of a forthcoming work (Puglisi et al. in prep.). The total flux is robustly recovered whenever the size of the emitting source is securely estimated. This is the case for all the new Band 7 measurements reported in Section 2.1.2. However, flux losses might occur when only an upper limit on the size can be placed, and such estimate is comparable with the beam size. We estimated these losses by injecting artificial bright galaxies with circular Gaussian profiles and a FWHP fixed to the upper limit on the size in the ALMA maps, and then re-extracting their fluxes with the fiducial point source profile. We corrected the fluxes of unresolved sources to and adding in quadrature the absolute error on such correction () to the statistical uncertainty. The sizes and the flux corrections are reported in Table 5. Changes at % are not significant and therefore not applied.
Appendix C Data tables
The data we collected for this work are released in electronic FITS format available in the online version of the article or contacting the corresponding author. We produce two separate tables for the local and high-redshift subsamples in Section 2. The quantities are described in Table 6.
| Name | Units | Description |
|---|---|---|
| ID | Source identifier | |
| Mpc | Distance (for the local sample only) | |
| Spectroscopic redshift | ||
| (dust, gas) | Magnification factor for lensed sources (for the high-redshift sample only) | |
| Total IR luminosity integrated within m, corrected for the dusty torus emission if the galaxy is not AGN dominated | ||
| K | Dust temperature from a optically thin modified black body model of the IR emission | |
| (line) | K km s-1 pc2 | luminosities of the specified line |
| (line) | Jy km s-1 | Velocity-integrated fluxes of the specified line |
| Fraction of IR emission due to dusty tori (for the high-redshift sample only) | ||
| Type | Galaxy type (MS=Main Sequence; SB=StarBurst; AGN/QSO=Active Galactic Nucleus/Quasar; for the high-redshift sample only) | |
| AGN | Galaxy with AGN contamination and an entry in Véron-Cetty & Véron (2010) (for the local sample only) | |
| Facility | Facility used to detect the [C I] line emission. | |
| References | References to the original works presenting observations of each source. |
Appendix D Spectra of main sequence galaxies
We show in Figure 9 the spectra of our sample of main sequence galaxies observed with ALMA in Cycles 3 to 6 (Sections 2.1.1-V18 and 2.1.2). The IDs are reported in each panel and correspond to the ones in Tables 2 and 3. The black solid lines show the continuum-subtracted spectra in the observed frame and the red lines mark the best Gaussian fits. The black ticks signpost the expected line frequency from previous optical/near-IR redshift estimates. The shaded areas indicate the channels used to estimate the line fluxes. The number of channels covered by each line is reported in brackets. The spectra are color coded as follows: dark green = CO ; blue = CO ; yellow = [C I], [C I]; orange = CO ; purple = CO . In case of non-detections, we show the expected location of the emission with a red solid line, and the channels covered to estimate the upper limits on the flux as color shaded areas. These correspond to the velocity width of other significantly detected lines for the same source (Section 2.1.1).
Appendix E Tests on PDR modeling
In Section 4.1 we proposed a simple
interpretation of the observed trends in the line
ratios in terms of PDR modeling. As mentioned, this should be taken as
an order of magnitude estimate, given the limitations of such a simple
approach.
Documented issues arise because of the simple one-dimensional
geometry of classical PDR models, in which the [C I] emission arises only from a thin layer
within CO and [C II], while observations suggest full mixing
between [C I] and CO (e.g., Ojha et al., 2001; Ikeda et al., 2002); the
assumption of a micro turbulent medium, not suitable to
reproduce the CO SLED, which is better represented by large velocity
gradients (e.g., LVG modeling, Young & Scoville 1991;
Liu et al. 2015; Yang et al. 2017; Cañameras et al. 2018 for working examples on
subsets of the galaxies in our compilation);
indeed, a clumpy medium, turbulent mixing and cosmic ray (rather FUV-) driven chemistry
radically change this picture and might explain the fully concomitant
[C I] and CO (e.g. Papadopoulos et al., 2004; Bisbas et al., 2015, 2017; Papadopoulos et al., 2018). More realistic modeling including a
3D geometry and tunable cosmic ray rates resulted in larger gas
densities, but similar radiation fields with respect to the
Kaufman et al. (1999) models adopted here
(Bothwell et al., 2017). The mechanical excitation of CO transitions
through shocks is known to occur in nearby massively star forming
regions and it adds a further layer of complexity not
captured by the simple PDR models we applied
(Lee et al., 2019). We also note that metallicity and carbon abundance
variations among different populations (V18) cannot be captured by the fixed set
of parameters in Kaufman et al. (1999).
We do not apply any more complex modeling to our compilation at this stage. Notably, we do not make such attempt for our main sequence galaxies at due to the lack of constraining power in our observations. The LVG method would likely be able to capture both CO and [C I] at the same time (e.g., Israel et al., 2015), but it relies on the knowledge of both low- and high- transitions, especially considering the growing evidence of the existence of a two-phase ISM, the hottest peaking even above (Liu et al., 2015; Yang et al., 2017; Cañameras et al., 2018). This information is not available for the vast majority of our sample of main sequence galaxies, following the general lack of constraints on the CO SLED of high-redshift normal galaxies (Daddi et al. 2015, Daddi et al. in preparation). We refer the reader to the original works producing such LVG modeling when accessible, mainly for lensed SMGs or very local objects. Similar considerations apply for the introduction of shock models. Moreover, spatially well resolved observations will be necessary to study the relative distributions of [C I] and CO and gauge, e.g., the effect of enhanced cosmic rays rates in high redshift galaxies, as unresolved or marginally resolved emission is dominated by the phases where both species are abundant (Papadopoulos et al., 2018). We also note that the observed ratios / in all but 3 objects are not compatible with extra heating from X-ray dominated regions (XDR) at the cm-3 derived for the galaxies with both [C I] lines available (Meijerink et al., 2007; Nesvadba et al., 2018).