additions
A bibliometric study of research topics, collaboration and centrality in the Iterated Prisoner’s Dilemma
Abstract
This manuscript explores the research topics and collaborative behaviour of authors in the field of the Prisoner’s Dilemma using topic modeling and a graph theoretic analysis of the co-authorship network. The analysis identified five research topics in the Prisoner’s Dilemma which have been relevant over the course of time. These are human subject research, biological studies, strategies, evolutionary dynamics on networks and modeling problems as a Prisoner’s Dilemma game. Moreover, the results demonstrated the Prisoner’s Dilemma is a field of continued interest, and that it is a collaborative field compared to other game theoretic fields. The co-authorship network suggests that authors are focused on their communities and that not many connections across the communities are made. The most central authors of the network are the authors connected to the main cluster. Through examining the networks of topics, it was uncovered that the main cluster is characterised by the collaboration of authors in a single topic.
These findings add to the bibliometrics study in another field and present new questions and avenues of research to understand the reasons for the measured behaviours.
1 Introduction
The Prisoner’s Dilemma (PD) is a well known game used since its introduction in the 1950’s (Flood, 1958) as a framework for studying the emergence of cooperation; a topic of continued interest for mathematical, social, biological and ecological sciences. This manuscript presents a bibliometric analysis of 2420 published articles on the Prisoner’s Dilemma between 1951 and 2018. It presents a number of research topics in the PD publications, which have been identified using Latent Dirichlet Allocation (LDA) (Blei et al., 2003), and it explores the changes in the research topics over time. The collaborative behaviour of the field is explored using the co-authorship network, and furthermore, the LDA topic analysis is combined with the co-authorship network analysis to assess the most central authors in these topics. Assessing the collaborative behaviour of the field of collaboration itself is the main aim of this work.
As discussed in (Youngblood and Lahti, 2018), bibliometrics (the statistical analysis of published works originally described by (Pritchard et al., 1969)) has been used to support historical assumptions about the development of fields (Raina and Gupta, 1998), identify connections between scientific growth and policy changes (das Neves Machado et al., 2016), develop a quantitative understanding of author order (Sekara et al., 2018), and investigate the collaborative structure of an interdisciplinary field (Liu and Xia, 2015). Most academic research is undertaken in the form of collaborative effort and as (Kyvik and Reymert, 2017) points out, it is rational that two or more people have the potential to do better as a group than individually. Indeed this is the very premise of the PD itself. Collaboration in groups has a long tradition in experimental sciences and it has be proven to be productive according to (Etzkowitz, 1992). The number of collaborations can be different between research fields and understanding how collaborative a field is not always an easy task. Several studies tend to consider academic citations as a measure for these things. A blog post published by Nature (van Noorden, 2017) argues that depending on citations can often be misleading because the true number of citations can not be known. Citations can be missed due to data entry errors, academics are influenced by many more papers than they actually cite and several of the citations are superficial.
A more recent approach to measuring collaborative behaviour, and to studying the development of a field is to use the co-authorship network, as described in (Liu and Xia, 2015). The co-authorship network has many advantages as several graph theoretic measures can be used as proxies to explain author relationships. For example the average degree of a node corresponds to the average number of an authors’ collaborators, and clustering coefficient corresponds to the extent that two collaborators of an author also collaborate with each other. In (Liu and Xia, 2015), the approach was applied to analyse the development of the field “evolution of cooperation”, and in (Youngblood and Lahti, 2018) to identify the subdisciplines of the interdisciplinary field of “cultural evolution” and investigate trends in collaboration and productivity between these subdisciplines. Moreover, (Li et al., 2019) examined the long-term impact of co-authorship with established, highly-cited scientists on the careers of junior researchers.
LDA is a topic modeling technique proposed in (Blei et al., 2003) as a generative probabilistic model for discovering underlying topics in collections of data. Applications of the technique include detection in image data (Coelho et al., 2010) and detection in video (Wang et al., 2008). Nevertheless, LDA has been applied by several works on publication data for identifying the topic structure of a subject area. In (Inglis and Foster, 2018), it was applied to the publications on mathematical education of the journals “Educational Studies in Mathematics” and “Journal for Research in Mathematics Education” to identify the dominant topics that each journal was publishing on. The topics of the North American library and Information Science dissertations were studied chronologically in (Sugimoto et al., 2011), and the main topic of the scientific content presented at EvoLang conferences was identified in (Bergmann and Dale, 2018). In (Bergmann and Dale, 2018) the LDA approach is combined with clustering and a co-authorship network analysis. A clustering analysis is applied to the LDA topics, and the co-authorship network is analysed as a whole where the clusters are only used to differentiate between the authors’ topics.
This paper builds upon the previous works of (Bergmann and Dale, 2018; Liu and Xia, 2015; Youngblood and Lahti, 2018). It extends their methodology, it combines identified topics by an LDA model with the co-authorship network analysis, and applies all these techniques to a new data set. This data set was collected not from a single source but from five different sources. The four publishers were chosen because they are well known publishers in the field, and the arXiv preprint server. The search terms used to collect data appear on relevant articles and the search fields that were used were the title, abstract and text. However, papers can refer to the PD in the text but not analyze the topic. For this reason such articles were manually checked, so that only relevant papers are included in the analysis. Moreover, an amount of well known articles, which are not published in any of the selected publishers, were manually included in the data set.
The methodology used in this manuscript, which includes the data collection and a preliminary analysis of the data set, is covered in Section 2. The results on the research topics of the PD are presented in Section 3.1, and the results on the co-authorship network are presented in Section 3.2. Finally, the conclusions are summarised in Section 4.
2 Methodology
Academic articles are accessible through scholarly databases. Several databases and collections today offer access through an open application protocol interface (API). An API allows users to query directly a publisher’s database and bypass the graphical user interface. Interacting with an API has two phases: requesting and receiving. The request phase includes composing a url with the details of the request. For example, http://export.arxiv.org/api/query?search_query=abs:prisoner’sdilemma&max_results=1 represents a request message. The first part of the request is the address of the API. In this example the address corresponds to the API of arXiv. The second part of the request contains the search arguments. In this example it is requested that the word ‘prisoners dilemma’ exists within the article’s title. The format of the request message is different from API to API. The receive phase includes receiving a number of raw metadata of articles that satisfies the request message. The raw metadata are commonly received in extensive markup language (xml) or Javascript object notation (json) formats (Nurseitov et al., 2009). Similarly to the request message, the structure of the received data differs from publisher to publisher.
The data collection is crucial to this study. To ensure that this study can be reproduced all code used to query the different publishers’ APIs has been packaged as a Python library and is available online (Glynatsi, 2017). The software could be used for any type of projects similar to the one described here, documentation for it is available at: http://arcas.readthedocs.io/en/latest/. Project (Glynatsi, 2017) can collect data from five different sources. These correspond to four publishers and a preprint server:
-
•
arXiv (McKiernan, 2000); a repository of electronic preprints. It consists of scientific papers in the fields of mathematics, physics, astronomy, electrical engineering, computer science, quantitative biology, statistics, and quantitative finance, which all can be accessed online.
-
•
PLOS (PLOS, 2000); a library of open access journals and other scientific literature under an open content license. It launched its first journal, PLOS Biology, in October 2003 and publishes seven journals, as of October 2015.
-
•
IEEE Xplore Digital Library (IEEE) (IEEE, 1963); a research database for discovery and access to journal articles, conference proceedings, technical standards, and related materials on computer science, electrical engineering and electronics, and allied fields. It contains material published mainly by the Institute of Electrical and Electronics Engineers and other partner publishers.
-
•
Nature (Nature Publishing Group, 1869); a multidisciplinary scientific journal, first published on 4 November 1869. It was ranked the world’s most cited scientific journal by the Science Edition of the 2010 Journal Citation Reports and is ascribed an impact factor of 40.137, making it one of the world’s top academic journals.
-
•
Springer (Mannheim Media, 1950); a leading global scientific publisher of books and journals. It publishes close to 500 academic and professional society journals.
These publishers were chosen because they are prominent publishers in the field. For each source, data can be collected by specifying a search term and a search field. Articles for which any of the terms:
-
•
prisoner’s dilemma
-
•
prisoners dilemma
-
•
prisoner dilemma
-
•
prisoners evolution
-
•
prisoner game theory
existed within the title, the abstract or the text are included in the analysis. These terms we selected because they are occurring terms in paper known to be relevant in the field. However, the authors acknowledge that there are other terms that could have been used, for example “donation game”. The authors believe that the results of the manuscript do generalise to the overall stated goals (Section 1), but they are inferred only from the data collected on the specific search terms and search fields.
The latest data collection was performed on the November 2018. Following the automatic collection of articles from the sources, a cleaning process was applied to the data. More specifically, all the titles of the collected articles were compared for semantic similarity. There were a total of 34 duplicate articles. That was because both the preprint and the published versions of a paper were collected. The preprint versions (collected from arXiv) were dropped at this stage. A semantic similarity check was also applied in the names of the collected authors. The names that were highlighted as similar were manually checked. In case of a duplicate, for example “Martin Nowak” and “Martin A. Nowak” are considered duplicates, all entries of that author were fixed to a single style. Most commonly the middle name was dropped. Finally, articles that were collected because the search terms existed within the text were checked to reassure their relevance to the PD topic. Non relevant articles were dropped at this stage.
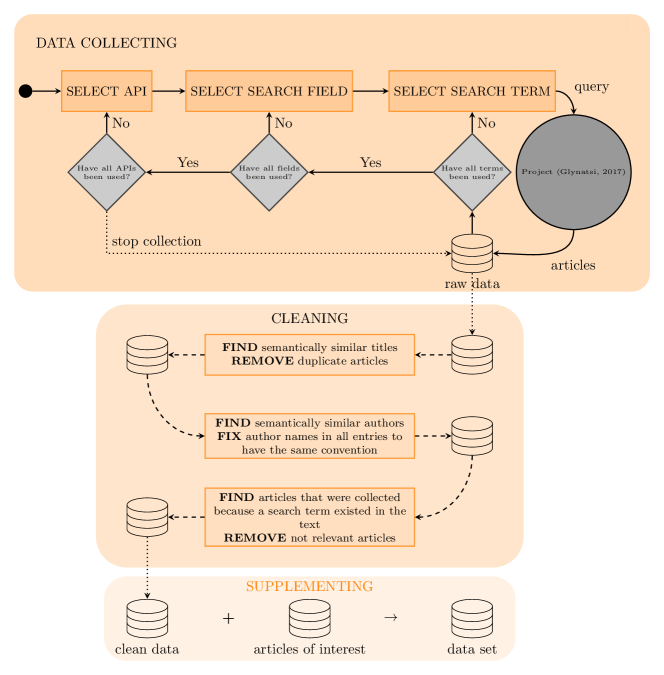
Following the cleaning process, a total of 76 articles were manually added to the data set because they are of interest to the field. This was also done in (Liu and Xia, 2015). Examples of such papers include (Flood, 1958) the first publication on the PD, (Ohtsuki et al., 2006; Stewart and Plotkin, 2012) two well cited articles in the field, and a series of works from Robert Axelrod (Axelrod, 1980a, b; Axelrod et al., 1987; Axelrod and Hamilton, 1981; Riolo et al., 2001) a leading author of the field. The process of obtaining the data set used in analysis presented in the manuscript is illustrated in Figure 1. This data set has been archived and is available at (Glynatsi, 2019c).
The data set consists of 2422 articles with unique titles. A more detailed summary of the articles’ provenance is given by Table 1. Only 3% of the data set consists of articles that were manually added and 27% of the articles were collected from arXiv. The average number of publications is also included in Table 1. Overall an average of 43 articles are published per year on the topic. The most significant contribution to this appears to be from arXiv with 11 articles per year, followed by Springer with 9 and PLOS with 8.
| Number of Articles | Percentage % | Year of first publication | Average number of publications per year | |
|---|---|---|---|---|
| IEEE | 294 | 12.14% | 1973 | 5 |
| Manual | 76 | 3.14% | 1951 | 1 |
| Nature | 436 | 18.00% | 1959 | 8 |
| PLOS | 477 | 19.69% | 2005 | 8 |
| Springer | 533 | 22.01% | 1966 | 9 |
| arXiv | 654 | 27.00% | 1993 | 11 |
| Overall | 2470 | 100.00% | 1951 | 43 |
All the visualisations presented in the manuscript were generated using (Hunter, 2007), and project (Walt et al., 2011) was used for manipulating the data.
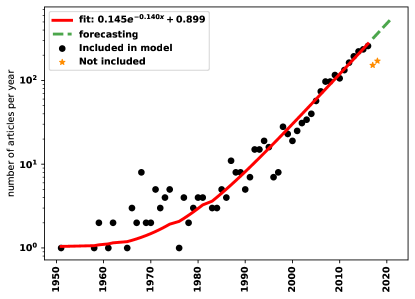
The data handled here is in fact a time series from the 1950s, the formulation of the game, until 2018 (Figure 2). Two observations can be made from Figure 2.
-
1.
There is a steady increase of the number of publications since the 1980s and the introduction of computer tournaments (Axelrod and Hamilton, 1981) (work by Robert Axelrod).
-
2.
There is a decrease in 2017-2018. This is due to our data set being incomplete. Articles that have been written in 2017-2018 have either not being published or were not retrievable by the APIs at the time of the last data collection.
These observations can be confirmed by studying the time series. Using (Jones et al., 2001), an exponential distribution is fitted to the data. The fitted model can be used to forecast the behaviour of the field for the next 5 years. Even though the time series has indicated a slight decrease, the model forecasts that the number of publications will keep increasing, thus demonstrating that the field of the PD continues to attract academic attention.
There are a total of 4226 authors in the data set (Glynatsi, 2019c) and several of these authors have had multiple publications collected from the data collection process. The highest number of articles collected for an author is 83 publications for Matjaz Perc. However, Matjaz Perc is an outlier most authors have 1 to 6 publications in the data set. The overall Collaboration Index (CI) or the average number of authors on multi-authored papers is 3.2, thus on average a non single author publication in the PD has 3 authors. This appears to be quite standard compared to other fields such as cultural evolution (Youngblood and Lahti, 2018), Astronomy and Astrophysics, Genetics and Heredity, Nuclear and Particle Physics as reported by (Mallapaty, 2018). There are only a total of 545 publications with a single author, which corresponds to the 22% of the papers. It appears that academic publications tend to be undertaken in the form of collaborative effort, which is in line with the claim of (Kyvik and Reymert, 2017).
3 Results
3.1 Research topics in the Prisoner’s Dilemma research
The articles contained in the data set (Glynatsi, 2019c) are classified into research topics using LDA, an unsupervised machine learning technique designed to summarize large collections of documents by a small number of conceptually connected topics or themes (Blei et al., 2003; Grimmer and Stewart, 2013). The documents are the articles’ abstracts and LDA was carried out using (Rehurek and Sojka, 2010). In LDA, each document/abstract is represented by a distribution over topics, and the topics themselves are represented by a distribution over words. More specifically, each topic is described by weights associated with words and each document by the probabilities of belonging to a specific topic. The probability of a document belonging to topic is referred to as the percentage contribution denoted as . For example the words and their associated weights for two topics A and B could be:
-
•
Topic A: “cooperation”, “study” and “human”.
-
•
Topic B: “cooperation”, “agents” and “strategies”.
The percentage contribution for a document with abstract “The study of cooperation in humans” has a and . The topic to which a document is assigned to is based on the highest percentage contribution denoted as . For the given example the dominant topic is Topic A .
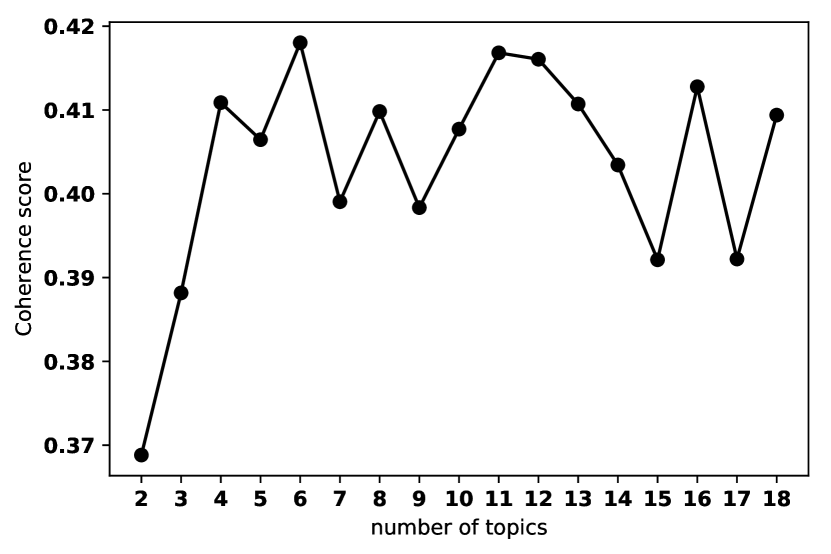
LAD requires that the number of topics is specified in advance before running the algorithm. The appropriate number of topics can be chosen based on the coherence score (Röder et al., 2015) or the exclusivity score (Airoldi and Bischof, 2012). The coherence score measures the degree of semantic similarity between highly weighted words of a topic. There are cases for which a few topics can be dominated by very common words, and for that reason the exclusivity of words to topics has also been calculated. Figure 3(a) gives the topic coherence and Figure 3(b) gives the exclusivity of 18 models where the number of topics . The topic coherence for each model was calculated using the open source project (Rehurek and Sojka, 2010). The exclusivity measure was calculated with an altered version of (Rehurek and Sojka, 2010) which has been archived at (Glynatsi, 2020).
From Figure 3(a) it can be seen that the number of topics with the highest coherence score are (coherence score of 0.418) and (coherence score of 0.417). Figure 3(a) shows that the exclusivity of the highly weighted words of the topics is decreasing as the number of topics increases. A number of topics has a better exclusivity value than the model of , and its coherence score is 0.406 (which is closed to 0.418). For that reason is chosen to carry out the analysis of this work.

For the articles are clustered and assigned to their dominant topic, based on the highest percentage contribution. The keywords associated with a topic, the most representative article of the topic (based on the percentage contribution) and its academic reference are given by Table 2. The topics are labelled as A, B, C, D and E, and more specifically:
-
•
Based on the keywords associated with Topic A, and the most representative article, Topic A appears to be about human subject research. Several publications assigned to the topic study the PD by setting experiments and having human participants simulate the game instead of computer simulations. These articles include (Matsumoto et al., 2016) which showed that prosocial behavior increased with the age of the participants, (Li et al., 2014) which studied the difference in cooperation between high-functioning autistic and typically developing children, (Molina et al., 2013) explored the gender effect in highschool students and (Bell et al., 2017) explored the effect of facial expressions of individuals.
-
•
Though it is not immediate from the keywords associated with Topic B, investigating the papers assigned to the topic indicate that it is focused on biological studies. Papers assigned to the topic include papers which apply the PD to genetics (Sistrom et al., 2015), to the study of tumours (Sartakhti et al., 2017) and viruses (Turner and Chao, 1999). Other works include how phenotype affinity can affect the emergence of cooperation (Wu et al., 2019) and modeling bacterial communities as a spatial structured social dilemma.
-
•
Based on the keywords and the most representative article Topic C appears to include publications on PD strategies. Publications in the topic include the introduction of new strategies (Stewart and Plotkin, 2013), the search of optimality in strategies (Banerjee and Sen, 2007) and the training of strategies (Ishibuchi et al., 2011) with different representation methods. Moreover, publications that study the evolutionary stability of strategies (Adami and Hintze, 2013) and introduced methods of differentiating between them (Ashlock and Kim, 2008) are also assigned to C.
-
•
The keywords associated with Topic D clearly show that the topic is focused on evolutionary dynamics on networks. Publications include (Ichinose et al., 2013) which explored the robustness of cooperation on networks, (Wang et al., 2012) which studied the effect of a strategy’s neighbourhood on the emergence of cooperation and (Chen et al., 2016) which explored the fixation probabilities of any two strategies is spatial structures.
-
•
The publication assigned to Topic E are on modeling problems as a PD game. Though Topic B is also concerned with problems being formulated as a PD, it includes only biological problems. In comparison, the problems in Topic E include decision making in operational research (Ormerod, 2010), information sharing among members in a virtual team (Feng and Liu, 2008), the measurement of influence in articles based on citations (Hutchins et al., 2016) and the price spikes in electric power markets (Guan, 2002), and not on biological studies.
| Dominant Topic | Topic Keywords | Most Representative Article Title | Reference | # Documents | % Documents |
|---|---|---|---|---|---|
| A | social, behavior, human, study, experiment, cooperative, cooperation, suggest, find, behaviour | Facing Aggression: Cues Differ for Female versus Male Faces | (Geniole et al., 2012) | 496.0 | 0.2008 |
| B | individual, group, good, show, high, increase, punishment, cost, result, benefit | Genomic and Gene-Expression Comparisons among Phage-Resistant Type-IV Pilus Mutants of Pseudomonas syringae pathovar phaseolicola | (Sistrom et al., 2015) | 309.0 | 0.1251 |
| C | game, strategy, player, agent, dilemma, play, payoff, state, prisoner, equilibrium | Fingerprinting: Visualization and Automatic Analysis of Prisoner’s Dilemma Strategies | (Ashlock and Kim, 2008) | 561.0 | 0.2271 |
| D | cooperation, network, population, evolutionary, evolution, interaction, dynamic, structure, cooperator, study | Influence of initial distributions on robust cooperation in evolutionary Prisoner’s Dilemma | (Chen et al., 2007) | 556.0 | 0.2251 |
| E | model, theory, base, system, problem, paper, propose, information, provide, approach | Gaming and price spikes in electric power markets and possible remedies | (Guan, 2002) | 548.0 | 0.2219 |
Note that the whilst for the choice of 5 topics the actual clustering is not subjective (the algorithm is determining the output) the interpretation above is.
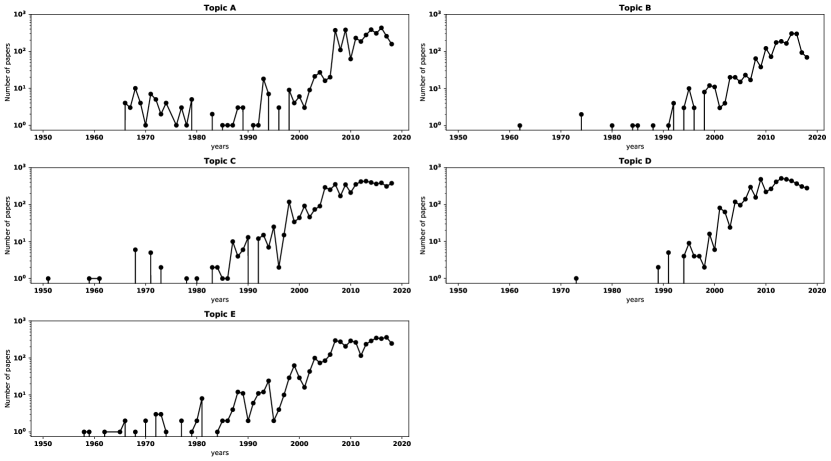
Figure 4 gives the number of articles per topic over time. The topics appear to have had a similar trend over the years, with topics B and D having a later start. Following the introduction of a topic the publications in that topic have been increasing, and there is no decreasing trend in any of the topics. All the topics have been publishing for years and they still attract the interest of academics. Thus, there does not seem to be any given topic more or less in fashion.
To gain a better understanding regarding the change in the topics over the years, LDA is applied to the cumulative data set over 8 time periods. These periods are 1951-1965, 1951-1973, 1951-1980, 1951-1988, 1951-1995, 1951-2003, 1951-2010, 1951-2018. The number of topics for each cumulative subset is chosen based only on the topic coherence, and the exclusivity is not taken into account. As a result, the period 1951-2018 has been assigned which had the highest coherence value instead of 5. The chosen models for each period including the number of topics, their keywords and number of articles assigned to them are given in the Appendix A.
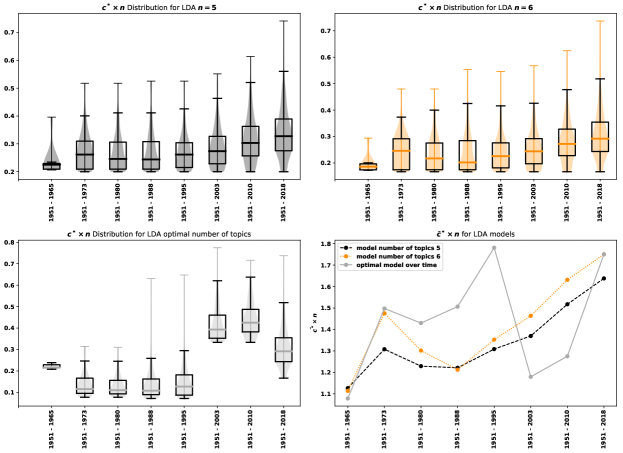
But how well do the five topics which were presented earlier fit the publications over time? This is answered by comparing the performance of three LDA models over the cumulative periods’ publications. The three models are LDA models for the entire data set for equal to 5, 6 and the models of Table 8 for each time period. Thus, for the period 1951-1980 the three model that are being compared are for equal to 5, 6, and 13.
For each model the is estimated for each document in the cumulative data sets. The performance of the models are then compared based on:
| (1) |
where is the median highest percentage contribution and is the number of topics of a given period. A model with more topics will have more difficulty to assign papers. Thus, equation (1) is a measure of confidence in assigning a given paper to its topic weighted by the number of topics. The performances are given by Figure 5.
The five topics of the PD presented in this manuscript appear to always be less good at fitting the publications compared to the six topics of LDA . Moreover, these are less good than the models of periods 1951-1965 to 1951-1995. The difference in the performance values, equation (1), however is small. The relevances of the five topics has been increasing over time, and though, the topics did not always fit the majority of published work, there were still papers being published on those topics.
In the following section the collaborative behaviour of authors in the field, and within the field’s topics as were presented in this section, are explored using a network theoretic approach.
3.2 Analysis of co-authorship network
The relationship between the authors within a field is modeled as a graph where is the set of nodes and is the set of edges. The set represents the authors and an edge connects two authors if and only if those authors have written together. This co-authorship network is constructed using the main data set (Glynatsi, 2019c) and the open source package (Hagberg et al., 2008). The PD network is denoted as where the number of unique authors is 4226 and is 7642.
The collaborativeness of the authors is analysed using measures such as, number of isolated nodes, number of connected components, clustering coefficient, number of communities, modularity and average degree. These measures show the number of connections authors can have and how strongly connected these people are. The number of isolated nodes is the number of nodes that are not connected to another node, thus the number of authors that have published alone. The average degree denotes the average number of neighbours for each nodes, i.e. the average number of collaborations between the authors. A connected component is a maximal set of nodes such that each pair of nodes is connected by a path (Easley et al., 2010). The number of connected components as well as the size of the largest connected component in the network are reported. The size of the largest connected component represents the scale of the central cluster of the entire network. Clustering coefficient and modularity are also calculated. The clustering coefficient, defined as 3 times the number of triangles on the graph divided by the number of connected triples of nodes, is a local measure of the degree to which nodes in a graph tend to cluster together in a clique (Easley et al., 2010). It shows to which extent the collaborators of an author also write together. In comparison, modularity is a global measure designed to measure the strength of division of a network into communities. The number of communities is reported using the Clauset-Newman-Moore method (Clauset et al., 2004). Also the modularity index based on the Louvain method (Blondel et al., 2008) is calculated using (Aynaud, 2020). The value of the modularity index can vary between , a high value of modularity corresponds to a structure where there are dense connections between the nodes within communities but sparse connections between nodes in different communities. That means that there are many sub communities of authors that write together but not across communities. Two centrality measures are also reported. These are:
-
1.
Closeness centrality, where a node is seen as centrally involved in the network if it requires only few intermediaries to contact others and thus is structurally relatively independent.
-
2.
Betweenness centrality, where the determination of an author’s centrality is based on the quotient of the number of all shortest paths between nodes in the network that include the node in question and the number of all shortest paths in the network. In betweenness centrality the position of the node matters.
There are a total of 1157 connected components in and the largest component has a size of 796 nodes. The largest connected component is going to be refereed to as the main cluster of the network and is denoted as . A metrics summary of both networks is given by Table 3. Based on Table 3 an author in has on average 4 collaborators and a 67% probability of collaborating with a collaborator’s co-author. An author of on average is 10% more likely to write with a collaborator’s co-author and on average has 2 more collaborators. Moreover, there are only 8.0% of authors in the PD that have no connection to any other author.
How does this compare to other fields? Two more data sets for the topics “Price of Anarchy” and “Auction Games” have been collected in order to compare the collaborative behaviour of the PD to other game theoretic fields. A total of 3444 publications have been collected for Auction games and 748 for Price of Anarchy. Price of Anarchy is relatively a new field, with the first publication on the topic being (Koutsoupias and Papadimitriou, 1999) in 1999. This explains the small number of articles that have been retrieved. Both data sets have been archived and are available in (Glynatsi, 2019b, a). The networks for both data sets have been generated in the same way as , and a summary of the networks’ metrics is also given by Table 3.
The average degrees for the Price of Anarchy and for Auction games are lower than the PD’s, and so are their respective clustering coefficients. Moreover, both the Price of Anarchy and Auction games have a larger number of isolated authors. These results seem to indicate that the PD is a relatively collaborative field, compared to other game theoretic fields. However, both and have a high modularity (larger than 0.84) and a large number of communities (967 and 25 respectively). A high modularity implies that authors create their own publishing communities but not many publications from authors from different communities occur. Thus, author tends to collaborate with authors in their communities but not many efforts are made to create new connections to other communities and spread the knowledge of the field across academic teams. The fields of both Price of Anarchy and Auction games also have high modularity, and that could indicate that is in fact how academic publications are.
| # Nodes | # Edges | # Isolated nodes | % Isolated nodes | # Connected components | Size of largest component | Av. degree | # Communities | Modularity | Clustering coeff | |
|---|---|---|---|---|---|---|---|---|---|---|
| 4221 | 7642 | 338 | 8.0 | 1157 | 796 | 3.621 | 1177 | 0.965264 | 0.666 | |
| 796 | 2214 | 0 | 0.0 | 1 | 796 | 5.563 | 29 | 0.840138 | 0.773 | |
| Auction Games | 5362 | 7861 | 453 | 8.4 | 1469 | 1348 | 2.932 | 1493 | 0.957238 | 0.599 |
| Price of Anarchy | 1315 | 1952 | 165 | 12.5 | 406 | 221 | 2.969 | 414 | 0.964498 | 0.626 |
The evolution of the networks was also explored over time by constructing the network cumulatively over 51 periods. Except from the first period 1951-1966 the rest of the periods have a yearly interval (data for the years 1975 and 1982 were not retrieved by the collection data process). The metrics of each sub network are given in the Appendix B. The results, similarly to the results of (Liu and Xia, 2015), confirm that the networks grow over time and that the networks always had a high modularity. Since the first publications authors tend to write with people from their communities, and that is not an effect of a specific time period.
The networks corresponding to the topics of Section 3.1 have also been generated similarly to . Note that authors with publications in more than one topic exist, and these authors are included in all the corresponding networks. A metrics’ summary for all five topic networks is given by Table 4.
Topics A and B have the highest average degree and clustering coefficient. Moreover, both topics have a small number of isolated nodes. Compared to that Topic C has a smallest average degree and Topic E has the highest number of isolated authors. These indicate that the topics “human subject research” and “biological studies” tend to be more collaborative than the topic of “strategies”, and authors in these are more likely to have at least one collaborator compared to the topic of “modeling problems as a PD”.
Topic “Evolutionary dynamics on networks” also appears to be a collaborative topic. It is the topic with smallest number of isolated authors, and has an average degree of 3.4. In fact the network of the topic is a sub graph of , the main cluster of . This is discussed in the next part of this analysis.
| # Nodes | # Edges | # Isolated nodes | % Isolated nodes | # Connected components | Size of largest component | Av. degree | # Communities | Modularity | Clustering coeff | |
|---|---|---|---|---|---|---|---|---|---|---|
| Topic A | 1193 | 2137 | 84 | 7.0 | 333 | 56 | 3.583 | 334 | 0.983 | 0.715 |
| Topic B | 727 | 1382 | 45 | 6.2 | 189 | 80 | 3.802 | 190 | 0.950 | 0.739 |
| Topic C | 931 | 1141 | 72 | 7.7 | 312 | 29 | 2.451 | 312 | 0.981 | 0.615 |
| Topic D | 891 | 1509 | 28 | 3.1 | 185 | 312 | 3.387 | 193 | 0.917 | 0.692 |
| Topic E | 1152 | 1964 | 166 | 14.4 | 461 | 31 | 3.410 | 461 | 0.926 | 0.602 |
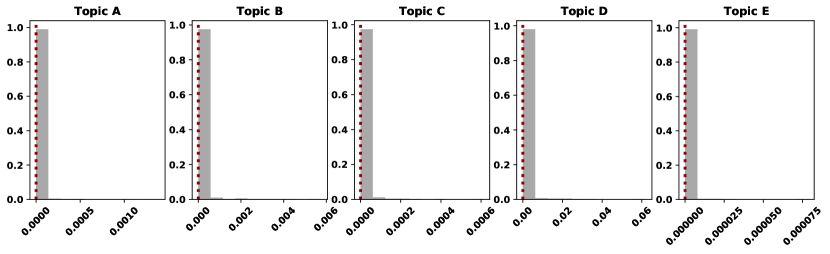
There are two centrality measures reported in this work, closeness and betweenness centrality. Closeness centrality is a measure of how easy it is for an author to reach others, and betweenness centrality is a measure of how many paths pass through a specific node. All centrality measures have values ranging from 0 to 1.
For and the most central authors based on closeness and betweenness centralities are given by Table 5. The most central authors in and are the same. This implies that the results on centrality heavily rely on the main cluster (as expected). Matjaz Perc is an author with 83 publications in the data set and the most central authors based on both centrality measures. The most central authors are fairly similar between the two measures. The author that appear to be central based on one measure and not the other are Martin Nowak, Franz Weissing, Jianye Hao, Angel Sanchez and Valerio Capraro which are central based on betweeness centrality, and the opposite is true for Attila Szolnoki, Luo-Luo Jiang Sandro Meloni, Cheng-Yi Xia and Xiaojie Chen.
| Name | Betweenness | Name | Closeness | Name | Betweenness | Name | Closeness | |
|---|---|---|---|---|---|---|---|---|
| 1 | Matjaz Perc | 0.013 | Matjaz Perc | 0.062 | Matjaz Perc | 0.373 | Matjaz Perc | 0.330 |
| 2 | Zhen Wang | 0.010 | Long Wang | 0.057 | Zhen Wang | 0.279 | Long Wang | 0.301 |
| 3 | Long Wang | 0.006 | Yamir Moreno | 0.056 | Long Wang | 0.170 | Yamir Moreno | 0.299 |
| 4 | Martin Nowak | 0.006 | Attila Szolnoki | 0.056 | Martin Nowak | 0.159 | Attila Szolnoki | 0.297 |
| 5 | Angel Sanchez | 0.004 | Zhen Wang | 0.056 | Angel Sanchez | 0.114 | Zhen Wang | 0.296 |
| 6 | Yamir Moreno | 0.004 | Arne Traulsen | 0.053 | Yamir Moreno | 0.110 | Arne Traulsen | 0.281 |
| 7 | Arne Traulsen | 0.004 | Luo-Luo Jiang | 0.053 | Arne Traulsen | 0.107 | Luo-Luo Jiang | 0.280 |
| 8 | Franz Weissing | 0.004 | Sandro Meloni | 0.052 | Franz Weissing | 0.101 | Sandro Meloni | 0.278 |
| 9 | Jianye Hao | 0.003 | Cheng-Yi Xia | 0.052 | Jianye Hao | 0.094 | Cheng-Yi Xia | 0.276 |
| 10 | Valerio Capraro | 0.003 | Xiaojie Chen | 0.052 | Valerio Capraro | 0.093 | Xiaojie Chen | 0.276 |
The centrality measures for the topic networks have also been estimated and are given in Tables 6 and 7. The centrality measure for the topics’ networks are low except from the case of Topic D. From the list of names it is obvious that the most central authors of Topic D are part of , and that the network of evolutionary dynamics on networks is a sub network of .
This confirms the result that the most central authors of the co-authorship network are the authors of the main cluster of . The fact that most authors of the main cluster are primarily publishing in evolutionary dynamics on networks indicates that publishing in this specific topic differs from the other topics covered in this manuscript. It could also indicate that authors publishing in evolutionary dynamics are more similar to other disciplines as they can collaborate with them more.
| Topic A | Topic B | Topic C | Topic D | |||||||
|---|---|---|---|---|---|---|---|---|---|---|
| Name | Betweeness | Name | Betweeness | Name | Betweeness | Name | Betweeness | Name | Betweeness | |
| 1 | David Rand | 0.001 | Long Wang | 0.006 | Daniel Ashlock | 0.001 | Matjaz Perc | 0.062 | Zengru Di | 0.0 |
| 2 | Valerio Capraro | 0.001 | Luo-Luo Jiang | 0.004 | Matjaz Perc | 0.000 | Luo-Luo Jiang | 0.036 | Jian Yang | 0.0 |
| 3 | Angel Sanchez | 0.000 | Martin Nowak | 0.004 | Karl Tuyls | 0.000 | Yamir Moreno | 0.031 | Yevgeniy Vorobeychik | 0.0 |
| 4 | Feng Fu | 0.000 | Matjaz Perc | 0.003 | Philip Hingston | 0.000 | Christoph Hauert | 0.027 | Otavio Teixeira | 0.0 |
| 5 | Martin Nowak | 0.000 | Attila Szolnoki | 0.002 | Eun-Youn Kim | 0.000 | Long Wang | 0.023 | Roberto Oliveira | 0.0 |
| 6 | Nicholas Christakis | 0.000 | Christian Hilbe | 0.002 | Wendy Ashlock | 0.000 | Zhen Wang | 0.023 | M. Nowak | 0.0 |
| 7 | Pablo Branas-Garza | 0.000 | Yamir Moreno | 0.002 | Attila Szolnoki | 0.000 | Han-Xin Yang | 0.022 | M. Harper | 0.0 |
| 8 | Toshio Yamagishi | 0.000 | Xiaojie Chen | 0.002 | Seung Baek | 0.000 | Martin Nowak | 0.019 | Xiao Han | 0.0 |
| 9 | James Fowler | 0.000 | Arne Traulsen | 0.002 | Martin Nowak | 0.000 | Angel Sanchez | 0.016 | Zhesi Shen | 0.0 |
| 10 | Long Wang | 0.000 | Zhen Wang | 0.002 | Thore Graepel | 0.000 | Zhihai Rong | 0.015 | Wen-Xu Wang | 0.0 |
| Topic A | Topic B | Topic C | Topic D | |||||||
|---|---|---|---|---|---|---|---|---|---|---|
| Name | Closeness | Name | Closeness | Name | Closeness | Name | Closeness | Name | Closeness | |
| 1 | David Rand | 0.026 | Long Wang | 0.042 | Karl Tuyls | 0.021 | Matjaz Perc | 0.122 | Stefanie Widder | 0.026 |
| 2 | Valerio Capraro | 0.022 | Matjaz Perc | 0.039 | Thore Graepel | 0.019 | Zhen Wang | 0.107 | Rosalind Allen | 0.026 |
| 3 | Jillian Jordan | 0.021 | Attila Szolnoki | 0.039 | Joel Leibo | 0.018 | Long Wang | 0.105 | Thomas Pfeiffer | 0.026 |
| 4 | Nicholas Christakis | 0.020 | Martin Nowak | 0.038 | Edward Hughes | 0.017 | Yamir Moreno | 0.103 | Thomas Curtis | 0.026 |
| 5 | James Fowler | 0.019 | Olivier Tenaillon | 0.037 | Matthew Phillips | 0.017 | Luo-Luo Jiang | 0.102 | Carsten Wiuf | 0.026 |
| 6 | Martin Nowak | 0.019 | Xiaojie Chen | 0.036 | Edgar Duenez-Guzman | 0.017 | Attila Szolnoki | 0.102 | William Sloan | 0.026 |
| 7 | Angel Sanchez | 0.018 | Bin Wu | 0.036 | Antonio Castaneda | 0.017 | Gyorgy Szabo | 0.101 | Otto Cordero | 0.026 |
| 8 | Samuel Arbesman | 0.018 | Yanling Zhang | 0.035 | Iain Dunning | 0.017 | Xiaojie Chen | 0.100 | Sam Brown | 0.026 |
| 9 | Gordon Kraft-Todd | 0.018 | Feng Fu | 0.035 | Tina Zhu | 0.017 | Guangming Xie | 0.100 | Babak Momeni | 0.026 |
| 10 | Akihiro Nishi | 0.018 | David Rand | 0.035 | Kevin Mckee | 0.017 | Lucas Wardil | 0.100 | Wenying Shou | 0.026 |
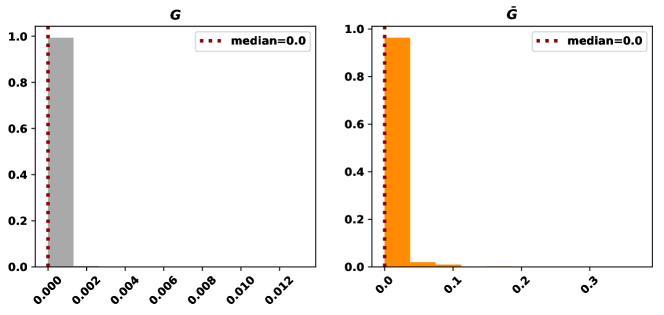
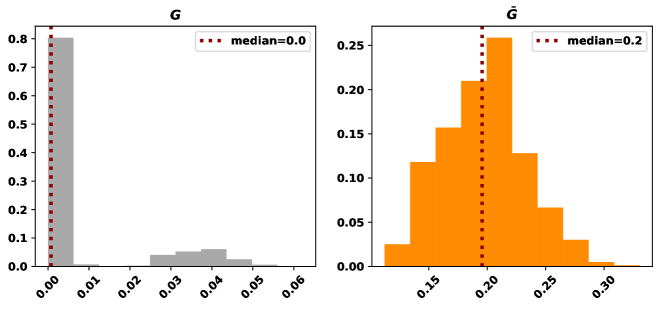
The distributions of both centrality measures for all the networks of this work are given in the Appendix C.2.
4 Conclusion
This manuscript has explored the research topics in the publications of the Iterated Prisoner’s Dilemma, and moreover, the authors’ collaborative behaviour and their centrality. This was achieved by applying network theoretic approaches and a LDA algorithm to a total of 2422 publications. The data collection and an initial analysis of the data set were covered in Section 2. The analysis demonstrated that the PD is a field that continues to attract academic attention and publications.
In Section 3.1 LDA was applied to the data set to identify topics on which researchers have been publishing. The five topics in the PD publications identified by the data set of this work are human subject research, biological studies, strategies, evolutionary dynamics on networks and modeling problems as a PD. These 5 topics nicely summarise PD research. They highlight the interdisciplinarity of the field; how it brings together applied modeling of real world situations (biological studies and modeling problems as a PD) and more theoretical notions such as evolutionary dynamics and optimality of strategies. A temporal analysis explored how relevant these topics have been over the course of time, and it revealed that even though they were not necessarily always the most discussed topics there were still being explored by researchers.
The collaborative behaviour of the field was explored in Section 3.2 investigated the co-authorship network. It was concluded that the field is a collaborative field, where authors are likely to write with a collaborator’s co-authors and on average an author has 4 co-authors. The results were compared to the networks of two other game theoretic fields, and it was shown that the PD network is relatively more collaborative. The authors however, tend to collaborate with authors from one community, but not many authors are involved in multiple communities. This might be an effect of academic research, and it might not be true just for the field of the PD.
Exploring the centrality of authors showed that the most central author of this manuscript is Matjaz Perc. More importantly, it was shown that most central authors of the network were the authors connected to the main cluster. Interestingly, it was uncovered that these authors were the most central due to their publication on a single topic alone. That was the topic of “evolutionary dynamics on networks”. There appears to be more collaboration and more influence in the publications on evolutionary dynamics. The authors are most likely to gain from their position, and come across as the more important authors in the field. Though it is not clear as to why, attention should be paid to the collaborative behaviour of authors of “evolutionary dynamics on networks”.
The study of the PD is the study of cooperation and investigating the cooperative behaviours of authors is what this work has aimed to achieve. Interesting areas of future work would include extending this analysis to more game theoretic sub fields, to evaluate whether the results remain the same. Moreover, the networks of this work were created by not taking into account the strength of ties. The strength of ties could be analysed to map multiple collaborations between two nodes. However, a preliminary assessment showed that the presented results do not change.
Competing Interests
The authors declare no competing interests.
Acknowledgements
The authors would like to thank the anonymous reviewers for their comments which helped improve the paper.
Data Availability
Figures Legends
- •
-
•
Figure 2. Number of articles published on the PD 1951-2018 (on a log scale), with a fitted exponential line, and aforecast for 2017-2022.
-
•
Figure 3. Coherence and exclusivity for LDA models over the number of topics.
-
•
Figure 4. Number of articles per topic over the years (on a logged scale).
- •
References
- Adami and Hintze (2013) Adami, C and Hintze, A (2013). Evolutionary instability of zero-determinant strategies demonstrates that winning is not everything. Nature communications, 4:2193.
- Airoldi and Bischof (2012) Airoldi, EM and Bischof, JM (2012). A poisson convolution model for characterizing topical content with word frequency and exclusivity. arXiv.
- Ashlock and Kim (2008) Ashlock, D and Kim, EY (2008). Fingerprinting: Visualization and automatic analysis of prisoner’s dilemma strategies. IEEE Transactions on Evolutionary Computation, 12(5):647–659.
- Axelrod (1980a) Axelrod, R (1980)a. Effective choice in the prisoner’s dilemma. Journal of conflict resolution, 24(1):3–25.
- Axelrod (1980b) Axelrod, R (1980)b. More effective choice in the prisoner’s dilemma. Journal of Conflict Resolution, 24(3):379–403.
- Axelrod and Hamilton (1981) Axelrod, R and Hamilton, WD (1981). The evolution of cooperation. science, 211(4489):1390–1396.
- Axelrod et al. (1987) Axelrod, R et al. (1987). The evolution of strategies in the iterated prisoner’s dilemma. The dynamics of norms, pages 1–16.
- Aynaud (2020) Aynaud, T (2020). python-louvain 0.14: Louvain algorithm for community detection. https://github.com/taynaud/python-louvain.
- Banerjee and Sen (2007) Banerjee, D and Sen, S (2007). Reaching pareto-optimality in prisoner’s dilemma using conditional joint action learning. Autonomous Agents and Multi-Agent Systems, 15(1):91–108.
- Bell et al. (2017) Bell, R, Mieth, L, and Buchner, A (2017). Separating conditional and unconditional cooperation in a sequential prisoner’s dilemma game. PloS one, 12(11):e0187952.
- Bergmann and Dale (2018) Bergmann, T and Dale, R (2018). A scientometric analysis of evolang: Intersections and authorships. In The evolution of language: Proceedings of the 11th international conference (EVOLANGX11). http://evolang. org/neworleans/papers/182. html. Retrieved, volume 22, 2018.
- Blei et al. (2003) Blei, DM, Ng, AY, and Jordan, MI (2003). Latent dirichlet allocation. Journal of machine Learning research, 3:993–1022.
- Blondel et al. (2008) Blondel, VD, Guillaume, JL, Lambiotte, R, and Lefebvre, E (2008). Fast unfolding of communities in large networks. Journal of statistical mechanics: theory and experiment, 2008(10):P10008.
- Chen et al. (2007) Chen, X, Fu, F, and Wang, L (2007). Influence of initial distributions on robust cooperation in evolutionary prisoner’s dilemma. arXiv.
- Chen et al. (2016) Chen, YT, McAvoy, A, and Nowak, MA (2016). Fixation probabilities for any configuration of two strategies on regular graphs. Scientific reports, 6:39181.
- Clauset et al. (2004) Clauset, A, Newman, MEJ, and Moore, C (2004). Finding community structure in very large networks. Physical review E, 70(6):066111.
- Coelho et al. (2010) Coelho, LP, Peng, T, and Murphy, RF (2010). Quantifying the distribution of probes between subcellular locations using unsupervised pattern unmixing. Bioinformatics, 26(12):i7–i12.
- das Neves Machado et al. (2016) das Neves Machado, R, Vargas-Quesada, B, and Leta, J (2016). Intellectual structure in stem cell research: exploring brazilian scientific articles from 2001 to 2010. Scientometrics, 106(2):525–537.
- Easley et al. (2010) Easley, D, Kleinberg, J, et al. (2010). Networks, crowds, and markets. 8th Edition.
- Etzkowitz (1992) Etzkowitz, H (1992). Individual investigators and their research groups. Minerva, 30(1):28–50.
- Feng and Liu (2008) Feng, X and Liu, Y (2008). Trilateral game analysis on information sharing among members in a virtual team. In 2008 IEEE Symposium on Advanced Management of Information for Globalized Enterprises (AMIGE, pages 1–5. IEEE, 2008.
- Flood (1958) Flood, MM (1958). Some experimental games. Management Science, 5:5–26.
- Geniole et al. (2012) Geniole, SN, Keyes, AE, Mondloch, CJ, Carré, JM, and McCormick, CM (2012). Facing aggression: Cues differ for female versus male faces. PLOS one, 7(1):e30366.
- Glynatsi (2017) Glynatsi, NE (2017). Nikoleta-v3/arcas: Arcas v 0.0.4. https://doi.org/10.5281/zenodo.1127684.
- Glynatsi (2019a) Glynatsi, NE (2019)a. Articles’ meta data on the price of anarchy. https://doi.org/10.5281/zenodo.3406542.
- Glynatsi (2019b) Glynatsi, NE (2019)b. Articles’ meta data on auction games. https://doi.org/10.5281/zenodo.3406544.
- Glynatsi (2019c) Glynatsi, NE (2019)c. Articles’ meta data on the prisoner’s dilemma.
- Glynatsi (2020) Glynatsi, NE (2020). Nikoleta-v3/gensim 1.0.0. https://doi.org/10.5281/zenodo.4290015.
- Grimmer and Stewart (2013) Grimmer, J and Stewart, BM (2013). Text as data: The promise and pitfalls of automatic content analysis methods for political texts. Political analysis, 21(3):267–297.
- Guan (2002) Guan, X (2002). Gaming and price spikes in electric power markets and possible remedies. In Proceedings. International Conference on Power System Technology, volume 1, pages 188–vol. IEEE, 2002.
- Hagberg et al. (2008) Hagberg, AA, Schult, DA, and Swart, PJ (2008). Exploring network structure, dynamics, and function using NetworkX. In Proceedings of the 7th Python in Science Conference (SciPy2008, pages 11–15, Pasadena, CA USA, 2008.
- Hunter (2007) Hunter, JD (2007). Matplotlib: A 2D graphics environment. Computing In Science & Engineering, 9(3):90–95.
- Hutchins et al. (2016) Hutchins, BI, Yuan, X, Anderson, JM, and Santangelo, GM (2016). Relative citation ratio (rcr): A new metric that uses citation rates to measure influence at the article level. PLoS biology, 14(9):e1002541.
- Ichinose et al. (2013) Ichinose, G, Tenguishi, Y, and Tanizawa, T (2013). Robustness of cooperation on scale-free networks under continuous topological change. Physical Review E, 88(5):052808.
- IEEE (1963) IEEE (1963). IEEE xplore digital library. http://ieeexplore.ieee.org/Xplore/home.jsp.
- Inglis and Foster (2018) Inglis, M and Foster, C (2018). Five decades of mathematics education research. Journal for Research in Mathematics Education, 49(4):462–500.
- Ishibuchi et al. (2011) Ishibuchi, H, Ohyanagi, H, and Nojima, Y (2011). Evolution of strategies with different representation schemes in a spatial iterated prisoner’s dilemma game. IEEE Transactions on Computational Intelligence and AI in Games, 3(1):67–82.
- Jones et al. (2001) Jones, E, Oliphant, T, Peterson, P, et al. (2001). SciPy: Open source scientific tools for Python. http://www.scipy.org/.
- Koutsoupias and Papadimitriou (1999) Koutsoupias, E and Papadimitriou, C (1999). Worst-case equilibria. In Proceedings of the 16th Annual Conference on Theoretical Aspects of Computer Science, STACS’99, pages 404–413, Berlin, Heidelberg, 1999. Springer-Verlag. ISBN 3-540-65691-X.
- Kyvik and Reymert (2017) Kyvik, S and Reymert, I (2017). Research collaboration in groups and networks: differences across academic fields. Scientometrics, 113(2):951–967.
- Li et al. (2014) Li, J, Zhu, L, and Gummerum, M (2014). The relationship between moral judgment and cooperation in children with high-functioning autism. Scientific Reports, 4:4314.
- Li et al. (2019) Li, W, Aste, T, Caccioli, F, and Livan, G (2019). Early coauthorship with top scientists predicts success in academic careers. Nature Communications, 10(1):2041–1723.
- Liu and Xia (2015) Liu, P and Xia, H, (2015). Structure and evolution of co-authorship network in an interdisciplinary research field. Scientometrics, 103(1):101–134.
- Mallapaty (2018) Mallapaty, S, 2018. Paper authorship goes hyper. https://www.natureindex.com/news-blog/paper-authorship-goes-hyper.
- Mannheim Media (1950) Mannheim Media (1950). Springer publishing. http://www.springer.com/.
- Matsumoto et al. (2016) Matsumoto, Y, Yamagishi, T, Li, Y, and Kiyonari, T (2016). Prosocial behavior increases with age across five economic games. PloS one, 11(7):e0158671.
- McKiernan (2000) McKiernan, G (2000). arxiv. org: the los alamos national laboratory e-print server. International Journal on Grey Literature, 1(3):127–138.
- Molina et al. (2013) Molina, J Alberto, Giménez-Nadal, J Ignacio, Cuesta, José A, Gracia-Lazaro, Carlos, Moreno, Yamir, and Sanchez, Angel (2013). Gender differences in cooperation: experimental evidence on high school students. PloS one, 8(12):e83700.
- Nature Publishing Group (1869) Nature Publishing Group (1869). Nature. https://www.nature.com/.
- Nurseitov et al. (2009) Nurseitov, N, Paulson, M, Reynolds, R, and Izurieta, C (2009). Comparison of json and xml data interchange formats: a case study. Caine, 2009:157–162.
- Ohtsuki et al. (2006) Ohtsuki, H, Hauert, C, Lieberman, E, and Nowak, MA (2006). A simple rule for the evolution of cooperation on graphs and social networks. Nature, 441(7092):502.
- Ormerod (2010) Ormerod, RJ (2010). Or as rational choice: A decision and game theory perspective. Journal of the Operational Research Society, 61(12):1761–1776.
- PLOS (2000) PLOS (2000). PLOS public library of science. https://www.plos.org/.
- Pritchard et al. (1969) Pritchard, A et al. (1969). Statistical bibliography or bibliometrics. Journal of documentation, 25(4):348–349.
- Raina and Gupta (1998) Raina, D and Gupta, BM (1998). Four aspects of the institutionalization of physics research in india (1990–1950): Substantiating the claims of histortical sociology through bibliometrics. Scientometrics, 42(1):17–40.
- Rehurek and Sojka (2010) Rehurek, R and Sojka, P (2010). Software framework for topic modelling with large corpora. In In Proceedings of the LREC 2010 Workshop on New Challenges for NLP Frameworks. Citeseer, 2010.
- Riolo et al. (2001) Riolo, RL, Cohen, MD, and Axelrod, R (2001). Evolution of cooperation without reciprocity. Nature, 414(6862):441.
- Röder et al. (2015) Röder, M, Both, A, and Hinneburg, A (2015). Exploring the space of topic coherence measures. In Proceedings of the eighth ACM international conference on Web search and data mining, pages 399–408. ACM, 2015.
- Sartakhti et al. (2017) Sartakhti, JS, Manshaei, MH, Basanta, D, and Sadeghi, M (2017). Evolutionary emergence of angiogenesis in avascular tumors using a spatial public goods game. PloS one, 12(4):e0175063.
- Sekara et al. (2018) Sekara, V, Deville, P, Ahnert, SE, Barabási, A, Sinatra, R, and Lehmann, S (2018). The chaperone effect in scientific publishing. Proceedings of the National Academy of Sciences, 115(50):12603–12607. doi: 10.1073/pnas.1800471115.
- Sistrom et al. (2015) Sistrom, M, Park, D, O’Brien, HE, Wang, Z, Guttman, DS, Townsend, JP, and Turner, PE (2015). Genomic and gene-expression comparisons among phage-resistant type-iv pilus mutants of pseudomonas syringae pathovar phaseolicola. PloS one, 10(12):e0144514.
- Stewart and Plotkin (2012) Stewart, AJ and Plotkin, JB (2012). Extortion and cooperation in the prisoner’s dilemma. Proceedings of the National Academy of Sciences, 109(26):10134–10135.
- Stewart and Plotkin (2013) Stewart, AJ and Plotkin, JB (2013). From extortion to generosity, evolution in the iterated prisoner’s dilemma. Proceedings of the National Academy of Sciences, 110(38):15348–15353.
- Sugimoto et al. (2011) Sugimoto, CR, Li, D, Russell, TG, Finlay, SC, and Ding, Y (2011). The shifting sands of disciplinary development: Analyzing north american library and information science dissertations using latent dirichlet allocation. Journal of the American Society for Information Science and Technology, 62(1):185–204.
- Turner and Chao (1999) Turner, PE and Chao, L (1999). Prisoner’s dilemma in an rna virus. Nature, 398(6726):441.
- van Noorden (2017) van Noorden, R (2017). The science that’s never been cited. https://www.nature.com/articles/d41586-017-08404-0.
- Walt et al. (2011) Walt, S, Colbert, SC, and Varoquaux, G (2011). The NumPy array: a structure for efficient numerical computation. Computing in Science & Engineering, 13(2):22–30.
- Wang et al. (2012) Wang, J, Xia, CY, W, YL, Ding, S, and Sun, JQ (2012). Spatial prisoner’s dilemma games with increasing size of the interaction neighborhood on regular lattices. Chinese science bulletin, 57(7):724–728.
- Wang et al. (2008) Wang, X, Ma, X, and Grimson, WEL (2008). Unsupervised activity perception in crowded and complicated scenes using hierarchical bayesian models. IEEE Transactions on pattern analysis and machine intelligence, 31(3):539–555.
- Wu et al. (2019) Wu, T, Fu, F, and Wang, L (2019). Phenotype affinity mediated interactions can facilitate the evolution of cooperation. Journal of theoretical biology, 462:361–369.
- Youngblood and Lahti (2018) Youngblood, M and Lahti, D (2018). A bibliometric analysis of the interdisciplinary field of cultural evolution. Palgrave Communications, 4(1):120.
Appendix A Topic modeling results over time periods
| Period | Topic | Topic Keywords | Num of Documents | Percentage of Documents |
|---|---|---|---|---|
| 1951-1965 | 1 | problem, technology, divert, euler, subsystem, requirement, trace, technique, system, untried | 3 | 0.375 |
| 1951-1965 | 2 | interpret, requirement, programme, evolution, article, increase, policy, system, trace, technology | 2 | 0.25 |
| 1951-1965 | 3 | equipment, agency, conjecture, development, untried, programme, trend, technology, weapon, technique | 1 | 0.125 |
| 1951-1965 | 4 | variation, celebrated, trend, untried, change, involve, month, technique, subsystem, research | 1 | 0.125 |
| 1951-1965 | 5 | give, good, modern, trace, technique, ambiguity, problem, trend, technology, system | 1 | 0.125 |
| 1951-1973 | 1 | study, shock, cooperative, money, part, vary, investigate, good, receive, equipment | 12 | 0.3243 |
| 1951-1973 | 2 | cooperation, level, significantly, sequence, reward, provoke, descriptive, principal, display, argue | 4 | 0.1081 |
| 1951-1973 | 3 | player, make, effect, triad, experimental, motivation, dominate, hypothesis, instruction, trend | 3 | 0.0811 |
| 1951-1973 | 4 | ss, sex, male, female, dyad, design, suggest, college, factor, tend | 3 | 0.0811 |
| 1951-1973 | 5 | result, research, format, change, operational, analysis, relate, understanding, decision, money | 2 | 0.0541 |
| 1951-1973 | 6 | condition, give, high, treatment, conflict, cc, real, original, replication, promote | 2 | 0.0541 |
| 1951-1973 | 7 | group, competitive, show, interpret, scale, compete, escalation, free, variable, individualistic | 2 | 0.0541 |
| 1951-1973 | 8 | outcome, strategy, choice, type, pdg, difference, dummy, conclude, compare, consistent | 2 | 0.0541 |
| 1951-1973 | 9 | game, difference, pair, approach, behavior, person, weapon, occur, advantaged, differential | 2 | 0.0541 |
| 1951-1973 | 10 | response, present, dilemma, influence, cooperate, bias, point, amount, participate, factor | 2 | 0.0541 |
| 1951-1973 | 11 | trial, problem, previous, involve, prisoner, experiment, follow, tit, increase, initial | 1 | 0.027 |
| 1951-1973 | 12 | matrix, behavior, rational, black, model, research, broad, distance, complex, trace | 1 | 0.027 |
| 1951-1973 | 13 | play, finding, individual, noncooperative, white, nature, race, ratio, represent, prisoner | 1 | 0.027 |
| 1951-1980 | 1 | play, trial, group, follow, white, interpret, scale, black, trend, small | 14 | 0.25 |
| 1951-1980 | 2 | outcome, level, effect, type, dyad, vary, pdg, participate, understanding, arise | 9 | 0.1607 |
| 1951-1980 | 3 | game, strategy, cooperation, significant, difference, sentence, text, occur, differential, hypothesis | 4 | 0.0714 |
| 1951-1980 | 4 | male, female, find, result, sex, subject, experimental, situation, treatment, computer | 4 | 0.0714 |
| 1951-1980 | 5 | research, problem, influence, matrix, format, model, analysis, year, crime, equipment | 4 | 0.0714 |
| 1951-1980 | 6 | condition, dilemma, bias, free, attempt, book, year, dummy, prison, design | 4 | 0.0714 |
| 1951-1980 | 7 | variable, result, factor, individual, ability, triad, half, migration, change, investigate | 3 | 0.0536 |
| 1951-1980 | 8 | show, present, suggest, rational, compete, approach, characteristic, examine, person, conduct | 3 | 0.0536 |
| 1951-1980 | 9 | behavior, high, finding, relate, obtain, assistance, ratio, good, weapon, competition | 3 | 0.0536 |
| 1951-1980 | 10 | ss, shock, money, competitive, part, difference, pair, amount, man, information | 3 | 0.0536 |
| 1951-1980 | 11 | player, conflict, theory, decision, determine, produce, maker, cooperate, specialist, programming | 2 | 0.0357 |
| 1951-1980 | 12 | study, prisoner, make, response, experiment, noncooperative, standard, separate, conclude, initial | 2 | 0.0357 |
| 1951-1980 | 13 | give, cooperative, choice, cognitive, real, operational, set, subject, ascribe, concern | 1 | 0.0179 |
| 1951-1988 | 1 | trial, difference, find, choice, significant, competitive, effect, triad, interact, occur | 24 | 0.2553 |
| 1951-1988 | 2 | ss, shock, money, pair, response, part, high, tit, receive, amount | 13 | 0.1383 |
| 1951-1988 | 3 | suggest, paper, case, debate, view, achieve, framework, natural, assumption, finitely | 10 | 0.1064 |
| 1951-1988 | 4 | prisoner, dilemma, behavior, model, present, involve, person, increase, trust, experiment | 8 | 0.0851 |
| 1951-1988 | 5 | game, player, show, approach, repeat, previous, move, tat, related, include | 8 | 0.0851 |
| 1951-1988 | 6 | cooperation, level, mutual, equilibrium, standard, provide, information, human, real, question | 6 | 0.0638 |
| 1951-1988 | 7 | play, result, male, subject, female, cooperative, sex, experimental, treatment, computer | 5 | 0.0532 |
| 1951-1988 | 8 | research, study, variable, ability, factor, conflict, matrix, year, student, interpret | 4 | 0.0426 |
| 1951-1988 | 9 | problem, group, small, scale, social, issue, large, base, bias, party | 4 | 0.0426 |
| 1951-1988 | 10 | game, strategy, outcome, type, cooperate, ethical, pdg, explain, dependent, separate | 4 | 0.0426 |
| 1951-1988 | 11 | give, condition, individual, major, dyad, behaviour, produce, conflict, assistance, collectively | 3 | 0.0319 |
| 1951-1988 | 12 | situation, iterate, statement, rational, card, side, paradox, true, consequence, front | 2 | 0.0213 |
| 1951-1988 | 13 | inflation, hypothesis, rate, run, change, demand, nominal, cost, output, growth | 2 | 0.0213 |
| 1951-1988 | 14 | theory, make, analysis, decision, system, examine, work, soft, lead, hard | 1 | 0.0106 |
| 1951-1995 | 1 | strategy, population, evolution, iterate, tit, opponent, evolve, dynamic, set, tat | 31 | 0.1732 |
| 1951-1995 | 2 | game, repeat, assumption, rule, person, equilibrium, general, finitely, indefinitely, analyze | 24 | 0.1341 |
| 1951-1995 | 3 | inflation, long, rate, hypothesis, run, policy, cost, nominal, demand, programming | 20 | 0.1117 |
| 1951-1995 | 4 | condition, outcome, trial, find, difference, cooperation, experiment, level, significant, response | 15 | 0.0838 |
| 1951-1995 | 5 | rational, result, receive, statement, money, paradox, shock, iterate, consequence, common | 14 | 0.0782 |
| 1951-1995 | 6 | cooperation, show, competitive, high, probability, conflict, simulation, altruism, yield, natural | 14 | 0.0782 |
| 1951-1995 | 7 | prisoner, dilemma, give, point, defect, form, cooperator, increase, relate, ethical | 10 | 0.0559 |
| 1951-1995 | 8 | player, give, decision, provide, cooperative, game, previous, pair, determine, interact | 9 | 0.0503 |
| 1951-1995 | 9 | play, cooperate, result, male, subject, female, time, relationship, suggest, student | 8 | 0.0447 |
| 1951-1995 | 10 | problem, group, theory, good, approach, society, large, scale, issue, level | 8 | 0.0447 |
| 1951-1995 | 11 | study, situation, behaviour, computer, argue, change, implication, characteristic, real, associate | 8 | 0.0447 |
| 1951-1995 | 12 | model, paper, behavior, examine, present, mutual, expectation, develop, type, variable | 7 | 0.0391 |
| 1951-1995 | 13 | make, research, system, analysis, choice, work, base, relation, world, wide | 6 | 0.0335 |
| 1951-1995 | 14 | individual, social, behavior, standard, choose, evolutionary, partner, payoff, defection, small | 5 | 0.0279 |
| 1951-2003 | 1 | game, player, dilemma, prisoner, theory, give, paper, make, group, problem | 151 | 0.4266 |
| 1951-2003 | 2 | cooperation, result, play, show, cooperate, condition, cooperative, high, level, time | 106 | 0.2994 |
| 1951-2003 | 3 | strategy, model, agent, study, behavior, individual, population, evolutionary, state, player | 97 | 0.274 |
| 1951-2010 | 1 | model, theory, paper, base, make, present, problem, provide, human, decision | 325 | 0.3454 |
| 1951-2010 | 2 | game, strategy, player, agent, play, dilemma, system, behavior, show, state | 322 | 0.3422 |
| 1951-2010 | 3 | cooperation, network, study, population, individual, evolutionary, social, evolution, interaction, structure | 294 | 0.3124 |
| 1951-2018 | 1 | model, theory, system, base, paper, problem, propose, present, approach, provide | 556 | 0.2251 |
| 1951-2018 | 2 | behavior, social, human, decision, study, experiment, make, suggest, result, behaviour | 482 | 0.1951 |
| 1951-2018 | 3 | individual, group, good, social, punishment, level, cost, mechanism, dilemma, cooperative | 428 | 0.1733 |
| 1951-2018 | 4 | game, strategy, player, agent, play, dilemma, state, prisoner, payoff, equilibrium | 380 | 0.1538 |
| 1951-2018 | 5 | population, evolutionary, dynamic, model, selection, result, evolution, evolve, show, process | 351 | 0.1421 |
| 1951-2018 | 6 | cooperation, network, interaction, structure, study, evolution, find, behavior, cooperative, simulation | 273 | 0.1105 |
Appendix B Cumulative Networks Metrics
B.1 Collaborativeness metrics for cumulative graphs,
| # Nodes | # Edges | # Isolated nodes | % Isolated nodes | # Connected components | Size of largest component | Av. degree | # Communities | Modularity | Clustering coeff | |
|---|---|---|---|---|---|---|---|---|---|---|
| Period 0 | 11 | 3 | 5 | 45.5 | 8 | 2 | 0.545 | 8 | 0.667 | 0.000 |
| Period 1 | 14 | 4 | 6 | 42.9 | 10 | 2 | 0.571 | 10 | 0.750 | 0.000 |
| Period 2 | 27 | 15 | 8 | 29.6 | 16 | 5 | 1.111 | 16 | 0.684 | 0.160 |
| Period 3 | 29 | 17 | 9 | 31.0 | 17 | 6 | 1.172 | 17 | 0.630 | 0.172 |
| Period 4 | 32 | 18 | 10 | 31.2 | 19 | 6 | 1.125 | 19 | 0.667 | 0.156 |
| Period 5 | 43 | 28 | 10 | 23.3 | 23 | 6 | 1.302 | 23 | 0.827 | 0.326 |
| Period 6 | 49 | 34 | 10 | 20.4 | 25 | 6 | 1.388 | 25 | 0.867 | 0.408 |
| Period 7 | 52 | 35 | 11 | 21.2 | 27 | 6 | 1.346 | 27 | 0.873 | 0.385 |
| Period 8 | 54 | 35 | 13 | 24.1 | 29 | 6 | 1.296 | 29 | 0.873 | 0.370 |
| Period 9 | 54 | 35 | 13 | 24.1 | 29 | 6 | 1.296 | 29 | 0.873 | 0.370 |
| Period 10 | 59 | 36 | 16 | 27.1 | 33 | 6 | 1.220 | 33 | 0.880 | 0.339 |
| Period 11 | 60 | 36 | 17 | 28.3 | 34 | 6 | 1.200 | 34 | 0.880 | 0.333 |
| Period 12 | 63 | 40 | 17 | 27.0 | 34 | 6 | 1.270 | 34 | 0.884 | 0.339 |
| Period 13 | 65 | 40 | 19 | 29.2 | 36 | 6 | 1.231 | 36 | 0.884 | 0.328 |
| Period 14 | 69 | 46 | 20 | 29.0 | 37 | 6 | 1.333 | 37 | 0.889 | 0.360 |
| Period 15 | 71 | 46 | 22 | 31.0 | 39 | 6 | 1.296 | 39 | 0.889 | 0.350 |
| Period 16 | 75 | 47 | 24 | 32.0 | 42 | 6 | 1.253 | 42 | 0.894 | 0.331 |
| Period 17 | 80 | 47 | 29 | 36.2 | 47 | 6 | 1.175 | 47 | 0.894 | 0.310 |
| Period 18 | 84 | 47 | 33 | 39.3 | 51 | 6 | 1.119 | 51 | 0.894 | 0.296 |
| Period 19 | 92 | 48 | 39 | 42.4 | 58 | 6 | 1.043 | 58 | 0.898 | 0.270 |
| Period 20 | 101 | 52 | 43 | 42.6 | 64 | 6 | 1.030 | 64 | 0.909 | 0.276 |
| Period 21 | 114 | 62 | 44 | 38.6 | 70 | 6 | 1.088 | 70 | 0.926 | 0.279 |
| Period 22 | 119 | 64 | 45 | 37.8 | 73 | 6 | 1.076 | 73 | 0.930 | 0.268 |
| Period 23 | 129 | 69 | 48 | 37.2 | 79 | 6 | 1.070 | 79 | 0.937 | 0.270 |
| Period 24 | 140 | 72 | 55 | 39.3 | 87 | 6 | 1.029 | 87 | 0.941 | 0.249 |
| Period 25 | 154 | 81 | 60 | 39.0 | 95 | 6 | 1.052 | 95 | 0.947 | 0.252 |
| Period 26 | 179 | 95 | 71 | 39.7 | 111 | 6 | 1.061 | 111 | 0.955 | 0.273 |
| Period 27 | 192 | 102 | 74 | 38.5 | 118 | 6 | 1.062 | 118 | 0.960 | 0.270 |
| Period 28 | 199 | 105 | 75 | 37.7 | 122 | 6 | 1.055 | 122 | 0.962 | 0.260 |
| Period 29 | 214 | 115 | 79 | 36.9 | 130 | 6 | 1.075 | 130 | 0.966 | 0.284 |
| Period 30 | 255 | 140 | 85 | 33.3 | 151 | 6 | 1.098 | 151 | 0.973 | 0.275 |
| Period 31 | 288 | 169 | 92 | 31.9 | 166 | 6 | 1.174 | 166 | 0.977 | 0.304 |
| Period 32 | 319 | 195 | 96 | 30.1 | 179 | 6 | 1.223 | 179 | 0.979 | 0.327 |
| Period 33 | 360 | 235 | 103 | 28.6 | 198 | 7 | 1.306 | 198 | 0.977 | 0.334 |
| Period 34 | 411 | 278 | 112 | 27.3 | 222 | 7 | 1.353 | 222 | 0.979 | 0.349 |
| Period 35 | 459 | 310 | 118 | 25.7 | 246 | 7 | 1.351 | 246 | 0.982 | 0.343 |
| Period 36 | 521 | 370 | 124 | 23.8 | 269 | 10 | 1.420 | 269 | 0.983 | 0.355 |
| Period 37 | 621 | 476 | 130 | 20.9 | 303 | 19 | 1.533 | 303 | 0.985 | 0.393 |
| Period 38 | 738 | 603 | 141 | 19.1 | 344 | 22 | 1.634 | 344 | 0.987 | 0.422 |
| Period 39 | 904 | 877 | 157 | 17.4 | 394 | 25 | 1.940 | 394 | 0.985 | 0.467 |
| Period 40 | 1062 | 1170 | 164 | 15.4 | 432 | 33 | 2.203 | 433 | 0.985 | 0.498 |
| Period 41 | 1232 | 1442 | 178 | 14.4 | 480 | 71 | 2.341 | 482 | 0.982 | 0.515 |
| Period 42 | 1429 | 1936 | 195 | 13.6 | 531 | 133 | 2.710 | 535 | 0.965 | 0.538 |
| Period 43 | 1695 | 2375 | 214 | 12.6 | 607 | 157 | 2.802 | 610 | 0.970 | 0.564 |
| Period 44 | 1980 | 2865 | 223 | 11.3 | 677 | 209 | 2.894 | 680 | 0.968 | 0.589 |
| Period 45 | 2300 | 3420 | 244 | 10.6 | 754 | 322 | 2.974 | 760 | 0.965 | 0.602 |
| Period 46 | 2643 | 3971 | 265 | 10.0 | 845 | 399 | 3.005 | 856 | 0.962 | 0.618 |
| Period 47 | 3106 | 4877 | 278 | 9.0 | 933 | 504 | 3.140 | 947 | 0.965 | 0.639 |
| Period 48 | 3664 | 6532 | 309 | 8.4 | 1045 | 613 | 3.566 | 1058 | 0.964 | 0.659 |
| Period 49 | 3938 | 7072 | 322 | 8.2 | 1098 | 706 | 3.592 | 1115 | 0.965 | 0.664 |
| Period 50 | 4221 | 7642 | 338 | 8.0 | 1157 | 796 | 3.621 | 1177 | 0.965 | 0.666 |
B.2 Collaborativeness metrics for cumulative graphs’ main clusters,
| # Nodes | # Edges | # Isolated nodes | % Isolated nodes | # Connected components | Size of largest component | Av. degree | # Communities | Modularity | Clustering coeff | |
| 0 | 2 | 1 | 0 | 0.0 | 1 | 2 | 1.000 | 1 | 0.000 | 0.000 |
| 1 | 2 | 1 | 0 | 0.0 | 1 | 2 | 1.000 | 1 | 0.000 | 0.000 |
| 2 | 5 | 8 | 0 | 0.0 | 1 | 5 | 3.200 | 1 | 0.000 | 0.867 |
| 3 | 6 | 10 | 0 | 0.0 | 1 | 6 | 3.333 | 2 | 0.020 | 0.833 |
| 4 | 6 | 10 | 0 | 0.0 | 1 | 6 | 3.333 | 2 | 0.020 | 0.833 |
| 5 | 6 | 10 | 0 | 0.0 | 1 | 6 | 3.333 | 2 | 0.020 | 0.833 |
| 6 | 6 | 10 | 0 | 0.0 | 1 | 6 | 3.333 | 2 | 0.020 | 0.833 |
| 7 | 6 | 10 | 0 | 0.0 | 1 | 6 | 3.333 | 2 | 0.020 | 0.833 |
| 8 | 6 | 10 | 0 | 0.0 | 1 | 6 | 3.333 | 2 | 0.020 | 0.833 |
| 9 | 6 | 10 | 0 | 0.0 | 1 | 6 | 3.333 | 2 | 0.020 | 0.833 |
| 10 | 6 | 10 | 0 | 0.0 | 1 | 6 | 3.333 | 2 | 0.020 | 0.833 |
| 11 | 6 | 10 | 0 | 0.0 | 1 | 6 | 3.333 | 2 | 0.020 | 0.833 |
| 12 | 6 | 10 | 0 | 0.0 | 1 | 6 | 3.333 | 2 | 0.020 | 0.833 |
| 13 | 6 | 10 | 0 | 0.0 | 1 | 6 | 3.333 | 2 | 0.020 | 0.833 |
| 14 | 6 | 10 | 0 | 0.0 | 1 | 6 | 3.333 | 2 | 0.020 | 0.833 |
| 15 | 6 | 10 | 0 | 0.0 | 1 | 6 | 3.333 | 2 | 0.020 | 0.833 |
| 16 | 6 | 10 | 0 | 0.0 | 1 | 6 | 3.333 | 2 | 0.020 | 0.833 |
| 17 | 6 | 10 | 0 | 0.0 | 1 | 6 | 3.333 | 2 | 0.020 | 0.833 |
| 18 | 6 | 10 | 0 | 0.0 | 1 | 6 | 3.333 | 2 | 0.020 | 0.833 |
| 19 | 6 | 10 | 0 | 0.0 | 1 | 6 | 3.333 | 2 | 0.020 | 0.833 |
| 20 | 6 | 10 | 0 | 0.0 | 1 | 6 | 3.333 | 2 | 0.020 | 0.833 |
| 21 | 6 | 10 | 0 | 0.0 | 1 | 6 | 3.333 | 2 | 0.020 | 0.833 |
| 22 | 6 | 10 | 0 | 0.0 | 1 | 6 | 3.333 | 2 | 0.020 | 0.833 |
| 23 | 6 | 10 | 0 | 0.0 | 1 | 6 | 3.333 | 2 | 0.020 | 0.833 |
| 24 | 6 | 10 | 0 | 0.0 | 1 | 6 | 3.333 | 2 | 0.020 | 0.833 |
| 25 | 6 | 10 | 0 | 0.0 | 1 | 6 | 3.333 | 2 | 0.020 | 0.833 |
| 26 | 6 | 10 | 0 | 0.0 | 1 | 6 | 3.333 | 2 | 0.020 | 0.833 |
| 27 | 6 | 10 | 0 | 0.0 | 1 | 6 | 3.333 | 2 | 0.020 | 0.833 |
| 28 | 6 | 10 | 0 | 0.0 | 1 | 6 | 3.333 | 2 | 0.020 | 0.833 |
| 29 | 6 | 10 | 0 | 0.0 | 1 | 6 | 3.333 | 2 | 0.020 | 0.833 |
| 30 | 6 | 10 | 0 | 0.0 | 1 | 6 | 3.333 | 2 | 0.020 | 0.833 |
| 31 | 6 | 10 | 0 | 0.0 | 1 | 6 | 3.333 | 2 | 0.020 | 0.833 |
| 32 | 6 | 10 | 0 | 0.0 | 1 | 6 | 3.333 | 2 | 0.020 | 0.833 |
| 33 | 7 | 21 | 0 | 0.0 | 1 | 7 | 6.000 | 1 | 0.000 | 1.000 |
| 34 | 7 | 21 | 0 | 0.0 | 1 | 7 | 6.000 | 1 | 0.000 | 1.000 |
| 35 | 7 | 21 | 0 | 0.0 | 1 | 7 | 6.000 | 1 | 0.000 | 1.000 |
| 36 | 10 | 13 | 0 | 0.0 | 1 | 10 | 2.600 | 2 | 0.376 | 0.553 |
| 37 | 19 | 28 | 0 | 0.0 | 1 | 19 | 2.947 | 3 | 0.544 | 0.730 |
| 38 | 22 | 35 | 0 | 0.0 | 1 | 22 | 3.182 | 4 | 0.541 | 0.720 |
| 39 | 25 | 39 | 0 | 0.0 | 1 | 25 | 3.120 | 5 | 0.558 | 0.686 |
| 40 | 33 | 62 | 0 | 0.0 | 1 | 33 | 3.758 | 4 | 0.623 | 0.736 |
| 41 | 71 | 148 | 0 | 0.0 | 1 | 71 | 4.169 | 6 | 0.726 | 0.698 |
| 42 | 133 | 387 | 0 | 0.0 | 1 | 133 | 5.820 | 7 | 0.726 | 0.749 |
| 43 | 157 | 465 | 0 | 0.0 | 1 | 157 | 5.924 | 8 | 0.721 | 0.725 |
| 44 | 209 | 611 | 0 | 0.0 | 1 | 209 | 5.847 | 13 | 0.738 | 0.737 |
| 45 | 322 | 892 | 0 | 0.0 | 1 | 322 | 5.540 | 16 | 0.780 | 0.743 |
| 46 | 399 | 1109 | 0 | 0.0 | 1 | 399 | 5.559 | 15 | 0.792 | 0.742 |
| 47 | 504 | 1368 | 0 | 0.0 | 1 | 504 | 5.429 | 21 | 0.809 | 0.751 |
| 48 | 613 | 1677 | 0 | 0.0 | 1 | 613 | 5.471 | 24 | 0.820 | 0.761 |
| 49 | 706 | 1935 | 0 | 0.0 | 1 | 706 | 5.482 | 28 | 0.832 | 0.772 |
| 50 | 796 | 2214 | 0 | 0.0 | 1 | 796 | 5.563 | 29 | 0.843 | 0.773 |
Appendix C Centrality Measures Distributions
C.1 Distributions for and
C.2 Distrubutions for Topic Networks