Himani Mishra
Sitangshu Bhattacharya
Corresponding Author’s Email: sitangshu@iiita.ac.inNanoscale Electro-Thermal Laboratory, Department of Electronics and Communication Engineering, Indian Institute of Information Technology-Allahabad, Uttar Pradesh 211015, India
I Supporting convergence figures and added graphical information
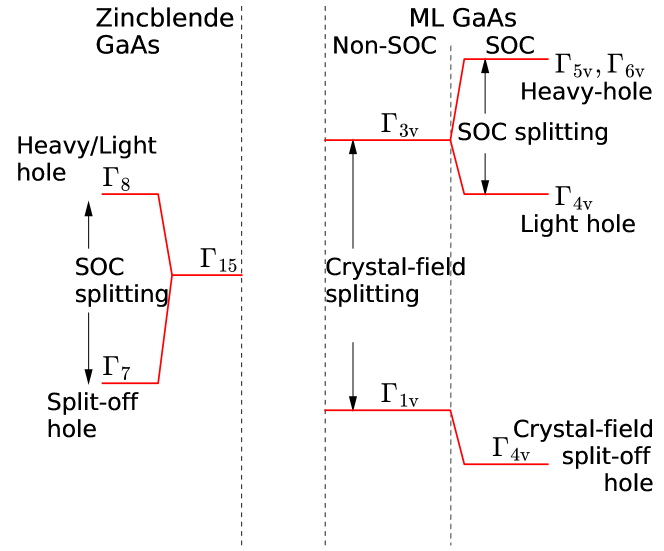
I.1 Crystal-field splitting and spin-orbit splitting in bulk zincblende and monolayer structure of GaAs.
Figure S1: Schematic of valence band splitting at of the BZ in the presence of crystal-field and SOC for zincblende and hexagonal GaAs monolayer type structures. Note that , is the Kramers pair with .
I.2 Kinetic cut-off convergences
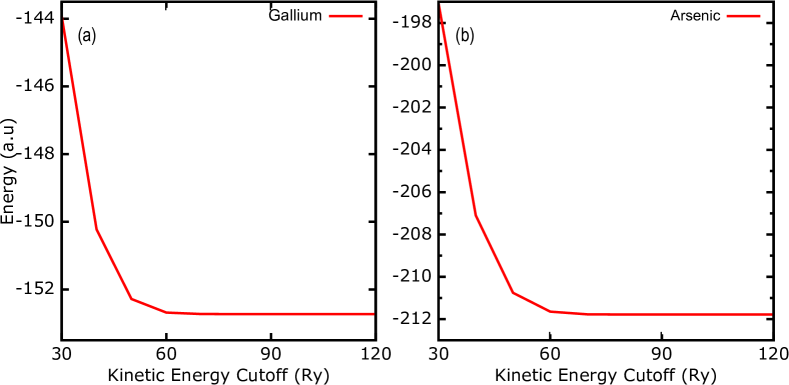
Figure S2: Total energy minimization as function of kinetic energy cut-off using a norm-conserving fully relativistic pseudo-potential of (a) Gallium and (b) Arsenic. We see that the energy settles at 120 Ry in both cases. We therefore choose 120 Ry in all our subsequent computations.
I.3 k-point sampling convergences in the absence of spin-orbit coupling case
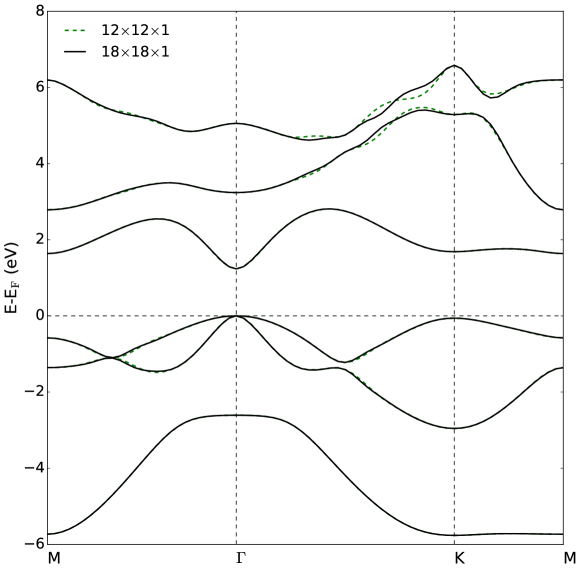
Figure S3: Ground state electron energy dispersion in ML buckled GaAs using kinetic energy cut-of 120 Ry and using a norm-conserving fully relativistic pseudo-potential in absence of spin-orbit coupling for -point sampling of 12121 and 18181. We see that the sampling to 18181 does not improve energies even within meV region, and therefore in all our subsequent DFT analyses, we use 12121 sampling. EF is the Fermi energy and the top of the valence band is set to zero energy scale.
I.4 k-point sampling convergences in the presence of spin-orbit coupling case
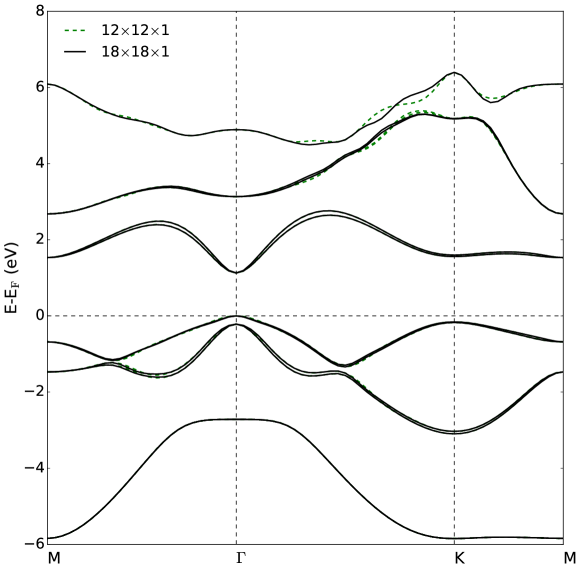
Figure S4: Ground state electron energy dispersion in ML buckled GaAs using kinetic energy cut-of 120 Ry and using a norm-conserving fully relativistic pseudo-potential in presence of spin-orbit coupling for -point sampling of 12121 and 18181. We see that the influence of spin-orbit coupling demonstrate a “Zeeman”-like splitting in the top of the valence band at . Dense sampling to 18181 does not improve energies in the conduction and valence bands vicinity to 0-line. Therefore in all our subsequent DFT analyses, we have used 12121 sampling. EF is the Fermi energy and the top of the valence band is set to zero energy scale.
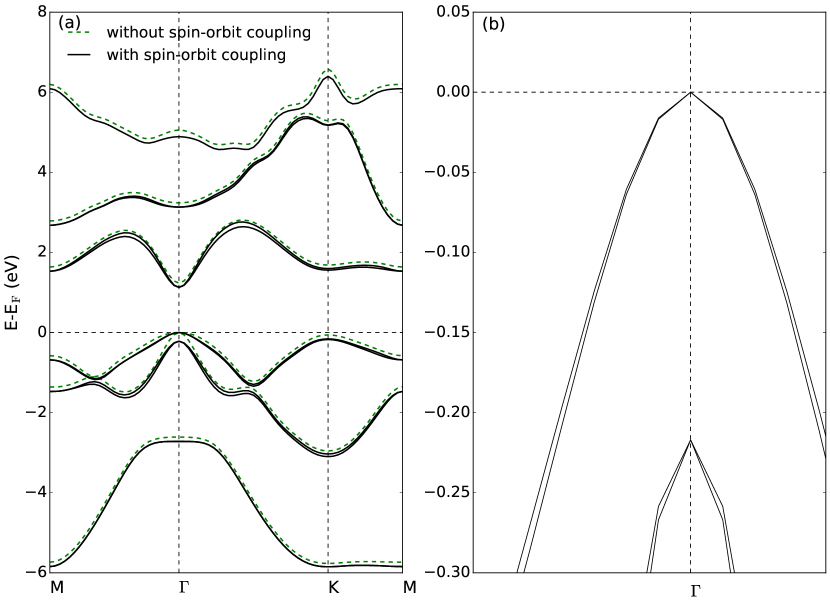
I.5 Energy band structure comparison in the presence and absence of spin-orbit coupling
Figure S5: (a) Ground state electron energy dispersion in ML buckled GaAs in the presence and absence of spin-orbit coupling. We see that the influence of spin-orbit coupling demonstrate a “Zeeman”-like splitting in the top of the valence band at . EF is the Fermi energy and the top of the valence band is set to zero energy scale. (b) Magnified snap-shot of the degeneracy in the valence states at in the presence of spin-orbit coupling.
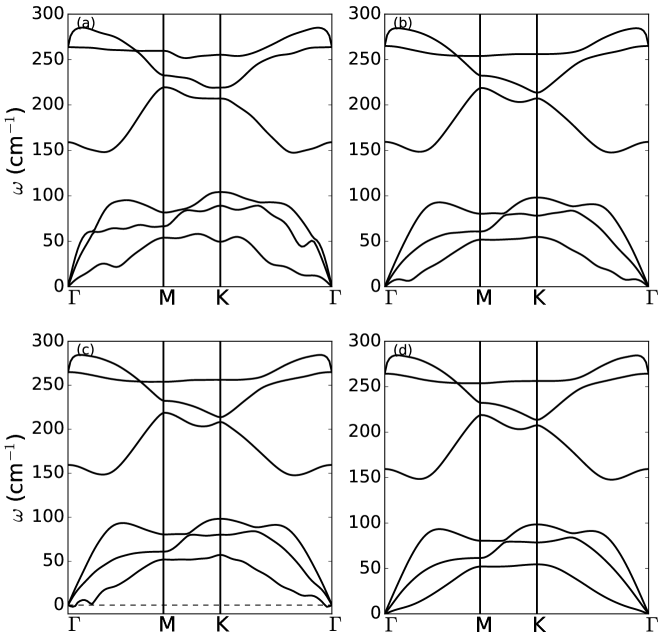
I.6 Phonon dispersion convergences
Figure S6: Phonon dispersion curves showing the convergences using (a) 12121 phonon grid and a rigid self-consistent
error threshold below 10-12 Ry, (b) 14141 phonon grid and a rigid self-consistent
error threshold below 10-14 Ry, (c) 18181 phonon grid and a rigid self-consistent
error threshold below 10-16 (soft-modes are seen in the vicinity of along -M route) Ry and (d) 18181 phonon grid and a rigid self-consistent
error threshold below 10-18 Ry. Clearly, (d) shows a converged result with no soft-modes for the geometry in Fig. S1.
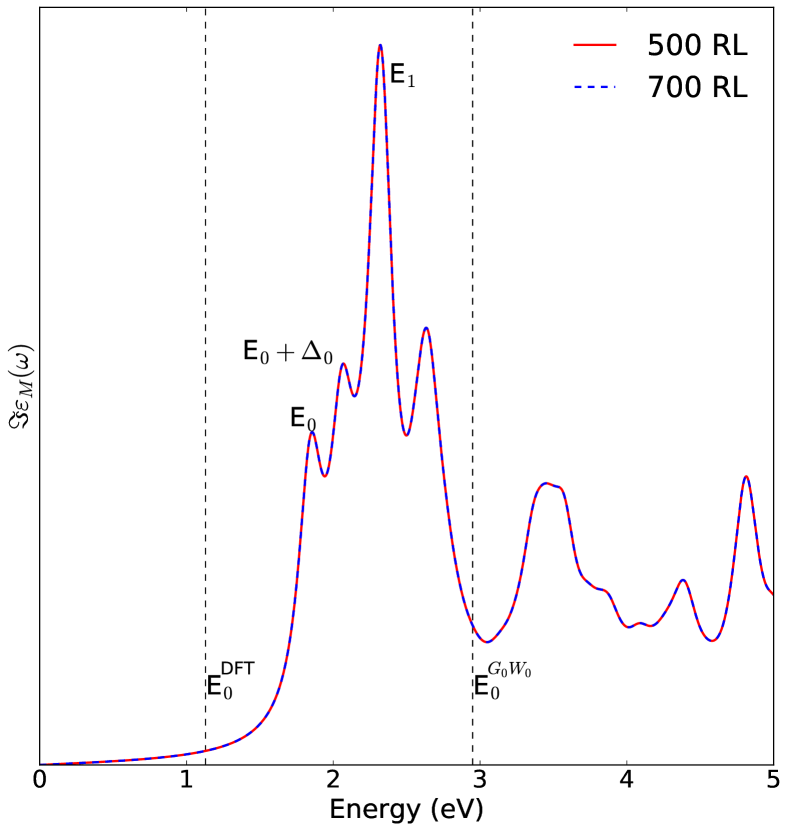
I.7 BSE spectra convergence with respect to local field effect cut-off
Figure S7: Comparison between the absorption spectra for two different values of the response block size used in calculation of local field effects (LFEs). As optical spectra are very sensitive to the -point sampling, we perform all our static and time-dependent spectra on 72721 -point grid. Here the cut-off energies are in the unit of reciprocal lattice (RL) vectors. We see that the convergence is achieved for both 500 RL (7 Ry) and 700 RL (9 Ry).
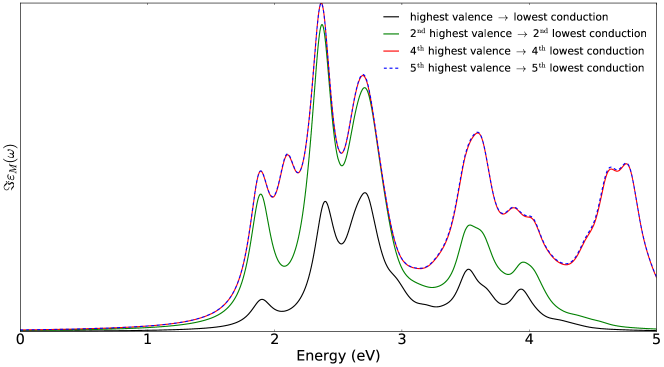
I.8 BSE absorption spectra convergence with respect to transition bands
Figure S8: Convergence of absorption spectra with respect to the number of conduction and valence bands. The local field effect cut-off of 7 Ry is used from the preceding Fig. S7. As optical spectra are very sensitive to the -point sampling, we perform all our static and time-dependent spectra on 72721 -point grid. An excellent convergence is shown using top 5 valence and lowest 5 conduction bands.
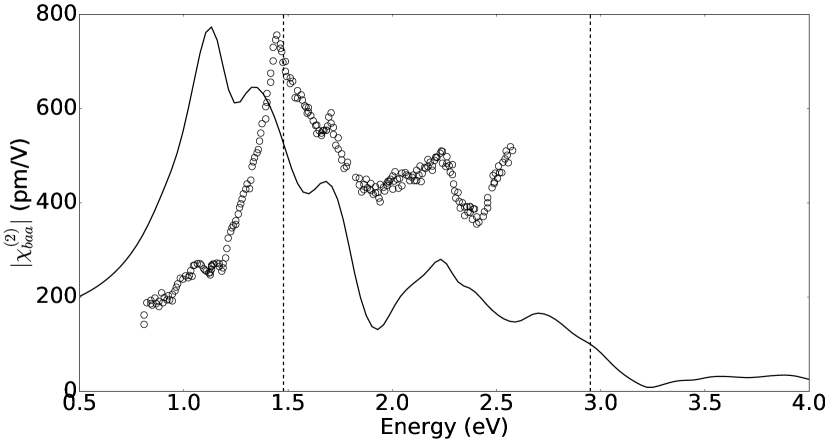
I.9 SHG absorption spectra of monolayer and bulk zincblende structures of GaAs.
Figure S9: Nonlinear SHG spectra of ML buckled GaAs and bulk zincblende GaAs. The solid line is the SHG computed using the TD-BSE level of theory. The symbols are the experimental SHG spectra of zincblende bulk GaAs taken from Bergfeld and Daum Bergfeld and Daum (2003) and put here for comparison with the hexagonal monolayer. The solid and dashed vertical lines are for the and gaps of ML GaAs. The theoretical computations were performed on 72721 -point grid.
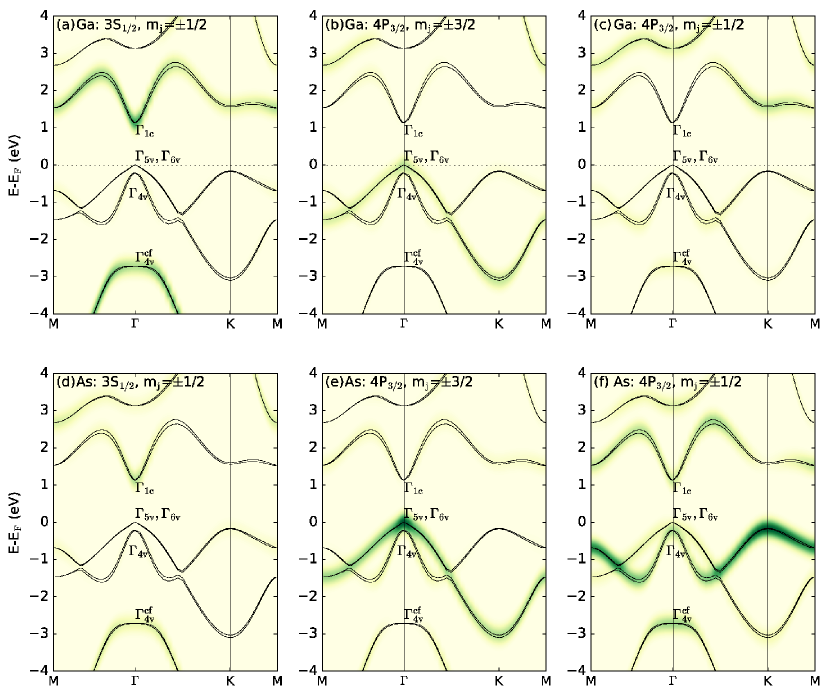
I.10 Individual atomic partial density-of-states on the energy band of ML GaAs.
Figure S10: Ground state electron energy dispersion in ML buckled GaAs in the presence SOC demonstrating the individual p-DOS contributions from (a) Ga 3S1/2, mj=1/2, (b) Ga 4P3/2, mj=3/2, (c) Ga 4P3/2, mj=1/2, (d) As 3S1/2, mj=1/2, (e) As 4P3/2, mj=3/2 and (f) As 4P3/2, mj=1/2. We find that at , the orbital weight of the state and comes from Ga 3S1/2, mj=1/2. The valence spin-orbit splitting () and the direct band-gap (E) at is 0.22 eV and 1.13 eV respectively. EF is the Fermi energy and the top of the valence band is set to zero energy scale.
References
Bergfeld and Daum (2003)S. Bergfeld and W. Daum, Phys.
Rev. Lett. 90, 036801
(2003).