ARPES study of orbital characters, symmetry breakings and pseudogaps
in doped and pure Sr2IrO4
Abstract
Sr2IrO4 is characterized by a large spin-orbit coupling, which gives rise to bands with strongly entangled spin and orbital characters, called J1/2 and J3/2. We use light-polarization dependent ARPES to study directly the orbital character of these bands and fully map out their dispersion. We observe bands in very good agreement with our cluster dynamical mean-field theory calculations. We show that the J1/2 band, the closest to the Fermi level , is dominated by dxz character along and dyz along . This is actually in agreement with an isotropic J1/2 character on average, but this large orbital dependence in -space was mostly overlooked before. It gives rise to strong modulations of the ARPES intensity that we explain and carefully take into account to compare dispersions in equivalent directions of the Brillouin zone. Although the latter dispersions look different at first, suggesting possible symmetry breakings, they are found essentially similar, once corrected for these intensity variations. In particular, the pseudogap-like features close to the point appearing in the nearly metallic 15% Rh-doped Sr2IrO4 strongly depend on experimental conditions. We reveal that there is nevertheless an energy scale of 30meV below which spectral weight is suppressed, independent of the experimental conditions, which gives a reliable basis to analyze this behavior. We suggest it is caused by disorder.
I Introduction
Most Mott insulating oxides display orbital degrees of freedom beyond a non-degenerate half-filled single-orbital model Imada et al. (1998); Maekawa et al. (2004). These degrees of freedom complicate the analysis, as they open the possibility of various types of orbital orderings. Even in a seemingly classical example of a Mott insulator such as V2O3, the orbital occupations change at the metal-insulator transitionPark et al. (2000); Poteryaev et al. (2007). In layered perovskites, like ruthenates, there are three partially filled t2g orbitals, creating a hidden one-dimensional character despite the tetragonal structure. Namely, chains of dxz orbitals run along kx (and respectively dyz chains along ky), which may trigger nesting instabilitiesSidis et al. (1999). An exception are cuprates, where a half-filled d band at the Fermi level describes the electronic structure quite well. Recently, Sr2IrO4 has become another possible example, because the spin-orbit coupling quite efficiently splits the three t2g bands into a half-filled non-degenerate band and two filled bandsKim et al. (2008); Martins et al. (2011), called hereafter J1/2 and J3/2. The geometry of the J1/2 band is rather unusual, with strongly entangled spin and orbital characters.
| (1) |
where is the spin and mJ the pseudospin. This J1/2 character was confirmed experimentally Kim et al. (2009); Bogdanov et al. (2015). Sr2IrO4 thus realizes new low-energy Hamiltonians which may exhibit new forms of magnetic ordering (see for instance Ref. Jackeli and Khaliullin, 2009).
In this paper, we use angle-resolved photoemission spectroscopy (ARPES) to check directly the orbital character of the bands approaching the Fermi level in Sr2IrO4. This is possible thanks to selection rules associated to the light polarization, which modulate the intensity of the bands, depending on their symmetry with respect to mirror planes of the structure Damascelli et al. (2003). We uncover a strong polarization dependence of the ARPES intensity, which seems counter-intuitive at first, as J1/2 has a very isotropic shape by construction. We explain through explicit density functional theory (DFT) calculations that a J1/2 band on the Sr2IrO4 lattice should indeed exhibit a well defined -dependence of the orbital character that is in very good agreement with our findings. This “hidden” orbital degree of freedom is often forgotten and places Sr2IrO4 at an intermediate situation, between cuprates and ruthenates. It could play a role in subtle symmetry breakings reported in iridates, either a time-reversal symmetry breaking in pure Sr2IrO4 Jeong et al. (2017); Zhao et al. (2015) or density waves in doped compounds Chen et al. (2018); Chu et al. (2017). We carefully take into account these intensity modulations to discuss possible intrinsic changes in the dispersion along equivalent directions of the Brillouin Zone (BZ), both for the pure and Rh-doped Sr2IrO4. We conclude that they are identical within at least 50 meV.
The possible role of hidden orders in the formation of pseudogaps has been much discussed, especially in the case of cuprates Norman and Pépin (2003). In iridates, two different kinds of pseudogaps have been reported. In electron doped systems, obtained by La de la Torre et al. (2015) or surface Kim et al. (2014) doping, the Fermi surface emerges from the M point (equivalent to the nodal point in cuprates), which may mean there is a pseudogap at the X point, similar to hole-doped cuprates. Theoretical calculations have discussed the possible emergence of a pseudogap due to strong antiferromagnetic fluctuations Martins et al. (2018); Moutenet et al. (2018). In hole-doped iridates, which can be obtained by Ir/Rh substitutions Clancy et al. (2014), the Fermi surface emerges around the X points Cao et al. (2016); Louat et al. (2018). A -dependent pseudogap was first reported Cao et al. (2016), implying some type of undefined symmetry breaking. In contrast, we have found a pseudogap over the entire Fermi surface (FS)Louat et al. (2018), rather suggesting that it is a characteristic of the metallic state itself.In this paper, we clarify that the pseudogap-like features strongly depend on the experimental conditions, especially on polarization. This very likely explains the different conclusion of references Cao et al., 2016 and Louat et al., 2018 . We further show that at the X point spectral weight from unoccupied states leaks in and causes a leading edge in the electron distribution curve (EDC) at meV, which is independent of the experimental conditions. This finally gives a solid basis to analyze the pseudogap-like behavior in this particular case.
To compare dispersions and lineshapes between theory and experiment, we use an oriented cluster extension of dynamical mean-field theory (DMFT)Martins et al. (2018). This technique has recently been applied successfully for pure and electron-doped Sr2IrO4 Martins et al. (2018); Lenz et al. (2019). We present here results for the hole doped case, which simulates Rh doping. The Fermi surface and dispersions of all bands are in remarkable agreement with ARPES experiments. We do not find a pseudogap on the hole pockets, but intensity does extend to the X point. We then suggest that the pseudogap-like feature is associated with disorder due to in-plane Rh substitutions, which is not taken into account in the calculations.
II Orbital character in Sr2IrO4
II.1 Polarization dependent ARPES measurements
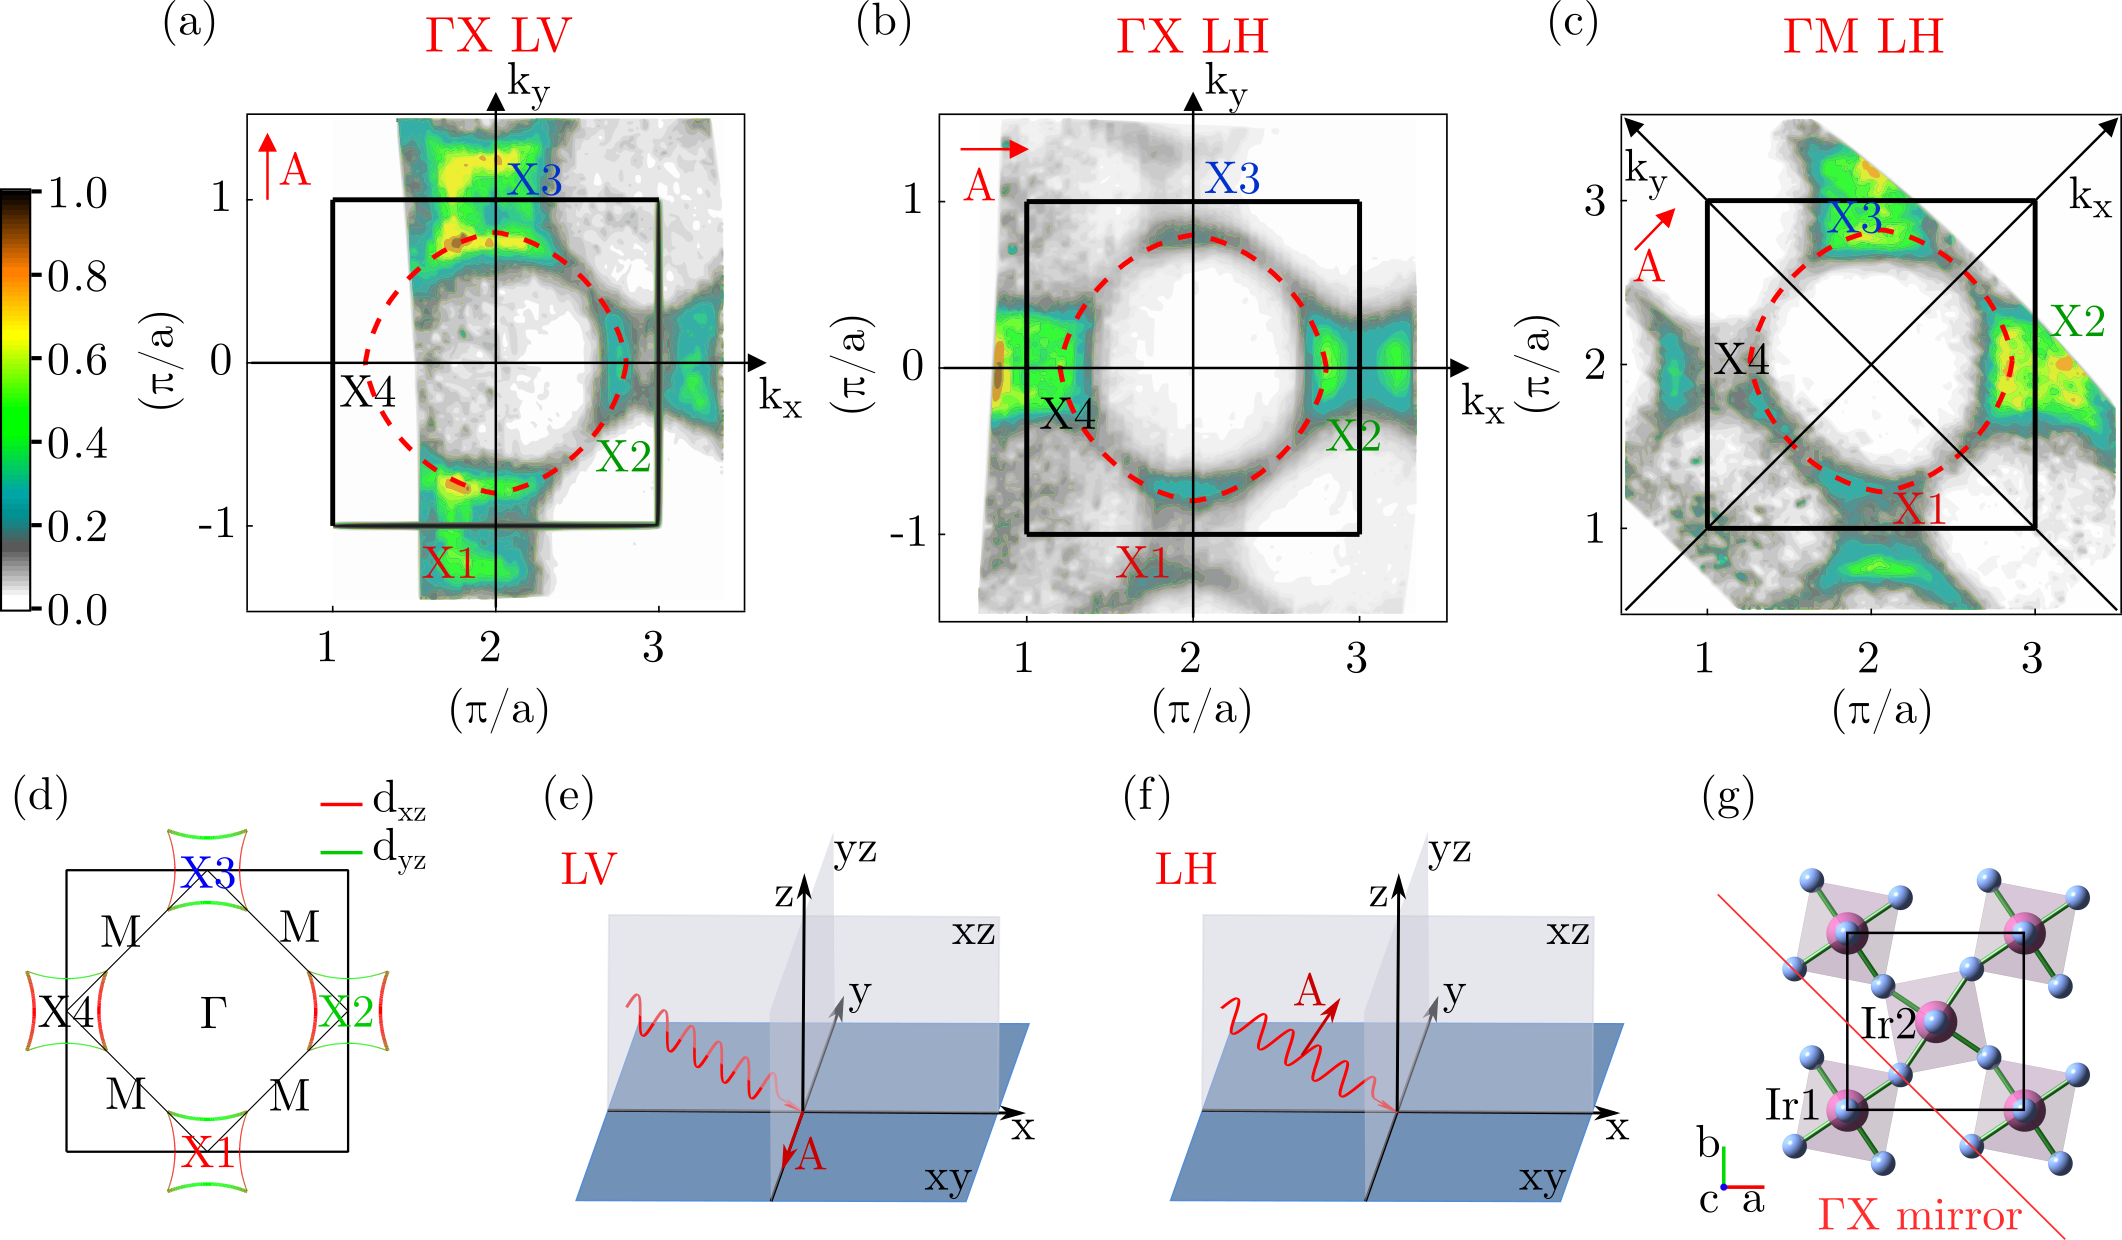
Fig. 1 (a-c) displays Fermi surfaces measured at 50K in Sr2IrO4 doped with 15% Rh, at 100eV photon energy, with different polarization and orientation. The intensity modulations we are going to describe are however common to all dopings of Sr2IrO4. The intensity at X is due to the J1/2 band and is found stronger for X points along in (a), along in (b) and along the diagonal in (c), where the sample is rotated by 45∘. Obviously, different polarizations “favor” different X points, which implies a symmetry breaking that is not immediately expected from the equation given above for J1/2.
Well known selection rulesDamascelli et al. (2003) state that orbitals odd (resp. even) with respect to a mirror plane will be detected with polarization odd (resp. even) with respect to that plane. The geometry of our experiment is sketched at the bottom of the figure. The light polarization A lies along the axis in linear vertical (LV) polarization and within the plane in linear horizontal (LH) polarization (these sketches correspond to normal emission (kx=0), the angle of A to the sample surface will change for higher kx, see supplementary sup ). In LV, A is odd/ and even/, so that orbitals odd/ are expected to be detected along and orbitals even/ along . The strong difference in intensities along and strongly suggests that we have bands even/ along (favorable case) and even/ along (unfavorable case). This is the case for dyz (even/) and dxz (even/), respectively. On the other hand, for LH, A is even/, while both components are present with respect to sup . While the interpretation of this situation is not as straightforward, the fact that the strongest intensity is now along kx confirms that an orbital even/kx dominates in this direction.
We also observe a strong variation of intensity as a function of (more than a factor 10 between =1 and =3), indicating that the cross section increases when A is almost perpendicular to the surface (towards grazing incidence). This means that the orbitals at X must have a strong out of plane component, which is the case for dxz or dyz.
If we now turn the sample by 45∘, the selection rules apply with respect to the plane containing the diagonal of the unit cell (M) and the sample normal (this is not a true mirror plane, because of the oxygen positions). There is no difference anymore between the spots along and , as expected for dxz and dyz which are equivalent with respect to this diagonal plane.
II.2 Calculated orbital weights within DFT
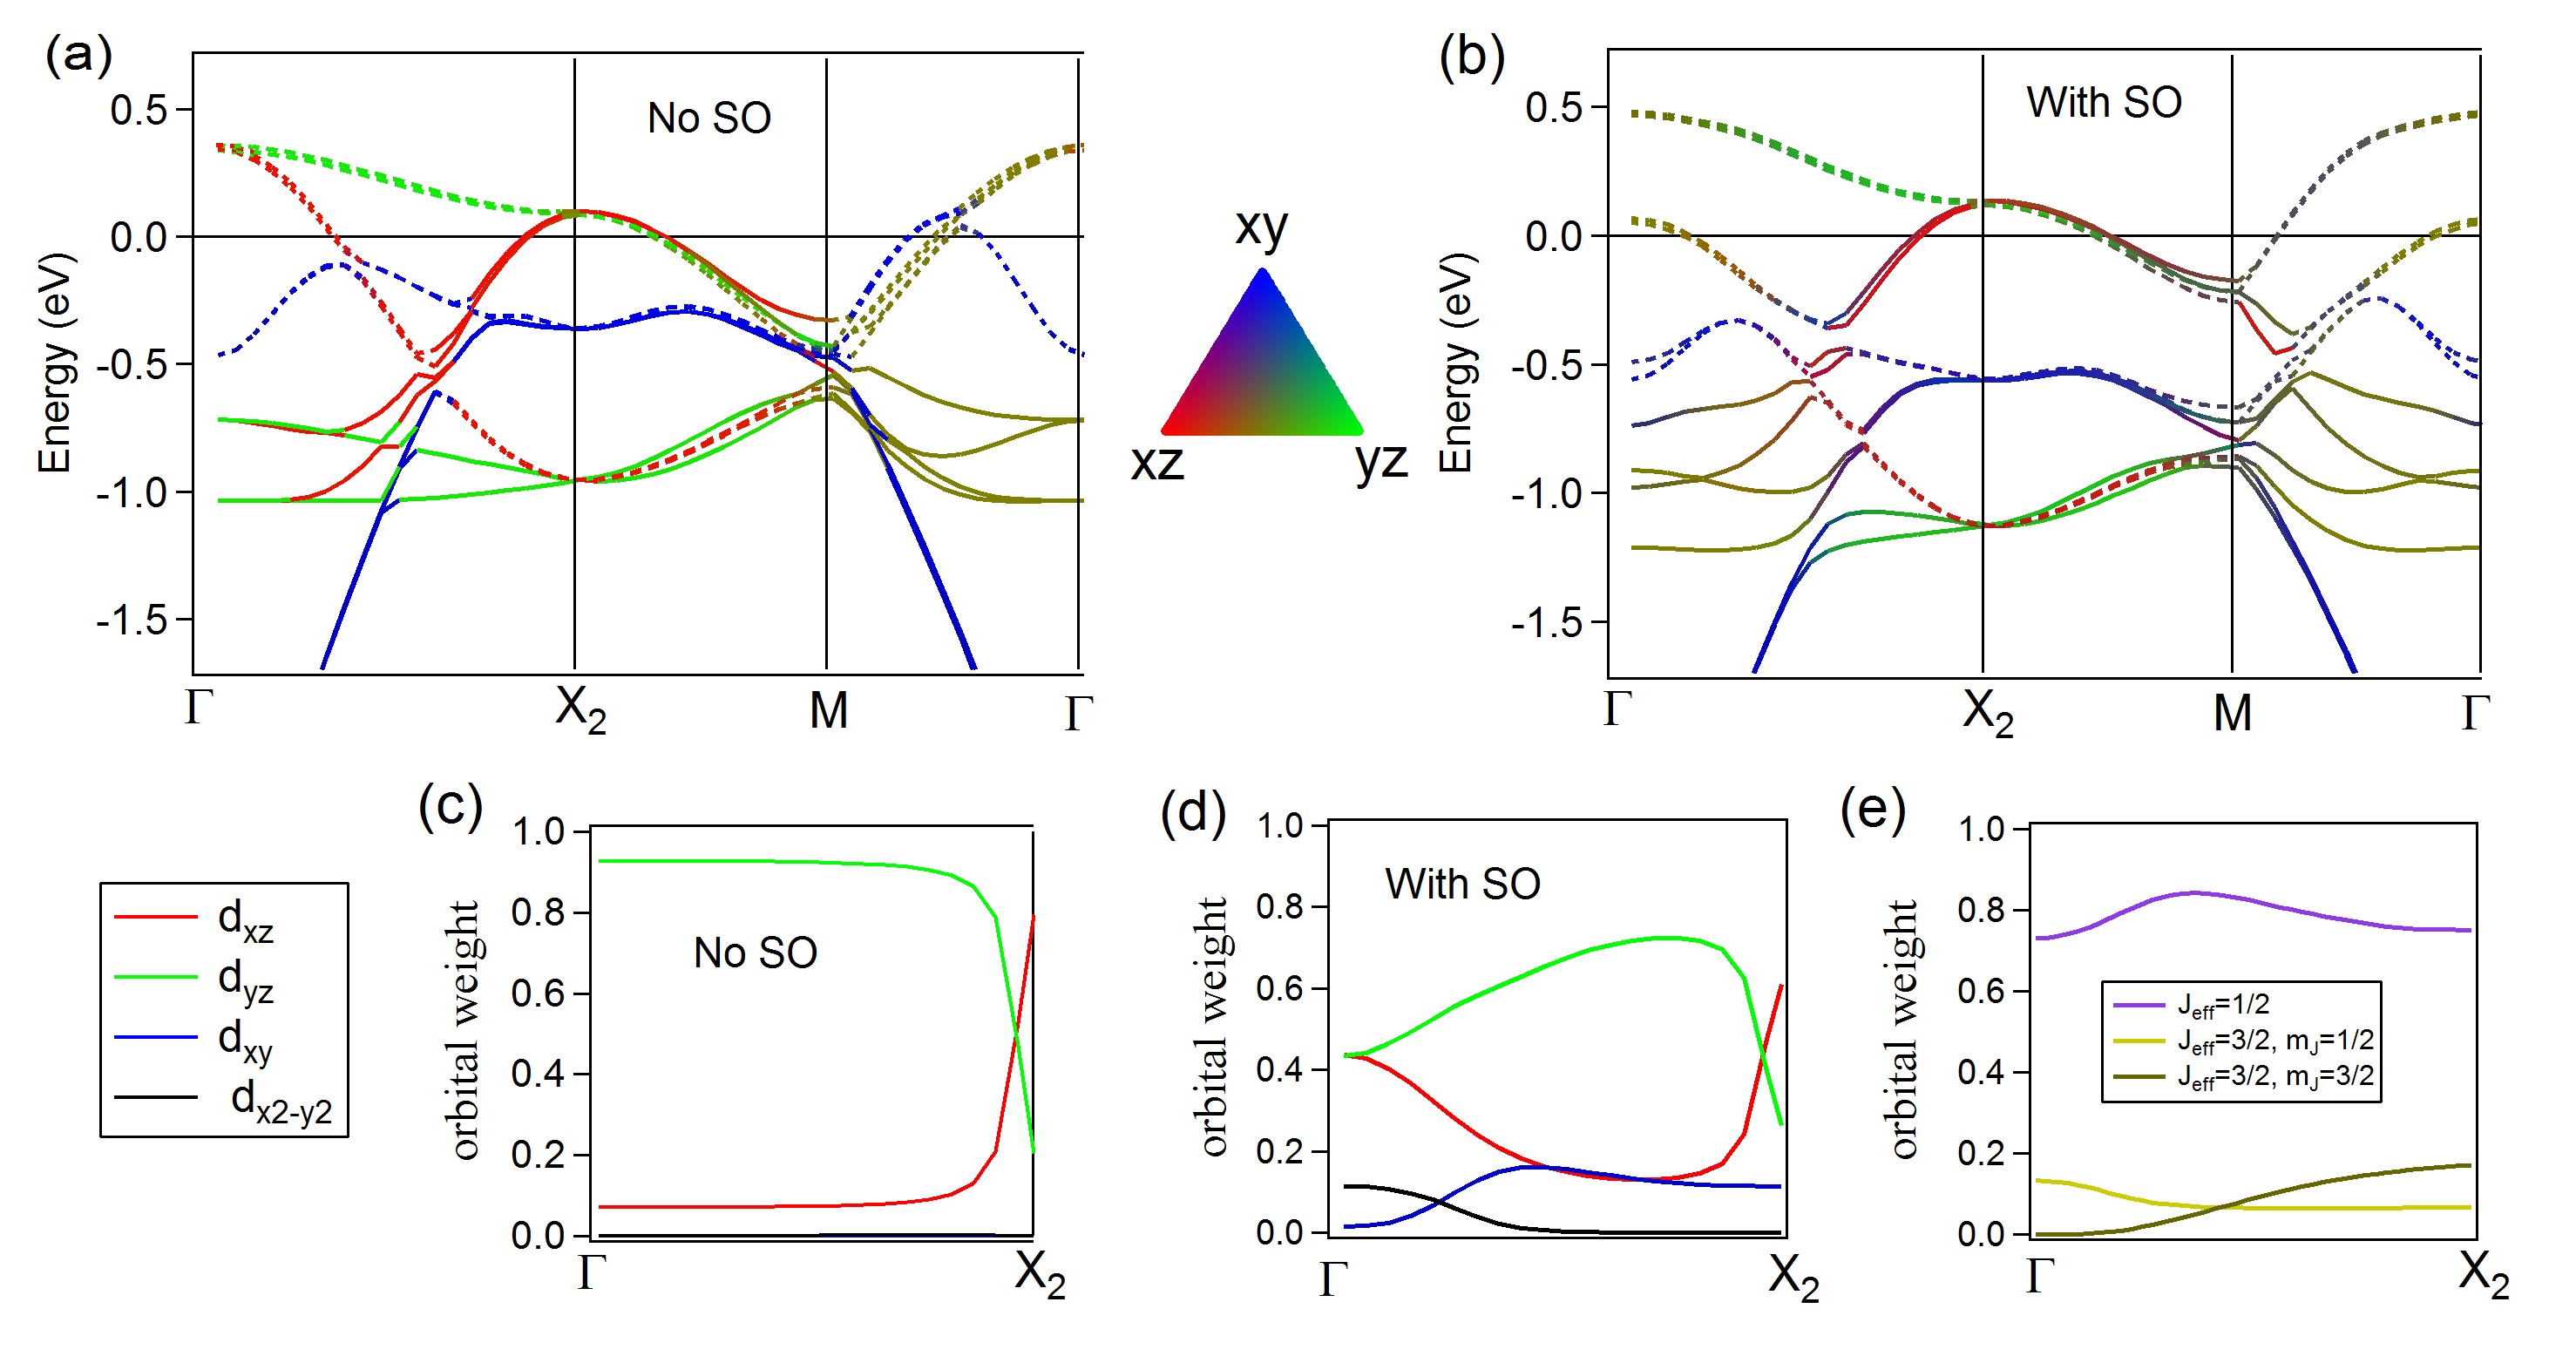
To understand the expected orbital characters observed around the X point, we calculate the -resolved spectral function and project it at each -point on the local Ir 5d-orbitals to get their orbital weights. In Fig. 2, we show the Kohn-Sham band structure of Sr2IrO4 calculated within the local density approximation (LDA)111To distinguish dxz and dyz orbitals easier, we introduced a small orthorombicity in the structure (space group then becomes Fddd (70) with lattice constants =7.775 Å, =7.776 Å). along X2M without spin-orbit coupling (SOC) in (a) and with SOC in (b). the calculation was performed using the WIEN2k softwareBlaha et al. (1999).We use as color scale the weight of each orbital dxz (red), dyz (green) and dxy (blue) obtained from this calculation and normalized by the total Ir weight. There is significant hybridization (nearly 50%) with oxygen, but this does not affect the band symmetry. There is also significant hybridization with d around Martins et al. (2017), that does not enter the color scale.
There are two sets of bands because of the 2 Ir per IrO2 plane (see Fig. 1), with the two Ir orbitals in-phase or out-of-phase sup . We call the first ones direct bands and write them (dxz, dyz, dxy) [solid lines in Fig. 2(a-b)], and the second ones folded bands (dxz*, dyz*, dxy*) [dotted lines in Fig. 2(a-b)]. The distinction between them is made simply by comparison to the bands of a non-distorted structure Martins et al. (2011). It is important to take this into account for ARPES measurements, as the two types of bands have opposite parities with respect to a X mirror plane sup and the folded bands have typically a much weaker intensity Voit et al. (2000). There is an additional doubling of the number of bands because of the two planes per unit cell, which gives a "bilayer splitting", which is usually small in Sr2IrO4 sup , but it is clearly visible for the bands near -1eV at for example.
In Fig. 2(c-e), we show explicitly the orbital character of the topmost band along X2. Without SOC, it is nearly of pure dyz character and meets a band of nearly pure dxz character near and X2. At these points, the orbital character cannot be individually defined since the bands are degenerate. The SOC mixes the orbital characters [Fig. 2(d)] and the colors of Fig. 2(b) are indeed not as clear as in (a), but they are still dominated by one component in many places. One actually obtains a doublet of J1/2 character, as defined in Eq.(1), and a degenerate quartet of J3/2 character, only when the SOC acts on three degenerate states. While the three t2g orbitals are nearly degenerate in Sr2IrO4 at the atomic level Bogdanov et al. (2015), this is not the case for the Bloch states at a given point. For instance, at the point, the bands of character dxz* and dyz* are degenerate at 0.3eV, but the dxy* band is much lower around -0.5eV. Consequently, the character of the topmost band is mixed between dxz and dyz, with an admixture of only 10% dxy/d instead of 33% expected for a "standard" J1/2 state. The situation is slightly different at X2 since the dyz* band lies near the Fermi level while the energy of dxz* band is circa -1.0eV. As a result, the character expected near X2 along kx is now 70% dyz* for the topmost band. Note that the SOC acts only between bands of same nature (direct or folded) and is ineffective between direct and folded bands. Therefore, it does not lift the degeneracy between the bands of dxz/ and dyz* character. As the situation is reversed near X3 along ky (where the topmost band is of 70% dxz* character), the character of the whole band is in average over the Brillouin Zone essentially J1/2 but at most of the -points, and notably at the X points, the character may be far from the standard (1/3,1/3,1/3) decomposition. This is confirmed in Fig 2(e) where we plot the orbital character of the topmost band along X2 with respect to the J1/2 and J3/2 basis. The topmost band is on average composed of 80% of J1/2 character and of 20% of J3/2 character along this direction, which is in good agreement with the decomposition given in Ref. Jin et al., 2009.
The ARPES observation that a well-defined orbital character persists at X (also used recently in ref. Zwartsenberg et al., 2019) is then in agreement with the calculation. Introducing correlations beyond DFT will modify slightly the relative ratio of the decomposition at each -point. First, correlations enhance the spin-orbit polarizationLiu et al. (2008); Zhou et al. (2017), which brings the J3/2 band at below the Fermi level. Second, they open a gap at X in Sr2IrO4 to form an insulator.
III Comparison to DMFT calculations
We now compare our data to a dynamical mean-field theory (DMFT) calculation, which captures both the gap opening and the correct position of J3/2 compared to J1/2. In Fig. 3, we show a calculation for the hole doped case in which within the J1/2 band the hole density is . To treat the J1/2 band within the calculation, we use an oriented cluster extension of DMFT, which has recently been applied successfully for pure and electron-doped Sr2IrO4 Martins et al. (2018); Lenz et al. (2019). Going beyond single-site DMFT by including spatial fluctuations to treat the J1/2 band is essential to obtain a correct spectrum in the paramagnetic phase. The J1/2 spectrum is then supplemented by the DMFT spectrum of the J3/2 manifold. This assumes that the J3/2 spectrum does not change much upon hole doping due to its completely filled character, except for an additional energy shift due to the change in chemical potential. We use an effective on-site Coulomb interaction of eV as in the electron-doped case discussed in Ref. Martins et al., 2018.
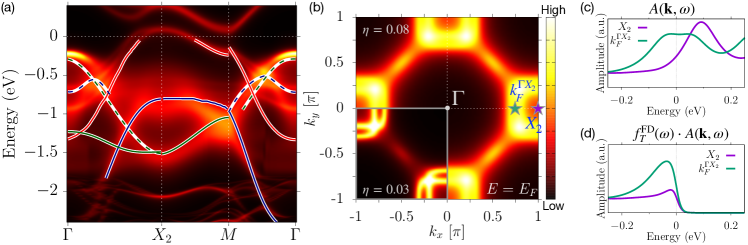
We have used different polarizations and geometries to measure all Ir bands of Rh-doped Sr2IrO4 from -2eV to the Fermi level EF sup . The experimental dispersions (solid lines) are overlayed in Fig. 3(a) onto the calculated spectral function. They compare well, in particular the J3/2 bands and the J1/2 band features close to the Fermi level are well captured. Deviations seem to occur at the bottom of the J1/2 band, which is higher in the calculation. Comparing to the original DFT calculation shows that this is not due to a renormalization of J1/2 induced by correlation. The problem is probably due to an inaccurate extraction of the experimental dispersion in this region, where two bands overlap sup .
Comparing the calculated Fermi surface in Fig. 3(b) to the experimentally observed spectrum (Fig. 1) shows good agreement and motivates a detailed investigation of the spectrum. In the following we focus on the spectrum at the high symmetry point , as well as at the Fermi vector along the path . Within the calculation, we have to choose a broadening of the spectral function. A value of leads to good agreement with experiment, but hides some of the FS features that become apparent at small broadening only. There, as in the electron-doped caseMartins et al. (2018), the Fermi surface is composed of two sheets due to the two different directions of antiferromagnetic fluctuations that are included via our cluster treatment.
As can be seen in the top panel of Fig. 3(c), the spectral function at has a peak above , as expected for a hole pocket around X. In the bottom panel of Fig. 3(c), we simulate the energy distribution curve (EDC) signal based on this data via , where denotes the Fermi-Dirac function. The low energy tail of the spectrum gives the impression of a tiny peak at after multiplying with . The spectrum is quite different at the Fermi energy for . For the realistic broadening used in our calculation, the spectrum is relatively flat around , see top panel of Fig. 3(c), but it has an underlying two-peak structure. After multiplying with the Fermi-Dirac distribution, the curve at shows a peak close to , but below. This should not be confused with a pseudogap, as the leading edge of the spectra (used experimentally to define the pseudogapsup ) is still defined by the Fermi edge.
IV Impact of the intensity modulations on the ARPES lineshapes
The polarization dependence of the ARPES intensity we have described is not only important to better understand the orbital structure of J1/2, but also because it strongly affects the intensity of the spectra and sometimes their shape. We will show that it is particularly important to take this into account to analyze pseudogap-like features around the point.
IV.1 Comparison of the dispersions along kx and ky
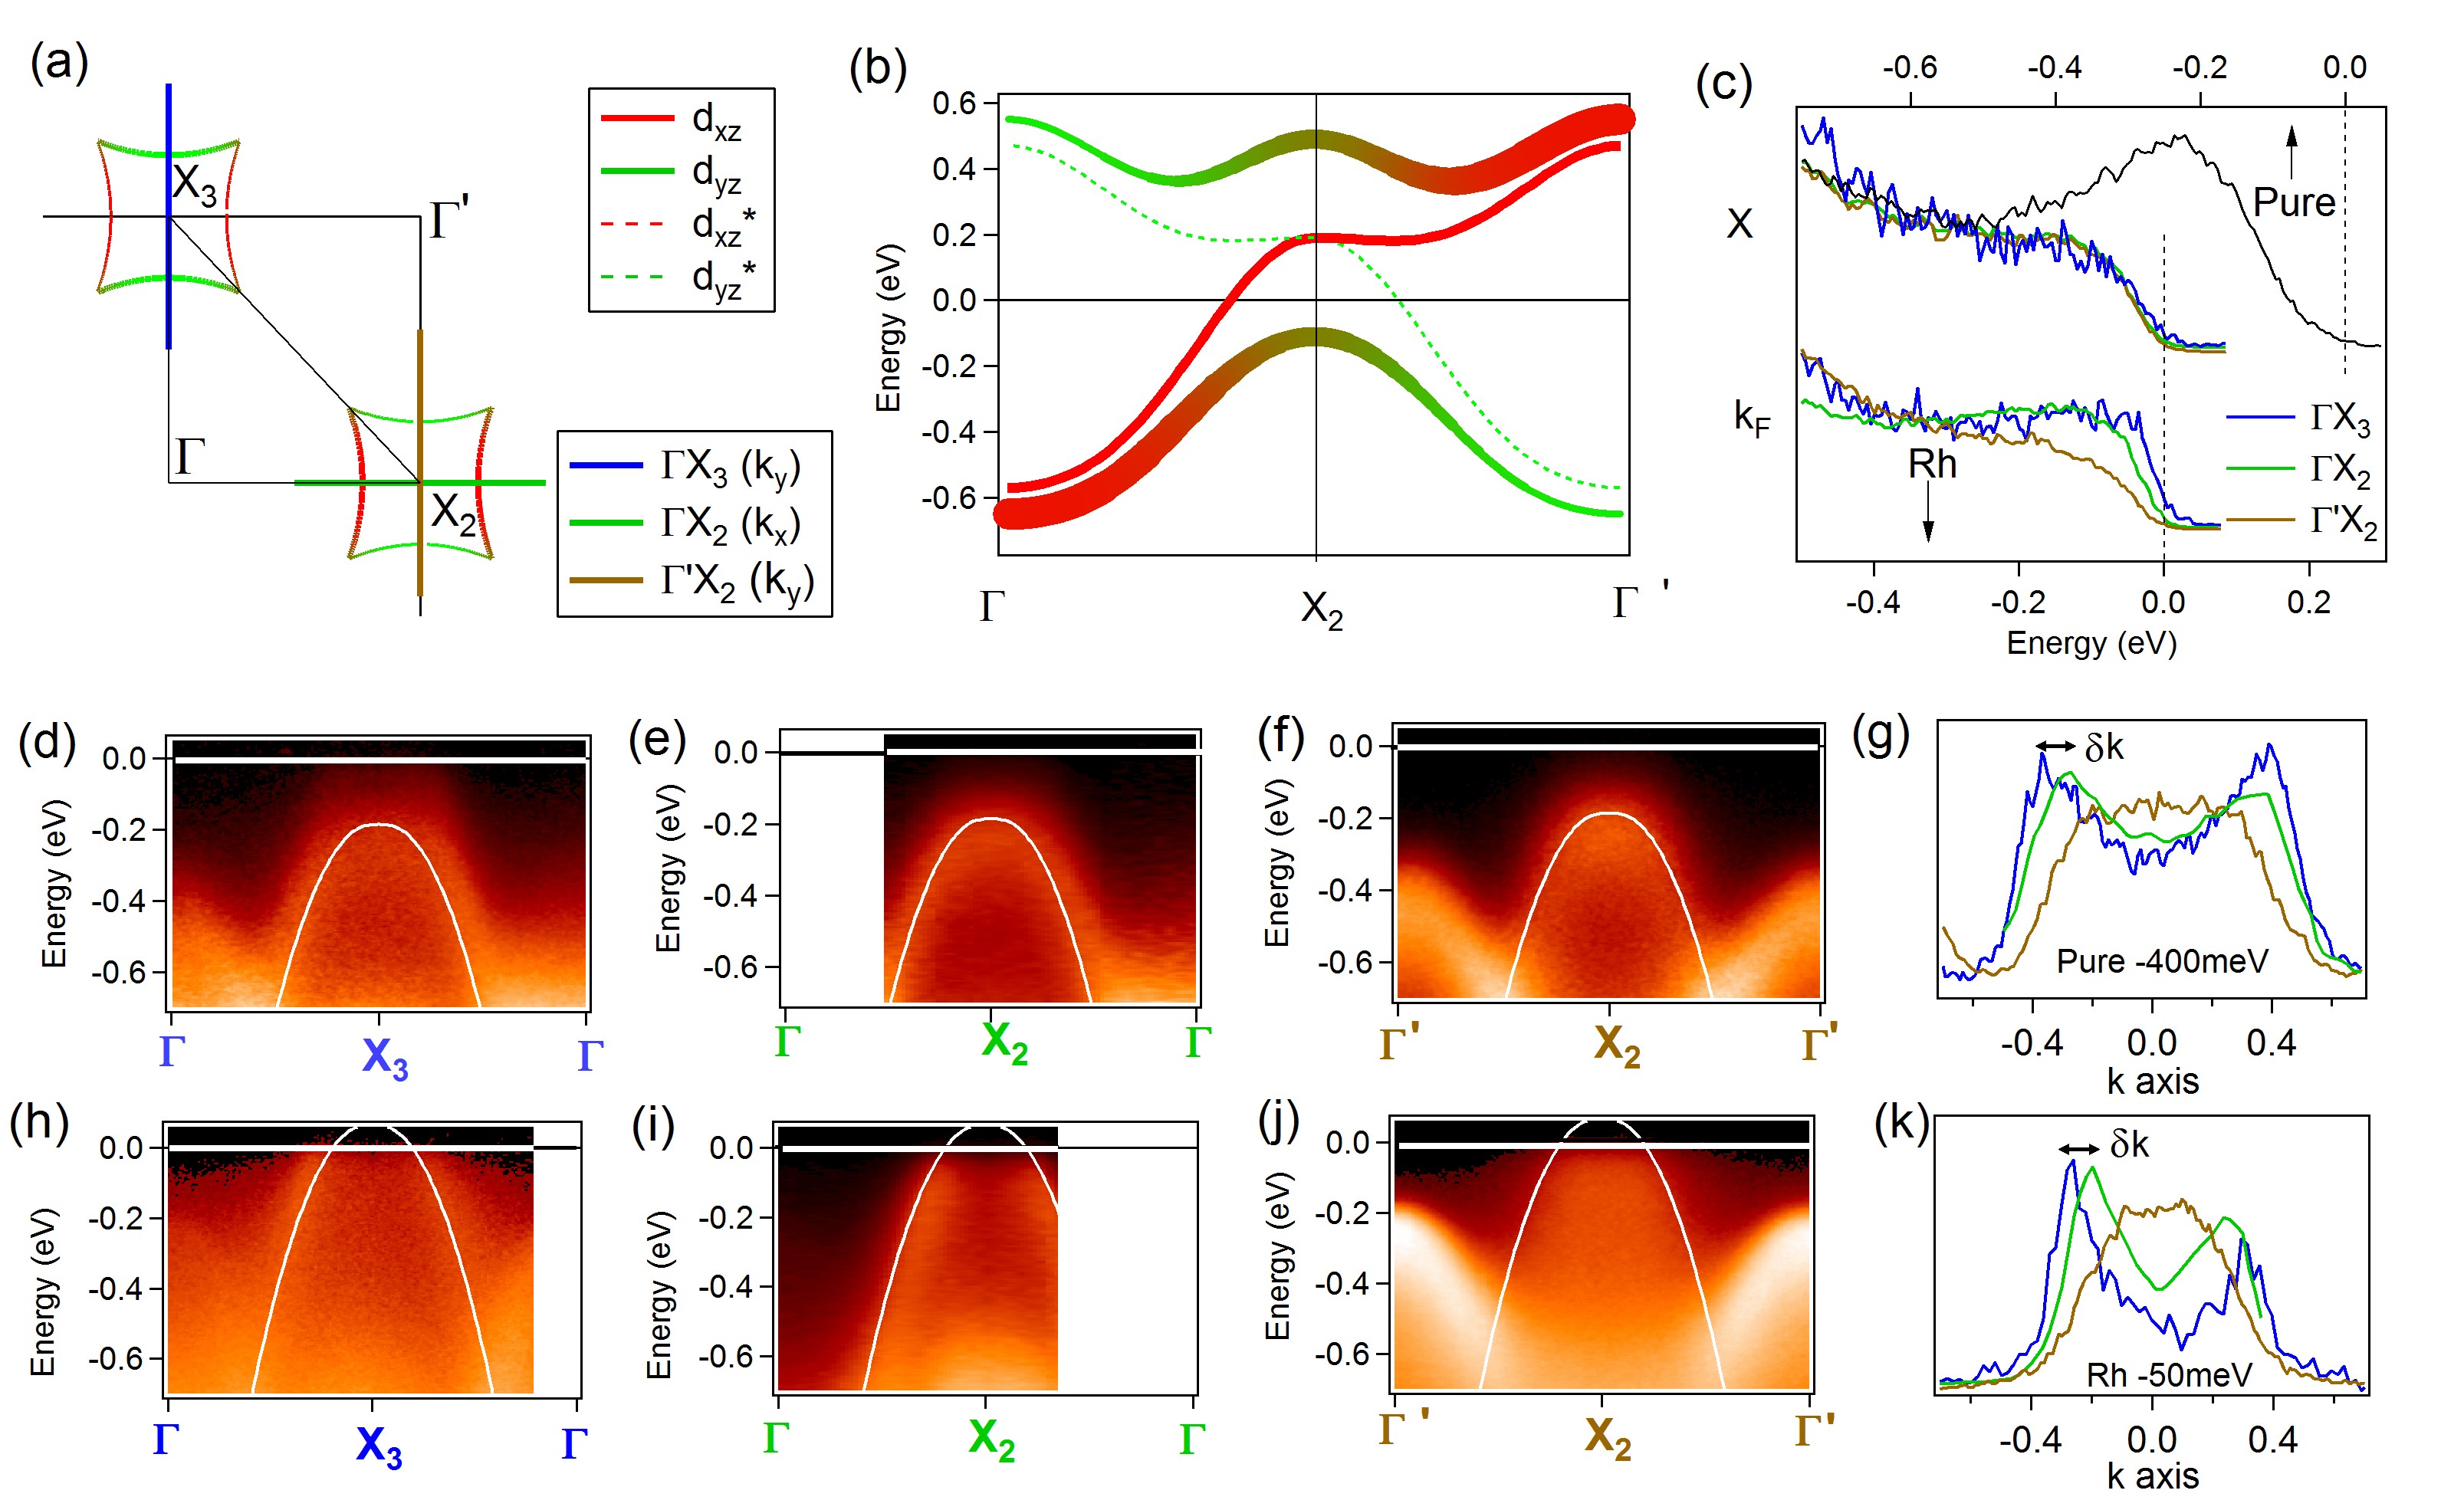
Figure 4(b) sketches the spectral function with its intensity modulations along the path. First, the dominant orbital along will be dxz, which have very different intensity in most experimental conditions compared to dyz along (see intensity modulations in Fig. 1). Second, this dominantly dxz band joins at X2 with a dominantly dyz* band. These two bands are even with respect to the X mirror planesup , so that they should have similar intensity under the same polarization, but the intensity of the dyz* band is intrinsically much weaker due to its folded characterVoit et al. (2000). When the gap opens at X2, both the dxz/dyz* and direct/folded characters get mixed. The expected modulation of intensity along is illustrated by the size of the markers.
In the bottom part of Fig. 4, we compare the dispersion along three different X paths for pure Sr2IrO4 [Fig. 4(d-f)] and Rh-doped Sr2IrO4 [Fig. 4(h-j)]. The distribution of intensity is very different along X3 (d) and X2 (f), for example, which follows well the expectations of Fig. 4(b). The intensity concentrates on the direct band, i.e. on the sides of the dispersion for (d) and at the center for (f). In Fig. 4(e), the intensity is more equally distributed between the center and the sides, which is not expected from the direct/folded difference alone [(d) and (e) should be equivalent in that respect] and could be due to the contribution of dxy or imperfect selection rules. This nevertheless validates the existence of strong intensity variations near X.
Besides these intensity variations, the dispersions themselves look different at first sight. They seem to extend closer to EF in (d) and (h). For the Rh case, it even looks as if there was no gap along (h) and a real gap along (i). Indeed, their leading edges at [see Fig 4(c)] are quite different, with an onset at larger energies for X2 (35meV) than for X3 (12meV). This could indicate a charge-density-wave-like gap opening along kx and questions the equivalence of kx and ky. To compare the dispersions more precisely, we overlay the same white curve over all images, just shifted up by 0.25eV for the Rh case, which is the estimated difference in chemical potential between the pure and the Rh-doped sampleBrouet et al. (2015). It is quite clear that the intensity is slightly outside this curve in (d) and (h) and inside in (e) and (f), suggesting again a truly different dispersion. This is illustrated more quantitatively by the momentum distribution curve (MDC) spectra taken at -0.4eV for the pure case [Fig. 4(g)] and -0.05eV for the Rh case [Fig. 4(k)]. In both cases, the peaks are found at slightly different positions along kx and ky with k=0.06*X. The dispersion through ky along ’X2 looks however even more different, with peaks shifted towards X. This implies that a difference between kx and ky would not be a sufficient explanation.
Two types of origins can be considered to explain such differences. It could be intrinsic due to a real splitting of the dispersion. As different experimental conditions may pick up different contributions of the two bands, this would lead to different peak positions. This splitting could be due to 1D fluctuations, as in the oriented cluster DMFT calculation described before, or other types of order, as the d-wave spin-orbit density wave Zhou et al. (2017). The energy shift of the white curve needed to produce the observed splitting in momentum is of the order of 50meV. Alternatively, or additionnally, there could be an extrinsic contribution due to the intensity modulations. Such modulation may distort the lineshapes by giving different importance to contributions coming from different points. As we know that there is indeed a strong intensity modulation around X, we give particular attention to this point.
The most striking feature of the MDC in Fig. 4(g) and (k) is actually that they are very asymmetric, distorted towards the center. Although a lorentzian is normally expected for a MDC curveDamascelli et al. (2003), it is quite commonly distorted towards the occupied side of the band Brouet et al. (2012). This can be understood as due to the integration of the tails of all EDC located at neighboring occupied points. We show in supplementary that the change in intensity as a function of described before can indeed satisfyingly explain the different shapes of MDC observed for the pure case. As the simulation depends both on the intrinsic shape of the spectral function (its width as a function of for example, which is a priori unknown) and on the details of the extrinsic variation of intensity, we cannot simulate quantitatively the spectra. Therefore, we cannot exclude an intrinsic variation of the dispersion coexisting with this extrinsic modulation, with an upper bound of 50meV, however. This is not negligible, but the broad linewidths (0.23eV for the pure case shown in Fig. 4(c) for example) do not allow to refine this further. On the other hand, this is already incompatible with the splitting of 0.2eV at X considered by Ref. Zhou et al., 2017 as a sign of d-wave spin-orbit density wave order. We note that such a splitting was also unclear in the raw data of Ref. de la Torre et al., 2015 and may be an artifact of the fitting procedure used in this paper.
The case of Rh is more tricky as the band is now above the Fermi level at X and one would not expect a strong contribution to the lineshape from this unoccupied part. However, just like there is a remaining intensity at X coming from the tail of the spectra above EF in our calculation in Fig. 3(c), there could be a sizable contribution in this case. Comparing with the spectra of the pure compound shifted up to the expected position for Rh (i.e. by 0.25eV, like the white dispersion) indeed suggests that some intensity can be expected at X. In this case, modulation of the relative intensity at and at X could affect the lineshape and possibly change the leading edge shape. We now take a closer look at this point.
IV.2 Addressing the question of the pseudogap in Rh-doped Sr2IrO4
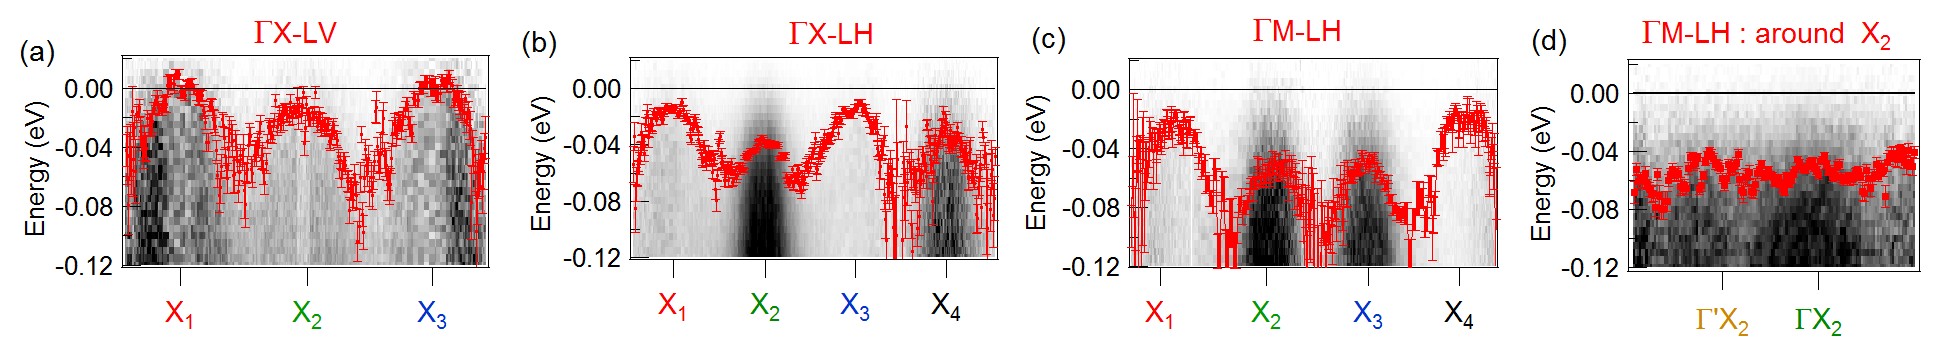
A pseudogap is usually defined as the position of the leading edge of the spectra closest to in one particular direction. In Fig. 1, we indicate by the dotted red circle the points of such spectra and, in Fig. 5 (a-c), we build images with spectra taken along this contour. The full EDC spectra for the different X directions are presented in supplementary. The leading edge is indicated by a cross. Values ranging from nearly zero to 60meV are found. It is clear that they are not associated to the different X points, but to the experimental conditions, as they change at a given X point for different experimental conditions. The tendency is to measure a larger pseudogap when the intensity is higher, wherever it occurs in -space. Further analysis is clearly needed to understand what should be called a pseudogap in this case.
The ARPES study of Ref. Cao et al., 2016 concluded that the pseudogap was different on the “direct” and “folded” parts of the Fermi Surfaces, forming “Fermi arcs” instead of hole pockets around X [see Fig. 1(d)]. This point is quite important to check, as it would completely change the FS topology. We note that the equivalence between the two sheets is dictated by periodicity of the 2 Ir unit cell itself, so that this proposal is quite puzzling. In Fig. 5(d), we track the position of the leading edge along the hole pocket at X2 in the M-LH FS. We choose this case because the two sides have relatively similar intensities in this geometry. The leading edges of the spectra in Fig.5(d) are remarkably constant around -60meV. This rules out a specific pseudogap on the folded FS compared to the direct one. The different pseudogaps measured by Ref. Cao et al., 2016 are more likely due to different intensities on the two sheets in their measurement conditions, as for X2 and X2 in Fig. 4(c).
Interestingly, all spectra show the same leading edge at X [Fig. 4(c)], despite the very different absolute intensities (more examples are given in supplementary sup ). However, their onset is located around -30meV from , which is unexpected and anomalous for a metal. This defines a new energy scale to characterize this pseudogap-like behavior, independently of experimental conditions. As there are equal contributions of dxz/dyz and direct/folded bands at X, it indeed makes sense that this measurement is less sensitive to the experimental conditions. On the contrary, the leading edge value measured at is directly related to the relative intensity between X and . From our previous study of the pure case, we have seen that the relative intensity at X is strongest along ’X2, then X2 and finally X3. This explains perfectly the trend of a larger leading edges onsets along ’X2 (45meV), then X2 (35meV) and finally X3 (12meV).
This shifts the discussion from the pseudogap-like feature to the meaning of this new energy scale at X. The intensity around X is incoherent, in the sense that there is no quasiparticle (QP) peak that could be defined anywhere with a width smaller than its binding energy. In the case of Rh, the disorder may enhance scattering between different values. This would naturally explain why our calculations, which do not include any disorder effects, do not reproduce the experimentally observed leading edge position of the EDC at a non-zero binding energy.
V Conclusion
Using polarization-dependent ARPES, we have directly determined the orbital character of the bands in Sr2IrO4. Despite the band dispersion being well described by the J1/2 picture, the band closest to the Fermi level has - at a given point - well-defined orbital character in terms of cubic harmonics. This is in line with ab initio calculations and attaches great importance to anisotropies and orbital degrees of freedom. From a conceptual point of view this observation has an interesting consequence: the coefficients of an expansion of the J1/2 Wannier orbital in terms of cubic harmonics aquire -dependence. This prevents the corresponding band from being spanned by a simple tight binding model with atomic J1/2 orbitals. It is rather reminiscent of the Zhang-Rice construction in cuprate systems Zhang and Rice (1988), where the Wannier orbital of dominant character is obtained as a superposition including and orbitals with -dependent coefficients.
In the ARPES experiment, the -dependent orbital variations give rise to strong matrix element effects that modulate the intensities. Because of the -dependence of the J1/2 Wannier orbital itself the assumption of slowly varying matrix elements breaks down. In addition, the presence of two transition metal atoms per unit cell, which is a rather common situation, imposes strong selection rules. As a consequence, dispersions measured in equivalent directions of the Brillouin zone sometimes appear different. We considered both intrinsic (e.g. symmetry breakings) and extrinsic (e.g. matrix elements) origins for these differences. Although we cannot exclude the former, with an upper bound of 50meV to shifts or splittings that could be present in the electronic structure, we show that the strong modulation of ARPES intensity by matrix elements observed here is already able to explain most of these differences.
In Rh-doped Sr2IrO4, we show that the leading edge of the spectra detected throughout the FS, commonly used to define a pseudogap, strongly depends on the experimental conditions. However, at the center of the hole pocket - a point which is not part of the Fermi surface - spectral weight is observed with a leading edge of meV, independently of experimental conditions. This establishes a new energy scale defining this highly anomalous metallic state.
We have performed theoretical calculations within the recently developed oriented cluster dynamical mean-field scheme, which was already applied to electron doped Sr2IrO4. Here, we show that it also provides a good description of the dispersion of hole-doped Sr2IrO4. We provide a detailed comparison between the polarized ARPES measurements and the calculated spectral function. In theory, the leading edge at the Fermi surface does not show a depletion of spectral weight. We speculate that disorder effects, associated with Rh substitutions, are responsible for creating the spectral weight at X and the pseudogap-like feature. Rh-doped Sr2IrO4 appears as an interesting example of disordered correlated metal that deserves further studies.
More generally, our study indicates ways to better characterize pseudogap-like features with ARPES. Depressions of spectral weight at have indeed been observed in many correlated systems. Besides the famous example of cuprates, one dimensional systems Grioni et al. (2009), aperiodic crystals Brouet et al. (2013), “bad metals” like manganites, nickelates and others Naamneh et al. (2018) all tend to show a depression of intensity at the Fermi level. It is likely that all these behaviors do not have the same meaning and significance, but more precise definitions are lacking. A common feature of these situations is to exhibit broad lineshapes in energy and momentum. We emphasize in our study that this makes them sensitive to rapid intensity modulations and that non-lorentzian MDC lineshapes are a signature of such a situation. In this case, the simple estimation of the pseudogap by the leading edge value becomes insufficient and a full study of the intensity distribution is necessary.
References
- Imada et al. (1998) M. Imada, A. Fujimori, and Y. Tokura, Rev. Mod. Phys. 70, 1039 (1998).
- Maekawa et al. (2004) S. Maekawa, T. Tohyama, S. E. Barnes, S. Ishihara, W. Koshibae, and G. Khaliullin, Physics of Transition Metal Oxides (Springer, Berlin, Heidelberg, 2004).
- Park et al. (2000) J.-H. Park, L. H. Tjeng, A. Tanaka, J. W. Allen, C. T. Chen, P. Metcalf, J. M. Honig, F. M. F. de Groot, and G. A. Sawatzky, Phys. Rev. B 61, 11506 (2000).
- Poteryaev et al. (2007) A. I. Poteryaev, J. M. Tomczak, S. Biermann, A. Georges, A. I. Lichtenstein, A. N. Rubtsov, T. Saha-Dasgupta, and O. K. Andersen, Phys. Rev. B 76, 085127 (2007).
- Sidis et al. (1999) Y. Sidis, M. Braden, P. Bourges, B. Hennion, S. NishiZaki, Y. Maeno, and Y. Mori, Phys. Rev. Lett. 83, 3320 (1999).
- Kim et al. (2008) B. J. Kim, H. Jin, S. J. Moon, J.-Y. Kim, B.-G. Park, C. S. Leem, J. Yu, T. W. Noh, C. Kim, S.-J. Oh, J.-H. Park, V. Durairaj, G. Cao, and E. Rotenberg, Phys. Rev. Lett. 101, 076402 (2008).
- Martins et al. (2011) C. Martins, M. Aichhorn, L. Vaugier, and S. Biermann, Phys. Rev. Lett. 107, 266404 (2011).
- Kim et al. (2009) B. J. Kim, H. Ohsumi, T. Komesu, S. Sakai, T. Morita, H. Takagi, and T. Arima, Science 323, 1329 (2009), http://science.sciencemag.org/content/323/5919/1329.full.pdf .
- Bogdanov et al. (2015) N. A. Bogdanov, V. M. Katukuri, J. Romhányi, V. Yushankhai, V. Kataev, B. Büchner, J. van den Brink, and L. Hozoi, Nature Communications 6, 7306 EP (2015).
- Jackeli and Khaliullin (2009) G. Jackeli and G. Khaliullin, Phys. Rev. Lett. 102, 017205 (2009).
- Damascelli et al. (2003) A. Damascelli, Z. Hussain, and Z.-X. Shen, Rev. Mod. Phys. 75, 473 (2003).
- Jeong et al. (2017) J. Jeong, Y. Sidis, A. Louat, V. Brouet, and P. Bourges, Nature Communications 8, 15119 EP (2017).
- Zhao et al. (2015) L. Zhao, D. H. Torchinsky, H. Chu, V. Ivanov, R. Lifshitz, R. Flint, T. Qi, G. Cao, and D. Hsieh, Nature Physics 12, 32 EP (2015).
- Chen et al. (2018) X. Chen, J. L. Schmehr, Z. Islam, Z. Porter, E. Zoghlin, K. Finkelstein, J. P. C. Ruff, and S. D. Wilson, Nature Communications 9, 103 (2018).
- Chu et al. (2017) H. Chu, L. Zhao, A. de la Torre, T. Hogan, S. D. Wilson, and D. Hsieh, Nature Materials 16, 200 EP (2017).
- Norman and Pépin (2003) M. R. Norman and C. Pépin, Reports on Progress in Physics 66, 1547 (2003).
- de la Torre et al. (2015) A. de la Torre, S. McKeown Walker, F. Y. Bruno, S. Riccó, Z. Wang, I. Gutierrez Lezama, G. Scheerer, G. Giriat, D. Jaccard, C. Berthod, T. K. Kim, M. Hoesch, E. C. Hunter, R. S. Perry, A. Tamai, and F. Baumberger, Physical Review Letters 115, 176402 (2015).
- Kim et al. (2014) Y. K. Kim, O. Krupin, J. D. Denlinger, A. Bostwick, E. Rotenberg, Q. Zhao, J. F. Mitchell, J. W. Allen, and B. J. Kim, Science 345, 187 (2014).
- Martins et al. (2018) C. Martins, B. Lenz, L. Perfetti, V. Brouet, F. Bertran, and S. Biermann, Phys. Rev. Materials 2, 032001 (2018).
- Moutenet et al. (2018) A. Moutenet, A. Georges, and M. Ferrero, Phys. Rev. B 97, 155109 (2018).
- Clancy et al. (2014) J. P. Clancy, A. Lupascu, H. Gretarsson, Z. Islam, Y. F. Hu, D. Casa, C. S. Nelson, S. C. LaMarra, G. Cao, and Y.-J. Kim, Phys. Rev. B 89, 054409 (2014).
- Cao et al. (2016) Y. Cao, Q. Wang, J. A. Waugh, T. J. Reber, H. Li, X. Zhou, S. Parham, S.-R. Park, N. C. Plumb, E. Rotenberg, A. Bostwick, J. D. Denlinger, T. Qi, M. A. Hermele, G. Cao, and D. S. Dessau, Nature Communications 7, 11367 EP (2016).
- Louat et al. (2018) A. Louat, F. Bert, L. Serrier-Garcia, F. Bertran, P. Le Fèvre, J. Rault, and V. Brouet, Phys. Rev. B 97, 161109 (2018).
- Lenz et al. (2019) B. Lenz, C. Martins, and S. Biermann, arXiv e-prints , arXiv:1903.09219 (2019), arXiv:1903.09219 [cond-mat.str-el] .
- (25) See supplementary information .
- Note (1) To distinguish dxz and dyz orbitals easier, we introduced a small orthorombicity in the structure (space group then becomes Fddd (70) with lattice constants =7.775 Å, =7.776 Å).
- Blaha et al. (1999) P. Blaha, K. Schwarz, G. Madsen, D. Kvasnicka, and J. Luitz, WIEN2K: An Augmented Plane Wave + Local Orbitals Program for Calculating Crystal Properties (Karlheinz Schwarz, Techniche Universitat, Wien, Austria) (1999).
- Martins et al. (2017) C. Martins, M. Aichhorn, and S. Biermann, Journal of Physics: Condensed Matter 29, 263001 (2017).
- Voit et al. (2000) J. Voit, L. Perfetti, F. Zwick, H. Berger, G. Margaritondo, G. Grüner, H. Höchst, and M. Grioni, Science 290, 501 (2000).
- Jin et al. (2009) H. Jin, H. Jeong, T. Ozaki, and J. Yu, Phys. Rev. B 80, 075112 (2009).
- Zwartsenberg et al. (2019) B. Zwartsenberg, R. P. Day, E. Razzoli, M. Michiardi, N. Xu, M. Shi, J. D. Denlinger, G. Cao, S. Calder, K. Ueda, J. Bertinshaw, H. Takagi, B. Kim, I. S. Elfimov, and A. Damascelli, arXiv e-prints , arXiv:1903.00484 (2019), arXiv:1903.00484 [cond-mat.str-el] .
- Liu et al. (2008) G. Q. Liu, V. N. Antonov, O. Jepsen, and O. K. Andersen., Physical Review Letters 101, 1 (2008).
- Zhou et al. (2017) S. Zhou, K. Jiang, H. Chen, and Z. Wang, Phys. Rev. X 7, 041018 (2017).
- Brouet et al. (2015) V. Brouet, J. Mansart, L. Perfetti, C. Piovera, I. Vobornik, P. Le Fèvre, F. Bertran, S. C. Riggs, M. C. Shapiro, P. Giraldo-Gallo, and I. R. Fisher, Physical Review B 92, 081117 (2015).
- Brouet et al. (2012) V. Brouet, A. Nicolaou, M. Zacchigna, A. Taleb-Ibrahimi, P. L. Fèvre, and F. Bertran, Journal of Electron Spectroscopy and Related Phenomena 185, 146 (2012).
- Zhang and Rice (1988) F. C. Zhang and T. M. Rice, Phys. Rev. B 37, 3759 (1988).
- Grioni et al. (2009) M. Grioni, S. Pons, and E. Frantzeskakis, Journal of Physics: Condensed Matter 21, 023201 (2009).
- Brouet et al. (2013) V. Brouet, J. Mauchain, E. Papalazarou, J. Faure, M. Marsi, P. H. Lin, A. Taleb-Ibrahimi, P. Le Fèvre, F. Bertran, L. Cario, E. Janod, B. Corraze, V. T. Phuoc, and L. Perfetti, Phys. Rev. B 87, 041106 (2013).
- Naamneh et al. (2018) M. Naamneh, M. Yao, J. Jandke, J. Ma, Z. Ristić, J. Teyssier, A. Stucky, D. van der Marel, D. J. Gawryluk, T. Shang, M. Medarde, E. Pomjakushina, S. Li, T. Berlijn, S. Johnston, M. Müller, J. Mesot, M. Shi, M. Radović, and N. C. Plumb, arXiv e-prints , arXiv:1808.06135 (2018), arXiv:1808.06135 [cond-mat.supr-con] .