Slicing the IO execution with ReLayTracer
Abstract
Analyzing IO performance anomalies is a crucial task in various computing environments, ranging from large-scale cloud applications to desktop applications. However, the IO stack of modern operating systems is complicated, making it hard to understand the performance anomalies with existing tools. Kernel IO executions are frequently interrupted by internal kernel activities, requiring a sophisticated IO profile tool to deal with the noises. Furthermore, complicated interactions of concurrent IO requests cause different sources of tail latencies in kernel IO stack. As a consequence, developers want to know fine-grained latency profile across IO layers, which may differ in each IO requests. To meet the requirements, this paper suggests ReLayTracer, a per-request, per-layer IO profiler. ReLayTracer enables detailed analysis to identify root causes of IO performance anomalies by providing per-layer latency distributions of each IO request, hardware performance behavior, and time spent by kernel activities such as an interrupt.
1 Introduction
Understanding IO performance problems is challenging. Performance of kernel IO stacks are affected by underlying hardware behaviors such as CPU cache locality [17, 15, 19]. The hardware behaviors add an unexpected delay to kernel IO executions, causing high performance variations and tail latency. Also, kernel IO executions are often interrupted by internal kernel activities such as interrupts and exceptions or scheduler preemptions, make it hard for developers to pinpoint the root cause of an unexpected performance anomaly.
What makes the cases harder is that developers require fine-grained profiling information from the complex kernel IO stack. Modern IO stack is built by a set of abstraction layers each of which has different performance characteristics. Developers want to profile the latency breakdown of each layer to identify performance bottlenecks. Furthermore, they would like to know latency distributions of each IO request to understand what request causes a tail latency and which layer causes the slowdown comparing to other requests.
In response to the requirement of kernel IO profiling, there are many research and practical tools to make an effort to provide useful information. They provide latency breakdown of entire kernel IO stack or block layer but do not give detailed latency distributions of individual requests [12, 16, 14, 18] and require massive kernel changes to collect trace data [12, 11, 13].
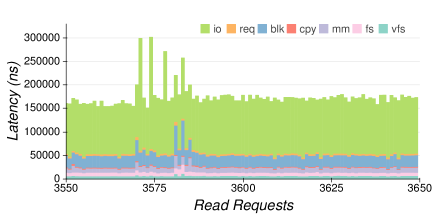
In this paper, we introduce a profiling tool for analyzing kernel IO performance in detail, called ReLayTracer (per-Request per-Layer tracer). ReLayTracer provides the latency distributions of each kernel request along with fine-grained information such as per-abstraction-layer latency breakdown. To that end, ReLayTracer maps each kernel request (e.g., system call) to request ID and tracks the request ID across the abstraction layers. By tagging each IO request with a request ID, which propagates across IO layers, ReLayTracer can report a latency breakdown of each layer of an individual IO request. Figure 1 shows the latency breakdown of IO layers profiled by ReLayTracer. Peaks show tail latency, and Figure 1 shows where the latency peaks happen among the seven layers. In Linux, a background kernel thread performs device IO asynchronously. ReLayTracer traces the off-CPU event made by an IO request using the request ID. To provide a precise latency breakdown, ReLayTracer analyzes an unexpected delay made by internal kernel activities and accounts them separately. Also, ReLayTracer monitors hardware performance behavior (e.g., IPC) along with a latency profile of each layer, supporting reasoning about tail latency.
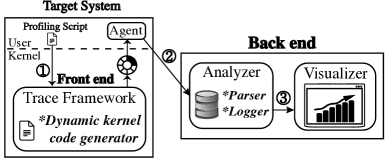
ReLayTracer adopts the split architecture consisting of a front end and a back end. The front end of ReLayTracer runs with the target system to profile, collecting data with minimal runtime overhead. The back end of ReLayTracer, working as separate processes, processes data collected by the front end and visualizes the processed data with graphs. The front end of ReLayTracer leverages the dynamic instrumentation framework [6, 1, 2, 8, 4], supported in the most of modern operating systems, to minimize profiling overheads (low overhead) by tracing only required execution points of interest. With the dynamic instrumentation, ReLayTracer can profile any kernel subsystems (versatility) and easily adapt kernel code changes (portability). ReLayTracer provides fine-grained performance profiling with 3 - 10% for random read, 0.1% for sequential read runtime overhead.
This paper makes the following contributions:
-
•
By tracing each IO request with a request ID, ReLayTracer can trace per-layer latency on the path of executing an individual IO request.
-
•
By monitoring internal kernel activities, ReLayTracer can separately account the interference caused the kernel activities.
-
•
By bundling software and hardware performance information, ReLayTracer can precisely analyze the Linux IO performance.
The current scope of the work focuses on the read path of IO. Adding support for other IO system calls is future work.
2 Design and Implementation
The goal of ReLayTracer is to provide precise and fine-grained latency information of kernel IO subsystems with minimal performance overhead. ReLayTracer starts tracing on each system call and generates trace data profiling timing of kernel IO layers. With the trace data, ReLayTracer computes fine-grained latency breakdown of each IO layer. To minimize runtime overhead of a target system, ReLayTracer leverages an existing lightweight instrumentation framework [5, 9, 10, 4, 7, 1, 6, 8, 2]. The number of trace points directly affects the runtime overhead of a target system. Kernel instrumentation frameworks have the flexibility to control the number of trace points, enabling ReLayTracer to manage the runtime overhead. The remainder of this section describes the design of ReLayTracer by giving a case study of the read system call.
2.1 Architecture
ReLayTracer comprises a front end and a back end system. Figure 2 shows the overall architecture of ReLayTracer. The front end is planted to a target system and collects tracing data, and the back end processes data obtained from the front end and visualizes them.

Leveraging instrumentation. Modern operating systems support kernel dynamic instrumentation [6, 1, 8, 2, 4]. A kernel dynamic instrumentation allows execution of user-defined code into in-memory kernel code at function boundaries (i.e., entering and exiting a function) or in any lines (called probe point). When a kernel execution hits an installed probe point, the instrumentation framework calls a procedure (called probe handler) registered by the framework. The front end takes advantage of existing kernel dynamic instrumentation frameworks to install arbitrary probe points into a running kernel [5, 9, 10, 4, 7, 8]. The front end takes a profile script to install probe points. In Figure 3, we show an example of the profile script. The profile script is written in a domain-specific language describing probe points of each kernel layer as a list of kernel functions, entry and exit actions defined as a probe handler, and hardware events [7] to monitor. The tracing framework compiles the profile script to a binary and inserts it into kernel memory using a kernel dynamic instrumentation framework.
2.2 Front end
The primary goal of the front end install probe points and probe handlers to collect timing information of each IO layer in each IO request. The front end installs probe points in execution paths of the system call, off-CPU events, and interrupt service routines.
Tracing system calls. Because the system call is the way of entering into the kernel space, we first focus on how we trace system calls to get the per-request latency distribution. An IO system call extends across multiple layers of kernel components. For example, in Linux, a read system call travels through VFS and page cache layer, file system layer, block IO layer, and device driver layer. Each layer has different performance characteristics such as memory copy bandwidth or slowdown by lock contentions. In addition to that, concurrent system calls make the analysis more complicated because it is hard to distinguish what system call is executing without having a complex function parameter analysis and matching thread id which causes non-negligible overhead in IO-intensive workloads.
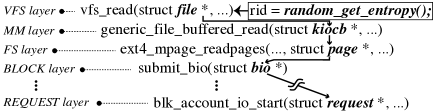
To provide lightweight and fine-grained tracing, ReLayTracer associates a request id (or rid) with an IO system call to trace. rid is a timestamp monotonically increasing and serves as a unique identifier of an IO system call. To track individual IO system calls across the layers, ReLayTracer propagates an assigned rid for each read system call to lower layers of the kernel as depicted in Figure 4. The value of rid is initially stored in struct file (VFS layer), transferred to struct kiocb (memory management layer) and the subsequent layers. To implement the rid propagation, we slightly modify kernel data structures to hold the rid and add code to maintain the rid value when a layer is switched. We use a kernel instrumentation framework to change 29 lines of code in the Linux kernel for tracing read IO (7 lines for rid in struct and 22 lines for rid propagation). This minimizes performance and space overhead when tracing a large volume of IO requests. ReLayTracer can work with any instrumentaion framework that supports on-the-fly modification of kernel code.
Tracing off-CPU events. In addition to system calls, ReLayTracer supports profiling off-CPU events. Some IO system calls execute their part of code paths on a different CPU, which makes it hard to distinguish the origin of an IO request. For example, read or write system calls make a block IO request to a kernel IO thread and wait until the kernel IO thread completes the IO request. The off-CPU execution path must be added to the total latency of the system calls. To associate a system call and off-CPU execution, ReLayTracer transfers the rid to off-CPU kernel functions. Generally, there is a shared data structure for the off-CPU handler (e.g., struct bio and struct request in Figure 4). ReLayTracer installs probe points on off-CPU kernel events to profile and delivers rid to an off-CPU probe point via a data structure used for a parameter.
Tracing kernel activities. Tracing only execution paths of system calls causes an inaccurate profile result because the kernel execution can be interrupted by various external events. For example, an interrupt handling during a read system call causes a delay in a layer. If probe points are installed at function boundaries of a system call execution path, the delay would not be accounted. To sort out the delay made by the kernel activities, ReLayTracer also installs probe points on interrupt handling routines, schedule in and out handlers, and the wakeup points of background kernel threads, recording occurences of the event and its timing information.
ReLayTracer installs a probe handler, described in Figure 3, on each probe point. A probe point can be either an entry and an exit of a function or both based on profile description in Figure 3. A probe handler creates a trace log consisting of <function name, process id, cpu id, rid, timestamp, hardware events> and records the log to a ring buffer. The ring buffer is a protected, shared memory between kernel and user-level applications. The ring buffer size is 4MB (1024 * 4KB page) by default. A ReLayTracer’s user-level agent in a target system periodically sends trace logs to the back end via the network to avoid buffer overruns.
2.3 Back end
The goal of the back end is to compute per-layer latency breakdowns from raw log records traced by the front end. The back end aggregates the log records with a request id and then invokes an analyzer for each request id. Along with a profile description, the analyzer takes a layer description, which specifies layer types and how to separate layers with given function names. With the layer description, the analyzer computes per-layer latency of each system call request which has the same rid in the log records. If a traced function, , calls a function, , belonging to a lower layer, the analyzer subtracts the time taken by when computing latency of . The analyzer checks whether an off-CPU event happens in the middle of execution of a traced function. If an event happens, the analyzer separately accounts the latency caused by the off-CPU event when computing latency of a traced function. In case that a hardware event (e.g., CPI) is recorded in a traced function, the analyzer correlates the hardware event with the traced function and records the hardware event data with a computed latency. Finally, the analyzer stores the processed data to an intermediate format, and the visualizer draws a figure, which can be rendered in web browsers.
3 Evaluation
In this section, we explore possible application scenarios of ReLayTracer to understand kernel behaviors at fine-grained level. Our prototype leverages the ebpf framework supported by standard Linux to make use of the tracing facility [1]. The target system consists of the Intel Xeon CPU E5-2695 v4 CPU, 128GB DDR4 memory, and 256GB SATA SSD. We use a Ubuntu 16.04 machine with modified kernel version 4.15 and the ext4 filesystem. We run various workloads of synchronous read I/O operations generated by FIO benchmark [3] on the target system to observe the effectiveness of ReLayTracer in terms of the per-request and per-layer profiling facility. First, we examine single-threaded sequential and random read access patterns, then we move on to the multi-threaded benchmark study.
3.1 Read System Calls and Page Cache
In general, when the Linux operating system receives a read request from a user, it first looks up in the main memory cache, called page cache, to check if the requested data is already in memory. Based on this mechanism, we categorize the read system requests into two classes - page cache hit and page cache miss. In cases of page cache hits, the read requests are rapidly served without traversing through multiple kernel layers. On the other hand, read system calls that experience page cache misses are more time-consuming because they go down to lower kernel layers to access the storage medium and bring the requested page into the memory.
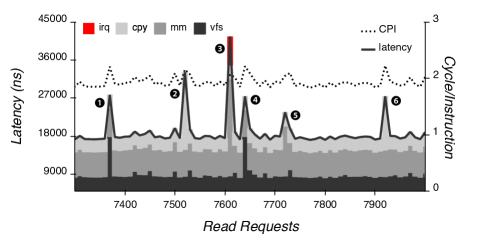
Tail latency within page cache hits. We expect that the latency variation among read requests would not be significant if the requested data reside in the page cache. Interestingly, however, ReLayTracer reports that latency still varies widely within page cache hit cases. Figure 5 shows per-request read system call latency (for page cache hits) when a file is read sequentially by a single thread. The x-axis represents individual requests in chronological order. For most requests, the latency is measured around 18000ns, but we observe that there are several noticeable spikes that rise above 25000ns. To identify the cause of tail latencies, we additionally analyze the CPI (cycles per instruction) provided by ReLayTracer front end for each request, which is depicted by the dotted line in the same figure. As the latency fluctuates, the CPI follows the same trend. Using the per-layer facility of ReLayTracer, we dissect the latency into four layers - virtual file system (vfs), memory management (mm), page copy (cpy), and interrupt request handle (irq). The data visualization output by our tracer shows that the fluctuation does not occur in a particular layer, but, instead, different components are responsible for slowdown in each request. vfs layer turns out to be the causative factor of tail ➊ and ➍. Similarly, cpy layer was the bottleneck in tail ➋ and ➏. The layer breakdown utility shows us that tail ➌ additionally contains irq layer. In fact, the high latency in this particular request was due to a hardware interrupt for IO completion which occurred at mm layer. irq not only adds an extra layer in the request but also introduces huge context switch overhead in the interrupted layer. ReLayTracer allows in-depth analysis to locate unusual latency spikes even within page cache hits and further diagnose the root cause of each at hardware and software levels.
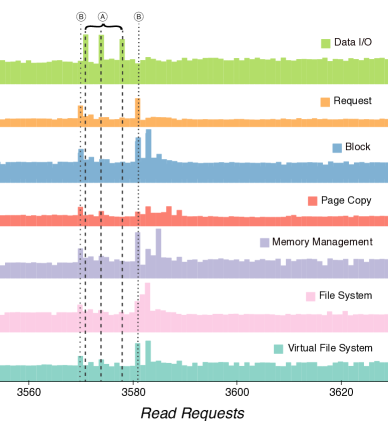
Tail latency within page cache misses. We also examine a scenario where the read system calls do not benefit from the page cache due to the random access pattern. Figure 6 shows per-layer breakdown of request latency for single-threaded random reads on a file. When read requests are made for random positions in a file, most requests experience page cache misses and suffer much higher latency because they penetrate through deeper layers down to storage to bring data into memory. A large portion of the time is spent in performing disk I/O, as depicted by the thick green layer (io) in Figure 1. Figure 6 corresponds to the layer decomposition of requests in the spiking region (requests 3560 - 3600) of Figure 1. By breaking each request down to units of a kernel layer, it is possible to observe that each burst is caused by different layers even within a small interval of 40 requests. The largest three spikes (\raisebox{-0.8pt}{A}⃝) are due to delay in the Disk I/O layer, but the smaller spikes that appear immediately before and after (\raisebox{-0.8pt}{B}⃝) are caused by equally proportional slowdown in all other six layers. Since the random read requests do not have access locality, we anticipate that there is no significant latency difference among them. However, ReLayTracer informs us that multiple tail latencies can occur in a batched manner within a small time interval and that different layers contribute to each tail.
3.2 Profiling Multi-threaded Behaviors
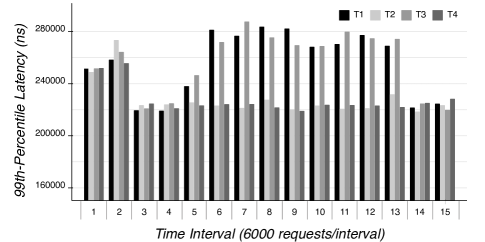
In this subsection, we examine the fairness of issuing random read operations by multiple threads. As each thread makes its read request, the requests end up mixed across the underlying kernel layers. With its ability to measure the latency on a per-request basis, however, ReLayTracer is able to retrieve the owner thread of each request. Figure 7 shows 99th percentile latency of each thread over time with 6,000 requests as a group of the time interval (window), with each bar representing individual threads. From window 5 to 13, we observe that T1 and T3 experience much longer tail latency. In fact, we identify that the burden of IRQ handling was unfairly distributed throughout threads. Certain threads served much more IRQ requests than the others and had to spend up to 60x more time on IRQ handling as shown in Table 1.
| Thread | # of IRQ handled | Time spent on IRQ (ns) |
|---|---|---|
| T1 | 7,276 | 47,849,914 |
| T2 | 128 | 816,828 |
| T3 | 2,953 | 19,398,496 |
| T4 | 121 | 787,582 |
3.3 Overhead
We end the section by evaluating the performance overhead of ReLayTracer. First, we measure the read throughput (bandwidth) for sequential read access patterns with 8 threads. In this case, threads do not experience any throughput degradation when running with ReLayTracer. Since most of the read operations are served by the page cache, the depth of IO path for most requests is small. As a result, the overhead introduced by the additional CPU cycles from the tracer is negligible.
Next, we measure the overhead of ReLayTracer for random read accesses by 8 threads. Table 2 shows the throughput overhead with increasing depth of probe layers. As the probe depth increases, the number of probe points also increases. For random accesses, the page cache does not help, so all possible tracing points across the 8 layers will be reached frequently, resulting in non-negligible overhead. At minimum depth (L1), the bandwidth degradation is only 3%, but it can increase up to 10.7% with maximum depth (L8). This result depicts the tradeoff between the profiling depth and the overhead. In response to this, ReLayTracer provides a control knob to users to adjust the profiling granularity.
| Probe depth | L1 | L2 | L3 | L4 | L5 | L6 | L7 | L8 |
| Overhead(%) | 3 | 3.3 | 6 | 6.1 | 8.3 | 8.4 | 9.5 | 10.7 |
| # Probe points | 2 | 6 | 8 | 9 | 12 | 13 | 14 | 15 |
4 Conclusion
To identify the root causes of performance anomalies of kernel IO, ReLayTracer provides fine-grained performance profiling of kernel IO stacks. ReLayTracer tags each IO request with request ID and traces the request ID through IO layers, measuring precise latency of each IO layer the IO request travels. ReLayTracer leverages existing kernel instrumentation framework to dynamically install trace points and collects latency information within 3 - 10% overhead.
References
- [1] Bpf: the universal in-kernel virtual machine. https://lwn.net/Articles/599755/.
- [2] dtrace. http://dtrace.org/blogs/.
- [3] fio: Flexible i/o tester rev. 3.13. https://fio.readthedocs.io/en/latest/fio_doc.html.
- [4] ftrace: A look at ftrace. https://lwn.net/Articles/322666/.
- [5] Kernel probes. https://www.kernel.org/doc/Documentation/kprobes.txt.
- [6] LTTng: an open source tracing framework for linux. https://lttng.org/.
- [7] perf: Linux profiling with performance counters. https://perf.wiki.kernel.org/index.php/Main_Page.
- [8] Systemtap. https://sourceware.org/systemtap/documentation.html.
- [9] Uprobe-tracer: Uprobe-based event tracing. https://www.kernel.org/doc/Documentation/trace/uprobetracer.txt.
- [10] Using the linux kernel tracepoints. https://www.kernel.org/doc/Documentation/trace/tracepoints.txt.
- [11] F. Doray and M. Dagenais. Diagnosing performance variations by comparing multi-level execution traces. IEEE Transactions on Parallel and Distributed Systems, Feb 2017.
- [12] Nikolai Joukov, Avishay Traeger, Rakesh Iyer, Charles P. Wright, and Erez Zadok. Operating system profiling via latency analysis. In Proceedings of the 7th Symposium on Operating Systems Design and Implementation, OSDI ’06, 2006.
- [13] Yaoping Ruan and Vivek S. Pai. Making the "box" transparent: System call performance as a first-class result. In Proceedings of the General Track: 2004 USENIX Annual Technical Conference, June 27 - July 2, 2004, Boston Marriott Copley Place, Boston, MA, USA, pages 1–14, 2004.
- [14] Woong Shin, Qichen Chen, Myoungwon Oh, Hyeonsang Eom, and Heon Y. Yeom. Os i/o path optimizations for flash solid-state drives. In Proceedings of the 2014 USENIX Conference on USENIX Annual Technical Conference, USENIX ATC’14, pages 483–488, Berkeley, CA, USA, 2014. USENIX Association.
- [15] Livio Soares and Michael Stumm. Flexsc: Flexible system call scheduling with exception-less system calls. In Remzi H. Arpaci-Dusseau and Brad Chen, editors, OSDI, pages 33–46. USENIX Association, 2010.
- [16] Avishay Traeger, Ivan Deras, and Erez Zadok. Darc: Dynamic analysis of root causes of latency distributions. In Proceedings of the 2008 ACM SIGMETRICS International Conference on Measurement and Modeling of Computer Systems, SIGMETRICS ’08, 2008.
- [17] Zev Weiss, Andrea C. Arpaci-Dusseau, and Remzi H. Arpaci-Dusseau. Densefs: A cache-compact filesystem. In Proceedings of the 10th USENIX Conference on Hot Topics in Storage and File Systems, HotStorage’18, Berkeley, CA, USA, 2018. USENIX Association.
- [18] Qiumin Xu, Huzefa Siyamwala, Mrinmoy Ghosh, Tameesh Suri, Manu Awasthi, Zvika Guz, Anahita Shayesteh, and Vijay Balakrishnan. Performance analysis of nvme ssds and their implication on real world databases. In Proceedings of the 8th ACM International Systems and Storage Conference, SYSTOR ’15, New York, NY, USA, 2015. ACM.
- [19] Jisoo Yang, Dave B. Minturn, and Frank Hady. When poll is better than interrupt. In Proceedings of the 10th USENIX Conference on File and Storage Technologies, FAST’12, Berkeley, CA, USA, 2012. USENIX Association.